8
SUPPLEMENTING COMMERCIAL HVAC SYSTEMS WITH HVLS FANS
SUPPLEMENTING COMMERCIAL HVAC SYSTEMS WITH HVLS FANS
Copyright MacroAir 2013 macroairfans.com 866.668.3247 1
Improving Energy Efficiency and Lowering Energy Costs with HVLS Fans As the cost of energy continues to rise, building designers and engineers are constantly looking for ways to lower their facility’s energy usage. Additionally, building industries are under pressure to improve the energy efficiency of building systems from federal, state and local regulations. MacroAir – the originator of the large size high volume low speed (HVLS) commercial ceiling fans – has developed a series of energy efficient HVLS fans to meet this need. The benefits of a traditional HVAC system supplemented with a HVLS fan include:
• Improved energy efficiency • Lowered HVAC costs • Improved indoor air quality • Reduced component size (i.e. smaller air conditioning units) • The ability to meet ASHRAE, ENERGYSTAR and LEED guidelines • Lowered carbon footprint in the manufacturing process and in the daily usage of the
facility Situation Regardless of what part of the world a facility is located, large-sized warehouses and manufacturing plants often have cooling problems. In the summer months, indoor temperatures can rise to uncomfortable levels. Many building managers rely on air conditioning systems to cool the air. The combination of outdoor heat, poor air circulation and heat generated within the facility can easily overcome the cooling capability of air conditioning systems. Cooling load is the amount of conditioned air that is required to comfortably cool a given space. In this paper we will outline a method used to calculate cooling load. We will also give an example where the cooling load is calculated for a large facility and how it can be reduced using HVLS fans. Finally, we will determine the amount of energy consumed by that facility for an average year with and without HVLS fans. Calculating Cooling Load for a Large Facility1 One of the best ways to determine the required cooling load is to use the Radiant Time Series (RTS) method. This is derived from the heat balance method. The RTS method divides a day into 1 hour increments and carefully considers how the heat sources affect the hourly heat gain inside the structure. The heat sources include external (primarily the sun) and internal sources, such as lights, equipment and people. The structure’s location (latitude and longitude), outdoor and indoor design temperatures, ground reflectance, as well as the material of each surface (walls, roof, and floor), surface area, orientation, tilt,
1 2012 ASHRAE Handbook – Fundamentals (I P Edition), American Society of Heating, Refrigeration and Air-Conditioning Engineers, Inc., 2012.
Copyright MacroAir 2013 macroairfans.com 866.668.3247 2
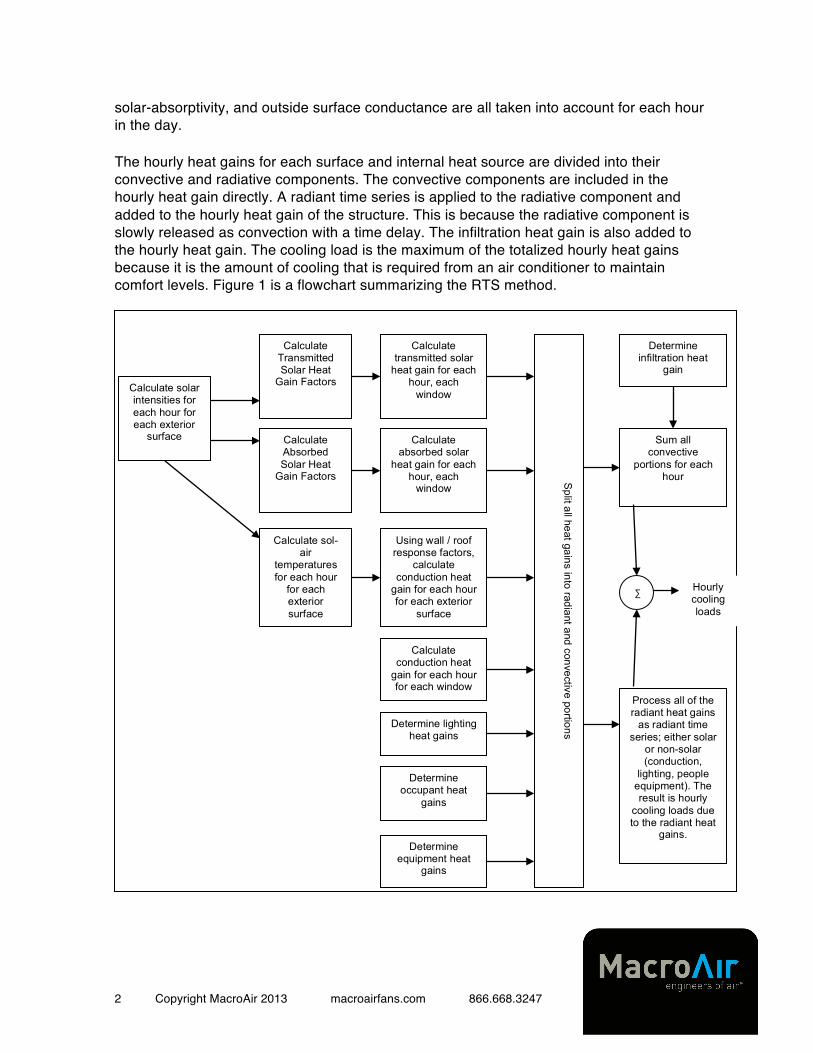
solar-absorptivity, and outside surface conductance are all taken into account for each hour in the day. The hourly heat gains for each surface and internal heat source are divided into their convective and radiative components. The convective components are included in the hourly heat gain directly. A radiant time series is applied to the radiative component and added to the hourly heat gain of the structure. This is because the radiative component is slowly released as convection with a time delay. The infiltration heat gain is also added to the hourly heat gain. The cooling load is the maximum of the totalized hourly heat gains because it is the amount of cooling that is required from an air conditioner to maintain comfort levels. Figure 1 is a flowchart summarizing the RTS method.
Calculate solar intensities for each hour for each exterior
surface
Calculate Transmitted Solar Heat
Gain Factors
Calculate Absorbed Solar Heat
Gain Factors
Calculate sol-air
temperatures for each hour
for each exterior surface
Calculate transmitted solar
heat gain for each hour, each
window
Calculate absorbed solar
heat gain for each hour, each
window
Using wall / roof response factors,
calculate conduction heat
gain for each hour for each exterior
surface
Calculate conduction heat
gain for each hour for each window
Determine lighting heat gains
Determine occupant heat
gains
Determine equipment heat
gains
Split all heat gains into radiant and convective portions
Determine infiltration heat
gain
Sum all convective
portions for each hour
Process all of the radiant heat gains
as radiant time series; either solar
or non-solar (conduction,
lighting, people equipment). The result is hourly
cooling loads due to the radiant heat
gains.
∑ Hourly cooling loads
Copyright MacroAir 2013 macroairfans.com 866.668.3247 3
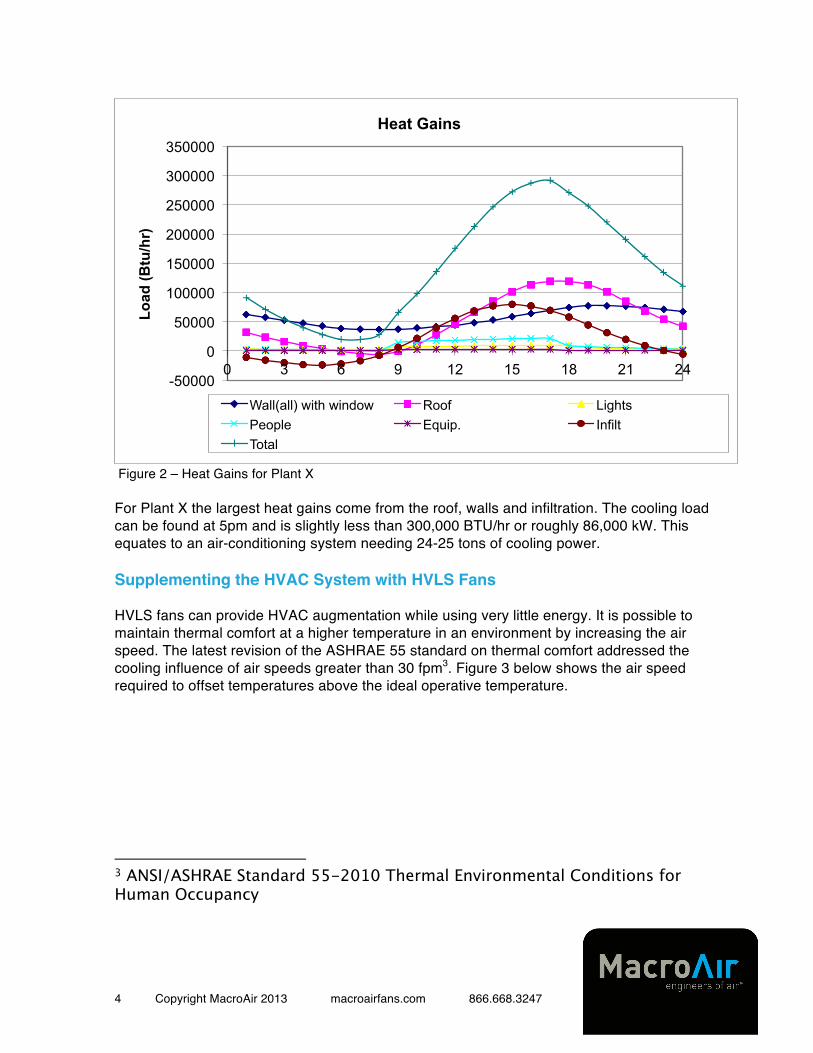
Figure 1 – Overview of the radiant time series method. The specific equations, techniques and tables used in the RTS method can be found in Chapter 18 of the ASHRAE Handbook titled Fundamentals. The equations are intended to be simpler than more exhaustive methods like the heat balanced method. However, working the equations out by hand would be too cumbersome. This method lends itself well to a spreadsheet or simple computer program. Oklahoma State University has developed a free spreadsheet that will perform these calculations2. Plant X Example Using the Oklahoma State University spreadsheet we calculated the heat gains for various factors and the cooling load required for a generic building we will call Plant X. The building is a simple rectangular building with a flat roof with dimensions of 220 feet long by 200 feet wide by 30 feet high. Thus Plant X has 44,000 square feet of floor area and 1,320,000 cubic feet of open space. The chosen location was near the MacroAir facility in Southern California. The outdoor design temperature is 105°F and the indoor design temperature is 72°F. The day with the longest sunlight was chosen as the day for the calculation (June 21). Typical wall, window and roof thermal characteristics where chosen. Internal heat gains were also calculated for Plant X with typical lighting, occupancy and equipment, each scheduled for a standard working day. Figure 2 below shows the heat gains calculated using the RTS method for the various components.
2 http://www.hvac.okstate.edu/Software/RTS_example_Montreal_ASHRAE_Chapter_6Oct2003.xls
Copyright MacroAir 2013 macroairfans.com 866.668.3247 4
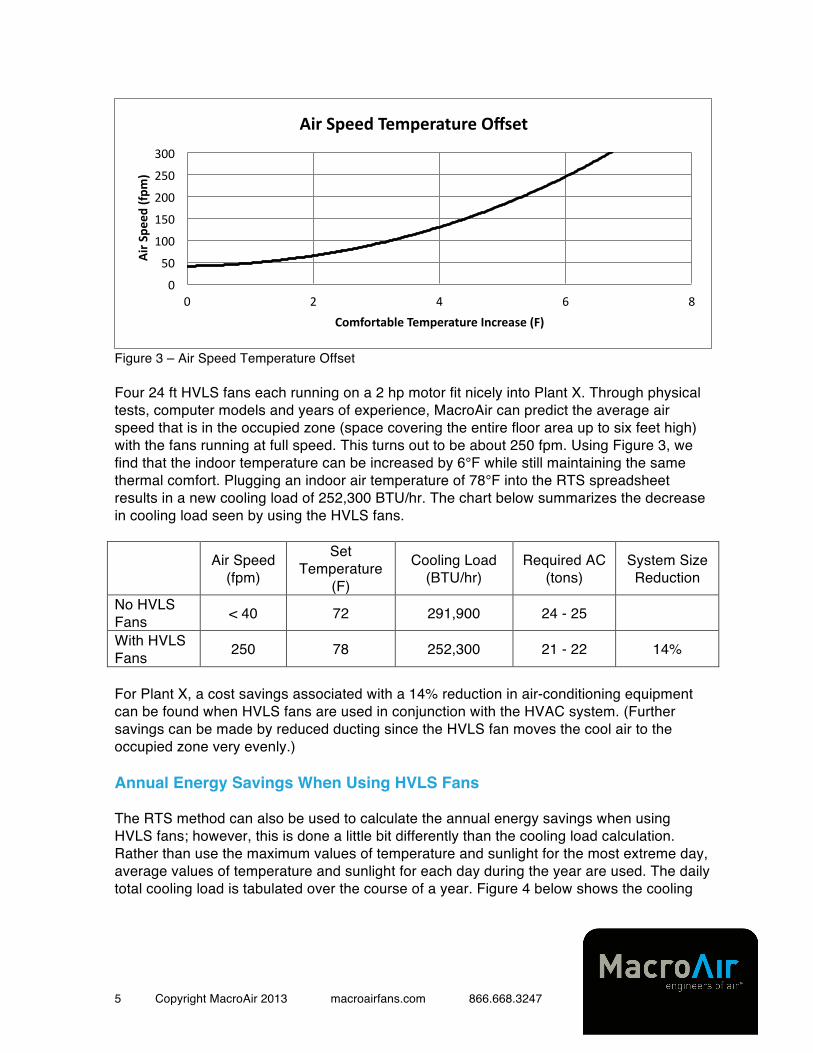
Figure 2 – Heat Gains for Plant X For Plant X the largest heat gains come from the roof, walls and infiltration. The cooling load can be found at 5pm and is slightly less than 300,000 BTU/hr or roughly 86,000 kW. This equates to an air-conditioning system needing 24-25 tons of cooling power. Supplementing the HVAC System with HVLS Fans HVLS fans can provide HVAC augmentation while using very little energy. It is possible to maintain thermal comfort at a higher temperature in an environment by increasing the air speed. The latest revision of the ASHRAE 55 standard on thermal comfort addressed the cooling influence of air speeds greater than 30 fpm3. Figure 3 below shows the air speed required to offset temperatures above the ideal operative temperature.
3 ANSI/ASHRAE Standard 55-2010 Thermal Environmental Conditions for Human Occupancy
-50000
0
50000
100000
150000
200000
250000
300000
350000
0 3 6 9 12 15 18 21 24
Load
(Btu
/hr)
Hour
Heat Gains
Wall(all) with window Roof Lights People Equip. Infilt Total
Copyright MacroAir 2013 macroairfans.com 866.668.3247 5
Figure 3 – Air Speed Temperature Offset Four 24 ft HVLS fans each running on a 2 hp motor fit nicely into Plant X. Through physical tests, computer models and years of experience, MacroAir can predict the average air speed that is in the occupied zone (space covering the entire floor area up to six feet high) with the fans running at full speed. This turns out to be about 250 fpm. Using Figure 3, we find that the indoor temperature can be increased by 6°F while still maintaining the same thermal comfort. Plugging an indoor air temperature of 78°F into the RTS spreadsheet results in a new cooling load of 252,300 BTU/hr. The chart below summarizes the decrease in cooling load seen by using the HVLS fans. Air Speed
(fpm)
Set Temperature
(F)
Cooling Load (BTU/hr)
Required AC (tons)
System Size Reduction
No HVLS Fans < 40 72 291,900 24 - 25 With HVLS Fans 250 78 252,300 21 - 22 14%
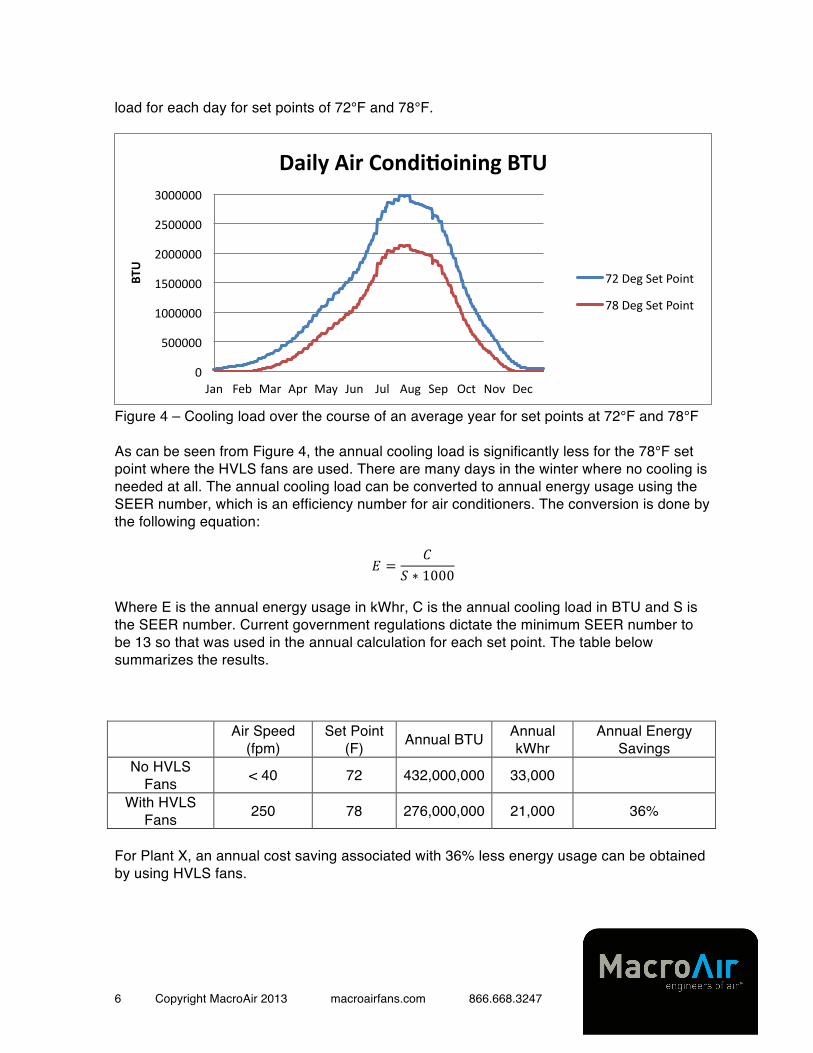
For Plant X, a cost savings associated with a 14% reduction in air-conditioning equipment can be found when HVLS fans are used in conjunction with the HVAC system. (Further savings can be made by reduced ducting since the HVLS fan moves the cool air to the occupied zone very evenly.) Annual Energy Savings When Using HVLS Fans The RTS method can also be used to calculate the annual energy savings when using HVLS fans; however, this is done a little bit differently than the cooling load calculation. Rather than use the maximum values of temperature and sunlight for the most extreme day, average values of temperature and sunlight for each day during the year are used. The daily total cooling load is tabulated over the course of a year. Figure 4 below shows the cooling
0
50
100
150
200
250
300
0 2 4 6 8
Air Spe
ed (fpm
)
Comfortable Temperature Increase (F)
Air Speed Temperature Offset
Copyright MacroAir 2013 macroairfans.com 866.668.3247 6
load for each day for set points of 72°F and 78°F.
Figure 4 – Cooling load over the course of an average year for set points at 72°F and 78°F As can be seen from Figure 4, the annual cooling load is significantly less for the 78°F set point where the HVLS fans are used. There are many days in the winter where no cooling is needed at all. The annual cooling load can be converted to annual energy usage using the SEER number, which is an efficiency number for air conditioners. The conversion is done by the following equation:
𝐸 =𝐶
𝑆 ∗ 1000
Where E is the annual energy usage in kWhr, C is the annual cooling load in BTU and S is the SEER number. Current government regulations dictate the minimum SEER number to be 13 so that was used in the annual calculation for each set point. The table below summarizes the results.
Air Speed
(fpm) Set Point
(F) Annual BTU Annual kWhr
Annual Energy Savings
No HVLS Fans < 40 72 432,000,000 33,000
With HVLS Fans 250 78 276,000,000 21,000 36%
For Plant X, an annual cost saving associated with 36% less energy usage can be obtained by using HVLS fans.
0
500000
1000000
1500000
2000000
2500000
3000000
Jan Feb Mar Apr May Jun Jul Aug Sep Oct Nov Dec
BTU
Daily Air Condi@oining BTU
72 Deg Set Point
78 Deg Set Point

Copyright MacroAir 2013 macroairfans.com 866.668.3247 7
Conclusions Using HVLS fans in conjunction with an HVAC system can greatly reduce its initial cost and operating costs. In our Plant X example, we found a savings associated with a 14% reduction in system size and a 36% reduction in annual energy usage. Additional savings could also be found by reducing the total ducting of the system. HVLS fans’ low energy use, low maintenance, and ability to meet the ASHRAE, ENERGYSTAR and LEED guidelines, make them a perfect energy alterative to help lower a facility’s HVAC costs. About MacroAir Since developing the first HVLS prototype in 1998, MacroAir continues to serve as an HVLS industry leader through its commitment to innovation and design of the most durable and cost-effective commercial ceiling fans on the market. As the “engineers of air™,” MacroAir produces energy-efficient, long-lasting HVLS fans that can be found in warehouses, manufacturing plants, airplane hangars, agricultural arenas and retail establishments across the U.S. and around the world, and are used by companies such as Coca-Cola, CSX Transportation and NAPA Auto Parts. The company is the exclusive HVLS fan supplier for independent auto dealerships of BMW, Chrysler, Ford, General Motors, Lexus, Mercedes-Benz, Nissan and Toyota under their Dealer Equipment Programs. Mailing Address 794 South Allen Street San Bernardino, CA 92408 Follow Us macroairfans.com Twitter: @MacroAirFans Facebook: facebook.com/MacroAir


