Supply-Demand Forecast For Gas Utilities 2011-2020 Report to the West Virginia Legislature West Virginia Code §24-1-1(d)(3) 201 Brooks Street Charleston, WV 25323 1-800-344-5113 General 1800-642-8544 Complaints www.psc.state.wv.us Michael A. Albert, Chairman Jon W. McKinney, Commissioner Ryan B. Palmer, Commissioner
Transcript
Supply-Demand Forecast For Gas Utilities
2011-2020
Report to the West Virginia Legislature West Virginia Code §24-1-1(d)(3)
201 Brooks Street Charleston, WV 25323
1-800-344-5113 General 1800-642-8544 Complaints
www.psc.state.wv.us
Michael A. Albert, Chairman Jon W. McKinney, Commissioner Ryan B. Palmer, Commissioner
Supply – Demand Forecast for Gas Utilities 2011 – 2020
Mountaineer Gas Company ....................................................................... 6 Dominion Hope ......................................................................................... 7 Equitable Gas ............................................................................................ 7
Company Use and Unaccounted for Gas ............................................................. 7
Total West Virginia Demand ............................................................................... 8
Colorado School of Mines, Potential Gas Committee Report ............................. 18
Overview
This Report is in response to a legislative mandate and is part of a comprehensive Management Summary Report submitted annually to the West Virginia Legislature. The sixty-fourth West Virginia Legislature (1979) stated in West Virginia Code Section 24-1-1(d)(3) that the Public Service Commission of West Virginia (Commission) will, as part of an annual Management Summary Report, describe in a concise manner “The current balance of supply and demand for natural gas and electric utility services in the state and forecast of the probable balance for the next ten years.” Prior to 1979 and for several years thereafter the wholesale price of natural gas was regulated and capped. There was some concern that suppliers of natural gas were reluctant to produce and market their supplies and that exploration for new supplies was somewhat curtailed due to what some believed to be artificially low and unprofitable wholesale prices. Language following the above-quoted Code section indicates that the legislature was concerned about these factors and was interested in learning more about the natural gas production industry in West Virginia and its role in the natural gas utility industry. Prior to the passage of the Federal Natural Gas Policy Act of 1978 (NGPA), the natural gas market was influenced by artificial production shortages resulting from Federal price controls. The NGPA addressed the situation by devising a schedule of price decontrol over time, reducing barriers between interstate and intrastate markets, and providing incentives for gas exploration and development. Today, wholesale natural gas prices are market driven and are subject to various market forces much like the prices of any other publicly-traded commodity. This has resulted in recent years in high volatility in prices accompanied by large swings in both supply and demand. The focus of this Report tends to be toward the physical availability of supplies of natural gas and the outlook for the future, specifically the next ten years. The belief is, based on recent developments of “unconventional” natural gas reserves in the Appalachian Basin and elsewhere around the United States, that there is more than ample supply for the coming decade and beyond. Attachments to this Report provide several resources that support this belief. Further, West Virginia is a major gas producing state and exports far more gas than it consumes. The demand portion of the Report relies mainly on information and forecasts provided by the three largest gas utilities in the State. The throughput of those utilities, including sales and transported gas, accounts for the vast majority of the total throughput of all the gas utilities in the State and the forecasts are believed to represent general overall trends.
____________________________________________________________________________________ Public Service Commission - Supply Demand Forecast for Gas Utilities 2011 - 2020 ‾‾‾‾‾‾‾‾‾‾‾‾‾‾‾‾‾‾‾‾‾‾‾‾‾‾‾‾‾‾‾‾‾‾‾‾‾‾‾‾‾‾‾‾‾‾‾‾‾‾‾‾‾‾‾‾‾‾‾‾‾‾‾‾‾‾‾‾‾‾‾‾‾‾‾‾‾‾‾‾‾‾‾‾‾‾‾‾‾‾‾‾‾‾‾‾‾‾‾‾‾‾‾‾‾‾‾‾‾‾‾‾‾‾‾‾‾‾‾‾‾‾‾‾‾‾
The following is a summary of the average annual growth rates of total company natural gas demand for the period 2011-2020 derived from the forecasts of the three major utilities: Company Projected Average Company Annual Throughput Growth Rate Mountaineer Gas Company -0.5 % Hope Gas, Inc.,dba Dominion Hope -1.2 % Equitable Gas Company 0.0 % West Virginia Total Average -0.57 % (Rounded) While Equitable projects a slightly higher annual growth rate than reflected in last year’s report, the other companies project lower growth rates, thus reflecting a reduction in the overall total demand projection as compared to last year’s report. A significant determinant of the level of natural gas demand is winter weather, and the companies assume “normal” or long-term historical winter weather patterns. Information indicates that the 2009-2010 winter temperatures were approximately 1.7% colder than the previous 2008-2009 heating season and were approximately 6.4% warmer than normal based on 30-year averages on a statewide basis. Potential and inevitable weather changes should be taken into account when reviewing the forecasts. The gas utilities reviewed for this report were the three major companies that serve West Virginia: Mountaineer Gas Company, Hope Gas, Inc., dba Dominion Hope (“Dominion Hope”) and Equitable Gas Company. Although there were nineteen active gas utilities within the State, these three major utilities made approximately 90% of the total volume of residential, commercial and industrial gas deliveries in the State last year. Therefore, an examination of these utilities will provide an overview of the gas market that is sufficiently complete to draw meaningful inferences while not clouded by voluminous and unnecessary detail. As a result of the sharp increase in prices between 1978 and 1983 as regulated prices changed to competitive prices, and the implementation of demand-side management programs, consumers in all classes reacted by reducing their consumption of natural gas. In addition, reductions occurred as a result of increased efforts in weatherization of structures, improved appliance and equipment efficiencies, conscious voluntary usage reductions and
____________________________________________________________________________________ Public Service Commission - Supply Demand Forecast for Gas Utilities 2011 - 2020 ‾‾‾‾‾‾‾‾‾‾‾‾‾‾‾‾‾‾‾‾‾‾‾‾‾‾‾‾‾‾‾‾‾‾‾‾‾‾‾‾‾‾‾‾‾‾‾‾‾‾‾‾‾‾‾‾‾‾‾‾‾‾‾‾‾‾‾‾‾‾‾‾‾‾‾‾‾‾‾‾‾‾‾‾‾‾‾‾‾‾‾‾‾‾‾‾‾‾‾‾‾‾‾‾‾‾‾‾‾‾‾‾‾‾‾‾‾‾‾‾‾‾‾‾‾‾
switches to alternate sources of energy. These changes, brought about by higher prices, will continue to have some influence on present and future natural gas demand, even if prices level off or decrease. Natural gas prices have increased dramatically over the past five years and are extremely volatile. Although current prices are down sharply, market prices were at all-time record highs as recently as June 2008. This, of course, causes confusion among the consuming public as it sees low market prices while utilities are charging record high rates and utility rates that are slow to respond to falling prices. This situation has caused and will continue to cause downward pressure on demand for the foreseeable future. Both the natural gas industry and regulatory agencies such as the Federal Energy Regulatory Commission (FERC) and state commissions, including the Commission, have continued to develop and implement policies that allow and encourage the operation of competitive forces. Past developments included authorizing flexible rates, special marketing programs, negotiated transportation rates, the use of the spot market, and the futures market, hedging, derivatives and other financial tools. Demand Analysis The demand projection in this report has been developed independent of supply considerations, i.e., the extent of the demand for utility natural gas supplies and delivery in West Virginia has been calculated assuming no supply limitations. This notion is in accord with the State’s current and medium to long-term adequate supply position. These demand projections include utility direct sales to ultimate customers in the residential, commercial and industrial classes, wholesale sales for resale, and transportation-only volumes, with the totals described as “throughput”. Unlike the major electric utilities that operate in West Virginia, the gas utility companies do not use highly-sophisticated modeling techniques for forecasting. The reasons for this lack of modeling sophistication are inherent in the nature of the product: natural gas is used primarily for space heating, water heating, cooking and specific commercial and industrial processes. Unlike electrical energy, gas can be stored and withdrawn from storage to satisfy an unexpected and/or peak market demand. Additionally, since the gas transmission and distribution system is essentially in place, plant construction is not a major concern of gas distribution companies. These companies are more concerned with commodity availability and prices. The ten-year forecasts presented in this report are based upon similar models and databases used in the January 2010 report. Based on reports filed with the Commission by the utility companies, the levels of residential, commercial and industrial sales were identified. Of course, the raw 1981-2009 sales and transportation data reflect the effect of
____________________________________________________________________________________ Public Service Commission - Supply Demand Forecast for Gas Utilities 2011 - 2020 ‾‾‾‾‾‾‾‾‾‾‾‾‾‾‾‾‾‾‾‾‾‾‾‾‾‾‾‾‾‾‾‾‾‾‾‾‾‾‾‾‾‾‾‾‾‾‾‾‾‾‾‾‾‾‾‾‾‾‾‾‾‾‾‾‾‾‾‾‾‾‾‾‾‾‾‾‾‾‾‾‾‾‾‾‾‾‾‾‾‾‾‾‾‾‾‾‾‾‾‾‾‾‾‾‾‾‾‾‾‾‾‾‾‾‾‾‾‾‾‾‾‾‾‾‾‾
weather conditions experienced during that period, the effect of curtailments because of supply deficiencies, if any, and the effect of moratoria on adding new customers. Residential and commercial uses of gas are generally less discretionary than the industrial load because the stock of gas-using appliances. The space heating units, water heaters, and cooking units are fixed in the short-term. Therefore, in any given year, a residential and commercial user's gas consumption is frequently primarily a function of the severity of the weather1. With that in mind, the companies often rely heavily on some variant of a weather adjusted trend line technique to forecast residential and commercial sales. There is more confidence associated with predictions in the near future, and ten year projections must be viewed with caution regarding demand. Residential and Commercial Demand As indicated above, the analysis of residential and commercial demand is based upon data obtained from records of three major West Virginia gas utilities. These three companies represent about 90% of the total utility residential throughput as well as 90% of total utility natural gas throughput in the State. These utilities are, in descending order of throughput volumes: Mountaineer Gas Company Hope Gas, Inc., dba Dominion Hope Equitable Gas Company
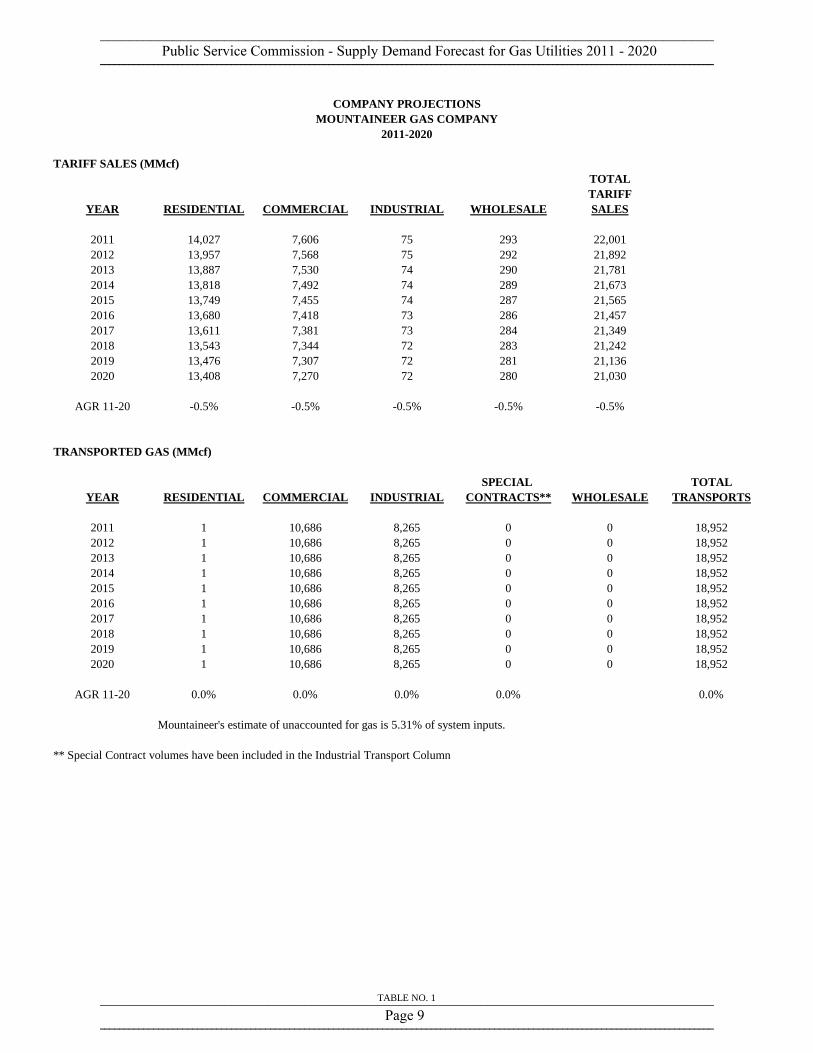
Mountaineer Gas Company Mountaineer does not anticipate any net increase in its demand throughout the forecast period, except through the acquisition of several small utilities. The 2001, 2002, 2003 and 2004 floods in southern West Virginia caused a significant, permanent loss of hundreds of customers. In addition, the prospect of lower natural gas usage per customer because of increasing appliance efficiency and other price-induced conservation are expected to offset some of the increase in new customer demand as well. Mountaineer's projections for the residential and commercial customer classes can be found in Table 1 of this report. These projections reflect no annual rate of change in the
1Weather is measured by reference to historical and "normal" heating degree days (HDD); heating degree days are a measure of the difference of average daily temperatures below 65 degrees Fahrenheit.
____________________________________________________________________________________ Public Service Commission - Supply Demand Forecast for Gas Utilities 2011 - 2020 ‾‾‾‾‾‾‾‾‾‾‾‾‾‾‾‾‾‾‾‾‾‾‾‾‾‾‾‾‾‾‾‾‾‾‾‾‾‾‾‾‾‾‾‾‾‾‾‾‾‾‾‾‾‾‾‾‾‾‾‾‾‾‾‾‾‾‾‾‾‾‾‾‾‾‾‾‾‾‾‾‾‾‾‾‾‾‾‾‾‾‾‾‾‾‾‾‾‾‾‾‾‾‾‾‾‾‾‾‾‾‾‾‾‾‾‾‾‾‾‾‾‾‾‾‾‾
residential and commercial classes from 2011 to 2020. Mountaineer’s forecast for the period represents no change in the level of demand for tariff sales compared to last year’s forecast in each class. Dominion Hope The methodology for developing a volume forecast for Dominion Hope is similar to most gas forecasting methods and can be broken into three components: determining base load, determining heating load, and projecting customer growth. In order to determine base load, the average volumes in July and August are averaged for each rate class. Multiplying those averages by 12 provides a yearly base load for the company. To develop a heating load, Dominion Hope utilizes temperature data from NOAA for the City of Parkersburg. This temperature data is applied to all of Dominion Hope’s service territory. Analyzing historical weather data provides expected heating degree days on a monthly basis. These expected heating degree days, used in conjunction with historical consumption, provides heat load factors used in the forecast. In order to determine customer growth for the forecast term, a regression analysis is performed, regressing historical customer counts against statistically significant demographic and economic variables. Customer growth is then multiplied by expected usage under normal weather conditions to project future usage. These projected figures are then trended in order to reflect the expectation that energy conservation will have a negative influence on projected usage. Dominion Hope’s forecasts in this Report show a 1.4% annual decline in residential throughput volumes and a 0.9% decline in commercial throughput from 2011-2020. Demand forecasts for both classes have increased since last year’s report. Equitable Gas Company Equitable Gas Company is an interstate gas distributor that serves portions of Pennsylvania and northern West Virginia, with each portion of the system regulated by the state in which it is operated. In 1986, Equitable Gas Company was reorganized and Equitrans, Inc. was formed. A further reorganization in 2008 created today’s EQT Corporation, the parent of both Equitable Gas Company and Equitrans, Inc. Equitable Gas Company now consists of only the distribution facilities in Pennsylvania and West Virginia. Equitrans includes the transmission, storage, and gathering facilities that were formerly part of Equitable Gas Company.
____________________________________________________________________________________ Public Service Commission - Supply Demand Forecast for Gas Utilities 2011 - 2020 ‾‾‾‾‾‾‾‾‾‾‾‾‾‾‾‾‾‾‾‾‾‾‾‾‾‾‾‾‾‾‾‾‾‾‾‾‾‾‾‾‾‾‾‾‾‾‾‾‾‾‾‾‾‾‾‾‾‾‾‾‾‾‾‾‾‾‾‾‾‾‾‾‾‾‾‾‾‾‾‾‾‾‾‾‾‾‾‾‾‾‾‾‾‾‾‾‾‾‾‾‾‾‾‾‾‾‾‾‾‾‾‾‾‾‾‾‾‾‾‾‾‾‾‾‾‾
Equitable Gas Company reported data showing an expected approximate 4.7% increase in residential demand and an approximate 2.7% increase in commercial demand, compared to its 2010 forecast. The Company has stated that it expects demand and customer count to remain essentially flat for the new forecast period. The forecast for Equitable is shown in Table 3, and included in the Total Throughput Forecast in Table 4. Industrial Demand The most volatile component of gas demand is the industrial sector. Major causes of this instability are three-fold. First, national economic conditions have a marked impact on industrial output and, thus, gas demand and the level of long run national economic activity cannot be predicted with complete accuracy. This is aggravated by the fact that major West Virginia industrials are often tied to the automobile and other "consumer durable" goods industries that tend to be more volatile than the economy as a whole. Second, the industrial sector is susceptible to work stoppages and other disruptions that cause gas consumption to oscillate significantly. Third, the industrial sector has more alternate fuel capability than the residential or commercial sectors; most fuel switching occurs between natural gas, #6 and #2 fuel oil, and propane, and many firms can switch fuels on less than a day's notice. The incentives for large industrial customers to continue to utilize both utility tariff sales service and transportation remain in place and have strengthened in recent years. FERC Order 636 makes transportation by interstate pipelines mandatory and has been fully implemented by interstate pipelines. The Commission's transportation rules in its General Order Nos. 228, 228.1 and 228.2 facilitates this process within West Virginia for local distribution companies and intrastate pipelines. The combination of these factors makes the industrial demand forecast the most uncertain and the most susceptible to forecast error of the three customer classes evaluated. Mountaineer Gas Company Mountaineer has the largest volume of industrial gas deliveries, with the majority of its service territory encompassing the heavily industrialized Kanawha Valley, Ohio Valley and Eastern and Northern Panhandle regions. Mountaineer's primary industrial customers are in the metals, chemicals, glass and rubber industries. Demand by these customers is highly sensitive to changes in general business conditions, and therefore sensitive to price fluctuations in energy as energy becomes an ever-increasing percentage of the costs of making their products.
____________________________________________________________________________________ Public Service Commission - Supply Demand Forecast for Gas Utilities 2011 - 2020 ‾‾‾‾‾‾‾‾‾‾‾‾‾‾‾‾‾‾‾‾‾‾‾‾‾‾‾‾‾‾‾‾‾‾‾‾‾‾‾‾‾‾‾‾‾‾‾‾‾‾‾‾‾‾‾‾‾‾‾‾‾‾‾‾‾‾‾‾‾‾‾‾‾‾‾‾‾‾‾‾‾‾‾‾‾‾‾‾‾‾‾‾‾‾‾‾‾‾‾‾‾‾‾‾‾‾‾‾‾‾‾‾‾‾‾‾‾‾‾‾‾‾‾‾‾‾
Because of recent economic declines, Mountaineer has lost significant industrial demand in transported demand, and its projections reflect an approximate 41% reduction for the next ten years as compared to its 2010 projections. Mountaineer’s projections are shown on Table 1.
Dominion Hope Dominion Hope, like Mountaineer, forecasts industrial sales by relying heavily on individual customer contact. The major industries in Dominion Hope’s service area are chemicals, glass, wood products, power generation, asphalt, and manufacturing. To forecast throughput, Dominion Hope’s sales force relies on historical consumption information, projections from large industrial users and information that addresses economic conditions affecting the industries of interest. Dominion Hope’s main sales objectives are: (1) to retain existing industrial throughput connected to its system; (2) to increase throughput to existing customers by promoting new, efficient gas technologies; and (3) to add new industrial customers by means of proactive economic development efforts. Dominion Hope’s forecast anticipates no growth in industrial sales and no growth in industrial transportation demand. Hope’s projections, however, reflect an 8.3% increase in industrial throughput compared to its 2010 projections. They are shown on Table 2. Equitable Gas The industrial sales and transport forecast submitted by Equitable Gas is shown on Table 3. The great uncertainty in this class of sales and transport has led the Company to project that a constant amount of industrial throughput will occur over the forecast period. Company Use and Unaccounted for Gas In addition to sales to end-use customers, West Virginia utilities use gas in their own operations, and there is a certain amount of unaccounted-for gas each year. Based on information provided by the Companies, the following estimates reflect the percentage of total throughput that company use and unaccounted-for gas (UFG) represented for each Company: Mountaineer Gas 5.31% Dominion Hope 6.27% Equitable Gas 3.41%
____________________________________________________________________________________ Public Service Commission - Supply Demand Forecast for Gas Utilities 2011 - 2020 ‾‾‾‾‾‾‾‾‾‾‾‾‾‾‾‾‾‾‾‾‾‾‾‾‾‾‾‾‾‾‾‾‾‾‾‾‾‾‾‾‾‾‾‾‾‾‾‾‾‾‾‾‾‾‾‾‾‾‾‾‾‾‾‾‾‾‾‾‾‾‾‾‾‾‾‾‾‾‾‾‾‾‾‾‾‾‾‾‾‾‾‾‾‾‾‾‾‾‾‾‾‾‾‾‾‾‾‾‾‾‾‾‾‾‾‾‾‾‾‾‾‾‾‾‾‾
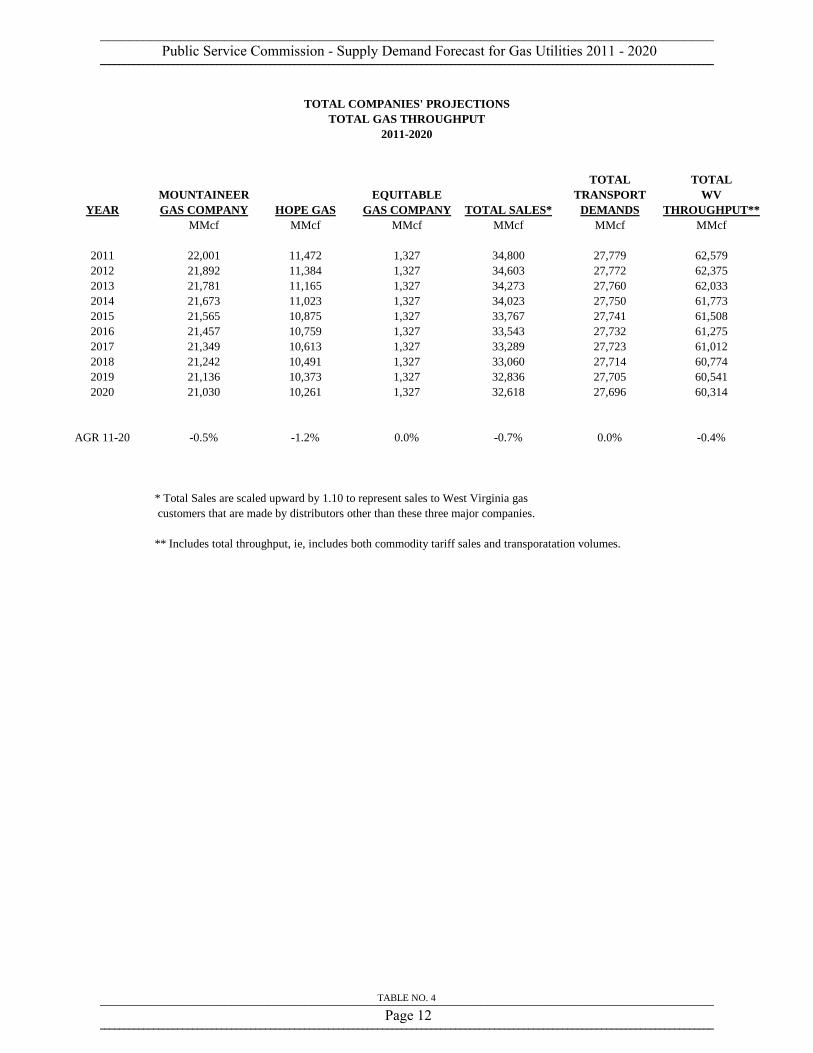
Total West Virginia Demand Table No. 4, contains the summation of the three major gas utilities' projected demand for 2011-2020. In order to account for the smaller utilities and UFG, this sum was increased by a factor of 1.15 to arrive at an estimate of total West Virginia demand by all of the natural gas utilities operating in this State. Based upon the Companies' projections, total West Virginia demand for natural gas is estimated to be 71,965 MMcf in 2011. The total is projected to decrease at an average annual rate of negative 0.36 % (rounded) to 69,361 MMcf in 2020. This projection results, in part, from an expectation of the continued, but uneven, impact of national economic growth on economic conditions in West Virginia as affecting utility throughput. Another significant determinant of the level of natural gas demand is winter weather, and the Companies assume “normal” or historical long-term winter weather patterns over the forecast period, despite significant deviations from normal in recent heating seasons. Customers of all natural gas utilities in West Virginia, however, are subject to the extreme volatility of the natural gas market on a year to year basis. When supply prices increase and are passed to utility customers, there will be downward pressure on consumption. Although Dominion Hope, Mountaineer and Equitable were under rate moratoria in recent years, all of those moratoria expired as of the end of 2008. Prevailing market conditions as those moratoria expired resulted in significant increases in rates for all of these utilities. The Fall of 2010 saw significant decreases in rates for all gas utilities due to much lower market prices compared to recent past years. The shifting of deliveries from tariff sales to “transport-only” has continued in the industrial market, contracted somewhat for the commercial market, and with available “pooling,” choices may spread to the residential market. Thus, major industrial expansion may tend to increase utility transport volumes rather than utility tariff sales volumes. In the near-term, many customers are switching back and forth between tariff purchases and transportation depending on day-to-day or monthly overall costs and availability of gas and/or pipeline capacity. This situation is an indicator of the effects of the extreme volatility currently occurring in the gas commodity markets. (Utility rates do not adjust as quickly as market rates.)
____________________________________________________________________________________ Public Service Commission - Supply Demand Forecast for Gas Utilities 2011 - 2020 ‾‾‾‾‾‾‾‾‾‾‾‾‾‾‾‾‾‾‾‾‾‾‾‾‾‾‾‾‾‾‾‾‾‾‾‾‾‾‾‾‾‾‾‾‾‾‾‾‾‾‾‾‾‾‾‾‾‾‾‾‾‾‾‾‾‾‾‾‾‾‾‾‾‾‾‾‾‾‾‾‾‾‾‾‾‾‾‾‾‾‾‾‾‾‾‾‾‾‾‾‾‾‾‾‾‾‾‾‾‾‾‾‾‾‾‾‾‾‾‾‾‾‾‾‾‾
Mountaineer's estimate of unaccounted for gas is 5.31% of system inputs.
** Special Contract volumes have been included in the Industrial Transport Column
COMPANY PROJECTIONSMOUNTAINEER GAS COMPANY
2011-2020
TABLE NO. 1
____________________________________________________________________________________ Public Service Commission - Supply Demand Forecast for Gas Utilities 2011 - 2020 ‾‾‾‾‾‾‾‾‾‾‾‾‾‾‾‾‾‾‾‾‾‾‾‾‾‾‾‾‾‾‾‾‾‾‾‾‾‾‾‾‾‾‾‾‾‾‾‾‾‾‾‾‾‾‾‾‾‾‾‾‾‾‾‾‾‾‾‾‾‾‾‾‾‾‾‾‾‾‾‾‾‾‾‾‾‾‾‾‾‾‾‾‾‾‾‾‾‾‾‾‾‾‾‾‾‾‾‾‾‾‾‾‾‾‾‾‾‾‾‾‾‾‾‾‾‾
Hope's estimate of unaccounted for gas is 6.27% of total system inputs.
COMPANY PROJECTIONSDOMINION HOPE GAS
2011-2020
TABLE NO. 2
____________________________________________________________________________________ Public Service Commission - Supply Demand Forecast for Gas Utilities 2011 - 2020 ‾‾‾‾‾‾‾‾‾‾‾‾‾‾‾‾‾‾‾‾‾‾‾‾‾‾‾‾‾‾‾‾‾‾‾‾‾‾‾‾‾‾‾‾‾‾‾‾‾‾‾‾‾‾‾‾‾‾‾‾‾‾‾‾‾‾‾‾‾‾‾‾‾‾‾‾‾‾‾‾‾‾‾‾‾‾‾‾‾‾‾‾‾‾‾‾‾‾‾‾‾‾‾‾‾‾‾‾‾‾‾‾‾‾‾‾‾‾‾‾‾‾‾‾‾‾
Equitable's unaccounted for gas is reported as 3.41%.
2011-2020
COMPANY PROJECTIONSEQUITABLE GAS COMPANY
TABLE NO. 3
____________________________________________________________________________________ Public Service Commission - Supply Demand Forecast for Gas Utilities 2011 - 2020 ‾‾‾‾‾‾‾‾‾‾‾‾‾‾‾‾‾‾‾‾‾‾‾‾‾‾‾‾‾‾‾‾‾‾‾‾‾‾‾‾‾‾‾‾‾‾‾‾‾‾‾‾‾‾‾‾‾‾‾‾‾‾‾‾‾‾‾‾‾‾‾‾‾‾‾‾‾‾‾‾‾‾‾‾‾‾‾‾‾‾‾‾‾‾‾‾‾‾‾‾‾‾‾‾‾‾‾‾‾‾‾‾‾‾‾‾‾‾‾‾‾‾‾‾‾‾
* Total Sales are scaled upward by 1.10 to represent sales to West Virginia gas customers that are made by distributors other than these three major companies.
** Includes total throughput, ie, includes both commodity tariff sales and transporatation volumes.
TOTAL COMPANIES' PROJECTIONSTOTAL GAS THROUGHPUT
2011-2020
TABLE NO. 4
____________________________________________________________________________________ Public Service Commission - Supply Demand Forecast for Gas Utilities 2011 - 2020 ‾‾‾‾‾‾‾‾‾‾‾‾‾‾‾‾‾‾‾‾‾‾‾‾‾‾‾‾‾‾‾‾‾‾‾‾‾‾‾‾‾‾‾‾‾‾‾‾‾‾‾‾‾‾‾‾‾‾‾‾‾‾‾‾‾‾‾‾‾‾‾‾‾‾‾‾‾‾‾‾‾‾‾‾‾‾‾‾‾‾‾‾‾‾‾‾‾‾‾‾‾‾‾‾‾‾‾‾‾‾‾‾‾‾‾‾‾‾‾‾‾‾‾‾‾‾
Supply Analysis The volume of natural gas available to the market depends upon the quantity of recoverable resources and the incentives for producing from that resource base. The natural gas market in the United States, once constrained as a multitude of local and regional markets, has become a national and continental market, and international when liquified natural gas (LNG) is considered, in scope. Therefore, it is not practicable for the Commission to perform the same detailed analysis of the supply side of this market as was done for the demand side. Historically, this industry has been characterized by a shortage-surplus-shortage cycle; however, much of this historical cycle was the result of effective price controls, such that the market response to changing circumstances was through quantity supplied rather than price. The Potential Gas Committee2, in its December 2008 report (reports are issued biannually), estimated that the total potential resource of natural gas in the United States is 1836 trillion cubic feet (Tcf), an increase of 515 Tcf from the Committee’s 2006 report, for an approximate 92-year supply at today’s demand level. This represents an unprecedented increase. Previous years’ reports noted a decrease in the potential reserves estimates between 2002 and 2004. The current estimate again includes Alaskan sources and estimated recoverable coalbed methane. The Potential Gas Committee's estimates also include the volume of proven recoverable natural gas reserves contained in the nation's discovered fields. Also, these resource base estimates do not include other reachable supply sources, such as Canadian gas or Mexican gas or LNG from overseas. Much more information may be obtained from the Committee’s website at www.mines.edu/research/pga. A short summary of the report and additional information is attached (Attachment A). The 2010 report is scheduled to be released in early 2011 and will reflect extremely significant increases due to new assessments of shale gas reserves. The Annual Energy Outlook 2010 of the Energy Information Administration on natural gas reserves and supply and demand estimates presents several different scenarios. All scenarios, however, indicate there will be an ample resource base during the 2011-2020 forecast period. For the first time, the Outlook extends it’s analysis through 2035. There have been, in recent years, concerns voiced in the gas industry over an expected (by some participants) supply shortfall at the national level within the next ten years. This projection is subject to many assumptions regarding economic activity,
2The Potential Gas Committee is an organization comprised of personnel from all parts of the natural gas industry. The Committee report can be obtained from the Potential Gas Agency, Colorado School of Mines.
____________________________________________________________________________________ Public Service Commission - Supply Demand Forecast for Gas Utilities 2011 - 2020 ‾‾‾‾‾‾‾‾‾‾‾‾‾‾‾‾‾‾‾‾‾‾‾‾‾‾‾‾‾‾‾‾‾‾‾‾‾‾‾‾‾‾‾‾‾‾‾‾‾‾‾‾‾‾‾‾‾‾‾‾‾‾‾‾‾‾‾‾‾‾‾‾‾‾‾‾‾‾‾‾‾‾‾‾‾‾‾‾‾‾‾‾‾‾‾‾‾‾‾‾‾‾‾‾‾‾‾‾‾‾‾‾‾‾‾‾‾‾‾‾‾‾‾‾‾‾
exploration and development efforts, gas-fired electric generation growth, overall national energy policies and legislation, etc. As of this writing, however, such concern is no longer valid. The focus of this report is on the supply and demand status in West Virginia only. It should be noted that the State is, and has been for many decades, a net exporter of natural gas and currently exports approximately 80% of its production to other states. Increased competition in the natural gas market has occurred as a result of efforts by producers and pipelines to sell excess supplies of gas and through the reduction of regulatory restrictions. The efforts by producers and pipelines have included Special Marketing Programs, renegotiated contracts, and the development of a spot and futures market for natural gas. Competition was further enhanced by the Federal Energy Regulatory Commission’s Order 636. This Order was intended to further increase the availability of non-discriminatory transportation by interstate pipelines. A major result has been the broadening of the natural gas market such that customers and suppliers in different geographical regions can negotiate directly and move gas as needed through transportation services provided by pipelines. The impact in West Virginia can easily be seen by examining the shift of industrial and commercial tariff sales to transportation only for two of the three major companies considered in this report. Order 636 also sought to eliminate any advantage pipelines may have had in performing a "merchant" function for local distribution utilities. The intent was to increase competition on the supply side of the natural gas market. While the current natural gas market is more competitive, there are still numerous restrictions and rigidities that reduce the ability of prices to react appropriately to excess supply or demand. For example, increased opportunities for competition on the supply side of the natural gas market will initially lead to higher spot market prices as a result of excess demand, but there is a regulatory lag until these higher purchased gas prices result in higher retail prices. This imbalance is sustained by the length of the regulatory lag as suppliers raise prices, but customers continue to demand volumes of natural gas based on lower retail prices. Fortunately, a study by the AGA indicates that a short-term additional supply potential exists to help bridge the gap between increased quantity demanded and production. These short term supplies could come from uncommitted or shut-in wells, Canadian gas, Mexican gas, and liquefied natural gas through the attraction of increased spot market prices. The following is a brief review of the sources of supply for the Companies studied in this report. Mountaineer Gas has historically purchased approximately 70%- 90% of its supply from the Southwest market with the balance purchased from Appalachian producers.
____________________________________________________________________________________ Public Service Commission - Supply Demand Forecast for Gas Utilities 2011 - 2020 ‾‾‾‾‾‾‾‾‾‾‾‾‾‾‾‾‾‾‾‾‾‾‾‾‾‾‾‾‾‾‾‾‾‾‾‾‾‾‾‾‾‾‾‾‾‾‾‾‾‾‾‾‾‾‾‾‾‾‾‾‾‾‾‾‾‾‾‾‾‾‾‾‾‾‾‾‾‾‾‾‾‾‾‾‾‾‾‾‾‾‾‾‾‾‾‾‾‾‾‾‾‾‾‾‾‾‾‾‾‾‾‾‾‾‾‾‾‾‾‾‾‾‾‾‾‾
Mountaineer is increasing its efforts to purchase additional local production. In recent years many Appalachian producers have opted to market their production to end-users on Mountaineer’s system. The forecast supply for Dominion Hope indicates that its sources of supply include local purchases, Dominion Transmission Corporation, long-term contracts, and spot market purchases from the Appalachian and Southwest markets. Transportation to Dominion Hope's market will be provided by Dominion Transmission, Texas Gas Transmission and Columbia Gas Transmission. In all forecast years, it is believed that Dominion Hope will have an adequate supply of natural gas. Equitable Gas Company indicates its primary source of supply during the 2011-2020 forecast period will be approximately: 20% from the storage withdrawals/injections (the injection supply consists of gas purchases made during the injection season); 54% direct purchases of Appalachian natural gas; and 26% transported natural gas on the Equitrans system. All of Equitable’s purchased gas supplies come from direct feed Appalachian production. As discussed earlier in the gas supply arrangements of the distribution utilities, the distributor relies heavily on the transmission supplier, and the transmission supplier relies on the upstream gas producer. Because of this arrangement, an exact supply number is an unnecessary oversimplification of the multi-tiered total gas acquisition process. West Virginia exports far more of its own locally-produced gas than is necessary to meet in-state demand. Of significant importance is the current flurry of activity with regard to a previously known, but technically inaccessible, gas formation in Appalachia, including much of West Virginia, known as the Marcellus Shale formation. Production from this formation requires horizontal drilling and extensive fracturing. Because of the cost of development, the Marcellus Shale until recently was of little practical interest. However, in the past few years, there has been greater interest shown by producers in acquiring leases with the intent to drill to and produce from this formation. Current speculation in industry circles is that the Marcellus Shale gas is the largest discovery ever, not only in West Virginia, but in the region. If the geologists and others are correct, this would obviously greatly strengthen West Virginia’s position as a gas producer and would further support statements made above as to the supply and demand balance in the state.
____________________________________________________________________________________ Public Service Commission - Supply Demand Forecast for Gas Utilities 2011 - 2020 ‾‾‾‾‾‾‾‾‾‾‾‾‾‾‾‾‾‾‾‾‾‾‾‾‾‾‾‾‾‾‾‾‾‾‾‾‾‾‾‾‾‾‾‾‾‾‾‾‾‾‾‾‾‾‾‾‾‾‾‾‾‾‾‾‾‾‾‾‾‾‾‾‾‾‾‾‾‾‾‾‾‾‾‾‾‾‾‾‾‾‾‾‾‾‾‾‾‾‾‾‾‾‾‾‾‾‾‾‾‾‾‾‾‾‾‾‾‾‾‾‾‾‾‾‾‾
Conclusions This report has examined the three major gas utilities responsible for 90% of total West Virginia throughput. As seen earlier in reviewing Table 4, the aggregate forecasts of the companies imply level to slightly decreasing total demand for natural gas in the state of West Virginia. The growth rate implied by the aggregate companies’ forecast is negative 0.4%. Available supplies of natural gas are expected to be more than adequate to meet forecasted demands for 2011-2020. A number of factors are likely to keep this market in disequilibrium, including:
1. The effects of fully implemented FERC Orders 636 and 636A and the Energy Policy Act of 1992 will continue to have an uncertain net impact on supply and demand;
2. Increasing environmental regulations affecting coal-fired electric generation will also
increase natural gas demand. EPA rules have placed more stringent limits on nitrous oxide emissions. Further, the United States is discussing international concerns which could lead to increased limitations on carbon dioxide emissions;
3. Efforts to "restructure" the electric power market toward a more competitive market
will mean increased end-use competition and increased sales of gas used for electric power generation;
4. Natural gas prices are in part affected by oil prices, and there are continuing attempts
by oil producing nations to set production quotas sufficient to raise oil prices which would result in increased gas demand and prices;
5. Further expansion of programs which allow increased natural gas customer choice is
being contemplated. This includes “pooling” of customers by marketers which may eventually enable residential gas customers to shift from tariff sales to “transport-only” on the State’s gas utility systems;
6. Relatively high natural gas prices and supply uncertainties from l975 to l985 induced
customers to make decisions and investments such as installing insulation, conversion to electric heat pumps and so forth which will continue to affect their demand for natural gas even if prices decrease; and,
7. Over the past several years, natural gas utilities have experienced sharply higher
supply prices for natural gas. As these supply price increases are passed on to utility customers there will be downward pressure on consumption. As of this writing, however, prices are relatively low, at least in part due to the current over-supply created by the addition of new shale gas supplies.
____________________________________________________________________________________ Public Service Commission - Supply Demand Forecast for Gas Utilities 2011 - 2020 ‾‾‾‾‾‾‾‾‾‾‾‾‾‾‾‾‾‾‾‾‾‾‾‾‾‾‾‾‾‾‾‾‾‾‾‾‾‾‾‾‾‾‾‾‾‾‾‾‾‾‾‾‾‾‾‾‾‾‾‾‾‾‾‾‾‾‾‾‾‾‾‾‾‾‾‾‾‾‾‾‾‾‾‾‾‾‾‾‾‾‾‾‾‾‾‾‾‾‾‾‾‾‾‾‾‾‾‾‾‾‾‾‾‾‾‾‾‾‾‾‾‾‾‾‾‾
Federal Government: National Petroleum Council (NPC) Balancing Natural Gas Policy (2003) www.npc.org Energy Information Administration (EIA) www.eia.doe.gov
Producers: Natural Gas Supply Association (NGSA) Winter Outlook www.ngsa.org Interstate Pipelines: Interstate Natural Gas Association of America (INGA) www.ingaa.org
Local Distribution Companies: American Gas Association (AGA) www.aga.org
Research: National Regulatory Research Institute (NRRI) www.nrri.org
____________________________________________________________________________________ Public Service Commission - Supply Demand Forecast for Gas Utilities 2011 - 2020 ‾‾‾‾‾‾‾‾‾‾‾‾‾‾‾‾‾‾‾‾‾‾‾‾‾‾‾‾‾‾‾‾‾‾‾‾‾‾‾‾‾‾‾‾‾‾‾‾‾‾‾‾‾‾‾‾‾‾‾‾‾‾‾‾‾‾‾‾‾‾‾‾‾‾‾‾‾‾‾‾‾‾‾‾‾‾‾‾‾‾‾‾‾‾‾‾‾‾‾‾‾‾‾‾‾‾‾‾‾‾‾‾‾‾‾‾‾‾‾‾‾‾‾‾‾‾
“The PGrecoverabof reservColoradoguidance Dr. Curtispecific mPotentialappraisalUnited S The Comconsists reservoirwhile copotential These chproductio When thdeterminavailable As Dr. Cgas contiwell drillgas resouimpractic
ws & Events » New
ntial Gasnitude of
N, Colo., Juntest biennial tates possesevaluation i
ent arose front, Gulf Coas
GC’s year-enble natural g
voirs,” said Do School of e and technic
is cautioned,market pricel Gas Comml of what wetates,” he ex
mmittee’s yeof 1,673 T
rs. Comparedoalbed gas r
resources o
hanges have on recorded
he PGC’s renation of proe future supp
Curtis observinues to impling and comurces—especcal or unecon
ws Releases »
s Commf U.S. na
ne 18, 2009 assessment
ses a total rein the Commm reevaluatst and Rocky
nd 2008 assgas resourcesDr. John B. f Mines andcal assistance
, however, the for the dis
mittee are ‘be consider t
xplained.
ear-end 2008Tcf of gas d to year-endresources def 515 Tcf (3
been assessduring the tw
sults are coved gas rese
ply of 2,074 T
ed, “Our knoprove with
mpletion techcially ‘unconomical to p
mittee repatural ga
– The Potenof the natio
esource basemittee’s 44-ytion of shaley Mountain a
sessment reas exist withinCurtis, Prof
d Director oe to the Pote
hat the currescovery and ase-line estio be the ‘te
8 assessmentattributable d 2006, tradecreased by 9%). (See ac
sed in additiwo-year peri
ombined witerves, 238 TTcf, an incre
owledge of teach assessmhnologies arnventional’
pursue.”
ports unas resou
ntial Gas Comon’s natural
e of 1,836 triyear history.-gas plays inareas.
affirms the n our border
fessor of Geof the Poten
ential Gas Co
ent assessmeproduction
imates’ in thchnically re
t of 1,836 Tto tradition
itional resou3 Tcf (1.9%
ccompanyin
ion to the 4iod since the
h the U.S. DTcf as of yeaease of 542 T
the geologicment. Furthre allowing ugas—which
nprecedurce bas
mmittee (PGl gas resourcillion cubic f. Most of thn the Appala
cal endowmehermore, newus increasingh, not all tha
dented inse
GC) today reces, which ifeet (Tcf). T
he increase frachian basin
’s convictiohore and offsGeological Egency there,
neither a timgas supply. “empt to provgas resource
cally aggregars and 163sed by nearly
ng in a net
arketed dome’s previous
of Energy'the United previous ev
ent of techniw and advangly better acat long ago,
ncrease
eleased the reindicates tha
This is the hifrom the prevn and in the
on that abunshore, in all
Engineering a, which pro
me schedule “Estimates ovide a reasone potential o
ated mean v Tcf in coy 519 Tcf (4increase in
mestic naturareport.
s latest avaiStates has a
valuation.
ically recovenced exploraccess to domwere consid
in
esults at the ighest vious Mid-
ndant, types at the
ovides
nor a of the nable
of the
value) albed
45%), total
al gas
ilable a total
erable ation,
mestic dered
____________________________________________________________________________________ Public Service Commission - Supply Demand Forecast for Gas Utilities 2011 - 2020 ‾‾‾‾‾‾‾‾‾‾‾‾‾‾‾‾‾‾‾‾‾‾‾‾‾‾‾‾‾‾‾‾‾‾‾‾‾‾‾‾‾‾‾‾‾‾‾‾‾‾‾‾‾‾‾‾‾‾‾‾‾‾‾‾‾‾‾‾‾‾‾‾‾‾‾‾‾‾‾‾‾‾‾‾‾‾‾‾‾‾‾‾‾‾‾‾‾‾‾‾‾‾‾‾‾‾‾‾‾‾‾‾‾‾‾‾‾‾‾‾‾‾‾‾‾‾
“Consequently, our present assessment demonstrates an exceptionally strong and optimistic gas supply picture for the nation.” Overall, the Gulf Coast, including the Gulf of Mexico continental shelf, slope and deepwater, remains the country’s richest resource area, followed by the Rocky Mountain, Atlantic and Mid-Continent regions, which together account for 87% of the 2008 assessed traditional resource. (See accompanying Table 2.) Changes in the assessments from 2006 to 2008 arose primarily from analyses of new geological, drilling, well-test and production data from these same four regions. The largest volumetric and percentage increases resulted from reassessments of active and newly developing shale-gas plays in the Appalachian basin of the Atlantic area, the Arkoma and Fort Worth basins of the Mid-Continent area, several basins of the Gulf Coast area, and the Uinta basin of the Rocky Mountain area. The growing importance of shale gas is substantiated by the fact that, of the 1,836 Tcf of total potential resources, shale gas accounts for 616 Tcf (33%). The number of plays, the level of production and the magnitude of perceived in-place resources have increased to the point that PGC, for the first time, is publishing a separate tabulation of its ongoing province- and area-level shale-gas assessments. Also this year, for the first time, PGC is issuing an Advance Summary of its assessment results. This document will provide purchasers who preorder the Committee’s printed report with all of the national, area- and province-level assessment tabulations and accompanying graphical representations for immediate analysis and critique. PGC’s 2008 report includes detailed area- and province-level resource assessments, summaries of recent E&P activities, and updated editions of its popular value-added features:
PGC and the Ultimately Recoverable Resource—explains in simplified terms, with annotated graphics, the time-dynamic nature of gas resource assessment, the relationship between proved reserves and the PGC’s categories of resources, and how these quantities lead to determination of the ultimately recoverable gas resource.
Historical Trends I—Annual trends in crude oil, natural gas and gas liquids production for 1980-2008, together with the basics of ‘vintaged’ production graphs, production profiles, well and rig statistics, prices, revenues and other useful parameters, as well as forecasts of production trends to 2030. Accompanying text describes each plotted trend, which is keyed to a graphical folio for the U.S. containing more than 90 charts that are rarely, if at all, seen in print elsewhere. (Similar folios for all producing regions and provinces are available on a separate CD-ROM.)
Historical Trends II—Monthly gas production and well-count histories for all Lower 48 States’ onshore and offshore provinces, allowing the reader to compare and contrast basins with rising, falling or stable production trends.
Historical Trends III—Gas-well permitting and spudding histories for all producing provinces, a measure of overall health of the industry from basin to basin.
Historical Trends IV—“Top-ten” rankings of gas producers and well production trends and performance, arranged by PGC province.
____________________________________________________________________________________ Public Service Commission - Supply Demand Forecast for Gas Utilities 2011 - 2020 ‾‾‾‾‾‾‾‾‾‾‾‾‾‾‾‾‾‾‾‾‾‾‾‾‾‾‾‾‾‾‾‾‾‾‾‾‾‾‾‾‾‾‾‾‾‾‾‾‾‾‾‾‾‾‾‾‾‾‾‾‾‾‾‾‾‾‾‾‾‾‾‾‾‾‾‾‾‾‾‾‾‾‾‾‾‾‾‾‾‾‾‾‾‾‾‾‾‾‾‾‾‾‾‾‾‾‾‾‾‾‾‾‾‾‾‾‾‾‾‾‾‾‾‾‾‾
North American Perspectives I-II—overviews of natural gas resources, production and recent E&P activities in Canada and Mexico.
Frontier Gas Resources I-IV—latest domestic and international developments in natural gas hydrates and liquefied natural gas (LNG); deep drilling for natural gas in the U.S.; and U.S. shale gas resources and play characteristics.
Comparison of Assessments—a look at how PGC assesses gas resources and how the Committee’s assessment methodology and latest results contrast with those of other organizations.
From Reservoir to Burner Tip—PGC’s natural gas “primer,” a less technical discussion of how and where natural gas occurs and how it is produced, stored, transported, delivered to and beneficially used by consumers.
In addition to the Advance Summary and full printed report, the PGC will release the third edition of its information-packed CD-ROM product, PGC Trove 2009. This disc will include digital versions of the report, both in its entirety and as amply bookmarked individual chapters. The trove will again feature the comprehensive Folio of Historical Production Trends and Forecast for the United States, consisting of more than 2,500 historical-trend plots covering the entire U.S., the Lower 48 States, each oil- and gas-producing region and each onshore and offshore producing province. PGC also will premier a suite of spreadsheets that tabulate all of the Committee’s published national, area- and province-level assessment results back to 1964. With these three offerings, the Potential Gas Committee presents a more complete picture of present gas supply and productive capacity of the North American natural gas industry than it has compiled previously. Details of the Potential Gas Committee's Natural Gas Resource Assessment (as of Dec. 31, 2008) The Potential Gas Committee (PGC) reports its gas resource assessments biennially in three categories of decreasing certainty—Probable, Possible and Speculative. For each category, a minimum, most likely and maximum volume is assessed for each of 89 geological provinces in the Lower 48 States and Alaska. The mean values shown in Table 1 below were calculated by statistical aggregation of the minimum, most likely and maximum traditional values for each resource category. Mean values for total traditional resources and total coalbed gas resources are aggregated separately. This procedure imparts greater statistical validity to the results and allows for more direct comparison of PGC’s assessments with those made by other organizations.
____________________________________________________________________________________ Public Service Commission - Supply Demand Forecast for Gas Utilities 2011 - 2020 ‾‾‾‾‾‾‾‾‾‾‾‾‾‾‾‾‾‾‾‾‾‾‾‾‾‾‾‾‾‾‾‾‾‾‾‾‾‾‾‾‾‾‾‾‾‾‾‾‾‾‾‾‾‾‾‾‾‾‾‾‾‾‾‾‾‾‾‾‾‾‾‾‾‾‾‾‾‾‾‾‾‾‾‾‾‾‾‾‾‾‾‾‾‾‾‾‾‾‾‾‾‾‾‾‾‾‾‾‾‾‾‾‾‾‾‾‾‾‾‾‾‾‾‾‾‾
U.S. Future Supply 2,074.1 1,532.0 +542.1 (35.4%) * Mean values for Probable, Possible and Speculative resources are not arithmetically additive in deriving the subtotal. Subtotal mean values are additive in deriving Total Potential Resources. ** Latest available figure is for year-end 2007. Note: Totals are subject to rounding and differences due to statistical aggregation of distributions. PGC’s 89 geological provinces are grouped into seven geographic areas. In similar fashion as above, the minimum, most likely and maximum values for each category of traditional resources in each province within an area are aggregated at the area level to yield mean values for area Probable, Possible and Speculative traditional resources and a separately aggregated area total. Coalbed gas resources are not aggregated at the area level. Table 2 below compares the total mean values for these areas for years-end 2008 and 2006.
____________________________________________________________________________________ Public Service Commission - Supply Demand Forecast for Gas Utilities 2011 - 2020 ‾‾‾‾‾‾‾‾‾‾‾‾‾‾‾‾‾‾‾‾‾‾‾‾‾‾‾‾‾‾‾‾‾‾‾‾‾‾‾‾‾‾‾‾‾‾‾‾‾‾‾‾‾‾‾‾‾‾‾‾‾‾‾‾‾‾‾‾‾‾‾‾‾‾‾‾‾‾‾‾‾‾‾‾‾‾‾‾‾‾‾‾‾‾‾‾‾‾‾‾‾‾‾‾‾‾‾‾‾‾‾‾‾‾‾‾‾‾‾‾‾‾‾‾‾‾
Total U.S. Traditional Resources* 1,673.4 1,154.8 +518.6 (44.9%) Coalbed Natural Gas (all areas combined) 163.0 166.1 –3.1 (1.9%) Total Potential Resources 1,836.4 1,320.9 +515.5 (39.0%) Proved reserves (DOE/EIA) 237.7** 211.1
U.S. Future Gas Supply 2,074.1 1,532.0 +542.1 (35.4%) * Mean values of total resources for the seven areas are not arithmetically additive in deriving Total U.S. Traditional Resources. ** Latest available figure is for year-end 2007. Note: Totals are subject to rounding and differences due to statistical aggregation of distributions. How to Obtain the Potential Gas Committee Report Prepublication orders for the full printed PGC report, Potential Supply of Natural Gas in the United States (December 31, 2008) may now be placed with the Potential Gas Agency, Colorado School of Mines, Golden, CO 80401-1887. The cost of the printed report is US$495 (US$515 for foreign shipment), if payment accompanies the order. The printed report with the companion CD-ROM will be available for US$950 (US$970 for foreign shipment). All purchasers will receive the Advance Summary immediately and will automatically be sent the full printed report (or report plus CD-ROM) when the book is expected to become available in late summer. For additional information about ordering these and previous reports and CDs, please contact Linda D’Epagnier, Program Assistant, at the Potential Gas Agency, telephone 303-273-3886, fax 303-273-3574, or e-mail: [email protected]. About the Potential Gas Committee The Potential Gas Committee, an incorporated, nonprofit organization, consists of knowledgeable and highly experienced volunteer members who work in the natural gas
____________________________________________________________________________________ Public Service Commission - Supply Demand Forecast for Gas Utilities 2011 - 2020 ‾‾‾‾‾‾‾‾‾‾‾‾‾‾‾‾‾‾‾‾‾‾‾‾‾‾‾‾‾‾‾‾‾‾‾‾‾‾‾‾‾‾‾‾‾‾‾‾‾‾‾‾‾‾‾‾‾‾‾‾‾‾‾‾‾‾‾‾‾‾‾‾‾‾‾‾‾‾‾‾‾‾‾‾‾‾‾‾‾‾‾‾‾‾‾‾‾‾‾‾‾‾‾‾‾‾‾‾‾‾‾‾‾‾‾‾‾‾‾‾‾‾‾‾‾‾
exploration, production and transportation industries and in the field and technical services and consulting sectors. The Committee also benefits from the input of respected technical advisors and various observers from federal and state government agencies, academia, and industry and research organizations in both the United States and Canada. Although the PGC functions independently, the Potential Gas Agency at the Colorado School of Mines provides the Committee with guidance, technical assistance, training and administrative support, and assists in member recruitment and outreach. The Potential Gas Agency receives financial support from prominent E&P and gas pipeline companies and distributors, as well as industry trade and research organizations and unaffiliated individuals. -MINES- Note to Editors: Selected illustrations from the press conference slide presentation are available for print use. Contact the Potential Gas Agency and specify desired figure number(s) and preferred file format (e.g., tiff, eps). Fig. 6. Total traditional gas resources in the United States, by resource category, year-end 2008 (mean values, Tcf). Data from Potential Gas Committee (2009). W of the W Fig. 7. Total coalbed gas resources for the United States, by resource category, year-end 2008 (mean values, Tcf). Data from Potential Gas Committee (2009). W of the W Fig. 8. Total potential gas resources of the United States, traditional and coalbed, 1988-2008 (mean values, Tcf). Data from Potential Gas Committee (2009). Fig. 9. Map of PGC assessment areas, annotated with total traditional and coalbed gas resource values for year-end 2008 (mean values, Bcf). Data from Potential Gas Committee (2009). Fig. 10. Comparison of potential gas resources for the United States, by area, onshore, offshore and coalbed gas, year-end 2008 (“most likely” values, Bcf). Data from Potential Gas Committee (2009). Contact: John B. Curtis, Potential Gas Agency / 303-273-3886; / [email protected] Karen Gilbert, Public Relations Specialist / 303-273-3541 / [email protected] Marsha Williams, Director of Integrated Marketing Communications / 303-273-3326 / [email protected]
____________________________________________________________________________________ Public Service Commission - Supply Demand Forecast for Gas Utilities 2011 - 2020 ‾‾‾‾‾‾‾‾‾‾‾‾‾‾‾‾‾‾‾‾‾‾‾‾‾‾‾‾‾‾‾‾‾‾‾‾‾‾‾‾‾‾‾‾‾‾‾‾‾‾‾‾‾‾‾‾‾‾‾‾‾‾‾‾‾‾‾‾‾‾‾‾‾‾‾‾‾‾‾‾‾‾‾‾‾‾‾‾‾‾‾‾‾‾‾‾‾‾‾‾‾‾‾‾‾‾‾‾‾‾‾‾‾‾‾‾‾‾‾‾‾‾‾‾‾‾