Policy Research Working Paper 7532 Supporting Export Competitiveness through Port and Rail Network Reforms A Case Study of South Africa Duncan Pieterse omas Farole Martin Odendaal Andre Steenkamp Trade and Competitiveness Global Practice Group January 2016 WPS7532 Public Disclosure Authorized Public Disclosure Authorized Public Disclosure Authorized Public Disclosure Authorized
Transcript
Policy Research Working Paper 7532
Supporting Export Competitiveness through Port and Rail Network Reforms
A Case Study of South Africa
Duncan PieterseThomas Farole
Martin OdendaalAndre Steenkamp
Trade and Competitiveness Global Practice GroupJanuary 2016
WPS7532P
ublic
Dis
clos
ure
Aut
horiz
edP
ublic
Dis
clos
ure
Aut
horiz
edP
ublic
Dis
clos
ure
Aut
horiz
edP
ublic
Dis
clos
ure
Aut
horiz
ed
Produced by the Research Support Team
Abstract
The Policy Research Working Paper Series disseminates the findings of work in progress to encourage the exchange of ideas about development issues. An objective of the series is to get the findings out quickly, even if the presentations are less than fully polished. The papers carry the names of the authors and should be cited accordingly. The findings, interpretations, and conclusions expressed in this paper are entirely those of the authors. They do not necessarily represent the views of the International Bank for Reconstruction and Development/World Bank and its affiliated organizations, or those of the Executive Directors of the World Bank or the governments they represent.
Policy Research Working Paper 7532
This paper is a product of the Trade and Competitiveness Global Practice Group. It is part of a larger effort by the World Bank to provide open access to its research and make a contribution to development policy discussions around the world. Policy Research Working Papers are also posted on the Web at http://econ.worldbank.org. The authors may be contacted at [email protected] and [email protected].
Transport and logistics infrastructure is a critical determi-nant of the competitiveness of a country’s producers and exporters. Well-functioning transport and logistics infra-structure relies not just on hardware, but critically on the operating environment that emerges from the interaction between private sector operators; national policies and regu-latory regimes; and, in many countries, state-owned owners and operators of core infrastructure. This paper looks at the case of South Africa, where constraints in access, pricing, reliability, and network interfaces, particularly in the port and rail network, are eroding the competitiveness of South African exporters. The paper draws on interviews with a wide range of exporters along with secondary research to
examine South Africa’s port and rail network, and explores the underlying factors contributing to these constraints, including chronic underinvestment, an inadequate regula-tory environment, insufficient private sector participation, and weak regional integration. The paper concludes with a review of the reforms needed to deliver a more broadly accessible and competitive rail and port sector based on international case examples. It highlights the need for institu-tional reforms to promote competitive pricing; private sector participation to increase investment and improve service delivery; information and coordination to address market failures and improve access; and cooperation to improve intermodal, interregional, and institutional interfaces.
Duncan Pieterse*, Thomas Farole+, Martin Odendaal*, and Andre Steenkamp*
JEL codes: R48, F10
Keywords: Exports, Trade logistics, Ports, Railways, South Africa
1 Author affiliations: * National Treasury of South Africa; + World Bank. 2 Funding from the Multi‐Donor Trust Fund for Trade and Development is gratefully acknowledged. The authors are grateful to Elvin
Harris and colleagues at Transnet, Angelika Goliger, Charles Kunaka, Martha Lawrence, Nick Porée, Catriona Purfield, and Ulrike Rwida for valuable comments. Special thanks to Bo Giersing, Florencia Millan‐Placci, and Keith Garrett for their contributions to the research. The usual disclaimer applies.
2
1 Introduction
1.1 The importance of transport for export competitiveness
Exports are critical to a country’s development. Exports allow firms to access a larger market to exploit economies of scale; contribute to growth and employment; and generate foreign exchange needed to finance imports. The importance of exports to a country’s growth trajectory means that export competitiveness is often at the center of policy discussions. In recent years the focus to support trade growth has moved beyond trade policy and market access to embrace “behind‐the‐border” issues as many countries have been unable to compete in global markets despite greater (often preferential) market access. This shift recognizes that a firm’s ability to compete in international markets is the combination of a complex set of demand and supply‐side issues, including macroeconomic policies, factor conditions, infrastructure and related services, transport and logistics, and coordination failures (World Bank, 2012). The transport and logistics sector ‐ which underpins a firm’s ability to access cheap inputs, and to land products in foreign countries at a competitive price – is particularly important given the rise of regional and global value chains. These value chains offer significant growth potential for developing countries, particularly in the context of rising Chinese wages. Sub‐Saharan Africa is expected to be the main beneficiary of up to 85 million manufacturing jobs which may migrate from China in the next generation (Lin, 2011). Exploiting this opportunity depends on the ability to integrate into global value chains. Surveys of developing country suppliers indicate that transportation costs are the single biggest obstacle to entering, establishing or moving up global value chains (OECD‐WTO, 2013). Developing countries face large trade costs.3 In 2009, trade costs for low income countries were on average 2.5 times higher than those in high income countries. Although trade costs have been falling globally, the rate of change has been slower in developing countries, which are also starting from a higher base (Arvis et al, 2013). Therefore, the relative position of many developing countries is deteriorating, despite better market access. South Africa is an example of this. Some transport costs are exogenous: geographical remoteness lies outside the control of a country. Others, such as the provision and efficiency of infrastructure, regulations governing the transport sector (including the level of private sector participation), and regional transport links, lie within a country’s control. These factors can have a significant effect on a firm’s ability to export. Empirical evidence from Sub‐Saharan Africa indicates that reducing exporting costs by 10 percent through improvements in the efficiency of the trade process can increase exports by 4.7 percent (Hoekman and Nicita, 2009). A one day reduction in inland travel times can lead to a 7 percent increase in exports (Freund and Rocha 2010). Similar large gains are estimated to be possible for Latin American countries: a 1 percent reduction in domestic transport costs are estimated to boost manufacturing exports by 3.9 percent in Brazil, 4.2 percent in Chile, nearly 8 percent in Colombia, and 4 percent in Mexico (IDB, 2013). Further, endogenous factors such as maritime transport connectivity and logistics performance can play a similar role to that of geographical distance in determining trade costs (Arvis et al, 2013). This is an important result as it suggests that a large part of a developing county’s ability to compete in the global market relies on policy factors within their governments’ control.
1.2 Objectives and structure of this paper
This paper provides a detailed case study of South Africa’s port and rail network to understand the scope to lower the costs of trade and support improved export access and competitiveness. This is
3 The definition used by Arvis et al (2013) is a wider definition than the focus of this paper. It defines trade costs as all variable or endogenous costs which drives a wedge between export and import prices. These are: logistics performance, trade facilitation bottlenecks, international connectivity, tariffs, and non‐tariff measures.
3
achieved by exploring the options to improve access to and cost of the port and rail infrastructure. The paper will identify institutional, operational and policy reforms that may deliver on these aims, recognizing that any efforts to improve the efficiency of the freight logistics system must be supported by structural reforms in other key areas to have a long‐term positive impact on South Africa’s export performance. Addressing transport costs is critical to South Africa’s export success, given the country’s global geography and the inland concentration of economic activity. While transport and logistics infrastructure have the potential to be a source of competitive advantage for South African firms, access and pricing policies, along with inefficiencies and delays in the ports and rail network, are eroding the competitiveness of exporters. This situation is not unique to South Africa. The interventions discussed here, while tailored to the South African context, have broad applicability to other developing countries: institutional reforms to promote competition and get the prices right; private sector participation to increase investment and improve service delivery; information and coordination to address market failures and improve access; and cooperation to improve intermodal, interregional and institutional interfaces. The remainder of this paper is structured as follows. Section 2 provides an overview of South Africa’s export performance and the role of transport costs. Section 3 explores the principal challenges identified in the port and rail network, followed in Section 4 by a discussion of the factors underlying these observed problems. Section 5 aims to learn global experiences, exploring how other countries have addressed similar issues through market‐based, operational and policy‐oriented solutions. Finally, Section 6 concludes with some implications and policy recommendations for South Africa.
2 Overview of South Africa’s export performance and the role of transport costs
2.1 Export performance
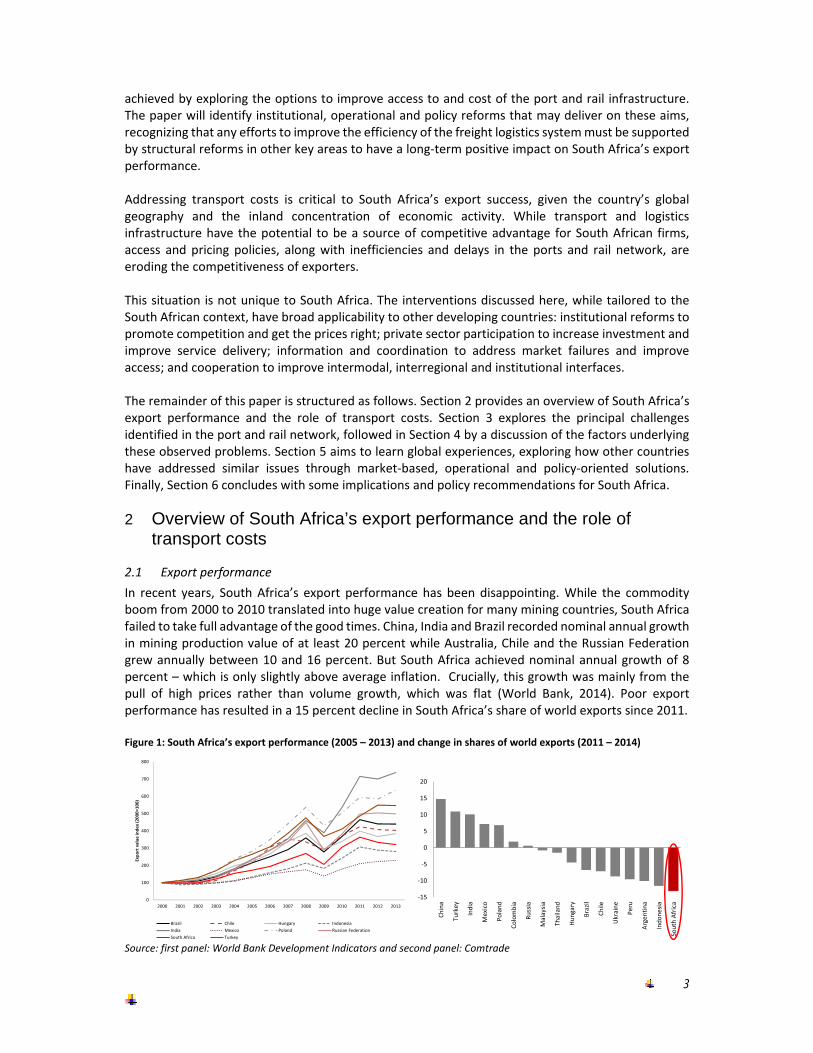
In recent years, South Africa’s export performance has been disappointing. While the commodity boom from 2000 to 2010 translated into huge value creation for many mining countries, South Africa failed to take full advantage of the good times. China, India and Brazil recorded nominal annual growth in mining production value of at least 20 percent while Australia, Chile and the Russian Federation grew annually between 10 and 16 percent. But South Africa achieved nominal annual growth of 8 percent – which is only slightly above average inflation. Crucially, this growth was mainly from the pull of high prices rather than volume growth, which was flat (World Bank, 2014). Poor export performance has resulted in a 15 percent decline in South Africa’s share of world exports since 2011. Figure 1: South Africa’s export performance (2005 – 2013) and change in shares of world exports (2011 – 2014)
Source: first panel: World Bank Development Indicators and second panel: Comtrade
The recent sharp falls in commodity prices have highlighted that South Africa’s export basket can no longer afford to rely so heavily on commodities. However, non‐minerals manufactured exports – driven by chemicals, metal manufactures and automotive products – may not be well‐positioned to take up the slack. Despite some recovery from the crisis, non‐minerals formed a small part in overall export growth: fuel, minerals and basic metal products still accounted for almost 90 percent of South Africa’s export growth since 2007 (World Bank, 2014). South Africa’s exporting firms are highly concentrated. The top 5 percent of South Africa’s exporters account for 90 percent of all exports, with the top 1 percent accounting for close to 80 percent (World Bank, 2014c). These firms are particularly concentrated within the minerals and metals sectors. Recent trends suggest that the most dynamic markets for South African exports lie in the Southern African Customs Union (SACU) and wider regional markets, which is precisely where smaller exporters and exporters in non‐mining sectors are focused.
2.2 Addressing transport is critical to South Africa’s export success
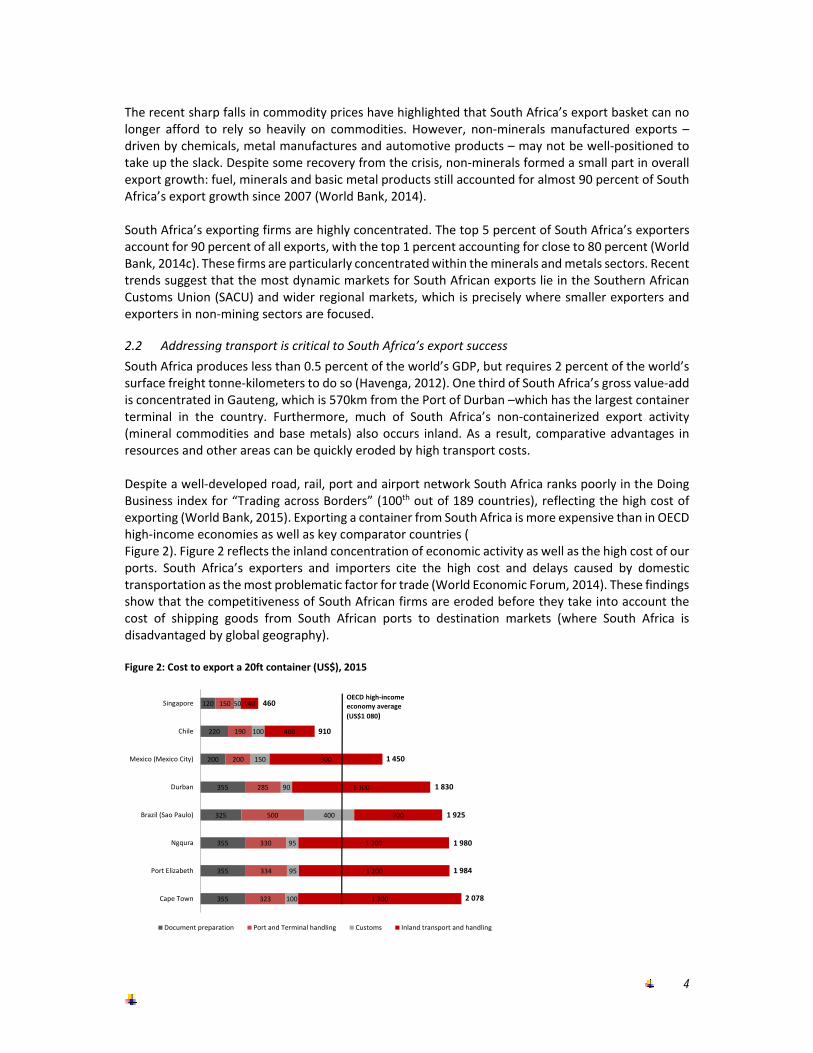
South Africa produces less than 0.5 percent of the world’s GDP, but requires 2 percent of the world’s surface freight tonne‐kilometers to do so (Havenga, 2012). One third of South Africa’s gross value‐add is concentrated in Gauteng, which is 570km from the Port of Durban –which has the largest container terminal in the country. Furthermore, much of South Africa’s non‐containerized export activity (mineral commodities and base metals) also occurs inland. As a result, comparative advantages in resources and other areas can be quickly eroded by high transport costs. Despite a well‐developed road, rail, port and airport network South Africa ranks poorly in the Doing Business index for “Trading across Borders” (100th out of 189 countries), reflecting the high cost of exporting (World Bank, 2015). Exporting a container from South Africa is more expensive than in OECD high‐income economies as well as key comparator countries ( Figure 2). Figure 2 reflects the inland concentration of economic activity as well as the high cost of our ports. South Africa’s exporters and importers cite the high cost and delays caused by domestic transportation as the most problematic factor for trade (World Economic Forum, 2014). These findings show that the competitiveness of South African firms are eroded before they take into account the cost of shipping goods from South African ports to destination markets (where South Africa is disadvantaged by global geography). Figure 2: Cost to export a 20ft container (US$), 2015
120
220
200
355
325
355
355
355
150
190
200
285
500
330
334
323
50
100
150
90
400
95
95
100
140
400
900
1 100
700
1 200
1 200
1 300
Singapore
Chile
Mexico (Mexico City)
Durban
Brazil (Sao Paulo)
Ngqura
Port Elizabeth
Cape Town
Document preparation Port and Terminal handling Customs Inland transport and handling
460
910
1 450
1 830
1 925
1 980
1 984
2 078
OECD high‐incomeeconomy average
(US$1 080)
5
Source: World Bank Development Indicators (2014)
Box 1: Demonstrating the impact of transport costs: The export fruit sector
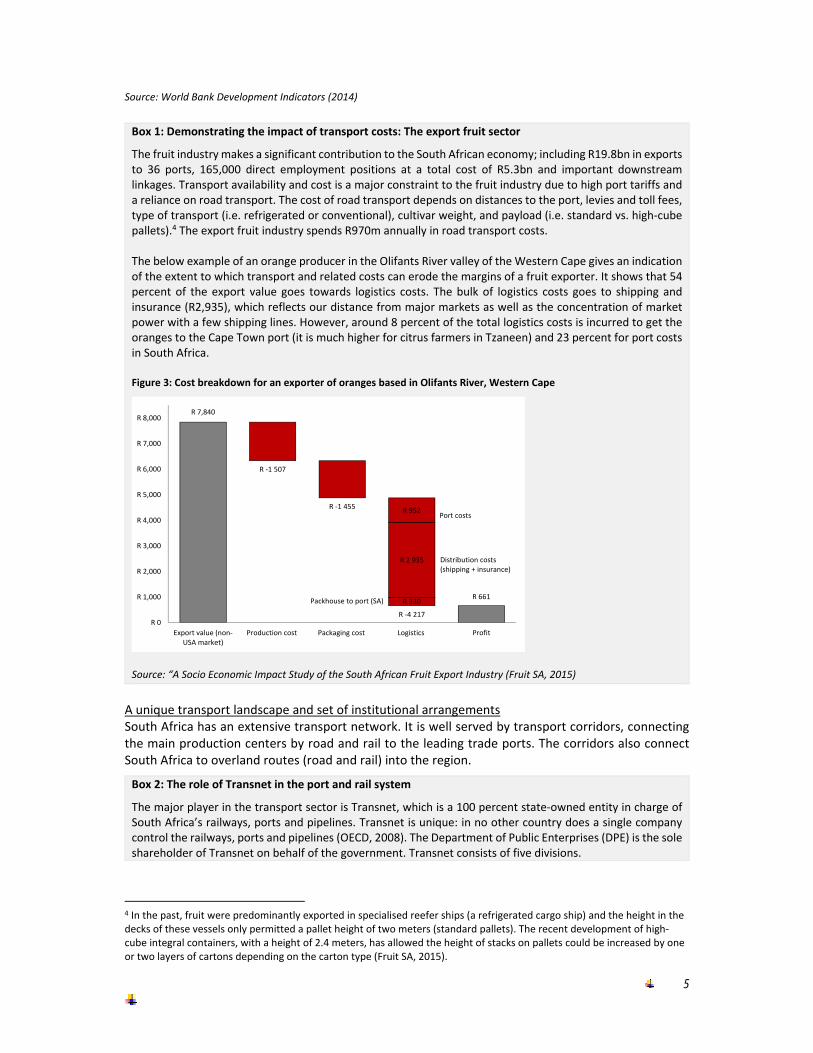
The fruit industry makes a significant contribution to the South African economy; including R19.8bn in exports to 36 ports, 165,000 direct employment positions at a total cost of R5.3bn and important downstream linkages. Transport availability and cost is a major constraint to the fruit industry due to high port tariffs and a reliance on road transport. The cost of road transport depends on distances to the port, levies and toll fees, type of transport (i.e. refrigerated or conventional), cultivar weight, and payload (i.e. standard vs. high‐cube pallets).4 The export fruit industry spends R970m annually in road transport costs. The below example of an orange producer in the Olifants River valley of the Western Cape gives an indication of the extent to which transport and related costs can erode the margins of a fruit exporter. It shows that 54 percent of the export value goes towards logistics costs. The bulk of logistics costs goes to shipping and insurance (R2,935), which reflects our distance from major markets as well as the concentration of market power with a few shipping lines. However, around 8 percent of the total logistics costs is incurred to get the oranges to the Cape Town port (it is much higher for citrus farmers in Tzaneen) and 23 percent for port costs in South Africa. Figure 3: Cost breakdown for an exporter of oranges based in Olifants River, Western Cape
Source: “A Socio Economic Impact Study of the South African Fruit Export Industry (Fruit SA, 2015)
A unique transport landscape and set of institutional arrangements South Africa has an extensive transport network. It is well served by transport corridors, connecting the main production centers by road and rail to the leading trade ports. The corridors also connect South Africa to overland routes (road and rail) into the region.
Box 2: The role of Transnet in the port and rail system
The major player in the transport sector is Transnet, which is a 100 percent state‐owned entity in charge of South Africa’s railways, ports and pipelines. Transnet is unique: in no other country does a single company control the railways, ports and pipelines (OECD, 2008). The Department of Public Enterprises (DPE) is the sole shareholder of Transnet on behalf of the government. Transnet consists of five divisions.
4 In the past, fruit were predominantly exported in specialised reefer ships (a refrigerated cargo ship) and the height in the decks of these vessels only permitted a pallet height of two meters (standard pallets). The recent development of high‐cube integral containers, with a height of 2.4 meters, has allowed the height of stacks on pallets could be increased by one or two layers of cartons depending on the carton type (Fruit SA, 2015).
R 7,840
R ‐1 507
R ‐1 455
R ‐4 217
R 661R 330
R 2 935
R 952
R 0
R 1,000
R 2,000
R 3,000
R 4,000
R 5,000
R 6,000
R 7,000
R 8,000
Export value (non‐USA market)
Production cost Packaging cost Logistics Profit
Packhouse to port (SA)
Distribution costs (shipping + insurance)
Port costs
6
Transnet Freight Rail (TFR) is Transnet’s largest operating division and manages the bulk of the freight rail infrastructure in South Africa. This consists of heavy haul lines for export coal (through the Richards Bay Coal Terminal) and iron ore (through the Saldanha port terminal). The remainder of the network is operated under General Freight Business (GFB).
Transnet Rail Engineering is responsible for rolling stock maintenance.
Transnet National Ports Authority (TNPA) is the landlord for South Africa’s seven major sea ports. TNPA’s business is divided into two key operational areas: port infrastructure and maritime operations. Port infrastructure and maritime services are provided in five market segments: containers, dry bulk, liquid bulk, break‐bulk and automotive.
Transnet Port Terminals (TPT) provides cargo handling services to shipping lines, freight forwarders and cargo owners (there are also private port operators that serve niche markets and do not directly compete with each other or with TPT).
Transnet Pipelines is responsible for its pipeline network (this excludes non‐Transnet pipeline operations, such as those managed by Sasol).
Although this paper focuses on the port and rail system, the road network is an important link in the freight logistics system. The road network maintenance and build is split across national, provincial and municipal jurisdictions. The national road network falls under SANRAL within the Department of Transport, while provincial and urban roads are managed by the relevant provincial and municipal authorities. Road transport services for both freight and passengers in South Africa are provided almost exclusively by the private sector.
3 Problem statement: Rail and port networks are failing South Africa’s exporters
The previous section described the unique environment of South Africa’s transport landscape, both from a physical and institutional perspective. Indeed, the combination of Transnet and privatized road freight service plays a key role in determining the transport logistics choices made by the private sector. This has resulted in freight flows increasingly dominated by road transport. At the time of the first State of Logistics Survey in 2004 road already accounted for 84 percent market share in volume flow. This has increased to close to 90 percent in 2013 (CSIR, 2014). This modal imbalance, combined with poor performance of South Africa’s ports, is central to the transport logistics challenge undermining export competitiveness. Why does rail matter in this context? Why not simply rely on what is a fairly efficient road freight network? There are several reasons why it is important to ensure exporters (and in fact all shippers) have access to an efficient and competitive freight rail network. First, for a substantial subset of transport journeys, rail will be the most cost efficient mode (see Box 3); and for a wider set of journeys some combination of rail and road (intermodal) will be most cost efficient. Thus, if some exporters (particularly smaller and less centrally located ones) are forced to settle for a less cost efficient transport mode, their competitiveness will suffer. Second, the existence of rail as a credible alternative to road has a disciplining effect on the competitiveness of road freight.5 Third, given the fixed cost nature of rail there exists a downside ‘tipping point’ whereby declining competitiveness contributes to lower incentive to invest in the network, which undermines competitiveness still further, leading to a downward spiral. Finally, rail freight minimizes many of the negative externalities posed by road freight which are borne by the state and road users, including: increased congestion; more road accidents; higher harmful emissions; higher road maintenance requirements; and higher logistics cost on poor roads.
5 In many countries, the road freight sector displays cartel behaviour (World Bank, 2011a).
7
This section reviews the main problems that face rail and port network users. It is structured around four main challenges impacting the effectiveness of the export freight network (rail and ports) in South Africa – access, pricing, reliability and interface – and includes a discussion of specific factors that inhibit export competitiveness. The analysis draws on interviews with a wide range of exporters, industry associations, and transporters as well as secondary research to describe the various factors that affect rail and port access and cost.
3.1 Access constraints
The majority of South African exporter firms have limited access to freight rail and associated port services. This includes small exporters but also large firms in non‐traditional sectors. Even traditional exporters of bulk commodities that have historically had preferential access to the port and rail network increasingly face access challenges on the network. Capacity mismatch for heavy haul exports The two heavy‐haul lines for coal and iron ore exports account for 6 percent of the total railway line yet generate 56 percent of tonnage and about 60 percent of the volume density (tonne/km). These two rail links are important to the South African economy: South Africa’s coal exports contributed R54bn in revenue in 2014 and iron ore exports contributed R73bn (Quantec, 2015). As a result, any constraints on these rail lines or the exit ports can have a large impact on the South African economy. Capacity mismatches hamper exports of coal, iron ore and manganese. Despite recent upgrades, the Richards Bay Coal Terminal (RBCT) – owned and managed by the coal exporters – currently has a higher capacity than the rail which supplies it. This creates a bottleneck for the expansion of coal exports. Furthermore, there is no heavy haul line to link the coalfields in Limpopo with the existing heavy haul line from Mpumalanga to the RBCT. The opposite problem exists for iron ore: the Port of Saldanha Bay has a design capacity which is lower than the heavy haul line to the iron ore deposits in the Northern Cape. Both the rail and port are set for upgrades, but it is unclear whether plans to expand capacity at the port of Saldanha (which includes additional port handling infrastructure and berthing capacity) will keep up with expansions on the rail. Manganese exports are constrained by both a lack of rail and port options. South Africa currently exports 7.5mtpa of manganese, but its unconstrained manganese production capacity across current and potential new mines is estimated at 49mtpa (Transnet, 2014a). Transnet plans to create additional rail capacity along a new heavy‐haul line for manganese between the Northern Cape and a new terminal at the Port of Ngqura (the existing 6mtpa manganese terminal at Port Elizabeth will be shifted to Ngqura). However, manganese exports are still likely to be constrained by the available export infrastructure.6 The rising importance of coal and iron ore and the potential of manganese in South Africa’s commodity export basket mean these commodities are critical for overall macroeconomic stability. However, these mismatches between rail and port capacity impose a direct constraint on the export performance of South Africa’s bulk mining sector. Firm characteristics and market failures restrict access to most non‐commodity exporters Exporters outside the large volume minerals commodities face limited access to cost‐effective rail services. This, however, is primarily a function of the economics of freight rail transport. Most non‐traditional exporters – with the notable exception of the automotive sector – have a fragmented volume base (large number of firms which are geographically dispersed), resulting in small, individual
6 In the current environment of low commodity prices (especially for manganese and iron ore), these capacity mismatches are less critical (although they were binding constraints prior to the recent downturn in commodity prices). Also, for some commodities (such as manganese) even when prices improve, South Africa’s role as a largest global producer means that capacity expansions must consider potential impact on prices.
8
volumes without guaranteed consistency of flow. This is fundamentally at odds with the economics of rail. Because rail costs are mainly governed by fixed costs, it is important to optimize equipment and infrastructure utilization to lower unit costs. Thus, pricing for smaller, inconsistent volumes is naturally substantially higher than for large, predictable volumes, where rail operators can enter into long‐term “take‐or‐pay” contracts.7 In the past, when rail had an effective transport monopoly, smaller customers were served by private rail sidings. By shunting small numbers of wagons from marshalling yards, rail tariffs could be set on a “cost plus” basis. However, the advent competitive road freight transport, which has the flexibility to compete more effectively for smaller volume traffic, has resulted in a situation where individual small volume customers are almost never able to be served cost effectively by rail. Therefore, a rail service does not need to compete with those segments that are best served by road transport – it merely needs to capture all “rail friendly” freight that is currently using the road network. But market failures come into play here. Many geographical areas have clusters of diverse economic activity that add up to significant volumes of export freight, most likely on a relatively consistent basis. This is especially significant where these different goods have similar logistics and handling characteristics. But spread across many firms, especially crossing over sectors, lack of information and other challenges inherent in coordination of these volumes prevents the freight market from working as efficiently as it could.
3.2 Pricing constraints
Access is not unidimensional; it depends significantly on pricing. In this respect, both the rail freight network and the ports system have pricing systems in place that are not only costly for the average exporter but highly differential across users. Rail prices are broadly competitive with road, but general freight less so The relative cost effectiveness of rail versus road can vary significantly depending on the commodity transported, the route and the length and frequency of the service (see Box 3). For certain types of freight transport, rail is cheaper than road: rail transport of large volumes of heavy goods based on long‐term fixed contracts can be 3 times cheaper per tonne‐kilometer than road. For low and variable volumes of general goods, the door‐to‐door transport by rail (which still includes a road transport element at both ends) can be more expensive than road. Average rail tariffs are 46 percent lower than road tariffs across a range of cargo products (Transnet, 2008a). This differential is driven mainly by export coal, export manganese and container tariffs, where rail is 67, 53, and 50 percent cheaper than road.8 Transnet has a cost advantage in most commodities in key corridors at long distances. However, the cost advantage is often eroded or lost for shorter distances (e.g. Durban – Gauteng), for time sensitive products (e.g. food), and for different types of cargoes (e.g. breakbulk versus containers). Box 3: Road versus rail: when is rail more competitive than road?
Rail costs are mainly governed by fixed costs rather than variable costs, at a minimum ratio of 70:30 (see Havenga and Pienaar, 2012). To reduce unit costs, high volumes are required and it is necessary to achieve a high degree of asset utilization. This can best be done by operating fixed schedules between well‐equipped and efficient freight end terminals. It is not cost effective to reposition the wagons to pick up a return load from another location, but better to return quickly to pick up a new load. Thus if rail services are not
7 In a “take‐or‐pay” contract, the customer signs a long‐term contract guaranteeing specific volumes and pays the operator the agreed amount whether or not these volumes actually materialize. For the operator, they give up higher fees in return for certainty of the income stream (which is particularly important from a financing perspective); for the customer they give up some flexibility in return for guaranteed access at a competitive price. 8 Containers price per TEU based on NatCor (i.e. Gauteng – Durban)
9
scheduled, it is difficult to be cost competitive with road. Low rail costs are achieved by the loss of service flexibility. Road costs are mainly governed by variable costs rather than fixed costs, typically in the ratio 60:40. Both the cost and infrastructure aspects of road are more flexible than rail. Each truck is allowed a relatively small payload (max of 56 tons in South Africa) and operates as an independent unit. In order to reduce variable unit costs, it is important for trucks to pick up paying return loads, and trucks will often reposition and wait for a return load. Road transport is therefore a flexible and reliable door‐to‐door service, but often more expensive than a similar rail service. It has been shown that many customers are willing to pay more for predictability and faster door‐to‐door services. Therefore, road provides a flexible system able to carry small loads independently, while rail operates from terminals and requires enough freight volume to make up a train.
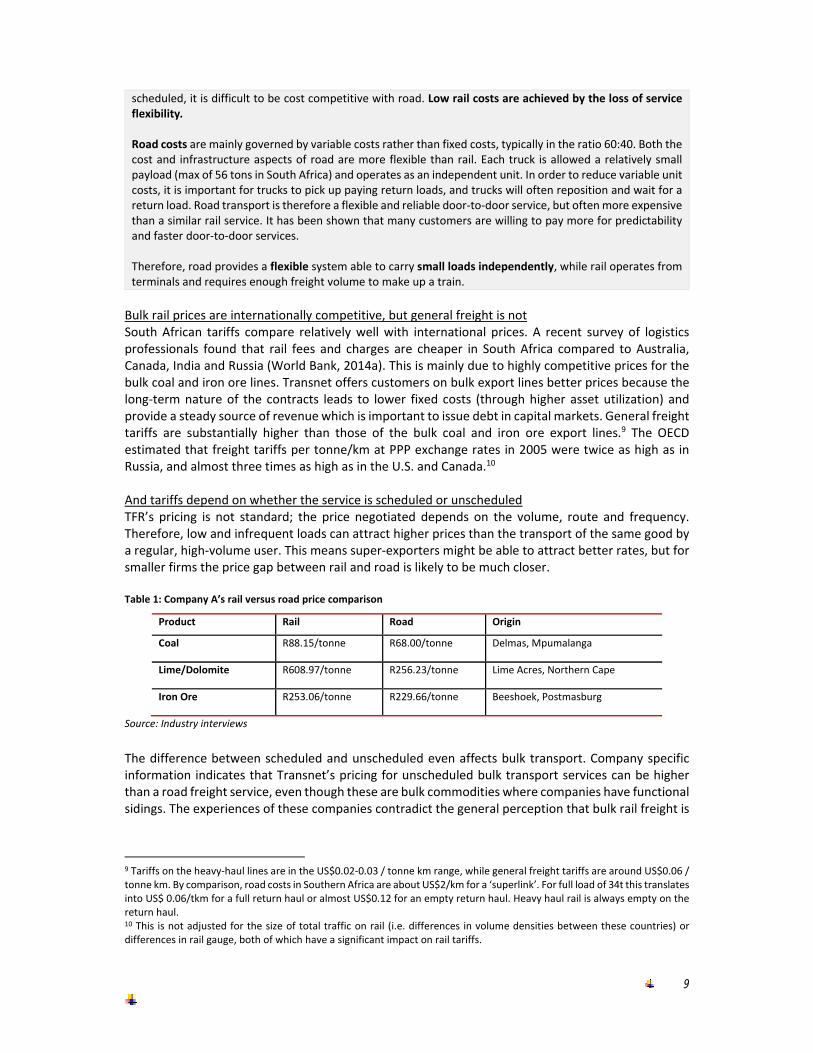
Bulk rail prices are internationally competitive, but general freight is not South African tariffs compare relatively well with international prices. A recent survey of logistics professionals found that rail fees and charges are cheaper in South Africa compared to Australia, Canada, India and Russia (World Bank, 2014a). This is mainly due to highly competitive prices for the bulk coal and iron ore lines. Transnet offers customers on bulk export lines better prices because the long‐term nature of the contracts leads to lower fixed costs (through higher asset utilization) and provide a steady source of revenue which is important to issue debt in capital markets. General freight tariffs are substantially higher than those of the bulk coal and iron ore export lines.9 The OECD estimated that freight tariffs per tonne/km at PPP exchange rates in 2005 were twice as high as in Russia, and almost three times as high as in the U.S. and Canada.10 And tariffs depend on whether the service is scheduled or unscheduled TFR’s pricing is not standard; the price negotiated depends on the volume, route and frequency. Therefore, low and infrequent loads can attract higher prices than the transport of the same good by a regular, high‐volume user. This means super‐exporters might be able to attract better rates, but for smaller firms the price gap between rail and road is likely to be much closer. Table 1: Company A’s rail versus road price comparison
Iron Ore R253.06/tonne R229.66/tonne Beeshoek, Postmasburg
Source: Industry interviews
The difference between scheduled and unscheduled even affects bulk transport. Company specific information indicates that Transnet’s pricing for unscheduled bulk transport services can be higher than a road freight service, even though these are bulk commodities where companies have functional sidings. The experiences of these companies contradict the general perception that bulk rail freight is
9 Tariffs on the heavy‐haul lines are in the US$0.02‐0.03 / tonne km range, while general freight tariffs are around US$0.06 / tonne km. By comparison, road costs in Southern Africa are about US$2/km for a ‘superlink’. For full load of 34t this translates into US$ 0.06/tkm for a full return haul or almost US$0.12 for an empty return haul. Heavy haul rail is always empty on the return haul. 10 This is not adjusted for the size of total traffic on rail (i.e. differences in volume densities between these countries) or differences in rail gauge, both of which have a significant impact on rail tariffs.
10
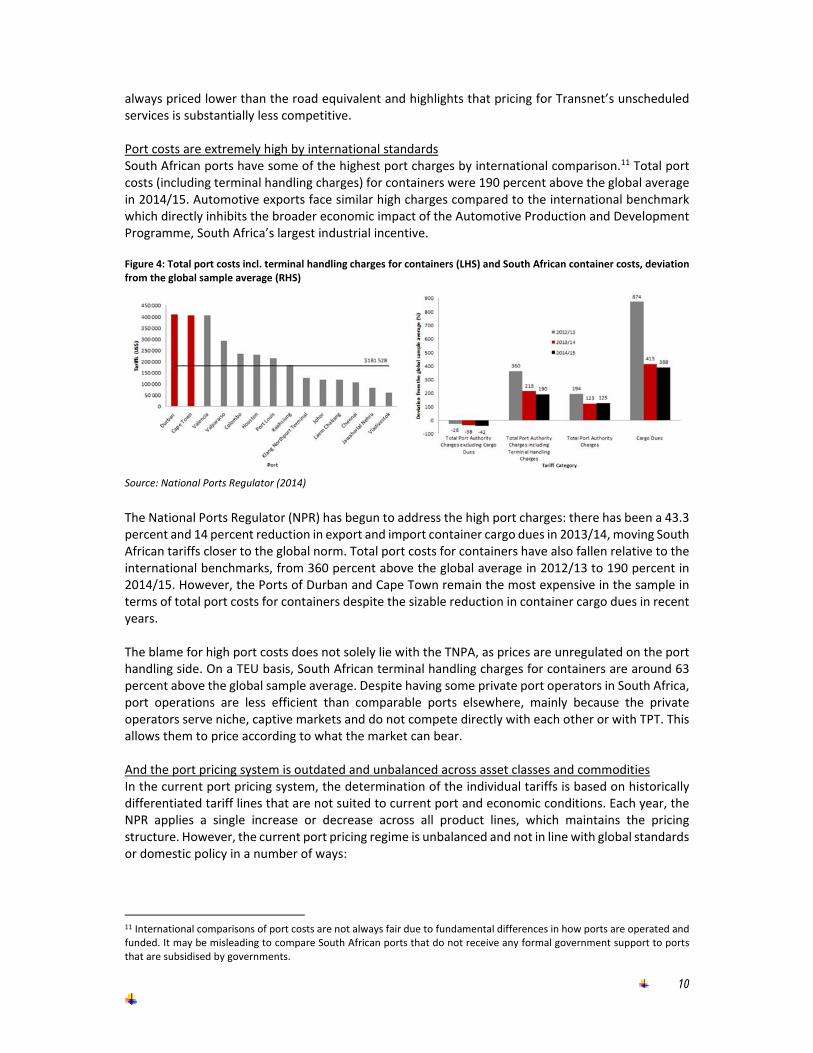
always priced lower than the road equivalent and highlights that pricing for Transnet’s unscheduled services is substantially less competitive. Port costs are extremely high by international standards South African ports have some of the highest port charges by international comparison.11 Total port costs (including terminal handling charges) for containers were 190 percent above the global average in 2014/15. Automotive exports face similar high charges compared to the international benchmark which directly inhibits the broader economic impact of the Automotive Production and Development Programme, South Africa’s largest industrial incentive.
Figure 4: Total port costs incl. terminal handling charges for containers (LHS) and South African container costs, deviation from the global sample average (RHS)
Source: National Ports Regulator (2014)
The National Ports Regulator (NPR) has begun to address the high port charges: there has been a 43.3 percent and 14 percent reduction in export and import container cargo dues in 2013/14, moving South African tariffs closer to the global norm. Total port costs for containers have also fallen relative to the international benchmarks, from 360 percent above the global average in 2012/13 to 190 percent in 2014/15. However, the Ports of Durban and Cape Town remain the most expensive in the sample in terms of total port costs for containers despite the sizable reduction in container cargo dues in recent years. The blame for high port costs does not solely lie with the TNPA, as prices are unregulated on the port handling side. On a TEU basis, South African terminal handling charges for containers are around 63 percent above the global sample average. Despite having some private port operators in South Africa, port operations are less efficient than comparable ports elsewhere, mainly because the private operators serve niche, captive markets and do not compete directly with each other or with TPT. This allows them to price according to what the market can bear. And the port pricing system is outdated and unbalanced across asset classes and commodities In the current port pricing system, the determination of the individual tariffs is based on historically differentiated tariff lines that are not suited to current port and economic conditions. Each year, the NPR applies a single increase or decrease across all product lines, which maintains the pricing structure. However, the current port pricing regime is unbalanced and not in line with global standards or domestic policy in a number of ways:
11 International comparisons of port costs are not always fair due to fundamental differences in how ports are operated and funded. It may be misleading to compare South African ports that do not receive any formal government support to ports that are subsidised by governments.
11
Cargo owners (exporting and importing firms) are currently subsidizing vessel owners and tenants. This division of revenue among the three main players is the main source of the high port charges in South Africa.
Commodity exporters are favored over manufacturing firms within cargo due pricing. The current pricing structure therefore lowers the competitiveness of manufacturers in direct contrast to domestic policies of industrialization.
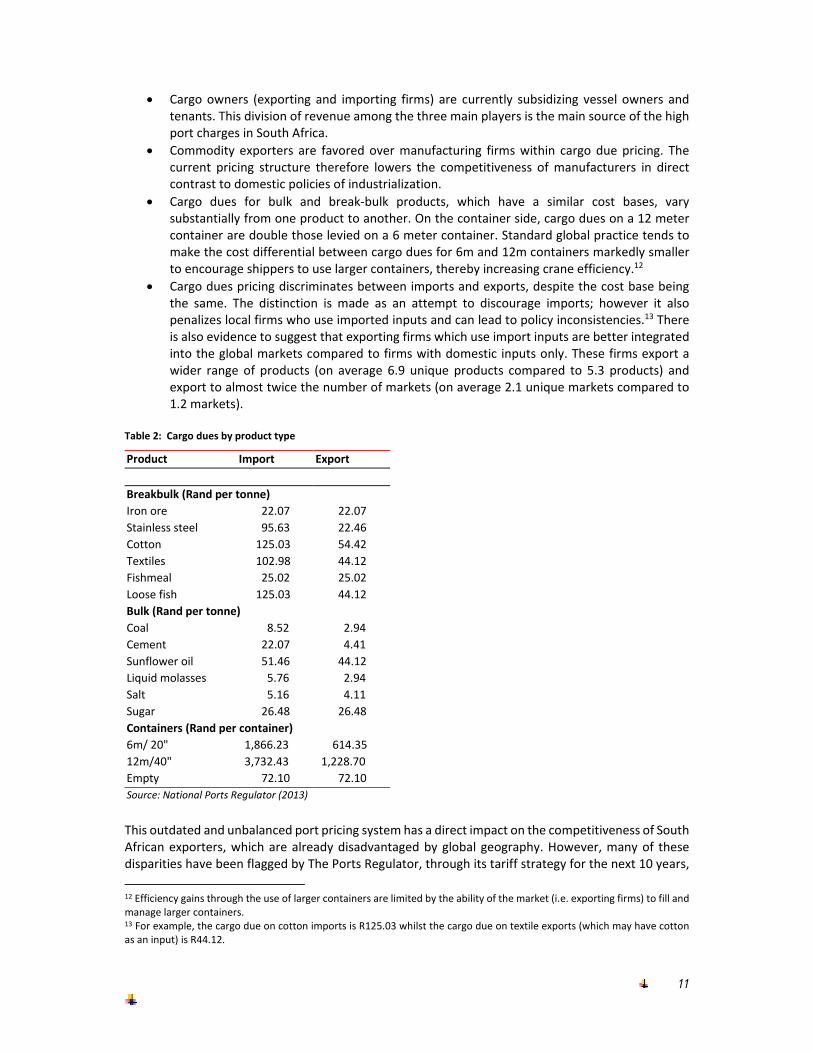
Cargo dues for bulk and break‐bulk products, which have a similar cost bases, vary substantially from one product to another. On the container side, cargo dues on a 12 meter container are double those levied on a 6 meter container. Standard global practice tends to make the cost differential between cargo dues for 6m and 12m containers markedly smaller to encourage shippers to use larger containers, thereby increasing crane efficiency.12
Cargo dues pricing discriminates between imports and exports, despite the cost base being the same. The distinction is made as an attempt to discourage imports; however it also penalizes local firms who use imported inputs and can lead to policy inconsistencies.13 There is also evidence to suggest that exporting firms which use import inputs are better integrated into the global markets compared to firms with domestic inputs only. These firms export a wider range of products (on average 6.9 unique products compared to 5.3 products) and export to almost twice the number of markets (on average 2.1 unique markets compared to 1.2 markets).
Table 2: Cargo dues by product type
Product Import Export
Breakbulk (Rand per tonne)
Iron ore 22.07 22.07
Stainless steel 95.63 22.46
Cotton 125.03 54.42
Textiles 102.98 44.12
Fishmeal 25.02 25.02
Loose fish 125.03 44.12
Bulk (Rand per tonne)
Coal 8.52 2.94
Cement 22.07 4.41
Sunflower oil 51.46 44.12
Liquid molasses 5.76 2.94
Salt 5.16 4.11
Sugar 26.48 26.48
Containers (Rand per container)
6m/ 20" 1,866.23 614.35
12m/40" 3,732.43 1,228.70
Empty 72.10 72.10
Source: National Ports Regulator (2013)
This outdated and unbalanced port pricing system has a direct impact on the competitiveness of South African exporters, which are already disadvantaged by global geography. However, many of these disparities have been flagged by The Ports Regulator, through its tariff strategy for the next 10 years,
12 Efficiency gains through the use of larger containers are limited by the ability of the market (i.e. exporting firms) to fill and manage larger containers. 13 For example, the cargo due on cotton imports is R125.03 whilst the cargo due on textile exports (which may have cotton as an input) is R44.12.
12
aims to address these imbalances. For example the revenue generation will be shifted away from cargo owners (from 60 percent to about 35 percent), onto shipping lines (from 18 percent to roughly 36 percent) over a ten‐year period.14
3.3 Reliability constraints
Setting aside access and pricing issues, of much bigger concern to users of the freight transport network is the reliability of the service. This is increasingly important in a world of global value chains, where firms are part of international production networks and must slot into tightly defined delivery schedules. In this respect, performance of the rail service – including the rail and intermodal terminal infrastructure – and ports falls far short of what is needed to facilitate export competitiveness. Reliability concerns can trump price advantages of rail It is important to distinguish between the heavy haul lines – which are considered world class – and the remainder of the system which is in relatively poor condition. The lack of reliability of rail transport was consistently mentioned by firms as the main reason for using road transport. Frequent train delays and cancellations prompted customers to switch to road haulage, especially for transportation of high‐value goods, and when timing is important. This shift puts severe pressure on the road network. A recent survey of logistics professionals found that the competence and quality of rail services are much poorer in South Africa compared to Australia, Canada, India, China, Germany, the United States and Russia (World Bank, 2014a).15 An analysis of the train transit and turnaround times indicates that the main problem remains with the operation of the intermodal rail freight terminals, both at the port and inland. This includes both the long time it takes for customers to receive goods by rail as well as poor tracking and information systems. Customers demand to know exactly where their goods are at any time, and most road haulers offer this service. There is also anecdotal evidence from company interviews that TFR’s customer interface for unscheduled service is much poorer than the road freight industry – not only are there faster turnaround times for road freight quotes, but the overall levels of service and client engagement is superior to that provided by TFR’s sales agents. The extract below16 highlights the challenges of moving freight by container and by rail:
“…it took between six and nine days on average to transport containers by rail from the Durban port to Johannesburg’s City Deep depot. It took two days to get the container out of the Durban container terminal, two to three days for the train to be dispatched to City Deep and 27 hours in transit. After that, it took anything up to four days before the containers were unloaded at the City Deep depot. The problems have largely been the capacity of terminals to handle containers. By road, it still took two days to get the container out of the Durban terminal but only one day for a truck to deliver it directly to the owner. A third option, which has become the most preferred, was to empty the container as soon as it arrived at Durban port and transport its contents as break bulk by truck. This took four days overall.”
Reliability concerns often trump any price advantages that rail may have, even for long haul. This is particularly important for exporters, which need to get their goods onto a designated ship in order to meet deadlines. Export firms, particularly those plugged into global value chains, can face large penalties for missed delivery deadlines. The risk of these penalties generally outweigh any price advantage that rail may have. As a result, even when investment in improved infrastructure and operations yield reliability improvements, it may still take time to repair the reputational damage before customers change their logistics decisions.
14 Tenants will account for slightly more revenue, from 22 percent to 29 percent. 15 Data available at: http://lpi.worldbank.org/international/scorecard/radar/254/C/ZAF/2014#chartarea 16 Source: Business Report, 19 March, 2014
13
Congestion at the major ports Port efficiency is one of the main determinants of international transport costs. It was found to be most important among six different port characteristics, including: port infrastructure, private sector participation and inter‐port connectivity (Wilmsmeier et al. 2006). The importance of port efficiency for reducing costs of trade is confirmed by Sanchez et al (2003) and Nordas and Piermartini (2004). Port efficiency is usually assessed by evaluating maritime, terminal and hinterland operations. Although South Africa’s port efficiency is in line with African ports on average, it is far below other main ports around the world (OECD, 2014). Durban port, for example, performs poorly in several categories. First, the average turnaround time per TEU handled in Durban is 1.7 days per 1,000 TEUs, which is three times higher than large ports such as Long Beach; Hong Kong SAR, China; New York and Antwerp. Second, crane performance has remained relatively constant around 20 moves per hour per crane, which is well below international standards of 35 to 40 moves per crane per hour. Third, truck turnaround time is targeted to be around 35 minutes while evidence underlines that it is usually above 60 minutes at the DCT terminal. Fourth, because very few of the containers moving through Durban are transported by train (around 15 percent), it causes substantial congestion around the port area. This is amplified by constraints on land availability for container stacking, congestion at the port gate and terminal inefficiencies that have led to increased ship waiting times. These problems are well understood and documented.17 However, it is also important to note that the solution to the congestion does not rely solely with the ports authorities. Practices of the private sector, including lack of coordination and inefficient dispatch practices, contribute to congestion in and around the port.
3.4 Interface constraints
Rail and port users face significant challenges in the key points of interface on the freight logistics network. This includes both modal interfaces (the links between road, rail, and ports) and spatial interfaces (in particular the interface between the South African rail network and the networks of other countries in the region). Lack of effective intermodal operations With the increasing role of containerized freight, intermodal transport offers significant potential to increase efficiencies and reduce costs. Since standardized containers eliminate the need to pack and unpack cargo each time the mode of transit changes, shippers can combine transport modes using whichever combination of road, rail, air, and sea is most efficient to move from point A to point B. Effective intermodal operations require a well‐functioning rail service, adequate ship‐to‐rail infrastructure (e.g. ship‐to‐shore cranes) and new generation rail‐to‐road intermodal terminals in economic hubs (e.g. City Deep in Gauteng). In this model, road freight providers focus on the “last kilometer” and door‐to‐door collection and delivery of freight, which can be further promoted by attracting the customers to locate close to the rail freight terminals. South Africa’s dense corridors (e.g. Gauteng to Durban) are ideal for intermodal transport because the density creates economies of scale due to the large volume of tonne‐kilometers generated (Van Eeden & Havenga, 2010). International research indicates that intermodal transport magnifies these scale effects and initiates cumulative economic growth (Yevdokimov, 2000). A high‐level analysis by Havenga (2012) indicates that if 50 percent of long‐distance heavy intermodal and siding‐to‐siding break‐bulk road traffic could be shifted to a core rail network, it would result in cost savings of 30 cents/tonne kilometer.
17 See, for example: www.engineeringnews.co.za/article/durban‐port‐road‐congestion‐worrisome‐transnet‐2014‐08‐13
14
The capacity constraint on the general freight rail corridors is not the mainline track infrastructure since there is spare capacity on the line. The capacity and operational constraints are in the end terminals – port and inland container depots. If the end terminals are unable to turn the trains around quickly or dispatch incoming containers quickly, then there will be a problem with storage space and terminal capacity. The efficiency of the cranes will also be affected because crane moves per hour will be limited if the containers cannot be moved to stack, road or rail. The City Deep terminal capacity, which is South Africa’s largest inter‐modal terminal and therefore essential to a well‐functioning rail network, was expanded to 280,000 TEUs in 2012 through infrastructure upgrades and additional cranes. Plans are underway to further increase the City Deep terminal capacity to 400,000 TEUs by 2016 and to 700,000 TEUs by 2019.18 The City of Johannesburg, in partnership with the Gauteng Department of Roads and Transport and SANRAL, plans to invest a further R122 million in roads leading to the City Deep terminal over the next few years.19 These and the other investments in City Deep will address many of the previous infrastructure constraints that contribute to the current underutilization of the City Deep terminal. However, these investments will not have the desired impact unless operational efficiency (as measured, for example, by train turnaround time or crane movements) is also improved. In addition to the City Deep Terminal, there are also several private sidings or terminals in City Deep managed by Grindrod, MSC, Bridge Shipping and others that are served by rail. However, since none of these private terminals are able to handle full length trains, these trains must be split and hauled to the private operators by shunters, which has a large negative impact on operational efficiency. Barriers to regional rail There are five connections between the Transnet rail system and the regional SADC network:
The north‐south corridor via Beit Bridge connecting to Zimbabwe (through the privately operated BBR railway) and further north to Zambia and the Democratic Republic of Congo.
The Botswana Rail system via Mafikeng and Ramatlabama
The CFM rail system to the port of Maputo via Komatipoort, a short 80km rail route for South African mining and agricultural exports.
The Swaziland rail system, essentially serving South African transit traffic to Richards Bay and Durban.
The Namibian rail system (Transnamib) at Upington / Nakop, isolated from the larger SADC railway network.
During the 1990s, regional railway performance declined to the point where some regional governments could not sustain the increasing operating losses. A process of concessioning the railways to private operators was implemented, but after only a few years several of these concessions failed (e.g. in Zambia, Mozambique, Tanzania, and Kenya). The functioning of some these railway systems has subsequently declined further due to lack of capital for investment and severe shortages of working capital, which led to deferred maintenance of both infrastructure and equipment and poor reliability and predictability of operations. As a result, coordinating and managing cross‐border rail services became increasingly difficult. The downward spiral most regional railways were experiencing led to frequent locomotive failures, and long delays at borders. For example, transit time between Ndola in Zambia and Durban in South Africa increased to 30 days, nearly four times longer than road services. The NRZ rail system in Zimbabwe
18 It is unclear whether the expansion plans for City Deep are sufficient or whether there is (another) risk of underinvestment for future container traffic. 19 Source: http://www.joburg.org.za/index.php?option=com_content&view=article&id=9441:citys‐freight‐hub‐gets‐a‐revamp&catid=88:news‐update&Itemid=266
15
declined from a maximum volume of about 15mtpa to 12mtpa in 1999, and to around 3mtpa in 2014. Cross‐border rail services between TFR and BBR at Beit Bridge has declined to around 0.2mtpa. The virtual collapse of the regional rail services prompted governments to take action with renewed focus on regional railways supported by interest from large and resourceful private sector investors. Significant improvements have taken place over the past 2 to 3 years, with transit times becoming more predictable and costs declining. Although locomotive changes still take place on the borders (a major cause of delay in the past), it is now more coordinated. Among the most important improvements in recent years was the establishment of a Joint Operating Centre (JOC) in Bulawayo to control and monitor the railway operation on the north‐south corridor (a similar JOC has been operating successfully on the Maputo Corridor). In addition, several new routes are in the planning stages, including a new link to Swaziland via Lothair in Mpumalanga, in order to provide more capacity on the export coal line, and a link to Botswana via Lephalale, primarily to serve future Botswana coal exports via South Africa.
4 The underlying reasons In this section, we explore some of the reasons why the port and rail network currently fails many of South Africa’s exporters. Many of these were first raised in the National Freight Logistics Strategy (NFLS) of 2005, but they remain critically relevant.
4.1 Chronic underinvestment in the rail and ports network
A recent history of underinvestment Between 1910 and 1970 the rail sector was protected and competition from road was limited through regulation of road transport in terms of tonnage and licensing requirements. Since then road has been deregulated. At the same time investment in the rail sector fell and continued to do so until the recent Transnet MDS, which has prioritized freight rail. For example, the average age of locomotives in 2005 was 25 years, whereas the international best practice average is 16 years (Department of Transport, 2005). The majority of the signaling systems date back to before the 1960s and most of the locomotives and rolling stock are also aging (CSIR, 2014). The deferred spending on maintenance and replacement of the rolling stock and signaling equipment led to a progressive decline in the quality of rail infrastructure that, coupled with operational inefficiencies, led to a rapid loss of market share. While TNPA is Transnet’s most profitable business, a large share of its profits has been diverted to support other divisions (see Section 4.2), rather than being invested into maintenance and upgrading of the port system’s critical assets (OECD, 2008). As a result, the capital requirements of the port system remain substantial. Transnet has recognized the need to reverse this historical legacy of underinvestment in transport and in 2012 it introduced an ambitious market demand strategy (MDS). The R300 billion investment strategy is aimed at expanding and modernizing the country’s port and rail infrastructure over a period of seven years. Emphasis on maintenance versus upgrading Investment can either upgrade or replace old infrastructure and equipment, or it can be used for the refurbishment of existing infrastructure. The National Rail Policy Green Paper (Department of Transport, 2015) found that TFR’s 2011 capital spend of R12.5bn consisted of 65.6 percent sustaining capital and 34.4 percent upgrading of capital. In 2013, R16.2 billion of the R27.5 billion invested across all Transnet divisions was spent on maintenance of existing infrastructure (CSIR, 2014). Assets are therefore being refurbished and not replaced with higher performing ones. This is across all main corridors and does not only reflect branch lines. In an environment where there is little private sector
16
participation in the freight rail sector and upgrading assets is more expensive than refurbishment, financing for these assets can be inhibited by the strength of Transnet’s balance sheet as well as the ability of customers to absorb higher rail tariffs that may be required to finance replacement assets. Irrespective of the drivers, an emphasis on maintenance contributes to a long‐term decline in competitiveness of the rail system. It is more difficult to achieve a shift from road to rail in a context where existing rail assets (both infrastructure and rolling stock) are obsolete. In contrast, road competitors raise their inherent competitiveness with every investment in new trucks that consistently raise the technology bar (Department of Transport, 2015). This reflects the fact that investing in new trucks is much easier and cheaper than investing in new rail equipment such as locomotives and rolling stock, especially when there is no private sector participation in freight rail and a single state owned company (SOC) has to carry the full financial burden. Can underinvestment be a structural problem? Various factors influence whether large infrastructure investments take place, including: (i) the availability of capital in the market; (ii) the risk‐weighted return of the project; and (iii) the attractiveness of alternative investment opportunities and the performance of similar infrastructure projects (Ernst & Young, 2011). With respect to large port and rail infrastructure investments undertaken by Transnet, a first hurdle faced by these projects is that they compete for finance against other projects across the various divisions of Transnet. Once approved, these significant and material transactions have to comply with Section 54(2) of the Public Finance Management Act (PFMA), which requires submitting information about the transaction to the Treasury and the Minister of Public Enterprises, before they are approved. Taken together, the competition against other projects within Transnet, the requirement to present a viable business case and the limitations of Transnet’s balance sheet, means that key infrastructure projects may remain unfinanced. An example of this is the Waterberg Heavy Haul Coal Line, which is a key strategic project that has not taken place due to financial constraints. This is detrimental to the broader economy and also to regional integration, given its potential importance in linking the bulk commodity sectors in Botswana to export markets. Projects can also remain unfinanced in the situation where key players refrain from investing due to the reliance on each other to initiate the project. For example, Transnet is unable to invest in a new coal line if it requires a “take‐or‐pay” contract with mining companies who are reliant upon Eskom to decide on a cost‐plus coal pricing formula for non‐exported coal. Eskom is unable to determine a pricing formula as they are dependent on Transnet to invest in the rail infrastructure. These “catch‐22” situations may require the government intervention to de‐risk investment projects and induce the private sector and SOCs to co‐invest in projects that they would otherwise refrain from pursuing.
4.2 Ineffective regulation
The failure to invest appropriately in the core freight transport infrastructure is partly a function of a regulatory system that has failed to manage pricing, promote competition and eliminate practices like cross‐subsidization. Inadequate regulatory framework South Africa has a fragmented approach to economic regulation of the transport sector. There are regulators in aviation and ports, yet there is no explicit economic regulation of rail and roads. The tariffs of two of Transnet’s operating divisions, namely Pipelines and National Ports Authority, are regulated by independent regulators. Tariffs for freight rail and port terminal operations are set by the Transnet management (as per the shareholder compact with the Department of Public Enterprises) and are therefore unregulated.
17
South Africa’s current freight rail regulatory regime does not possess most of the features of economies that perform well on the basis of volume growth, volume density, train performance and staff productivity. The freight rail regulatory regime lacks a settlement process; rules on pricing, investment and access; and an independent regulator with legislated investigative, enforcement and decision‐making powers. The same applies to the terminal operations at South Africa’s ports – TPT manages 16 cargo terminal facilities across the South African ports. Although many private companies are involved in the port terminal operations, they mostly operate in individual markets and do not compete with TPT, or with each other.20 Department of Transport plans to improve the regulation of the sector by establishing the STER. At this stage the STER is proposed to cover road, rail, aviation and maritime transport. It is intended that the STER will be self‐funded through a surcharge levied on the regulated entities, based on the cost of regulating a particular sector. If this is insufficient, the STER can be funded through the money appropriated by Parliament. Failure to force transparency in cross‐subsidization Transnet’s centralized structure (where a single CEO and board approve decisions for all of its operating divisions) allows the company to move funds between operating divisions. As a condition of the petroleum levy and the National Ports Act, Transnet is required to corporatize its Pipelines and National Ports Authority operating divisions. Transnet has indicated that the corporatization of these two operating divisions is likely to have a material financial impact – it raises capital using its complete balance sheet – and could constitute a default of its funding agreements (Transnet, 2014b). There are two types of cross‐subsidization that takes place within Transnet: (i) cross‐subsidy within an unregulated sector between consumers of the same output (within a vertically integrated entity – e.g. TFR); and (ii) cross‐subsidy between regulated and unregulated sectors which have economically distinct outputs (within a horizontally integrated entity – Transnet) (Heald, 1997). The first type occurs within TFR between the heavy haul and the general freight businesses. In this case, a certain degree of cross‐subsidization is unavoidable: there are costs that are common to both business units. Even strict accounting rules for the separation of are unlikely to prevent this. The second type of cross‐subsidy occurs, for example, from the profitable Pipelines and National Ports Authority divisions to the rest of Transnet. The National Ports Authority, which generated 22 percent of its EBITDA and 13 percent of its revenue, received only 9 percent of its capital investment. This is not a once‐off anomaly, using historic financial data it is clear that it reflects a trend: despite TNPA being one of Transnet’s most profitable divisions, its share of total investment has declined in recent years. Profits from Transnet’s more profitable divisions are being diverted to the freight rail division to correct for historical underinvestment.21 This diversion of profits may have the unintended consequence of undercapitalizing key components of the freight logistics network, such as the port system, in order to compensate for years of underinvestment in freight rail. Also, it is possible that cross‐subsidization delays Transnet’s response to the competitive pressure from road haulage: profits generated in the export commodity lines and other businesses to some extent permit continued underperformance of the general freight business. Cross‐subsidies continue to distort the incentives for efficient cost recovery which prevents a business from improving capacity allocation, responding to user needs and maximizing cost‐recovery for use of infrastructure.
20 Examples include the RBCT operated by coal producers, the SA Sugar Terminal operated by the South African Sugar Industry Association and handling of the bulk petroleum cargo. 21 This is based on an analysis of data from 2010 to 2015. The unavailability of earlier data prevents an understanding of historical trends in cross‐subsidisation. For example, it may be that historical underinvestment in rail is partly due to the fact that the port system previously received the bulk of investment based on a more attractive return on investment (ROI). One could argue that the ROI for investment in freight rail versus port infrastructure was skewed by an unlevel playing field between road and rail as well as port tariffs that are very high by international standards.
18
Box 4: Subsidizing freight rail
Although many rail services have close substitutes in other transport modes, these other transport modes are, in most cases, not yet efficiently priced (i.e. reflecting all infrastructure, accident, environmental and congestion costs). For example, although there are individual exceptions, it is not yet common for road prices (where they exist) to vary with congestion levels. If the road mode is underpriced, it is economically efficient (if only second best) to also underprice the rail mode, with associated subsidies if necessary. In the absence of government intervention, the price of rail services would be too high and the consumption of rail services would be too low relative to other transport modes. Due, in part, to this mispricing of substitute modes virtually all OECD countries subsidize the rail sector in some way. Source: Structural reform in the rail industry (OECD, 2005)
One could argue that Transnet’s general freight rail business operates in a distorted market since it competes with a road freight sector which is not efficiently priced. However, this cannot justify opaque cross‐subsidies. Without adequate controls and efficiency incentives, cross‐subsidies could be costlier to the economy as a whole than transparent transfers and open tenders for infrastructure upgrading and services provision (Stoerer and Teljeur, 2003). The current opaque method of cross‐subsidization, determined by a commercial entity is highly undesirable.
4.3 Highly competitive road freight sector that benefits from an unlevel playing field
The regulatory environment of South Africa’s freight transport sector not only impacts relative modal efficiencies through its impact on pricing and investment decisions in rail and ports directly, but also through the competition it creates in the road freight sector. Deregulation and increasing dominance of the road freight sector The deregulation of road freight transport allowed firms to compete with the rail sector, and it started to gain in market share from the 1990s. Growing market share led to large investment by road transporters and logistics companies, particularly in the 2000s based on strong economic growth. The relatively low barriers to entry also meant that several new companies entered the market while firms divested from in‐house logistics to focus on core operations. The privately owned and operated road transport carriers quickly responded to the new market conditions (e.g. developing the new 56 tonne GVM Superlink truck), whereas the railway did not. As a result, the road freight sector is highly competitive, even in the transportation of bulk goods over long distances, which is typically the where rail freight should be most competitive. Dry bulk, used in domestic steel, energy and construction industries, represents the majority of domestic freight in South Africa in volume terms. And more than 80 percent is moved by road (CSIR, 2014). For agricultural goods the road bias is even higher, only 4.4 percent of agricultural dry bulk flows are moved on rail. In terms of containers, road transport also dominates. Of the 964,000 containers that were exported through South African ports, only 15 percent arrived at the ports by rail (Transnet, 2014a). High levels of competition and a privileged regulatory environment The competitiveness of road compared to rail is in part due to the high levels of competition within road transport. The deregulation of freight transportation led to increased supply from new trucking companies, causing road freight tariffs to fall. There is a degree of consensus among transport officials that the growth in road freight transportation has been too fast and that some freight should be encouraged to return to rail. There is concern that the level of competition in the trucking industry is excessive and destructive. The weak economic climate, combined with increased trucking capacity has intensified competition, reducing tariffs further for road freight. The intense competition, combined with a lack of enforcement, has contributed to trucking operators overloading their vehicles,
19
neglecting maintenance, re‐equipping their existing fleets over purchasing new vehicles and encouraging drivers to speed and work long hours to remain competitive. Road transporters enjoy several advantages that have eroded the ability of railways to compete effectively against rail. These include: (i) high gross vehicle mass (GVM) limits of 56 tonnes which is higher than the international norm;22 (ii) high rates of overloading of trucks and a lack of enforcement; (iii) externality effects such as congestion, emissions and accidents not internalized into road freight transporters’ cost base; and (iv) inadequate road infrastructure charging to road freight operators (Department of Transport, 2015). These advantages held by road transport have contributed to making rail uncompetitive in market segments where it should inherently outcompete road freight. This not only has implications for on‐going investment in rail but has wider consequences for South Africa.
4.4 Limited private sector participation in terminals and branch line operations
Increasing investment in the freight logistics system and improving service provision to the export sector could benefit significantly from greater private sector participation, both in investments and, more critically, operations. Many other countries partnered with the private sector to make investments needed to enable their railway system to transition from the terminal decline phase to a new railway growth curve (e.g. investments in standard gauge to enable greater speeds and heavier loads as well as double stacking). Similar approaches have expanded capacity and improved performance in ports. Allowing private sector participation also encourages competition to stimulate effectiveness and efficiency within the sector. Private sector participation can range from on‐rail competition on open access infrastructure, to parallel competition among vertically integrated railways that serve the same origin and destination areas (Department of Transport, 2015). Despite Transnet having a clearly articulated private sector participation (PSP) strategy, there is currently very little private sector involvement in the port and rail network. Transnet’s current approach to PSP involves evaluating each opportunity on a case‐by‐case basis. As a result, PSP takes place mostly in cases areas where specialist private sector expertise is necessary (e.g. intermodal terminals to consolidate volumes) or when an investment is not funded by the MDS (e.g. Operation Phakisa oil and gas investments at selected ports). Failure to secure private sector participation to maintain branch line network Of South Africa’s 939 mtpa of total surface freight transported, 66 mtpa or 7 percent travels next to or on branch lines, but only 9.1 mtpa of this is currently on rail (Simpson and Havenga, 2010). Rail branch lines, which are characterized by multiple origin‐destination pairs, single wagonloads, multiple loading sites, low axle load limits and diesel traction (Department of Transport, 2015), traditionally played a critical role in serving rural communities and the agriculture industry in particular. However, their increasing unprofitability together with the regulatory shift in favor of road has contributed to their decline. Although public‐private arrangements have been put in place in many countries to support branch line operations, this has failed to take hold in South Africa. In cases where private entities have negotiated access arrangements to branch lines with TFR, these arrangements tend to be very limited and confined to discrete areas associated with private sidings attached to agricultural, manufacturing or mining facilities (Department of Transport, 2015). Similarly, attempts to interest the private sector in operating selected branch lines have been unsuccessful. Existing private sector rail operators (e.g.
22In most European countries it is 40‐44 tonnes, including the UK. In the USA the maximum GVM is 36 tonnes, unless a special permit is granted. When the maximum GVM was raised to 60 tonnes in Sweden, virtually all freight transport moved to road and the rail services focused on passenger transport
20
Grindrod and Sheltam) as well as potential operators (e.g. Imperial Logistics) were interested but ultimately did not participate because the conditions were not attractive enough. This is likely related to several factors, including:
The volumes were unable to generate enough revenue to cover the fixed infrastructure costs based on the access fee charged by Transnet.
The viability of some branch lines depends on passing through the main network, which requires a shared operational interface with the mainline operator.
Transnet would prefer to lease its own rolling stock to national and regional operators on branch lines at a daily hire charge, while many private sector operators would prefer to operate their own rolling stock.
Related to branch lines is the issue of sidings, which connect many private enterprises in industrial areas throughout South Africa to the rail system. Many of these sidings are no longer operational, and many have been lifted, because serving them with small numbers of rail wagons is no longer financially viable. The general rule is that customers have to pay for the siding construction and its maintenance, which is then operated by TFR or privately (as in the case for many mines). Furthermore, the railway safety regulator demands that all owners of private sidings must be registered as an operator.23
4.5 Weak and patchy regional integration
Given the large and growing importance of African regional markets for South African exporters, in particular for smaller exporters, the efficiency of the freight transport network to support regional cross‐border trade is critical. A number of barriers – both policy and operational in nature – continue to restrict the flow of trade across borders. Border inspections contribute to unnecessary delays for freight The main constraint to effective regional road freight transportation is a lack of harmonization of standards and pricing across SADC. There are also non‐tariff barriers that exist across SADC that inhibit the ability of road transporters to move cargo across the region. These range from regular harassment by traffic and police officials, imposition of incorrect fines or parking fees or withholding taxes at border posts and illegal impounding by traffic officials. Despite these restrictions and barriers most firms continue to rely on road transport into the region. However, the nature of cross‐border traffic (most of which is long distance) should be ideal for rail. In practice rail freight often faces long delays in moving across regional borders in Southern Africa. The result is that transit and turnaround times for cross‐border freight on rail in the region are typically longer than for road freight. One reason for this is unnecessary border inspection. Goods on rail should be able to be cleared either at the port, an ICD in the origin or destination country, or in the factory of the importer or exporter. In the absence of a specific identified risk, trains should not be stopped for inspection en route.24 But stops at the borders, more often for immigration checks on staff working on the trains than for goods inspection, are very common. The unnecessary stops are aggravated by the operations of borders in the region. First, the use of one‐stop border posts (OSBPs) remains in its infancy. Chirundu (between Zambia and Zimbabwe) and Mamuno (Namibia‐Botswana) are in place, and OSBPs are being planned at Resano Garcia (South Africa‐Mozambique) and Beitbridge (South Africa‐Zimbabwe). However, even those that are in place are still largely about shared infrastructure and not truly integrated border
23 Although many municipal‐owned sidings have been neglected and abandoned, there are some that are maintained by Transnet to ensure safe operations. 24 Even in the case of freight carried on board passenger rail, immigration procedures can be carried out at origin or destination or while the train is in motion.
21
posts, so delays remain. Second, with the exception of Beitbridge, no border post in the region operates on a 24 hour, 7‐day‐week basis, resulting in significant queuing and delays. The biggest factor contributing to delays in cross‐border rail movement are not related to customs, immigration or other border‐related procedures but instead the lack of coordination among national (monopolistic) rail systems in the region. Specifically, the problems relate to a lack of reciprocal access rights among national operators and a failure to coordinate operational planning. For example, locomotives from country A may not be allowed to operate on the network in country B because the operator of the network in country B cannot guarantee technical assistance to broken locomotives belonging to another operator (AICD, 2011). As a result, locomotives often stop at the border and hand over to another operator, leading to long interchange delays. An analysis on the north‐south corridor (AICD, 2011) indicated that a rail journey of 3,000km from Kolowezi (DRC, near the Zambia border) to Durban can take up to 38 days to complete, of which 29 days are spent at the border due to delays – resulting in an effective speed of less than 4 kilometers per hour. Reducing border‐related delays will have a huge impact on the viability of rail for regional traffic.
5 Policy options based on international experience
It is clear from the assessment above that a range of reforms are needed to deliver a more accessible and competitive rail and ports sector. This section identifies policy options based on examples from other countries that have implemented these approaches successfully and as well as the key principles that were identified in the National Freight Logistics Strategy. It is focused around 4 broad interventions:
Institutional reforms to promote competition and get the prices right
Private sector participation to increase investment and improve service delivery
Information and coordination to address market failures and improve access
Cooperation to improve intermodal, interregional and institutional interfaces
5.1 Institutional reforms to promote competition and get the prices right
The institutional landscape that governs the port and rail system in South Africa is unique: in no other country does a single entity manage port and terminal operations as well as the freight rail system. Furthermore, although Transnet has a complete monopoly across many of its operating divisions, not all its activities are regulated by an independent regulator. Delivering a more broadly accessible and competitive rail and ports sector may therefore require a reform of the institutional landscape.
5.1.1 Regulation for competitive pricing
The pricing of South Africa’s port and freight rail system is uncompetitive by international standards. The high cost of domestic transportation is cited by exporters and importers as the most problematic factor for trade. This can be attributed to three factors: (i) the lack of an economic regulator for rail (Transnet sets its own tariffs and performance standards, which are monitored by the DPE through the shareholder compact); (ii) Transnet’s monopoly in the rail and port network and resultant cross‐subsidization that takes places within Transnet which may obscure inefficiencies; and (iii) a lack of competition due to the very limited private sector participation in the port and rail system in South Africa. Addressing these three factors is likely to contribute to lower port and rail prices and boost the competitiveness of South African firms. Below we look at how other countries have addressed these factors and draw on some of the international best practice. Regulating the freight rail industry In freight rail there is no single best practice model because regulation needs to reflect the characteristics of the rail sector of a particular country. Globally, most railways tend to be vertically
22
integrated (i.e. infrastructure and services are provided by the same company, usually state‐owned). Formerly planned economies (such as China, India and Russia) have vertically integrated railways, with one dominant operator, where price and quality are regulated by ministries or state entities. The US uses light‐touch regulation of its vertically integrated private railways, whereby the entity negotiates its tariffs with shippers. The regulator only sets tariffs when there is a customer complaint. The EU and Australia have unbundled railways and allow competing operators access to the infrastructure. There, regulators do not regulate the final market, but ensure fair access and encourage competition. The institutional structure of regulators differs between countries. Larger economies, especially in Europe, tend to have dedicated rail regulators (e.g. UK, France and Italy). Small and developing countries favor multi‐sector regulatory models (although the US, Canada and Germany are large country exceptions here). According to the World Bank’s Port Reform Toolkit (World Bank, 2007), a multi‐sectoral agency – such as the proposed STER – is well suited for developing countries that lack the necessary financial, human and administrative resources to develop separate agencies. It should also avoid regulatory capture by a specific industry or ministry and support integrated transport planning. A multi‐sectoral agency may not promote in‐depth sector‐specific expertise, but this can be addressed by some technical specialization within the agency. Bolivia and Peru are the leading countries in the introduction of a new generation of transport agencies, inspired by the integrated US model. These agencies cover all transport sectors and have their own sources of funding, gathered from fees, and rely on this funding to subcontract skills which they lack in‐house. Both these countries have regulatory agencies that are much more independent from policy makers than the US case. Regulatory best practice advocates a financially independent regulator, free from state intervention. As an example, the UK’s rail economic and safety regulator is independent and funded through license fees and safety levies. It is accountable through parliament and the courts, but members of the board are appointed by the Secretary of State for Transport, contrary to recommendations by the World Bank (2007). International experience highlights the importance of the intervention of a regulator in service quality standards, infrastructure investment and access to infrastructure. Financial and political independence is deemed vital for an effective rail regulator. However, there is no best practice approach for the institutional structure or tariff methodology. Addressing cross‐subsidization within network industries If the activities of Transnet’s freight rail division become regulated, it will likely contribute to a fairer pricing regime as well as better service quality. However, because Transnet is a horizontally integrated entity, it could respond to economic regulation by becoming a more efficient organization or choose to mask inefficiencies by subsidizing TFR using profits from other profitable divisions. Eliminating cross‐subsidies within network industries can contribute to efficient cost recovery (Pietrantonio and Pelkmans, 2004). Forcing out cross‐subsidization reveals all sources of cost generation, failures and responsibility in the management of services. This creates incentives for good management: having identified the real sources of costs, a business entity is able to minimize that source, eliminate practices which inflate costs and invest in innovative technologies to reduce costs. The discovery of the "true" costs of providing a service (or at least the discovery of what costs are excessive or wasteful), may prompt optimal management decisions focusing on core activities or proper outsourcing of non‐core business.
Box 5: Eliminating cross‐subsidization by unbundling a vertically or horizontally integrated entity
Removing and preventing cross‐subsidization creates fair conditions for potential entrants as well as other direct competitors outside the affected industry. Horizontal and vertical separation is necessary to discover
23
the “true” costs of running a large network operator and the required subsidy level to allow safe and reliable infrastructure and the services associated with it (Pelkmans, 2001). Many countries have implemented the vertical separation of their freight rail sectors by separating railway infrastructure from operations. This is because in the freight rail sector the natural monopoly element can be found mainly or only in the infrastructure that rail operator relies on: tracks, stations, marshalling yards and signaling for rail (Pelkmans and Luchetta, 2013). When infrastructure is separated from the actual services supplied then these services can be supplied by the incumbent as well as new entrants. Separating railway infrastructure from operations in freight rail is difficult because of its unique characteristics, which include: i) very high share of fixed and sunk costs (up to 90 percent of total costs); ii) strong economies of density; and iii) multiproduct nature, i.e. the same railway infrastructure connects various origins and destinations for both freight and passenger transport (Preston, 2012). Others have shown that strong economies of density can also mean that a single service monopolist operating all the routes turns out to be more cost‐efficient than a multitude of competitive players (Pelkmans and Luchetta, 2013). Introducing competition may also reduce technical efficiency and a more appropriate approach may involve the concession of parts of the network to allow potential entrants to show how the business can perform better (Pelkmans, 2001). These potential entrants will also have an incentive to pre‐empt later entry through strong performance.
Eliminating cross‐subsidization within Transnet must be sensitive to its potential impact on the overall financial health and existing funding arrangements of Transnet (which will have been negotiated with these cross‐subsidies in place). However, as suggested by Pelkmans (2001), if the unbundling of a state owned entity is not desirable because the overall benefit to the economy is unclear, weaker solutions, such as separate accounting divisions within the entity or a prohibition of data flows between sub‐divisions may also be acceptable. The introduction of separate accounting divisions or transparency in the form of separate audited ring‐fenced financial statements for the various operating divisions will ensure cross‐subsidies are made explicit and inefficiencies can be exposed. This will help to eradicate opaque and discretionary cross subsidies as well as provide the means for rigorous efficiency monitoring (Storer and Teljeur, 2003). Box 6: Implementing Institutional Reform: Lessons from Europe Ensure managerial independence of the infrastructure manager. Governments need to unbundle the infrastructure management from any rail operator. Ownership rights should be exerted by different, independent authorities or ministries. Where unbundling has occurred, ensure that relations between the infrastructure manager and operator(s) are placed on a contractual basis. These contracts should be based on transparent and equal access conditions to the infrastructure, and should be published in regularly updated network statements. Framework agreements providing certainty of capacity available over several years would be a positive development. Set a charging framework based on the direct costs of operating a service. Within this framework, the infrastructure manager can then set the track access charge. The level of charges for freight trains needs to be kept in line with what they can bear in order to make them competitive relative to other transport modes. Improve corporate governance in state rail companies. A number of countries have changed the legal status of their rail undertakings to that of joint‐stock companies, which is a corporate structure selected to ensure managerial independence and commercially‐oriented behavior. However, in practice this has often led to the creation of joint‐stock companies on paper, with significant interference from transport ministries in day‐to‐day decision making, which prevents the kinds of decision‐making that can be expected from operating in a market environment.
24
Require financial accounts to be prepared and audited according to International Financial Reporting Standards (IFRS)—and require that they be published. To assess the financial performance of rail companies, systematic and comprehensive financial accounts need to be prepared according to IFRS and audited by independent audit companies on a line‐of‐business basis (i.e. ring‐fenced by operating division). Source: “Railway Reform in South East Europe and Turkey: On the Right Track?” World Bank (2011a)
The National Rail Policy Green Paper argues that the core railway network should remain vertically integrated and operated by TFR, who will also provide access to PRASA for regional and long distance passenger trains as well as private operators, subject to third party access and regulation by the STER. This may indeed be the most appropriate policy. However, it must be complemented by an analysis of the financial structures that underlie the system so that these are made clear and transparent. Only then can the implications of vertical integration or alternatives be understood properly.
5.1.2 Leveling the playing field between road and rail
South African freight rail cannot compete effectively because it is operationally inefficient, has to overcome a legacy of underinvestment and faces a road transport sector that enjoys a favorable regulatory environment (Department of Transport, 2015). It is the role of government transport policy to place rail and road transportation on an equal footing: the legal provisions and the level of financial contribution of the state for railway and road infrastructure should be equivalent, which will allow users to make the socially optimal choice between the two modes (World Bank, 2011b). As long as the financial support of the state is reflected in an unbiased manner in the transportation tariffs for competing modes of transport, the market will generate enough resources to cover infrastructure operation needs. Strategies to level the playing field with rail include stricter enforcement of the country’s traffic laws, full cost recovery from road freight operators who are generally believed to pay less than their share of road use and related external environmental costs, and major improvements in rail services (Department of Transport, 2015). A major challenge in addressing the imbalance between road and rail usage is ensuring competitive neutrality between road and rail pricing. This means that neither mode of transport is subject to a competitive advantage relative to the other by virtue of pricing structures which do not account appropriately for costs. Current road and rail access charging regimes provide an artificial price advantage to road freight, which undermines the use of more fuel efficient and sustainable rail transport. In many countries, heavy goods vehicles (HGVs) are effectively subsidized by other road users and do not pay appropriately for the maintenance costs arising from the negative externalities that they inflict on the road network (The Australian Railway Association, 2010). Another challenge is the timing and short‐term effects of a strategy to level the price discrepancies between road and rail. Stricter regulation and a more cost reflective pricing of road users without concurrent improvements in rail reliability will result in road users continuing to use road rather than rail, but at a higher cost. This will further erode the competitiveness of exporters and therefore would undermine the fundamental objective of this note. Therefore, in the South African case road pricing reform cannot occur in isolation to wider transportation reforms that genuinely deliver more a more competitive overall transport and logistics environment. There are several methods to generate funds for building and maintaining road networks. Roads can be treated as part of the general obligation of government and funded from general revenue sources. Alternatively, they can be funded from user fees on road users, or by some combination of general taxes and user fees on road users. User fees are broadly viewed as being the more equitable way to fund roads. From an efficiency perspective, such fees are also a more efficient method to generate road funding. However, the efficiency effects can be generated only if costs are distributed appropriately across road users.
25
Internationally there is a movement towards more sophisticated methods of road tolling to generate funds for road building and maintenance, including vehicle miles travelled and weight miles travelled user fees. Fuel taxes do not capture distance‐related externalities closely because they are insensitive to time and location, and fuel consumption is only weakly correlated with vehicle characteristics such as size and axle weight that contribute to congestion, accidents and road damage. There is growing evidence that distance based user charging is the most efficient method, especially on a national basis. It can be implemented in a number of ways including: automatic number plate recognition using fixed cameras, short range sensors together with tags or global navigation satellite systems (GNSS). GNSS allow the full network to be included in the charging system. However, these systems are often complex to implement and administer – particularly in comparison to fuel taxes – and may be met with resistance from users.
Box 7: International examples of road user pricing reforms
In 2006 Namibia introduced a mass‐distance charging (MDC) system to recover the excess variable cost for HGV’s that cannot be recovered using fuel levies only. MDCs are expressed in terms of a rate per distance and rates increase with the weight of a vehicle. Initially the MDCs were based on the mass of HGV’s and was payable annually on the basis of an assumed average travelling distance. However, this was strongly resisted by the organized trucking industry as the payment was based on an assumed distance travelled instead of actual distances. In 2007, a revised system was introduced based on self‐assessments for the actual distances travelled in Namibia per annum. Several methods of road user charging have been used across EU countries, including tolling systems based on a period of time (time vignettes), network wide electronic tolling and concession tolls. Distance based charging systems are considered to be the ideal long‐term solution, and has the most support from industry who considers it the fairest way to charge road users. Distance based systems have been shown to be the most effective in reducing empty running and vehicle kilometers. The Netherlands and Switzerland implemented whole‐of‐network charging, which monitors individual road use of all urban and non‐urban roads based on a combination of distance, mass and location. In the Netherlands, this system has been successful in ensuring full cost recovery for infrastructure, improved allocation of infrastructure investment and a strong demand management tool. In Germany, a distance based charging scheme on HGV’s came into operation in 2005. Germany implemented heavy vehicle charging, which is a limited application of whole‐of‐network charging, to target the heaviest contributors to road damage. The system uses satellite‐based technology with other technologies. The HGV’s charge applies to vehicles over 12 tons using 12,000 km of federal motorways, and is a function of the distance traveled, the number of axles and emissions class. The system has exceeded expectations in terms of reliability and enforcement and has led to reductions in empty truck trips and an increase in the proportion of trucks that meet high emissions standards. Collection costs amount to 15 to 20 percent of revenues. These costs are comparable to those for established infrastructure based urban systems and they are likely to decrease with advances in technology and experience. Source: SADC Protocol on Transport, Communications and Meteorology in the SADC Region (1996)
5.2 Private sector participation to increase investment and improve service delivery
Introducing greater private sector participation in the freight rail system and port operations can be a valuable tool to improve access and is likely to deliver improved reliability. Status of private participation in freight rail The private sector is already a railway operator in South Africa, but only on private lines. For example, Arcelor Mittal, the South African steelmaker, operates 170km of rail track and 34 locomotives within
26
their own premises. The private sector is also working jointly with Transnet on cross‐border railway services (north‐south corridor in Zimbabwe, and likely soon on the Maputo Corridor). Mainline access to private sector operators (“open access”) is effectively a non‐exclusive operating concession. Such access is being supported by governments in other southern and east African countries to attract new customers to rail and to lower unit fixed infrastructure costs. However, railway operators generally resist the concept of open access. In South Africa, Sasol, a major TFR customer, is trying to negotiate a concession to operate their own train between their plants in Sasolburg and Secunda, which would cover a distance of about 200km, including branch as well as main lines. If a solution is found, this may provide an opening for similar arrangement with other major rail or potential rail customers. Many opportunities for private sector participation lie in terminal management and operations, and management of cross‐border and multi‐modal transport operations (discussed in a Section 5.4 below). Another key role for the private sector is to assist the rail operator in the financing or bankability of new projects or services. Many of the large planned infrastructure projects, such as the extension of the coal export line to the new coal mines in the Waterberg and Botswana as well as the new Durban dig‐out port, will rely on contracts and guarantees being provided by the private sector. It is difficult for Transnet to fund these projects from their own balance sheet without some private sector participation or “off‐take” commitments in the form of long‐term take‐or‐pay contracts, which are difficult to obtain for greenfield projects. The viability of these take‐or‐pay contracts for coal miners depend, in turn, on commodity prices as well as the prices received from Eskom for non‐export coal (since most major coal mines service both Eskom and the export market). Resurrection of the branch line network The National Rail Policy Green Paper (2015) sets out South Africa’s approach to branch lines, including the role of the private sector. According to the suggested approach, economically viable or marginal branch lines that TFR chooses not to operate, and that are categorized as non‐strategic by other spheres of government, are to be concessioned at government discretion to others (including the private sector). This approach is unlikely to promote the resurrection of the branch line network. There may be a need for the STER to re‐evaluate this approach to ensure that opportunities offered to the private sector contain genuine value and an appropriate sharing of risks. Previous failed attempts to attract private sector investment into branch lines highlight the need for additional criteria for the concession of branch lines beyond what is proposed in the Green Paper. These criteria should include the following:
All traffic on the branch line is included in the concession where this is required to improve the financial viability of a branch line.
The track is maintained by TFR to contracted standards, which is likely to require subsidies by national government that are partially or wholly offset by an agreed track access fee paid by the concessionaire.
The concessionaire is given operating rights to the mainline network for traffic which is generated along the branch lines. Alternatively, a joint operating center is set up by Transnet and the concessionaire to manage the freight movement from origin to the final destination.
The interim rail regulator (and eventually the STER) regulates the long term tariffs for both Transnet and the concessionaire.
Subsidies from government may be necessary to induce private sector participation in strategic lines that TFR or government entities are unwilling or unable to operate.
Meeting these criteria will require: (i) a functioning STER; and (ii) a framework for how these subsidies would work and the conditions under which they would be made available (the STER will arguably be
27
best placed to develop this). Subsidies could be justified on the basis of economic returns as well as the fact that it will reduce road freight traffic and the associated negative externalities. The degree of infrastructure subsidy can be reduced as the income and traffic volumes increase. Introducing competition in the port system Given the trend of unbundled competition amongst most ports around the world (South Africa is one of the few exceptions), many countries regulate their ports very lightly or not at all (Farrel, 2013). Regulatory functions often lie with government ministries (e.g. Italy, France and Kenya) or port authorities are free to “regulate” through concession agreements, license and leases. There are a few examples of formal and independent port regulators, both sectoral (e.g. India, Brazil, South Africa and Spain) or multi‐sectoral regulators (e.g. Peru, Nigeria and Tanzania). The World Bank’s Port Reform Toolkit recommends a light handed approach to regulation, favoring the restructuring of ports through unbundling to encourage competition. Australia’s regulatory model, which monitors tariffs and service levels and negotiates access for port users to enhance competition, is seen to be a success. In contrast, the port regulator in India does not focus on market abuse, but regulates all tariffs for public‐private partnerships. This has resulted in falling investment and disputes with port operators. Countries that regulate port tariffs either use the required revenue or price‐cap approaches. International best practice shows that the structure of the sector is the most important criteria in the effective functioning of ports. Given sufficient capacity at most South African ports (especially Durban and Cape Town), competition between terminals should be introduced. This will provide a more substantial form of competition to TPT. In addition, competition in areas such as cargo‐handling, towage, warehousing and logistics should also be introduced. Box 8: Concessioning within the port system: the case of Colombia
Colombia’s movement to a competitive ports environment has been highly successful. The country’s ports were run by a public port authority, until they were concessioned into four regional port societies in 1993. The concessionaires are responsible for managing each port and for contracting with port operators for the use of port facilities. Private players are allowed to compete freely in cargo handling services. The mix of inter‐ and intra‐port competition resulted in increased efficiencies, lower costs and higher government revenues. Hourly container movements rose from 16 in 1993 to 25 in 1996 and tariffs declined by 75 percent. Reform has also resulted in port investment increasing by US$150 million. Source: “How to Engage with the Private Sector in Public‐Private Partnerships in Emerging Markets”, Farquharson et al. (2011)
Looking across all transport modes, the independent and transparent regulation of the transport sector is shown to be key, along with regulatory approval of infrastructure investments and the monitoring of service levels. In areas where competition exists, a regulator should take a more light‐handed approach and support access. Although most transport tariffs are regulated through the revenue‐required approach, incentive‐based approaches to tariff regulation are gaining popularity.
5.3 Information and coordination to address market failures and improve access
South Africa’s export sector is dominated by super‐exporters whereas smaller exporters trade in low and irregular volumes that are spread across the country. This structural issue is one of the principal reasons for uneven access to the freight transport network, particularly in rail and ports. It is challenging to design policy solutions aimed at directly improving access for smaller exporters, because the economics of transport, particularly for rail, rely on precisely what small exporters cannot guarantee: scale and consistency. The way to solve this problem is for smaller customers to engage an agent or a logistics company, which can agglomerate freight traffic in the region and therefore is able
28
to commit to a longer term fixed volume contract for at least some of its transport needs. Ideally, this should be focused on containerized freight. This is already being done by some private operators on the regional corridors (for example, Bridge Shipping and Grindrod on the north‐south corridor). However, the private sector cannot do this without explicit support from Transnet. There are various ways to do this, including Transnet setting up a small specialist business unit that uses ICT systems, in partnership with the logistics companies, to consolidate volumes. Alternatively, the private sector could do this through a concession on the north‐south corridor specifically aimed at servicing consolidated volumes by small exporters. Box 9: Coordinated export logistics: the case of Peruvian asparagus growers
When the Peruvian asparagus sector began to export to the US market in the late 1990s they faced challenges of high air freight costs combined with serious quality control problems (due to lack of cool chain facilities). The industry, despite having no history of formal cooperation across the competitive exporters, decided to cooperate to establish a common export platform. With support from the government the export sector established a company (Frio Aero) and invested in the construction of a cold storage and logistics consolidation warehouse at the airport. The venture was highly successful. It contributed to lower cost and more predictable freight flows, and also resulted in higher quality exports – which in turn spurred massive growth in the export industry over the following decade. The success of the cooperative initiative led them to establish a second service company (Peruvian Institute for Asparagus and Horticultural Crops) focused on providing market information and R&D support to the industry.
Both the government and the private sector have a role in overcoming the market failures that restrict the consolidation of volumes from small exporters – particularly given limited information on the availability of cargo flows and the challenges of coordinating these flows. Even with private sector logistics companies offering consolidation services, support for improved information flows can significantly reduce transaction costs involved in organizing these consolidations. One reason for this is that shippers seldom exchange information to coordinate transport needs despite the fact that they will have similar requirements, markets, and potential inbound supply (e.g. agricultural inputs and machinery) during the same periods of time. Without the coordination coming from within the shipping community, consolidation becomes more difficult. Cargo portals are one solution that has been adopted to address this problem in other countries, although these have tended to be used mainly for road freight. Box 10: Trucker's billboards to coordinate small volume shipments: the case of Zambia
The Truckers’ Billboard is a system that has been tried in several places to improve coordination of small shipments and help fill empty transport backhaul legs. It is a matching system where road transporters can advertise spare capacity and shippers can advertise their need for trucking services. It also creates a mechanism for price negotiation that is likely to lower the price. One such example is the TransZam website (www.transzam.org) which enables clients to post information on loads that require transport, and provides transport operators with an opportunity to advertise available capacity. The posts detail the origin and the destination, the cargo to be transported, the type of packaging and the weight of the cargo. The site also features a directory of transport operators, including the name of a contact person, telephone contacts and email addresses and other information such as the size of the operators' fleet and the capacity of the trucks.
There are some cases where logistics coordination and consolidation has taken place through industry initiative – this is most common in export agricultural sectors, particularly in time‐sensitive, high‐value horticultural products such as citrus. Firms, through their industry associations, can cooperate to consolidate volumes and engage directly with Transnet, or collectively partner with logistics providers. The role of STER will be fundamental in the success of such an endeavor, as it will regulate access terms (and associated tariffs) for TFR, as well as offer mediation if there is a lack of cooperation from Transnet.
29
Box 11: Wine cargo train from Mendoza to Buenos Aires
Mendoza province is the major wine production area of Argentina contributing 80 percent to wine exports. To transport a pallet of wine from Mendoza to Buenos Aires by truck takes 24 hours and costs US$1,400. With wine producers facing increasing pressures on their profit margins, the National Train Authority formed a partnership with the Ministry of Agro‐Industry of the Province of Mendoza to operate a fixed schedule a train for wine as part of a door‐to‐door solution. This multimodal door‐to‐door solution at a fixed rate of US$575 for a full wagon (containing 24 pallets, 168 boxes) includes truck transport for any winery located within 50km from the departing train station as well as free delivery up to 50km from the destination station in Buenos Aires. For lower quantities of pallets, there is a price scale. The tariff includes the wagon consolidation of the cargo and the train operator coordinates all logistics. A similar service by truck costs US$1,380. Wineries located further than 50km away from a train station have to hire a truck to transport their goods to the station at a cost of US$275 before it can be loaded on the train. Therefore, for wineries more than 50km away, the total cost from the winery to Buenos Aires of US$851 are still less than transport by truck of US$1,380. Wineries who export through Buenos Aires have to pay an additional US$275 to get their goods to the port, which means total transport costs of US$1,126, versus about US$1,400 by truck. The solution reduced the logistic costs from winery to port by 20 percent and winery to consumer market by 32 percent per pallet. Sources: http://www.aprocam.org.ar/servicios/noticia.php?id=1671 http://www.bcyl.com.ar/portal/index.php
The practical coordination challenge can still remain difficult. The lack of organization on the side of fragmented shippers and their inability to guarantee volumes (or absorb penalties that come with failing to meet agreed volumes) often becomes a binding constraint, particularly in the start‐up phases of an operation. In this context, there is a role for government or Transnet to address some of these start‐up risks, potentially by providing a service without taking guarantees for a limited period, or subsidizing the initial phase of operations in some form.
5.4 Better intermodal, inter‐regional, and institutional cooperation to improve the freight network
Improving the integration and coordination of freight transport activities, on an intermodal, inter‐regional, and institutional level, is critical to improve the efficiency of the freight rail and ports network.
5.4.1 Intermodal freight terminals
The seamless movement of freight across all modes depend crucially on inland and coastal terminals as well as the supporting infrastructure. However, because terminals represent the nodal points of the intermodal transport network, their efficiency can affect the entire freight transport chain. This is the case for TFR: the weakness in the current system lies mainly in the terminals and the operational interfaces (for example locomotive changes and operational handover at the borders and key node points), rather than the mainline services on the corridors. Packaging a complete logistics solution which includes the private sector Transnet’s strategy is focused on capacity development for rail and port terminals operations. However, there is a need to also focus on a rail based door‐to‐door logistics service which is managed jointly with road and logistics operators, particularly for containerized freight. In 2013 Transnet signed MOUs with two major logistics companies who are mainly involved in road transportation – Imperial Logistics and Barloworld Logistics. The intention was to provide rail‐based door‐to‐door services. However, these MOUs have not progressed into operating agreements. Currently the increased time and costs to collect and deliver containers to the rail freight terminals
30
compared to road services makes it difficult for rail to attract customers. One solution would be to attract the customers to relocate to within or adjacent to the rail freight terminals, thus minimizing additional handling and travel. An integrated rail freight terminal is being planned in the East Rand to serve Gauteng. The planned Tambo Springs logistics hub, in conjunction with the upgrading and expansion of City Deep, is a step in the right direction: a modern intermodal hub which is intended to attract private sector importers, exporters and logistics operators to rail. However, Tambo Springs is being planned and developed by Transnet and the Gauteng provincial government to serve the private sector, rather than jointly with private sector investors and partners. Because the success of Tambo Springs depends on its ability to attract private sector customers, private sector participation is crucial. Operational solutions to improve efficiency A number of efficiency improvements can be made to intermodal operations to provide a lower cost and more efficient total logistics service that operates door‐to‐door. These improvements can occur regardless of whether the public or private sector operates the terminals. Operational solutions should focus on the terminal operations, both port and inland, and the distribution and consolidation services by road. Terminal turn‐around time should be the focus for rail – as it is for any service controlled by fixed costs. Further capacity can be gained by operating directly into the terminals (which would require a switch from electric to diesel25) thus shortening the turn‐around time to a few hours, and by shortening the time for free storage in the terminal.26 Rail needs to market itself as a one stop shop through formal arrangements with road transporters, ICD operators, and logistics companies. To deliver this, the location, planning, financing, development and operation of intermodal freight terminals should be conducted jointly by private sector logistics companies and the rail operator. Box 12: Improving the efficiency of intermodal terminals: lessons from the EU Recent evidence from several research projects carried out by the EU suggest that the following areas are key to improve the efficiency of intermodal terminals: 1. Quantitative tools for decision making
a. Analyzing major door‐to‐door corridors allows for the identification of major cost items. After identifying terminal and transhipment operations as one of the major cost drivers, the EU implemented a package of reforms that reduced total resource costs by 6 percent on average for the three corridors analyzed.
b. The EU also developed a Terminal Simulation System, which is a valuable planning tool for terminal managers and for planners and designers of ports and terminals. It provides support in establishing the most suitable terminal layout, and allocates resources for changed operational requirements.
2. Financing intermodal freight terminals a. Since there is not a common financing scheme for the freight terminals in the EU, an example of
best practice is the PPP scheme adopted in Germany. In this case, financial incentives are given to either the national railways (Deutsche Bundesbahn) or to private companies. The financial aid
25 A shift to diesel is required within container terminals because electric locomotives are powered through high current overhead electric catenaries that cannot be extended into the terminals because it will conflict with the container handling operations (normally done with overhead rail gantries at City Deep and most other major terminals). Switching from electric to diesel and back again is time consuming and expensive. It has been suggested that trains are lengthened up to 100 wagons (requiring some terminal infrastructure investments), and that the traction be provided by 3 electric and 1 diesel locomotives, so that no switching or train separation is required. This would give much improved terminal turnaround times and consequently lower costs. 26 The same operating principles apply to the port terminals, but with the additional requirement that the quayside be kept clear at all times to allow for high ship‐to‐shore crane productivity – delays can cost US$1 per tonne per day, or US$10 to US$20 per TEU per day, which are added to the shipping costs.
31
involves grants of 80 percent and 20 percent in subsidized loans. Deutsche Bundesbahn must keep the terminal open for public use for 20 years and the private operator must keep the terminal open for 5, 10 or 20 years depending on their financial contribution (the more the private company finances itself, the shorter the obligation to keep the terminal open for public use).
3. Improving the management of container terminals a. A system to automatically track the containers inside a terminal from the reception to the delivery
at the gate has been developed and the prototypes tested in a number of trials. b. The efficiency of terminal operations is improved by the possibility of continuously and
automatically updating the terminal operating system database with the position of each container handled by this system.
c. The benefits produced by this type of technology include: (i) a reduction of the average time for container handling; (ii) increase of terminal productivity; (iii) a better level of service for terminal customers; and (iv) a general reduction in operational costs.
4. Exploiting and integrating ICT a. The availability, quality and timeliness of information can significantly improve the efficiency of the
activities carried out in intermodal terminals. Reliable expected time of arrivals and unloading information can help receiving terminals to provide information to forwarders and truckers, enabling them to arrive on time at the terminal.
Source: “In search of efficiency to support intermodality growth” European Commission (2006)
5.4.2 Cross‐border rail
Despite long term operational problems on cross‐border rail services in Southern Africa, there is an increased desire by all the governments to support a road‐to‐rail shift. Both Grindrod Freight Services and Transnet have committed large investments into cross‐border rail services, and are under pressure to increase general freight rail volumes in order to achieve profitable and sustainable operations. Box 13: Improving integration for regional railways: Lessons from south‐east Europe
1. Implementing border‐crossing agreements. A Border Crossing Agreement (BCA) has five key principles: (i) compliance with open access standards; (ii) introduction of a joint border zone (JBZ); (iii) cooperation between border authorities; (iv) police and customs control over moving trains; and (v) establishment of border‐crossing commissions (BCCs) for open access border‐crossings. The following items are key within the JBZ:
a. Single window principle for freight customs: all customs services should be carried out by the customs authorities of both countries at one location in the JBZ.
b. One‐stop‐shop for the use of rail infrastructure in the JBZ: a one‐stop‐shop where the applicant receives all information, including the timetable, fees and technical parameters that enable use of a specific train path.
2. Using selective investments to establish joint border stations or moving clearance to defined
inland terminals. A potential investment measure could be the transfer of certain border‐crossing activities to major inland terminals. International trains should only be inspected / shunted / split at a limited number of inland terminals to: (i) reduce border‐crossing times; (ii) achieve higher commercial speed for trains; and (iii) streamline border procedures. This notion is based on conventional single wagonload or wagon groups used by incumbent state‐owned railways. With the entry of non‐state private rail operators, the rail concept changes to one with block train systems: (i) from sidings to sidings in conventional block trains; (ii) from sidings to terminals or vice versa in conventional block trains; and (iii) from terminal to terminal in conventional block trains.
3. Ensuring coordination of track access charges (TACs) across freight corridors within the region. Excessively high freight TACs across one segment of a corridor can shift freight rail traffic onto trucks. This not only affects the domestic market, but also has knock‐on effects throughout the corridor. This suggests the need for coordinated TAC regimes across major freight corridors, to make
32
international rail freight flows easier to manage and to ensure that the high TACs of one country do not become negative externalities for other countries along the corridor.
Source: “Railway Reform in South East Europe and Turkey: On the Right Track?” (World Bank, 2011b)
Cross‐border rail operations are currently governed by bilateral business agreements within railways. Due to the poor operational and financial state of most of the regional railway companies, transit time on the north‐south corridor sometimes exceeded 30 days. The establishment of a Joint Operating Centre (JOC) in Maputo in 2013 to plan, manage, coordinate and monitor freight movements on the Maputo rail corridor has been remarkably successful. Developed on behalf of Transnet and Grindrod, the JOC is based on co‐location of the main operators (port and the two railway systems) to jointly manage the freight movements especially when services deviate from the contracted or agreed schedules. This includes an alignment on standard operating procedures, maintenance and safety standards amongst the three countries and an integrated cross‐border train plan for coal, magnetite, containers and fuel. The establishment of JOCs on the Maputo and north‐south corridors have reduced transit times by more than 50 percent and have therefore had a significant and positive impact on operating costs and tariffs.
5.4.3 Institutional coordination
Effective institutional coordination requires management and coordinated planning across port and transport authorities, municipalities and other spheres of government. For example, the alignment of planning between a port and the city where it is located ensures that they mutually reinforce rather than oppose each other, and is considered essential to resolve the port‐city mismatch (OECD, 2013). To overcome institutional coordination issues, address freight logistics challenges and ensure mutually beneficial paths for growth, some port‐cities have adopted master plans that are jointly drawn up by port authorities and local government, and established collaboration agreements between key stakeholders. The importance of such plans and agreements is they provide a set of transparent parameters for long term decision‐making in a manner that facilitates institutional coordination. Box 14: The creation of a common port‐city vision in Durban, South Africa
Historically there has been an absence of coordinated planning for the provision of infrastructure in the port‐city of Durban, which contributed to logistical inefficiencies in the city. In the past there have been strained interactions between Transnet and the eThekwini municipality, arising from a conflict of interest around projects (OECD, 2013). In 2003, an MOU was signed between the city and port which gave rise to what is known as the Transnet and eThekwini Municipality Planning Initiative (TEMPI). The MOU established a ‘Port‐City Forum’ whose purpose is to develop a sustainable and pro‐active planning and co‐operative framework between the National Ports Authority and the eThekwini Municipality. Following the relocation of the Durban International Airport to the new King Shaka International Airport site, greater collaboration under the TEMPI framework resulted in eThekwini and Transnet publishing the 2050 Vision for a long term development of the Durban to Gauteng Freight Corridor. The Vision is a broad and long‐term master plan that sets out better planning alignment between the port and city around the proposed development of a new dig‐out port at the former Durban International Airport site. The city has since formulated its Back‐of‐Port Area policy, which aims to better rationalize the urban areas directly behind the port to improve the port’s performance. Source: “Competitiveness of Global Port‐Cities: Synthesis Report”, OECD (2013)
International examples indicate that these plans and agreements can address the challenges associated with encroachment, where intense urban growth places pressure on land for ports and freight nodes. Improved coordination is also likely to reduce transport costs if it ultimately alleviates congestion and leads to more efficient access to key port infrastructure. Better coordination is
33
required for efficient operation of port facilities, freight nodes and infrastructure corridors leading to and from national ports. A combination of regulatory and non‐regulatory tools is required to achieve better coordination. Key elements of institutional coordination required for the efficient operation of port facilities, freight nodes and infrastructure corridors include: (i) declaration of key nodes and corridors at regional level in the form of a province‐wide freight network plans; (ii) better consistency between policy and regulation, including a provincial policy for port, freight and corridor protection which has mandatory requirements for regional and local government planning schemes that articulate the provincial interest at a more micro level; (iii) comprehensive identification of key activity nodes and corridors at local level by the relevant ports; and (iv) stronger working relationships between port, freight and government stakeholders to address jurisdictional issues (Ports Australia, 2014). An inter‐departmental freight unit within the city of Durban could achieve the following: (i) bundle expertise by acting as a one‐stop shop for freight‐related issues in the city; (ii) improve coordination on freight transport; and (iii) engage in joint planning by aligning various actors including Transnet, SANRAL, the national and provincial departments of transport and the various departments within the city of Durban (OECD, 2014a).
6 Concluding remarks Having an integrated transport corporation in the form of Transnet should, in theory, help synchronize port and rail capacity and support broader coordination issues including with systems of neighboring countries. That this is not happening, at least not in an effective manner, raises questions on the structure and effectiveness of Transnet in a dynamic economy. It is clear from this assessment that a range of reforms are needed to deliver a more accessible and competitive rail and ports sector. As outlined throughout the document, there are ongoing reforms and investments that are likely to improve the ports and rail network. However, without some complementary efforts on policy, operations and positioning, the impact of infrastructure investments and planned reforms will not be fully realized. Given the vision outlined for the port and rail network in the National Freight Logistics Strategy – as well as some of the underlying principles articulated in that document – there is room to do more. Indeed, many of the key principles discussed in this note are aligned closely with those set out in the NFLS, most notably around the institutional and regulatory environment that governs the sector. Unfortunately, few of these have been implemented. It is critical to ensure that the policy options discussed in this paper are considered within a framework that takes into account historical and existing obstacles to implementation. These policy options are tailored to the South African situation. This in‐depth approach is necessary since the structure of the economy, its institutions and infrastructure determines how export competitiveness is affected by transport issues. In South Africa’s case there are many factors which make it unique ‐ particularly the role of Transnet. However, some or all of the broader interventions are relevant to developing countries whose transport and logistics infrastructure, access and pricing policies, and inefficiencies and delays are eroding the competitiveness of exporters. The broad reforms outlined are:
Institutional reforms to promote competition and get the prices right
Private sector participation to increase investment and improve service delivery
Information and coordination to address market failures and improve access
More effective intermodal, inter‐regional, and institutional cooperation to improve operation of the freight logistics network.
34
References
Agarwal, A., Giuliano., G & Redfearn, C. (2004) The Alameda Corridor: A White Paper [Online] Available from: http://www.usc.edu/schools/price/keston/pdf/alameda‐corridor‐wp.pdf. [29 September 2015]. Africa Infrastructure Country Diagnostic (AICD) (2011). East Africa’s Infrastructure: A Regional Perspective. Policy Research Working Paper WPS 5844. Washington, DC: World Bank. Anand, R., Perrelli, R. and Zhang, B. (2014) South Africa’s exports performance: Any room for structural factors? [Online] Available from: http://www.imf.org/external/pubs/ft/scr/201
4/cr14339.pdf. [Accessed: 23 July 2015] Arvis, J., Duval,Y., Shepherd, B. and Utoktham, C. (2013) “Trade Costs in the Developing World: 1995‐
2010”, Policy Research Working Paper 6309, World Bank. Athens, Y.G. (2007) Reefers step in to relieve congestion. [Online] Available from: https://www.tradewindsnews.com/weekly/w2007‐07‐13/216064/reefers‐step‐in‐to‐relieve‐ congestion. [Accessed: 28 July 2015] Australian Railway Association. (2010) Road Pricing Reforms in Australia: Why Road Pricing is Vital to Australia’s Economic Prosperity. [Online] Available from: http://transportreform.org/file.ph p?fileID=26 [Accessed: 27 July 2015] Australian Rail Track Corporation. (2015) Melbourne to Brisbane Inland Rail 2015. [Online] Available from: http://inlandrail.artc.com.au/wp‐content/uploads/2015/09/InlandRailBusinessCa se.pdf. [25 September 2015]. Baloyi, B. (2014) The role of South Africa’s freight rail regulatory framework in General Freight’s sluggish growth performance. [Online] 13 April 2014. Available from: http://static1.squar espace.com/static/52246331e4b0a46e5f1b8ce5/t/534e80b9e4b0da517 e6d0716/1397 653689767/1400407_EDD‐UJ_RECBP_Project+Report_App9_Rail+Freight+Review_Final.p df. [Accessed: 24 July 2015] BST Associates. (2004) Consolidation Activity in the Southern California Area. [Online] Available from: http://www.acta.org/projects/pdf/Consolidation_Report_Final_March_2004_Version_14.pd f. [Accessed: 21 September 2015] Buthelezi, L. (2014) Transnet order ‘will not solve woes’. BusinessReport. [Online] 19 March. Available from: http://www.iol.co.za/business/news/transnet‐order‐will‐not‐solve‐woes‐ 1.1663390#.VbISVtKqpHw. [Accessed: 24 July 2015] CSIR. (2014) The 10th State of Logistics Survey for South Africa 2013: Bold Steps Forward [Online] Available from: http://www.csir.co.za/sol/docs/10th_SoL_Bold_Steps_Forward_web.pdf. [24 July 2015] Department of Transport. (2005) National freight logistics strategy. [Online] Available from: http://w ww.portsregulator.org/images/documents/National_Freight_Logistics_Strategy.pdf. [Accessed: 24 July 2015] Department of Transport. (2015) Draft Rail Policy Green Paper Edwards, L. and Garlick, R. (2008) Trade flows and the exchange rate in South Africa. [Online] Available from: http://mpra.ub.uni‐muenchen.de/36666/1/MPRA_paper_36666.pdf. [Acces
sed: 23 July 2015] Ernst & Young. (2011) Financing Australia’s infrastructure needs: Superannuation investment in infrastructure. [Online] Available from: http://www.ey.com/Publication/vwLUAssets/Finan cing_Australia_infrastructure_needs/$FILE/Superannuation_Investment_In_Infrastructure.p df. [Accessed: 18 September 2015] European Commission. (2006) Intermodal freight terminals: In search of efficiency to support intermodality growth. [Online] Available from: http://www.transport‐research.info/Up load/Documents/200608/20060831_100031_82868_intermodal_freight.pdf. [Accessed: 27 July 2015]
35
Farquharson, E., Torres de Mästle, C. & Yescombe, E.R. (2011) How to Engage with the Private Sector in Public‐Private Partnerships in Emerging Markets. [Online] Available from: https://www.ppiaf.org/sites/ppiaf.org/files/publication/How‐to‐engage‐with‐private‐sector‐ Clemencia‐Farquharso‐Yecome‐Encinas.pdf. [Accessed: 24 July 2015] Farrel, S. (2013) Ports Regulation: Global Experience and its Applicability to South Africa. [Online] Available from: http://www.tips.org.za/files/u72/port_regulation_workshop.pdf. [24 July 2015] Fruit South Africa. (2015) A Socio Economic Impact Study Of The South African Fruit Export Industry ‐ With Special Emphasis On The Role Of Transnet SOC And Its Subsidiaries ‐ In The Sustainability Of The Fruit Export Industry Freund, C. & Rocha, N. (2010) What Constrains Africa’s Exports? World Trade Organisation Economic Research and Statistic Division. Staff Working Paper ERSD‐2010‐07 Grey, E. (2015). Getting a move on: Australia’s Inland Rail project. [Online] Available from: http://w ww.railway‐technology.com/features/featuregetting‐a‐move‐on‐australias‐inland‐rail‐ project‐4627464/. [Accessed: 25 September 2015] Gwebu, T. (2013) Congestion blights SA citrus exports. [Online] Available from: http://www.iol.co.za /business/news/congestion‐blights‐sa‐citrus‐exports‐1.1564079#.Vbh7PLOqpHw. [29 July 2015] Havenga, J.H. (2012) Rail renaissance based on strategic market segmentation principles. Southern African Business Review. 16 (1). Havenga, J.H. & Pienaar, W.J. (2012) The Creation and Application of a National Freight Flow Model for South Africa, Journal of the South African Institution of Civil Engineering. 54(734). p.2‐13. Heald, D. A. (1997) Public policy towards cross‐subsidy. Annals of Public and Cooperative Economics. 68(4). p.591‐623 Hoekman, B and Nicita, A. (2008) Trade Policy, Trade Costs, and Developing Country Trade. Policy Research Working Paper. 4797 Infrastructure Australia. (2015) Public Private Partnerships [Online] Available from: http://infrast ructureaustralia.gov.au/policy‐publications/public‐private‐partnerships/index.aspx. [Accessed: 22 September 2015] International Council on Mining and Metals. (2012) The role of mining in national economies: Mining’s contribution to sustainable development October 2012. [Online] Available from: https://www.icmm.com/document/4440. [Accessed: 21 July 2015] Inter‐American Development Bank (2013) After the Boom: Prospects for Latin America and the
Caribbean in South‐South Trade [Online] Available from: https://publications.iadb.org/bitstream/handle/11319/3658/Trade%20and%20Integration%20Monitor%202013.pdf?sequence=4 [Accessed: 9 November 2015]
Jordan, B. (2015) Transnet in the dock over costly broken gate bungle. Business Day. [Online] 11 January. Available from: http://www.bdlive.co.za/search/Transnet%20in%20the%20dock %20over%20costly%20broken%20gate%20bungle. [Accessed: 24 July 2015] Joubert, R. (2013) Citrus exports delayed at Durban port. [Online] Available from: http://www.far mersweekly.co.za/news.aspx?id=39460&h=Citrus‐exports‐delayed‐at‐Durban‐port. [Accessed: 28 July 2015] Lin, J. (2011). “How to Seize the 85 million Jobs Bonanza,” July 27, 2011.
http://blogs.worldbank.org/developmenttalk/how‐to‐seize‐the‐85‐million‐jobs‐bonanza Mathee, M., Farole, T., and Rankin, N. (2015). South African Exporters and the Global Crisis: Intensive Margin Shock, Extensive Margin Hangover, South African Journal of Economics, DOI: 10.1111/saje.12094 Maqutu, A. (2014) Transnet coal terminal put on hold. Business Day. [Online] 30 October. Available from: http://www.bdlive.co.za/business/trade/2014/10/30/transnet‐coal‐terminal‐put‐on‐ hold. [Accessed: 24 July 2015] Monios, J., and Bergqvist, R. (2015) Intermodal terminal concessions: Lessons from the port sector. Research in Transportation Business & Management. 14 (September). p. 90‐96.
36
Moreira, M., Mesquita, Volpe, C. and Blyde, J. (2008) Unclogging the Arteries: The Impact of Transport Costs on Latin American and Caribbean Trade. Inter‐American Development Bank and Cambridge, Massachusetts: David Rockefeller Center for Latin American Studies, Harvard University.
National Ports Regulator. (2014) Global Pricing Comparator Study (GPCS). [Online] Available from: http://www.portsregulator.org/images/documents/Port‐Tariffs‐BenchMarking‐Report‐2014‐ 15.pdf. [24 July 2015] National Ports Regulator. (2013) Transnet National Ports Authority Tariff Book 2013/14. [Online] Available from: http://www.portsregulator.org/images/documents/tariff_book_1_april_2 013‐14_.pdf. [Accessed: 24 July 2015] Nijdam, M., De Jong, O., Van der Horst, M., Van den Bossche, M., De Swart, L., & Bückmann, E. (2014) Level Playing Field: Study on distorted cross‐border competition between seaports [Online], available from: https://www.government.nl/.../level‐playing‐field‐eindrapport‐ engels.pdf. [02 November 2015] Nordas, H. & Piermartini, R. (2004) Infrastructure and Trade. World Trade Organisation. Staff Working Paper ERSD‐2004‐04 Norris, G. (2015) Inland rail project on track after government considers new options. [Online] Available from: http://www.couriermail.com.au/business/inland‐rail‐project‐on‐track‐after‐ government‐considers‐new‐options/story‐fnihsps3‐1227516835515. [Accessed: 25 September 2015] OECD. (2005) Structural reform in the rail industry 2005. [Online] Available from: www.oecd.or g/regreform/sectors/35911008.pdf [Accessed: 24 July 2015] OECD. (2008) OECD Economic Surveys: South Africa Economic Assessment. [Online] Available from: http://www.treasury.gov.za/publications/other/OECD%20‐%20South%20Africa%20Econ omic%20Assesment.pdf. [Accessed: 23 July 2015] OECD. (2009) Railway and Ports Organization in the Republic of South Africa and Turkey: The Integrator’s Paradise?, Discussion Paper 2009–5. Paris. OECD. (2013) Competitiveness of Global Port‐Cities: Synthesis Report. [Online] Available from: http://www.oecd.org/gov/regional‐policy/Competitiveness‐of‐Global‐Port‐Cities‐Synthesis‐ Report.pdf. [Accessed: 27 July 2015] OECD. (2014a) The Competitiveness of Ports In Emerging Markets: The Case Of Durban, South Africa. [Online] Available from: http://www.internationaltransportforum.org/Pub/pdf/14 Durban.pdf. [Accessed: 24 July 2015] OECD. (2014b) Private Financing and Government Support to Promote Long‐Term Investments in Infrastructure. [Online] Available from: http://www.oecd.org/daf/fin/private‐pensions/Priv ate‐financing‐and‐government‐support‐to‐promote‐LTI‐in‐infrastructure.pdf. [Accessed: 15 September 2015] OECD, WTO (2013) Global value chains: challenges, opportunities, and implications for policy [Online] Available from: http://www.oecd.org/tad/gvc_report_g20_july_2014.pdf [Accessed 9 November 2015] Pelkmans, J. (2001) Making EU network markets competitive. Oxford Review of Economic Policy. 17 (3). p.432‐456. Pelkmans, J. & Luchetta, G. (2013) Enjoying a single market for network industries? [Online] Available from: http://www.notre‐europe.eu/media/singlemarketnetworkindustries‐ pelkmansluchetta‐ne‐jdi‐feb13.pdf?pdf=ok. [Accessed: 24 July 2015] Pietrantonio, L.D. & Pelkmans, J. (2004). The Economics of EU Railway Reform: BEEP briefing n° 8, Bruges European Economic Policy Briefings [Online] Available from: http://aei.pitt.edu/584 31/1/beep8.pdf. [Accessed: 24 July 2015] Ports Australia. (2014) Leading Practice: Port and Supply Chain Protection Current Practice and Future Opportunities. [Online] Available from: http://www.portsaustralia.com.au/assets/Pu
37
blications/Leading‐Practice‐Port‐Supply‐Chain‐Protection‐low‐res.pdf?. [Accessed: 27 July 2015] Preston, J. (2012) Beyond the quiet life of a natural monopoly: Regulatory challenges ahead for Europe’s rail sector ‐ Issue paper # 2 Competition and cooperation, organisations and markets: how to deal with barriers to entry and market power? [Online], Available from: http://www.cerre.eu/sites/cerre/files/121025_CERRE_CES_Rail_IssuePap2_JP_All.pdf. [Accessed: 27 July 2015] Quantec. (Database) http://www.quantec.co.za/ Railway‐technology.com. (2015) Alameda Corridor Freight Line, United States of America. [Online] Available from: http://www.railway‐technology.com/projects/alameda/. [25 September 2015] Sanchez, P., Monsalvez, J., & Martinez, L. (2008) Vertical and horizontal separation in the European railway Sector. Fundación BBVA. Working Paper No. 12 Simpson, Z. and Havenga, J. (2010). Revitalisation of branch lines in South Africa: A long‐term view for sustainability. Journal of Transport and Supply Chain Management. 4(1). p.243‐254 Sitrus Portal for Europe. (2013) Logistics challenges in Durban. [Online] Available from: http://www. sitrus.eu/en/news/13/10/11/logistics‐challenges‐durbanews/13/10/11/logistics‐challenges‐ durban.[Accessed: 29 July 2015] Southern African Development Community. (1996) Protocol on Transport, Communications and Meteorology in the Southern African Development Community (SADC) Region. [Online] Available from: http://www.sadc.int/files/7613/5292/8370/Protocol_on_Transport_Comm unications_and_Meteorology_1996.pdf. [Accessed: 27 July 2015] Storer, D. & Teljeur, E. (undated) Administered Prices Executive Report: A report for National Treasury. [Online] Available from: http://www.treasury.gov.za/publications/other/epir/ Summary%20of%20sector%20reports.pdf. [Accessed: 24 July 2015] Summercitrus. (2011) Congestion in Durban remains a head ache for South African citrus industry. [Online] Available from: http://www.summercitrus.com/users/index.php?q=node/558. [Accessed: 28 July 2015] The Australian. (2015) Malcolm Turnbull: new PM feels heat on $10bn inland rail project. The Australian. [Online] 17 September. Available from: http://www.theaustralian.com.au/b usiness/malcolm‐turnbull‐new‐pm‐feels‐heat‐on‐10bn‐inland‐rail‐project/story‐e6frg8zx‐ 1227530867419. [Accessed: 25 September 2015] Transnet. (2008) Creating operational efficiencies for growth in freight system. Presentation by Siyabonga Gama, Chief Executive, Transnet freight rail. South African Shippers’ Council Annual Conference. 14 August 2008 Transnet. (2014a) Demand Book 2014 MDS Aligned. Johannesburg: Transnet. Transnet. (2014b) Annual Financial Statements. Johannesburg: Transnet. Transnet (2015) Rail: The Track to Efficiency, presentation by Transnet to the Transport Forum Special Interest Group on 4 June 2015. Trujillo, L. & Serebrisky, T. (Undated) An assessment of port reform in Argentina: outcomes and challenges ahead. [Online] Available from: http://info.worldbank.org/etools/docs/libra ry/70122/port%20reform%20argentina%20mp%26m%20revised.pdf. [24 July 2015] US Maritime Administration. (2009) America’s Ports and Intermodal Transportation System January 2009. [Online] Available from: http://www.glmri.org/downloads/Ports&IntermodalTranspor t.pdf. [Accessed: 27 July 2015] West, E. & du Plessis, B. (2013) Port delays hurt farmers [Online] Available from: http://www.new s24.com/Archives/Witness/Port‐delays‐hurt‐farmers‐20150430. [Accessed: 28 July 2015] World Bank. (2007) Port reform toolkit second edition: Module 6, Port regulation module. [Online] Available from: http://www.ppiaf.org/sites/ppiaf.org/files/documents/toolkits/Portool kit/Toolkit/pdf/modules/06_TOOLKIT_Module6.pdf. [24 July 2015]
38
World Bank. (2011a) Curbing Fraud, Corruption and Collusion in the Roads Sector. [Online] Available from: http://siteresources.worldbank.org/INTDOII/Resources?Roads_Paper_Final.pdf. [Accessed: 18 December 2015] World Bank. (2011b) Railway Reform in South East Europe and Turkey: On the Right Track? [Online] Available from: http://ec.europa.eu/transport/modes/rail/studies/doc/2011_03‐railway‐ reform‐south‐east‐europe‐and‐turkey.pdf. [Accessed: 24 July 2015] World Bank (2012) Trade competitiveness diagnostic toolkit [Online] Available from:
https://openknowledge.worldbank.org/bitstream/handle/10986/2248/673620PUB0EPI007869B009780821389379.pdf?sequence=1 [Accessed: 11 November 2015]
World Bank. (2014a) Trade Logistics in the Global Economy: The Logistics Performance Index and Its Indicators. [Online] Available from: http://www.worldbank.org/content/dam/Worldbank /document/Trade/LPI2014.pdf. [Accessed: 23 July 2015] World Bank. (2014b) Doing Business 2015: Going Beyond Efficiency. Washington, DC: World Bank. DOI: 10.1596/978‐1‐4648‐0351‐2. License: Creative Commons Attribution CC BY 3.0 IGO World Bank. (2014c) South Africa Economic Update: Focus on Export Competitiveness. [Online] Available from: http://www‐wds.worldbank.org/external/default/WDSContentServer/WDS P/IB/2014/02/03/000333037_20140203120030/Rendered/PDF/843690NWP0P13100SAEU5 0for0web0final.pdf. [Accessed: 27 July 2015] World Bank. (2015) Doing Business in South Africa 2015. Washington, DC: World Bank. World Economic Forum. (2014) The Global Enabling Trade Report 2014. [Online] Available from: http://www3.weforum.org/docs/WEF_GlobalEnablingTrade_Report_2014.pdf.[Accessed: 27 July 2015] Wilmsmeier, G., Hoffmann, J. & Sanchez, R. (2006) The impact of port characteristics on international maritime transport costs. Research in Transportation Economics. 16, p. 117‐ 140. Wittmann, H. (2010) Total costs of logistics in South Africa need to be reduced. [Online] Available from: http://www.csir.co.za/publications/pdfs/2.2_SS_BE_transport&logistics_chap1.pdf. [24 July 2015] Van Eeden, J. & Havenga, J. (2010) Identification of key target markets for intermodal freight transport solutions in South Africa. Journal of Transport and Supply Chain Management. (November). p.255–267. Yevdokimov, Y.V. (2000) Measuring economic benefits of intermodal transportation. Transportation Law Journal. 27(3). p.439–452.