Supporting Information
A H2O2-Responsive Nanocarrier for Dual-Release of Platinum Anticancer Drugs and
O2: Controlled Release and Enhanced Cytotoxicity against Cisplatin Resistant
Cancer Cells
Huachao Chen, Weijiang He,* and Zijian Guo*
Contents:
I. Experimental details
I.1. Materials
I.2. Fabrication and characterization of PLGA NPs
I.3. Discussion on the mean diameter, polydispersity index (PDI) and zeta potential of NPs (containing catalase
and cisplatin) at different preparation conditions
I.4. Long-term-stability study of PLGA NPs in various media
I.5. Study of in vitro release of payload from the PLGA NPs
I.6. Investigation on the catalase activity after encapsulation and catalase release behavior
I.7. Cell culture and confocal imaging
I.8. In vitro cytotoxicity assay
I.9. Flow Cytometry Analysis
I.10. Study on the intracellular release of O2 from the PLGA NPs
I.11. JC-1 assay
II. Supplementary figures
II.1. Fig. S1. Zeta potential distribution of the PLGA NPs.
II.2. Fig. S2. Stability study of the PLGA NPs at physiological temperature in the absence of H2O2: the in vitro release
profiles of cisplatin from PLGA NPs incubated in PBS at 37 °C. Insets: the SEM micrographs of PLGA NPs incubated
in PBS at 37 °C at 0 h and 24 h.
II.3. Fig. S3. Long-term-stability study of PLGA NPs in PBS and in RPMI 1640 with 10% FBS.
II.4. Fig. S4. The size stability of PLGA NPs (without catalase) in the presence of 100 μM H2O2. Insets: the SEM
micrographs of PLGA NPs (without catalase) incubated with 100 μM H2O2 at 0 h and 24 h.
II.5. Fig. S5. Normalized fluorescence of [PtLCl]Cl upon release from the PLGA NPs in the presence of 100 μM H2O2.
II.6. Fig. S6. Absorption spectrum of BHQ-2.
II.7. Fig. S7. Confocal fluorescence images of PMA-stimulated HeLa cells incubated with the NPs for 16 h and then
incubated with LysoTracker Red FM and Hoechst 33342.
Electronic Supplementary Material (ESI) for ChemComm.This journal is © The Royal Society of Chemistry 2014
II.8. Fig. S8. Catalase release behavior from the NPs incubated with 100 μM H2O2 quantified by measuring the enzyme
activity within 24 h.
II.9. Fig. S9. MTT assay of HeLa cells in the presence of different concentrations of free [PtLCl]Cl.
II.10. Fig. S10. MTT assay of HeLa cells in the presence of different concentrations of [PtLCl]Cl-loaded NPs and
[PtLCl]Cl-loaded NPs (no catalase).
II.11. Fig. S11. MTT assay of HeLa cells in the presence of free [PtLCl]Cl, NPs, NPs (no catalase) and NPs (no
[PtLCl]Cl).
II.12. Fig. S12. Confocal fluorescence images showing increased intracellular O2 level after treated with catalase-loaded
NPs.
II.13. Fig. S13. Confocal fluorescence images of apoptosis by the JC-1 assay in drug-sensitive SGC 7901 and drug
resistance SGC 7901/DDP cells treated with free cisplatin, NPs or NPs (no catalase) for 24 h.
II.14. Fig. S14. Representative CLSM images of disruption of mitochondrial function and apoptosis by the JC-1 assay in
a) drug-sensitive A549 and b) drug resistance A549/CDDP cells treated with free cisplatin or PLGA NPs for 24 h.
II.15. Fig. S15. Flow cytometry analysis of drug resistance SGC-7901/DDP cells after free cisplatin or cisplatin-loaded
NPs treatment.
II.16. Fig. S16. MTT assay of (a) SGC 7901 cells and (b) SGC 7901/DDP cells in the presence of different
concentrations of free cisplatin and cisplatin inside the NPs (with/without catalase).
I.1. Materials. Poly(D,L-lactic-co-glycolic acid) (PLGA, with a lactide/glycolide molar ratio of 75:25 and an inherent viscosity
of 0.17 dL/g) was obtained from Daigang BIO Engineer Ltd. Co. (Shandong, China). Cisplatin, catalase, H2O2, Black Hole
Quencher-2 (BHQ-2), 3-(4,5-dimethylthiazol-2-yl)-2,5-diphenyltetrazolium bromide (MTT), Poly (vinyl alcohol) (PVA, MW=
57-66 kDa), phorbol 12-myristate 13-acetate (PMA), Tris(4,7-diphenyl-1,10-phenanthroline)ruthenium(II) dichloride complex
[Ru(dpp)3]Cl2 were all obtained from Sigma-Aldrich (St. Louis, MO, USA). [PtLCl]Cl was synthesized in our laboratory.1
Ultrapure water was prepared using a Millipore Simplicity System (Millipore, Bedford, USA).
I.2. Fabrication and characterization of PLGA NPs. PLGA NPs encapsulating [PtLCl]Cl were prepared using a water-in-
oil-in-water (W/O/W) double-emulsion, solvent-diffusion-evaporation approach method.2 A 2.5 mg catalase powder and 10
mg [PtLCl]Cl were added to 1 mL PVA aqueous (10 mg/mL) and then mixed thoroughly for 15 min. Subsequently, the
mixture was emulsified with 2 mL of PLGA solution (5 mg/mL in CH2Cl2) containing BHQ-2 (10 mg/mL) to obtain the
primary W/O emulsion. The primary emulsification was carried out by using an ultrasonicator for 1 min in an ice bath. The
primary emulsion was then added to 6 mL of PVA aqueous (20 mg/mL) and emulsified by using an ultrasonicator for 1 min in
an ice bath to form the W/O/W double-emulsion. To evaporate CH2Cl2 and solidify the particles, the resultant double-emulsion
was transferred into 20 mL of ultrapure water and stirred overnight at room temperature. After washing three times with
ultrapure water, the PLGA NPs were collected by centrifugation and finally resuspended in 10 mL phosphate buffered saline
(PBS) solution. The encapsulation efficiency of [PtLCl]Cl is 15.8%. The similar procedures were used to prepare the PLGA NPs
encapsulating cispaltin. The encapsulation efficiency of cisplatin is 14.2%. The surface morphology and size of the as-prepared
PLGA NPs were investigated by scanning electron microscopy (Hitachi s-4800 high resolution SEM) on the conductive
adhesive tapes. The NPs for transmission electron microscopy (TEM, JEM-2100) measurement was prepared by dropping the
solution onto a carbon-coated copper grid following negative staining with 2.0% (w/v) phosphotungstic acid. The particle size
and size distribution of PLGA NPs were measured by dynamic light scattering (DLS) (a Mastersizer 2000 particle size
analyzer) with a fixed scattering angle of 90°. The measurement was performed. Zeta potential measurement was performed at
25 °C on a Malvern Zeta sizer-Nano Z instrument. The glass transition temperature (Tg) was measured with differential
scanning calorimetry (DSC, Mettler-Toledo, Switzerland).
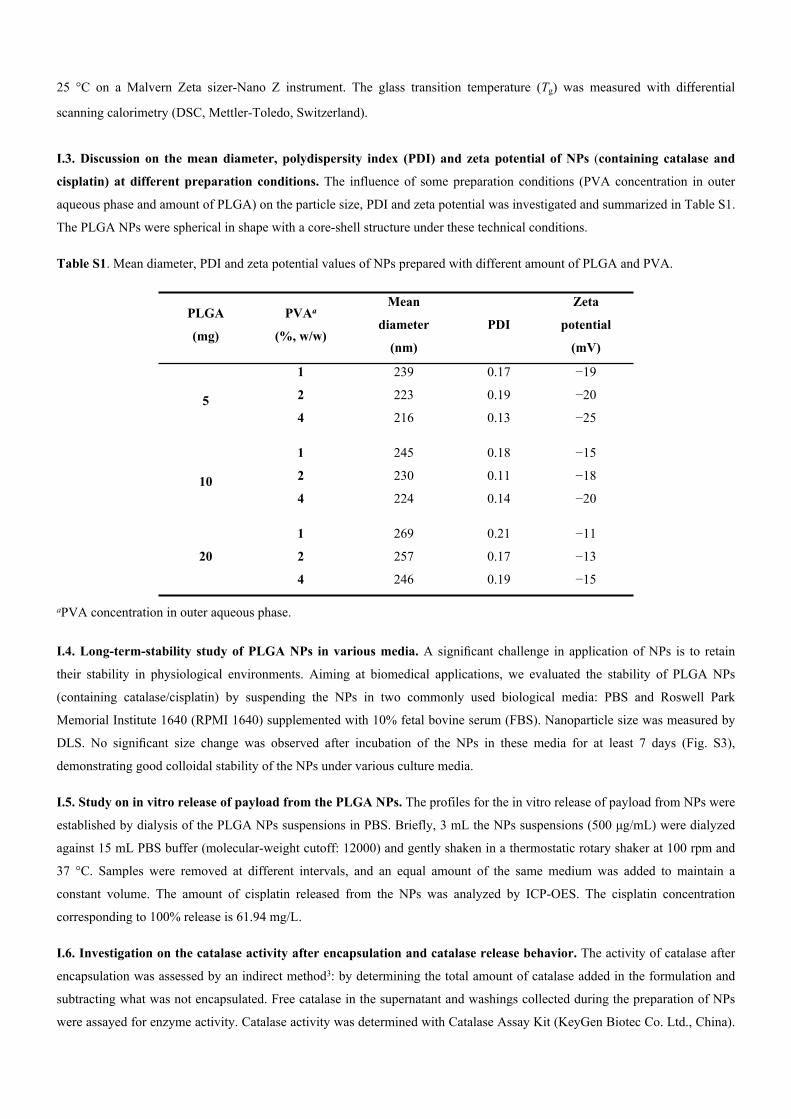
I.3. Discussion on the mean diameter, polydispersity index (PDI) and zeta potential of NPs (containing catalase and
cisplatin) at different preparation conditions. The influence of some preparation conditions (PVA concentration in outer
aqueous phase and amount of PLGA) on the particle size, PDI and zeta potential was investigated and summarized in Table S1.
The PLGA NPs were spherical in shape with a core-shell structure under these technical conditions.
Table S1. Mean diameter, PDI and zeta potential values of NPs prepared with different amount of PLGA and PVA.
PLGA
(mg)
PVAa
(%, w/w)
Mean
diameter
(nm)
PDI
Zeta
potential
(mV)
1 239 0.17 −19
2 223 0.19 −2054 216 0.13 −25
1 245 0.18 −15
2 230 0.11 −18104 224 0.14 −20
1 269 0.21 −11
2 257 0.17 −1320
4 246 0.19 −15
aPVA concentration in outer aqueous phase.
I.4. Long-term-stability study of PLGA NPs in various media. A significant challenge in application of NPs is to retain
their stability in physiological environments. Aiming at biomedical applications, we evaluated the stability of PLGA NPs
(containing catalase/cisplatin) by suspending the NPs in two commonly used biological media: PBS and Roswell Park
Memorial Institute 1640 (RPMI 1640) supplemented with 10% fetal bovine serum (FBS). Nanoparticle size was measured by
DLS. No significant size change was observed after incubation of the NPs in these media for at least 7 days (Fig. S3),
demonstrating good colloidal stability of the NPs under various culture media.
I.5. Study on in vitro release of payload from the PLGA NPs. The profiles for the in vitro release of payload from NPs were
established by dialysis of the PLGA NPs suspensions in PBS. Briefly, 3 mL the NPs suspensions (500 μg/mL) were dialyzed
against 15 mL PBS buffer (molecular-weight cutoff: 12000) and gently shaken in a thermostatic rotary shaker at 100 rpm and
37 °C. Samples were removed at different intervals, and an equal amount of the same medium was added to maintain a
constant volume. The amount of cisplatin released from the NPs was analyzed by ICP-OES. The cisplatin concentration
corresponding to 100% release is 61.94 mg/L.
I.6. Investigation on the catalase activity after encapsulation and catalase release behavior. The activity of catalase after
encapsulation was assessed by an indirect method3: by determining the total amount of catalase added in the formulation and
subtracting what was not encapsulated. Free catalase in the supernatant and washings collected during the preparation of NPs
were assayed for enzyme activity. Catalase activity was determined with Catalase Assay Kit (KeyGen Biotec Co. Ltd., China).
The reaction of H2O2 decomposition by catalase was terminated by adding ammonium molybdate, with the remaining H2O2
and ammonium molybdate producing a pale yellow complex which was measured at 405 nm. All assays were carried out in
triplicate. The catalase activity after encapsulation was measured to be 47 U in each mg of PLGA NPs, which corresponding to
13.4% of encapsulated catalase. In vitro release was performed by suspending catalase-loaded NPs in 20 mL PBS with 100 μM
H2O2 equilibrated at 37 °C. At fixed time intervals, 1 mL suspension was transferred to a 2 mL microtube and the supernatant
was taken for enzyme quantization after centrifugation.
I.7. Cell culture and confocal imaging. Human cervical carcinoma HeLa cells, human breast cancer MCF-7 cells, human
alveolar adenocarcinoma A549 cells, drug resistance A549/CDDP, human gastric cancer SGC-7901, drug resistance SGC-
7901/DDP cells were cultured in glass bottom dishes. Cells were seeded at a density of 1×10⁶ cells/mL in RPMI 1640
supplemented with 10% FBS, NaHCO3 (2 g/L) and 1% antibiotics (penicillin/streptomycin, 100 U/mL). The cells were
maintained in a humidified incubator at 37 °C, in 5% CO2/95% air. One day before imaging, cells were passed and plated on
18-mm glass bottom dishes. Cell imaging was carried out after washing cells with PBS for three times. Confocal fluorescence
imaging studies were performed with a ZEISS Laser Scanning Microscope (Zeiss LSM 710).
I.8. In vitro cytotoxicity assay. To investigate cytotoxicity of the samples: free [PtLCl]Cl, [PtLCl]Cl-loaded NPs, free
cisplatin, cisplatin-loaded NPs, and NPs (no catalase), MTT assay were carried out on HeLa and MCF-7 cells. Cells (106
cells/mL) were dispersed within replicate 96-well microtiter plates to a total volume of 200 μL/well. Plates were maintained at
37 °C in a 5% CO2/95% air incubator for 24 h. The samples were diluted to different concentrations of solution and added to
each well after the original medium has been removed. Cells were incubated with different concentrations of the samples for
48 h. Then, 20 μL of 5 mg/mL MTT solution in pH 7.4 PBS was added to each well. After 4-h incubation, the medium
containing unreacted MTT was removed carefully, and 150 μL of DMSO was added to each well to dissolve the formazan
crystals. After 1 h the absorbance (Abs.) was measured at 490 nm in a TRITURUS microplate reader. The cell viability was
then determined by the following equation: Cell viability (%) = (mean of Abs. value of treatment group/mean Abs. value of
control) × 100%. Calculation of the half lethal dose (IC50) values was done according to Huber and Koella.4
I.9. Flow Cytometry Analysis. To study the cell apoptosis induced by free cisplatin and NPs on SGC-7901/DDP cells, a flow
cytometric assay of annexin V-FITC and propidium iodide (PI) costaining was employed.5 The cells were harvested, rinsed in
PBS, resuspended, and determined by flow cytometry using Cytomics FC500 Flow Cytometry (Beckman Coulter Ltd.). All
experiments detected at least 10,000 cells and the data were analyzed with FCS Express V3.
I.10. Study of the intracellular release of O2 from the PLGA NPs. The intracellular release of O2 was investigated by
confocal fluorescence imaging. The intracellular O2 levels were assessed with an O2 sensing probe [(Ru(dpp)3)]Cl2, the
fluorescence of which is strongly reduced by molecular oxygen)6 by comparing the [Ru(dpp)3]Cl2 fluorescence intensity of
NPs (containing catalase only)-treated cells with untreated cells. PMA-stimulated HeLa cells were incubated with 5 μM
[Ru(dpp)3]Cl2 for 4 h and further incubated with 50 μg/mL NPs for 24 h. The cells were excited at 488 nm and the emission
was collected between 600 nm and 700 nm.
I.11. JC-1 assay. The membrane-permeant JC-1 dye is widely used to determine the early stage of apoptosis.7 In healthy cells
with high mitochondrial membrane potential, JC-1 spontaneously forms complexes known as J-aggregates with intense red
fluorescence. On the other hand, in apoptotic or unhealthy cells with low mitochondrial membrane potential, JC-1 remains in
the monomeric form, which shows only green fluorescence. In JC-1 assay, cells were treated with free cisplatin or NPs for 24 h,
and then loaded with the 5 µM JC-1 dye for 30 min at 37 °C. Prior to imaging, the medium was removed and cells were
washed with PBS for three times. The fluorescence of green channel was excited at 488 nm and the emission was collected
between 510-545 nm. The fluorescence of red channel was excited at 543 nm and the emission was collected between 575-630
nm.
II.1.
Fig. S1. Zeta potential distribution of the PLGA NPs.
II.2.
Fig. S2. Stability study on PLGA NPs at physiological temperature in the absence of H2O2: the in vitro release profiles of
cisplatin from PLGA NPs incubated in PBS at 37 °C. Insets: the SEM micrographs of PLGA NPs incubated in PBS at 37 °C at
0 h and 24 h. Scale bar: 200 nm.
II.3.
Fig. S3. Long-term-stability study of PLGA NPs in PBS and in RPMI 1640 with 10% FBS.
II.4.
Fig. S4. The size stability of PLGA NPs (without catalase) in the presence of 100 μM H2O2. Insets: the SEM micrographs of
PLGA NPs (without catalase) incubated with 100 μM H2O2 at 0 h and 24 h. Scale bar: 200 nm.
II.5.
Fig. S5. Normalized fluorescence of [PtLCl]Cl upon release from the PLGA NPs in the presence of 100 μM H2O2.
II.6.
Fig. S6. Absorption spectrum of BHQ-2.
II.7.
Fig. S7. Confocal fluorescence images of PMA-stimulated HeLa cells incubated with the NPs for 16 h and then incubated with
(a) LysoTracker Red FM and (b) Hoechst 33342. Scale bars: 20 μm.
II.8.
Fig. S8. Catalase release behavior from the NPs incubated with 100 μM H2O2 quantified by measuring the enzyme activity
within 24 h.
II.9.
Fig. S9. MTT assay of HeLa cells in the presence of different concentrations of free [PtLCl]Cl.
II.10.
Fig. S10. MTT assay of HeLa cells in the presence of different concentrations of [PtLCl]Cl-loaded NPs and [PtLCl]Cl-loaded
NPs (without catalase).
II.11.
Fig. S11. MTT assay of HeLa cells in the presence of 20 μM free [PtLCl]Cl, NPs, NPs (no catalase) and NPs (no [PtLCl]Cl).
The concentration of free [PtLCl]Cl used was equivalent to what was incorporated into the NPs.
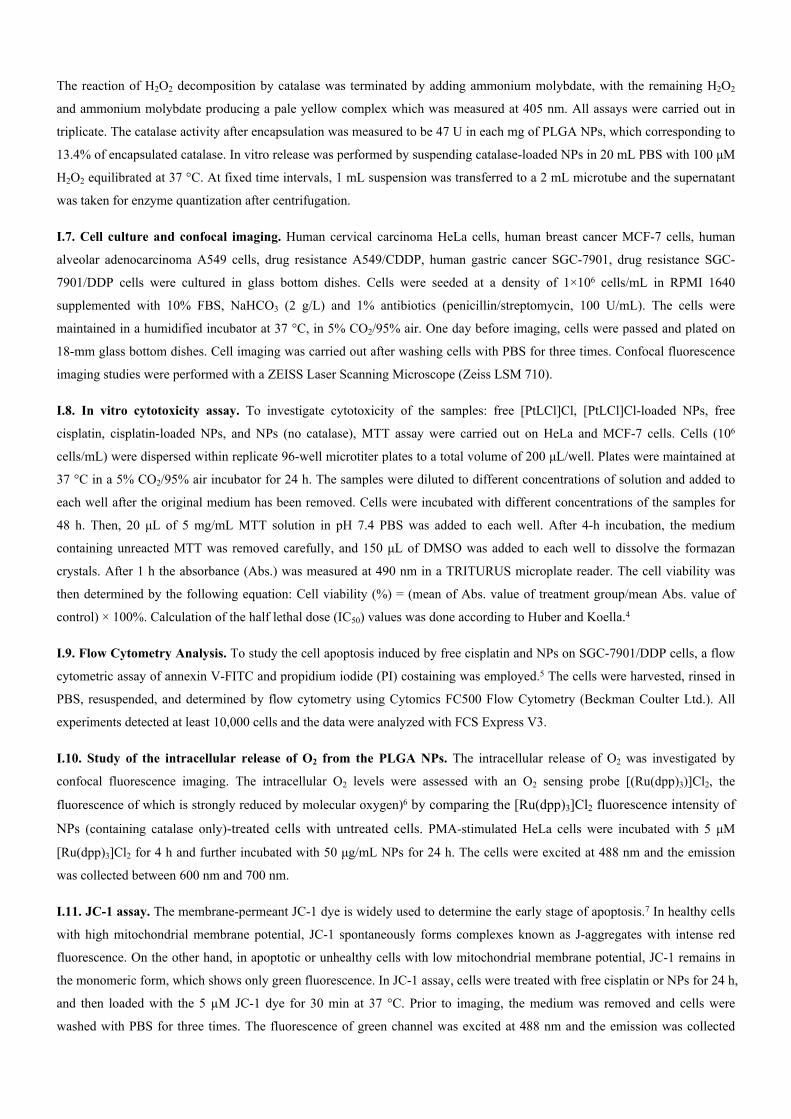
II.12.
Fig. S12. Confocal fluorescence images showing increased intracellular O2 level after treated with catalase-loaded NPs. PMA-
stimulated HeLa cells incubated with 5 μM [Ru(dpp)3]Cl2 for 4 h, followed by incubation with the NPs for a) 0 h, b) 8 h, c) 16
h and d) 24 h. e)-h) represent the bright field images of a)-d) respectively. Scale bars: 10 μm. i) Normalized average
intracellular fluorescence intensity of PMA-stimulated and [Ru(dpp)3]Cl2-loaded HeLa cells incubated with NPs for different
time.
II.13.
Fig. S13. Confocal fluorescence images of apoptosis by the JC-1 assay in drug-sensitive SGC 7901 and drug resistance SGC
7901/DDP cells treated with free cisplatin, NPs or NPs (no catalase) for 24 h. The amount of the cisplatin incorporated in
PLGA NPs was equivalent to that used in free cisplatin. Scale bars: 25 μm.
II.14.
Fig. S14. Confocal fluorescence images of apoptosis by the JC-1 assay in a) drug-sensitive A549 and b) drug resistance
A549/CDDP cells treated with free cisplatin or cisplatin-loaded NPs for 24 h. Scale bars: 25 μm.
II.15.
Fig. S15. Flow cytometry analysis of drug resistance SGC-7901/DDP cells after free cisplatin or cisplatin-loaded NPs
treatment. a) Control. b) SGC-7901/DDP cells treated with free cisplatin for 24 h. c) SGC-7901/DDP cells treated with
cisplatin-loaded NPs for 24 h.
II.16.
Fig. S16. MTT assay of (a) SGC 7901cells and (b) SGC 7901/DDP cells in the presence of different concentrations of free
cisplatin and cisplatin inside the NPs (with/without catalase).
Supplementary references
(1) S. Wu, C. Zhu, C. Zhang, Z. Yu, W. He, Y. He, Y. Li, J. Wang and Z. Guo, Inorg. Chem., 2011, 50, 11847.
(2) F. Tu and D. Lee, Langmuir, 2012, 28, 9944.
(3) C. Qi, Y. Chen, Q. Z. J and X. G. Wang, Int. J. Mol. Sci., 2011, 12, 4282.
(4) W. Huber and J. C. Koella, Acta Trop., 1993, 55, 257.
(5) I. Vermes, C. Haanen and C. Reutelingsperger, J. Immunol. Methods, 2000, 243, 167.
(6) I. Gryczynski, Z. Gryczynski, G. Rao and J. R. Lakowicz, Analyst, 1999, 124, 1041.
(7) S. Dhar, S. J. Lippard, Proc. Natl. Acad. Sci. USA, 2009, 106, 22199.