Supporting maintenance of sugar-sweetened beverage reduction usingautomated versus live telephone support:findings from a randomized control trialJamie M. Zoellner6,7*, Wen You1, Paul A. Estabrooks2, Yvonnes Chen3, Brenda M. Davy4, Kathleen J. Porter7,Valisa E. Hedrick4, Angela Bailey5 and Natalie Kružliaková4
Abstract
Background: Although reducing sugar-sweetened beverage (SSB) intake is an important behavioral strategy toimprove health, no known SSB-focused behavioral trial has examined maintenance of SSB behaviors after an initialreduction. Guided by the RE-AIM framework, this study examines 6–18 month and 0–18 month individual-levelmaintenance outcomes from an SSB reduction trial conducted in a medically-underserved, rural Appalachia regionof Virginia. Reach and implementation indicators are also reported.
Methods: Following completion of a 6-month, multi-component, behavioral RCT to reduce SSB intake (SIPsmartERcondition vs. comparison condition), participants were further randomized to one of three 12-month maintenanceconditions. Each condition included monthly telephone calls, but varied in mode and content: 1) interactive voiceresponse (IVR) behavior support, 2) human-delivered behavior support, or 3) IVR control condition. Assessmentsincluded the Beverage Intake Questionnaire (BEVQ-15), weight, BMI, and quality of life. Call completion rates andcosts were tracked. Analysis included descriptive statistics and multilevel mixed-effects linear regression modelsusing intent-to-treat procedures.
Results: Of 301 subjects enrolled in the 6-month RCT, 242 (80%) were randomized into the maintenance phase and235 (78%) included in the analyses. SIPsmartER participants maintained significant 0–18 month decreases in SSB. ForSSB, weight, BMI and quality of life, there were no significant 6–18 month changes among SIPsmartER participants,indicating post-program maintenance. The IVR-behavior participants reported greater reductions in SSB kcals/dayduring the 6–18 month maintenance phase, compared to the IVR control participants (− 98 SSB kcals/day, 95%CI = − 196, − 0.55, p < 0.05); yet the human-delivered behavior condition was not significantly different from eitherthe IVR-behavior condition (27 SSB kcals/day, 95% CI = − 69, 125) or IVR control condition (− 70 SSB kcals/day,95% CI = − 209, 64). Call completion rates were similar across maintenance conditions (4.2–4.6 out of 11 calls);however, loss to follow-up was greatest in the IVR control condition. Approximated costs of IVR and human-delivered calls were remarkably similar (i.e., $3.15/participant/month or $38/participant total for the 12-monthmaintenance phase), yet implications for scalability and sustainability differ.
(Continued on next page)
* Correspondence: [email protected] of Public Health Sciences, School of Medicine, University ofVirginia, P.O. Box 800717, Charlottesville, VA 22908-0717, USA7Cancer Center without Walls at the UVA Cancer Center, 16 East Main St,Christiansburg, VA 24073, USAFull list of author information is available at the end of the article
Conclusion: Overall, SIPsmartER participants maintained improvements in SSB behaviors. Using IVR to support SSBbehaviors is effective and may offer advantages as a scalable maintenance strategy for real-world systems in ruralregions to address excessive SSB consumption.
Trial registry: Clinicaltrials.gov; NCT02193009; Registered 11 July 2014. Retrospectively registered.
BackgroundHealth concerns surrounding the excessive consumptionof sugar-sweetened beverage (SSB) intake is arguablyone of the most publicized and controversial topicsamong current public health issues. SSB currentlycontributes approximately 7% of total energy intake forUnited States adults [1]; and rank third in overall foodsources of energy and rank first in sources of carbohy-drate [2]. Of additional importance are the significantlyhigher SSB intakes among rural adults [3] and theinverse relationship between intake of added sugarsand educational attainment [4]. For example, in theAppalachian region targeted by this research, resi-dents consume over three times the national averageof SSB [5]. Our Appalachian data suggest overallconsumption of added sugar comprises an estimated21% of total energy intake among adults [6]; and,similar to national data, SSB is the largest contributorto added sugar intake in this region.There are strong scientific data indicating associations
among SSB and numerous health issues such as obesity,type 2 diabetes, cardiovascular disease, caries and oralhealth [7–11]. There is also extensive debate regardingthe proposed solutions to excessive SSB intake. Whencompared to macro-level approaches to reduce SSB con-sumption [12–15], behavioral programs are generallyviewed as much more acceptable, met with less politicalopposition, and regarded as a necessary complement toany higher level (e.g., community, policy) strategy.However, effective behavioral interventions targetingSSB reduction are only useful if post-program behaviorchanges are maintained and if real-world systems canimplement and sustain the programs. Although attainingand maintaining current recommendations for SSB in-take over long periods of time is an important behavioralstrategy to improve health, no known SSB-focusedbehavioral trial has examined maintenance of SSBbehaviors [16].Maintenance, at the individual level, refers to the
long-term effects of a program on outcomes six or moremonths after the most recent intervention contact [17].Behavioral maintenance represents a key challenge forthe prevention and treatment of chronic disease [18].Likewise, maintenance of change following interventionsis not often reported, especially in community-based
interventions [19, 20]. Extended care provides prolongedparticipant contact to prevent relapse following initialbehavior change and is a viable strategy to addresslong-term maintenance of health behaviors following anintervention [21]. Telephone-delivered extended careprograms represent a potentially effective and low-costway for promoting long-term health behavior change inrural communities [21, 22].Though little is known about maintenance effects and
use of extended care strategies to support SSB behaviors,the weight loss literature provides some useful insight.The use of extended care is recommended to addressthe issue of maintenance [21]; however, a systematic re-view of the effectiveness of technology-based (internet,telephone and interactive television) weight-loss main-tenance interventions found mixed results [23]. Overall,the review found technology based extended care wasmore effective than usual care, but not as effective aspersonal contact. Nonetheless, when considering ex-tended care programs in rural communities, it is neces-sary to explore different delivery methods because ofincreased travel to reach participants and potential costsassociated with personal contact for both the deliverysystem and participants [24, 25].Automated telephone calls utilizing interactive voice
response (IVR) systems may represent a cost-effectiveand acceptable strategy to facilitate ongoing engagementin SSB and other health behaviors with individuals inrural areas [26, 27]. Several studies support the use of IVRcalls for chronic disease self-management [28], physicalactivity promotion [29, 30], and smoking cessation [30].However, there is limited research related to the use ofIVR delivered telephone calls as a maintenance strategy,especially when compared to human-delivered telephonecalls [23, 31]. Likewise, there is a dearth of behavioralmaintenance interventions that compare human to auto-mated strategies and also examine cost and scalability, orthe capacity of a system or process to accommodate agrowth in the number of participants.In addition to examining individual level maintenance,
it is also critical to understand reach and implementationdimensions as these factors influence the potential ofreal-world systems sustaining extended care strategies.The RE-AIM (reach, effectiveness, adoption, implementa-tion, maintenance) framework helps guide the evaluation
Zoellner et al. International Journal of Behavioral Nutrition and Physical Activity (2018) 15:97 Page 2 of 16
of behavioral interventions, highlighting the importanceof both internal and external validity elements [32].Evidenced across numerous systematic RE-AIM reviews,information on implementation indicators are typicallyunderreported, including information on intervention cost[33–35]. Combined with the challenges of individual-levelbehavioral maintenance, there is also a gap in the litera-ture around the cost and scalability of effective mainten-ance strategies [36, 37]. This gap is even wider in ruralunderserved regions, where behavioral and health dispar-ities persist.SIPsmartER is a theory-based, 6-month, multi-compo-
nent health literacy intervention designed to reduce SSBintake among rural Appalachian adults [38]. Using a ran-domized controlled trial (RCT), SIPsmartER has beenshown to be effective from baseline to 6-months. Rela-tive to matched-contact comparison group targetingphysical activity behaviors (e.g. MoveMore), SIPsmartERparticipants significantly decreased SSB intake, improvedoverall dietary and beverage quality, and demonstratedimprovement in a δ13C added sugar intake biomarker[39–41]. SIPsmartER also yielded small, yet significant,improvements in weight and BMI. At completion of the6-month intervention, participants were further random-ized to one of three 12-month maintenance conditions(i.e., behavior-specific IVR calls, behavior-specifichuman-delivered support calls, IVR call control condi-tion) [38]. Data from this maintenance phase have notyet been reported.Guided by the RE-AIM evaluation framework, this
manuscript focuses on the reach, maintenance of effects,and implementation of maintenance. The primary aimof this manuscript is to explore individual-level mainten-ance of outcomes. As such, the first objective is to com-pare 0–18 and 6–18 month outcomes [i.e., SSB intake,weight, BMI, quality of life (QOL)] between SIPsmartERparticipants and matched-contact comparison partici-pants, regardless of randomized maintenance condition.We hypothesized that 0–6 month improvements in SSBintake, weight, BMI, and QOL would be sustained in the12-month maintenance phase for SIPsmartER partici-pants. The second objective is to examine individual-leveloutcomes by randomized maintenance condition amongSIPsmartER participants. We hypothesize that mainten-ance effects for both the behavior-specific IVR calls andbehavior-specific human-delivered support calls would besuperior when compared to the IVR call control condi-tion. Secondary aims are to explore reach and implemen-tation indicators of the maintenance phase, including callcompletion rates and costs.
MethodsThis RCT took place between 2012 and 2015 andoccurred in eight southwestern Virginian counties.
These targeted rural, Appalachia counties are federallydesignated as a medically underserved area [42] andhave an average rurality status of 6.3 on the 9-pointRural-Urban Continuum Codes (1 = urban, 9 = com-pletely rural) [43]. Similarly, these counties consistentlyscore lowest on the Health Opportunity Index (i.e., lessopportunity) [44].
Ethics approvalThe Virginia Tech Institutional Review board approvedall study procedures. Participants were informed of therandom allocation process and provided written consentto participate. Gift cards were provided at the baseline,6-month and 18-month assessments (i.e., $25, $50, and$75, respectively).
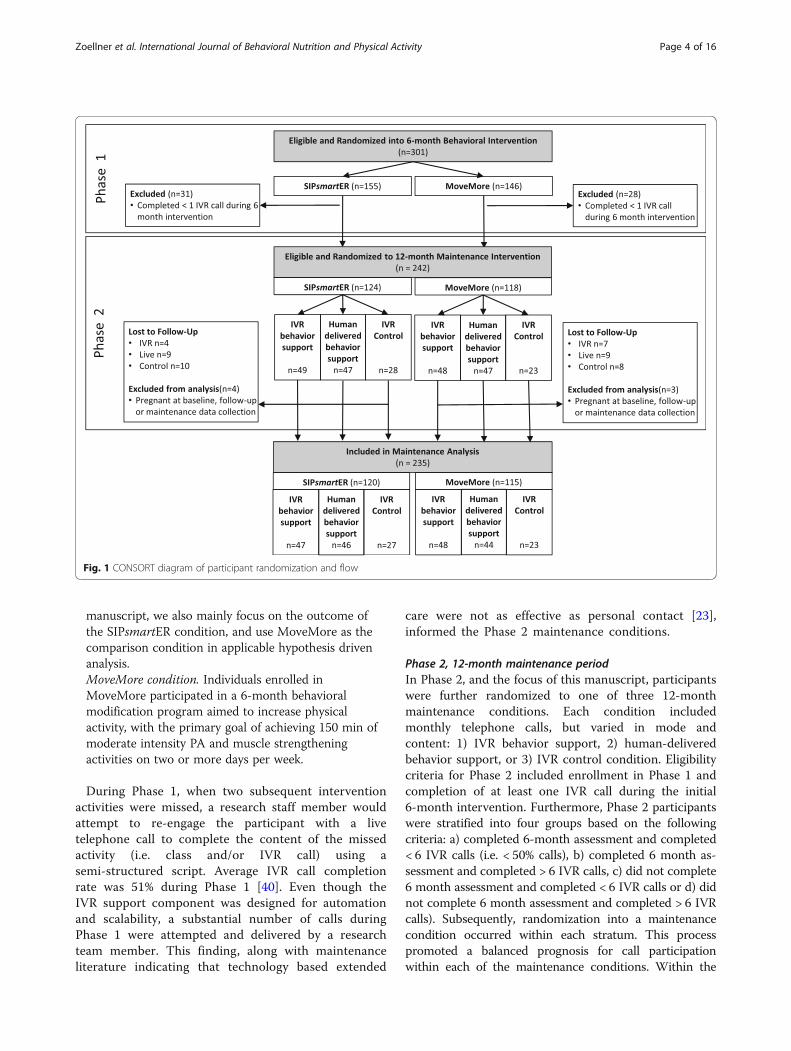
Study design, eligibility & intervention descriptionsThe consort diagram illustrates participant flow andrandomization (Fig. 1). As described below, this 2-phasedstudy included two time points of randomization.
Phase 1, 6-month behavioral interventionIn Phase 1, and using a simple randomization protocol,eligible participants were randomly assigned to the SIPs-martER (n = 155) or MoveMore comparison condition(n = 146). Eligibility criteria for Phase 1 enrollment in-cluded English-speaking adults who were 18 years of ageor older, consumed > 200 SSB kcals/day, reported nocontraindications for physical activity, had regular accessto a telephone, and who were not concurrently enrolledin another nutrition or physical activity program.Throughout the targeted counties a variety of active(e.g., recruitment at health departments) and passive(e.g., flyers, newspaper ads, word of mouth) recruitmentstrategies were used. Full recruitment, reach, and repre-sentativeness data are presented elsewhere [45].Both the SIPsmartER and MoveMore conditions were
6-month behavioral modification programs that includedthree small group sessions, one teach-back call, 11 IVRtelephone calls, completion of personalized action plansand self-monitoring log sheets. A detailed account of thestructure, theoretical constructs, and content of the clas-ses and IVR calls is described elsewhere [38, 46, 47].Both conditions were guided by Theory of Planned Be-havior and health literacy concepts and strategies, andwere designed for broad dissemination [48–52].
SIPsmartER condition. Individuals enrolled inSIPsmartER participated in a 6-month behavioral modi-fication program aimed to decrease SSB intake, withthe primary goal of achieving the SSB recommendationof less than 8 fluid ounces per day [53, 54]. SIPsmartERwas the main program of interest in this RCT and SSBbehavior was the primary outcome. In this maintenance
Zoellner et al. International Journal of Behavioral Nutrition and Physical Activity (2018) 15:97 Page 3 of 16
manuscript, we also mainly focus on the outcome ofthe SIPsmartER condition, and use MoveMore as thecomparison condition in applicable hypothesis drivenanalysis.MoveMore condition. Individuals enrolled inMoveMore participated in a 6-month behavioralmodification program aimed to increase physicalactivity, with the primary goal of achieving 150 min ofmoderate intensity PA and muscle strengtheningactivities on two or more days per week.
During Phase 1, when two subsequent interventionactivities were missed, a research staff member wouldattempt to re-engage the participant with a livetelephone call to complete the content of the missedactivity (i.e. class and/or IVR call) using asemi-structured script. Average IVR call completionrate was 51% during Phase 1 [40]. Even though theIVR support component was designed for automationand scalability, a substantial number of calls duringPhase 1 were attempted and delivered by a researchteam member. This finding, along with maintenanceliterature indicating that technology based extended
care were not as effective as personal contact [23],informed the Phase 2 maintenance conditions.
Phase 2, 12-month maintenance periodIn Phase 2, and the focus of this manuscript, participantswere further randomized to one of three 12-monthmaintenance conditions. Each condition includedmonthly telephone calls, but varied in mode andcontent: 1) IVR behavior support, 2) human-deliveredbehavior support, or 3) IVR control condition. Eligibilitycriteria for Phase 2 included enrollment in Phase 1 andcompletion of at least one IVR call during the initial6-month intervention. Furthermore, Phase 2 participantswere stratified into four groups based on the followingcriteria: a) completed 6-month assessment and completed< 6 IVR calls (i.e. < 50% calls), b) completed 6 month as-sessment and completed > 6 IVR calls, c) did not complete6 month assessment and completed < 6 IVR calls or d) didnot complete 6 month assessment and completed > 6 IVRcalls). Subsequently, randomization into a maintenancecondition occurred within each stratum. This processpromoted a balanced prognosis for call participationwithin each of the maintenance conditions. Within the
Fig. 1 CONSORT diagram of participant randomization and flow
Zoellner et al. International Journal of Behavioral Nutrition and Physical Activity (2018) 15:97 Page 4 of 16
SIPsmartER and MoveMore comparison condition, theplanned allocation ratio was 2:2:1, respectively, for IVRbehavior support, human-delivered behavior support, andIVR control condition.
IVR behavioral support condition. Participants in thisgroup received TPB informed telephone support callsfrom an automated IVR system. The 11 monthly callswere structurally similar to the 11 IVR calls received inthe initial 6-month intervention [38, 46]. During eachmaintenance call, participants reported their behavior(SIPsmartER reported ounces of SSB; MoveMorereported minutes of PA), received tailored feedbackbased on goal maintenance and could elect to set a newmaintenance goal. Participants then either identifiednew barriers and strategies pertaining to their behavioror kept the same ones identified previously. The callended with a short TPB-based message that reinforcedkey information presented during Phase 1.Human-delivered behavioral support condition.Participants in this group received TPB-based tele-phone support calls that included 11 monthly callsfrom an appointed member of the research team. Thescripted call followed an identical format as the IVRbehavioral condition described above.IVR control condition. Participants in the control groupreceived 11 monthly IVR calls that included monthlyupdates on the study such as, “it’s been three monthssince we’ve seen you,” and delivered entertainingscience facts such as, “sunshine can help your sleeppatterns.” Participants did not report their currentbehavior, set goals, or hear a TPB-based supportmessage. Additionally, information specific to SSB orPA was not addressed in the control call.
In both the IVR and human-delivered behavioral sup-port conditions, maintenance calls were attempted threetimes, either by the IVR system or by a research assist-ant. After the third attempt, the call was categorized asnot completed and no further attempts were made toreach the participant that month. To promote retentionat the 18-month assessment time, all participantsreceived a birthday card and a season’s greeting cardduring the maintenance phase.
MeasuresEligibility and demographic information was collectedduring the screening process prior to enrollment in Phase1. The screening instrument included questions about sex,age, race/ethnicity, education level, family/household in-come, employment status, health care coverage, maritalstatus, number of children in the home, county of resi-dence, SSB intake and contraindications for physical
activity. Health literacy was assessed using the NewestVital Sign at baseline [55].All outcomes were measured during health screenings
in community-based settings (e.g., public health build-ings, Extension offices, churches) that occurred at base-line, 6-months and 18-months. The primary outcome,SSB intake, was measured by the BEVQ-15, a validatedfood-frequency instrument that assesses beverageconsumption over the past month [56]. SSB intake iscalculated by summing five items including regular softdrinks, sweetened juice beverage/drink, sweetened tea,coffee with sugar, and energy and sports drinks. Weightwas measured without shoes and light clothing using acalibrated digital Tanita scale (Model: 310GS). Heightwas measured with a research-grade stadiometer. TheCenters for Disease Control Healthy Days module wasused to assess quality of life [57].Implementation was defined as the number of tele-
phone calls completed over the 12-month maintenanceintervention (out of a possible 11). Bi-monthly researchteam meetings and on-line tracking forms were used tomonitor fidelity to established protocols, includinghuman-delivered behavior calls attempts and comple-tion. For the IVR calls, records were maintained relatedto the cost of hosting the platform during the durationof the maintenance phase. Implementation costs of themaintenance conditions were tracked through monthlyfinancial records, including invoices from our IRVvendor, as well as research assistants’ salary informationand call attempt and time log records.
Statistical analysisAll data were entered into SPSS statistical analysissoftware (version 22.0, 2012, International BusinessMachines Corporation, Pittsburgh, PA) and validatedscoring procedures were applied to compute outcomevariable scores. Descriptive statistics were used tosummarize demographic characteristics and participa-tion rates [e.g. means, standard deviations (SD), mediansand interquartile range (IQR)], as well as costs. Chisquare tests of association or Fisher’s exact tests(categorical variables) and ANOVA (continuousvariables) were used to compare demographics betweenparticipants enrolled and not enrolled in Phase 2 and toexamine differences in engagement rates among ran-domized conditions.Multilevel mixed-effects linear regressions analyses
were performed using Stata software to account forclustering of individuals within county cohorts (version13, 2013, StataCorp LP, College Station, TX). Themixed-effect models controlled for individual baselinecharacteristics, dummies of time and condition, and atime by condition dummy interaction. All models calcu-lated robust standard errors for county/cohort cluster.
Zoellner et al. International Journal of Behavioral Nutrition and Physical Activity (2018) 15:97 Page 5 of 16
The baseline covariates controlled in the models werechosen a priori and included age, gender, race/ethnicity,income, education level, health literacy level, employ-ment status, number of children, smoking status, andBMI [58]. For analytical purposes, all women who werepregnant at any study point were excluded from themaintenance analysis.Our initial analyses included 18-month present at
follow-up (completers only), as well as intention-to-treatusing last-observation-carried-forward. These analyticprocedures yielded similar results, with the expectedlargest effect sizes found in the present at follow-upanalysis. Therefore, intention-to-treat results, the moreconservative effects, are reported in this manuscript[59, 60]. We also report Cohen’s d effect sizes for therelative mean treatment effects between the random-ized conditions [61].This trial was powered to detect a small effect size of
0.34 for 0–6 month changes in SSB intake between theSIPsmartER and MoveMore conditions (i.e., 80% power,0.05 type 1 error). Since this trial was not specificallydesigned or powered to detect maintenance effects, theanalyses and interpretation of findings are consideredexploratory.
ResultsReachOf 301 subjects enrolled in Phase 1, 242 (80.4%) werefurther randomized in the maintenance phase (Fig. 1).Of the 124 SIPsmartER participants in the maintenancephase, randomization included 49 in the IVR-behaviorsupport condition, 47 in the human-delivered behaviorsupport condition, and 28 in the IVR control condition.Of the 118 MoveMore participants in the maintenancephase, randomization included, 48 in the IVR-behaviorsupport condition, 47 in the human-delivered behaviorsupport condition, and 23 in the IVR control condition.Of those randomized in the maintenance phase, 57
were lost to follow-up and 195 (81%) returned for the18-month assessment. The loss to follow up betweenSIPsmartER (23 of 124; 19%) and MoveMore (24 of 118;20%) conditions were similar. However, the loss to fol-low up was greatest for the IVR control group (18 of 51;35%), followed by the human-delivered behavior supportcondition (18 of 94; 19%), and was lowest among theIVR behavioral support condition (11 of 97; 11%). Sevenpregnant women (i.e., four in SIPsmartER and three inMoveMore) were excluded from all additional mainten-ance phase analyses, resulting in 235 participants.Table 1 illustrates the demographic characteristics of
participants included in this maintenance phase analysis,including the 120 SIPsmartER and 115 MoveMoreparticipants. The majority of the participants were aged25–64, female, Caucasian, and had an annual household
income <$35,000. The average baseline BMI was around33, with 22% classified as overweight and 57% as obese.To describe representativeness, Table 1 also explores dif-ferences among participants enrolled in the maintenancephase to those originally enrolled in the trial but not intothe maintenance phase. In the SIPsmartER condition,compared to those who were not randomized into themaintenance phase, those included in the maintenancephase were older and more likely to be classified as un-able to work/on disability. In the MoveMore comparisoncondition, there were no significant demographic differ-ence between those who enrolled and did not enroll inthe maintenance phase.
Maintenance of effectsTable 2 describes the adjusted changes in 0–6 months, 6–18 months, and 0–18 months outcomes and relativeeffects between the SIPsmartER and MoveMore compari-son conditions, regardless of randomized maintenancecondition. SIPsmartER participants maintained significant0–18 month decreases in SSB intake by 256 (95% CI = −339, − 174, p < 0.01) kcals/day when compared to the 96(95% CI = − 149, − 43, p < 0.01) kcals/day decrease amongthe MoveMore comparison participants (p < 0.01)(Cohen’sd effect size = 0.47) (Fig. 2). The 0–18 month relativeeffects between conditions for weight and BMI changeswere not significant, yet the magnitude of change for SIPs-martER was similar to the 0–6 month outcomes. Thetrends for improvements in outcomes among the Move-More comparison condition in the 6–18 month mainten-ance phase, though not significant, is noteworthy and hasimplications for interpreting between condition effects.For SSB, weight, BMI and quality of life outcomes,the 6–18 month changes were not significant, imply-ing a maintenance of the effects achieved at conclu-sion of Phase 1 among SIPsmartER participants.For the SIPsmartER condition only, adjusted changes in
6–18 month outcomes by randomized maintenance as-signment are described in Table 3. Within each condition,there were no statistically significant 6–18 month changesfor any of the outcomes. However, the IVR-behavior groupreported significantly greater reductions in SSB kcals/day during the 6–18 month maintenance phase,compared to IVR control condition, (− 98, 95% CI = −196, − 0.55) (p < 0.05) (Cohen’s d effect size = 0.42).There were no significant differences in SSB kcal/daybetween the human-delivered behavior support conditionand IVR control condition (− 70, 95% CI = − 209, 64, NS)(Cohen’s d effect size = 0.25) or between the IVR-behaviorvs human-delivered behavior conditions (27, 95% CI = −69, 125, NS)(Cohen’s d effect size = 0.12) (Fig. 3). Finally,there were no significant differences among the ran-domized maintenance conditions for weight, BMI, orquality of life.
Zoellner et al. International Journal of Behavioral Nutrition and Physical Activity (2018) 15:97 Page 6 of 16
Table
1Baselinecharacteristicsof
participantswho
hadparticipated
in6-mon
thbe
havioralmod
ificatio
nprog
ram,b
yrand
omized
cond
ition
assign
men
t,andrepresen
tativen
ess
ofen
rolledmainten
ance
sample(n=235)
Characteristics
SIPsmartER
MoveM
ore
Mainten
ance
sample(n=120)a
Not
Enrolledin
mainten
ance
(n=31)a
Teststatistic
p-value
Mainten
ance
sample(n=115)a
Not
Enrolledin
mainten
ance
(n=28)a
Teststatistic
p-value
Age Age
(years),M
(SD)
44.2(12.6)
32.1(12.1)
F=23.0p=≤0.001
41.6(13.1)
46.5(13.7)
F=3.0p=0.08
Age
18–24
11(9)
11(35.5)
χ2=15.3p=0.002
12(10)
2(7)
χ2=3.9p=0.27
Age
25–44
54(45)
13(42)
57(50)
9(32)
Age
45–64
52(43)
7(22.5)
43(37)
16(57)
Age
≥65
3(3)
0(0)
3(3)
1(4)
Sex Male
24(20)
6(19)
χ2=0.006p=0.94
20(17)
6(21)
χ2=0.25
p=0.62
Female
96(80)
25(81)
95(83)
22(79)
Race Caucasian
110(92)
27(87)
χ2=0.6p=0.43
b110(96)
26(93)
χ2=0.38
p=0.54
b
AfricanAmerican
9(8)
1(3)
3(3)
0(0)
Morethan
onerace
1(1)
2(7)
2(2)
2(7)
Other
0(0)
1(3)
0(0)
0(0)
Ethn
icity
Hispanic/Latin
a0(0)
2(7)
NA
1(1)
0(0)
NA
Ann
ualFam
ily/Hou
seho
ldIncome
≤14,999
51(43)
18(58)
χ2=3.4p=0.33
43(37.5)
13(47)
χ2=1.6p=0.66
15,000-34,999
42(35)
10(32)
36(31)
6(22)
35,000-54,999
16(13)
2(7)
16(14)
5(18)
≥55,000
11(9)
1(3)
20(17.5)
4(14)
Employmen
tstatus
Employed
fullor
parttim
e55
(46)
15(48)
χ2=5.1p=0.024
66(57)
15(54)
χ2=0.8p=0.38
Unableto
work/on
disability
29(24)
1(3)
13(11)
5(18)
Num
berof
children
Atleast1child
inho
useh
old
58(48)
19(61)
χ2=1.7p=0.20
57(50)
14(50)
χ2=0.002p=0.97
Nochildrenin
househ
old
62(52)
12(39)
58(50)
14(50)
Zoellner et al. International Journal of Behavioral Nutrition and Physical Activity (2018) 15:97 Page 7 of 16
Table
1Baselinecharacteristicsof
participantswho
hadparticipated
in6-mon
thbe
havioralmod
ificatio
nprog
ram,b
yrand
omized
cond
ition
assign
men
t,andrepresen
tativen
ess
ofen
rolledmainten
ance
sample(n=235)
(Con
tinued)
Characteristics
SIPsmartER
MoveM
ore
Mainten
ance
sample(n=120)a
Not
Enrolledin
mainten
ance
(n=31)a
Teststatistic
p-value
Mainten
ance
sample(n=115)a
Not
Enrolledin
mainten
ance
(n=28)a
Teststatistic
p-value
Educationlevel
</=Highscho
olgraduate
39(32.5)
10(32)
χ2=0.001p=0.98
33(29)
11(39)
χ2=0.12
p=0.28
Somecollege
orgreater
81(67.5)
21(68)
82(71)
17(61)
Anthrop
ometry
Weigh
t(kg),M
(SD)
91.8(25.5)
86.2(29.8)
F=1.12
p=0.29
92.5(24.1)
83.7(23.5)
F=3.1p=0.08
BMI(kg/m
2 ),M
(SD)
33.7(8.8)
31.5(10.8)
F=1.3p=0.25
33.3(8.8)
31.0(9.4)
F=1.4p=0.24
Current
Smoker
38(32)
15(48)
χ2=3.0p=0.08
30(26)
10(36)
χ2=1.0p=0.31
Health
literacy(HL)
status
c
Highlikelihoo
dor
Possibility
oflim
itedHL(score
0–3)
46(38)
9(29)
χ2=0.9p=0.34
31(27)
10(36)
χ2=0.8p=0.36
Ade
quateHL(score
4–6)
74(62)
22(71)
84(73)
18(64)
BaselineSSB,kcals
495(401)
500(254)
F=0.004p=0.95
390(289)
347(279)
F=0.35
p=0.56
Ftest
wereused
tocompa
remeans
across
cond
ition
san
dchisqu
aretestswereused
tocompa
reprop
ortio
nsacross
thecond
ition
s.Cellsdo
notalwayseq
ual1
00%
dueto
roun
ding
M=Mean,
SD=Stan
dard
Deviatio
n,NA=no
tap
plicab
ledu
eto
smallcellcou
nta n
(%)un
less
othe
rwiseno
ted
bDue
tosm
allcellcou
nt,rep
ortedχ2
statistic
represen
tsCau
casian
compa
redto
allo
ther
races
c Health
literacywas
assessed
usingthevalid
ated
New
estVitalS
ign
Zoellner et al. International Journal of Behavioral Nutrition and Physical Activity (2018) 15:97 Page 8 of 16
Table
2Adjusted6-
and18-m
onthsou
tcom
esandrelativeeffectsbe
tweenSIPsmartER(n=120)
andMoveM
ore(n=115)
cond
ition
s
Outcome
Con
ditio
nBaselinea
Δ,b
aseline
to6mon
thsb
Relative0to
6mon
theffectsbe
tweencond
ition
sb,c
Δ,6
to18
mon
thsb
Relative6to
18mon
theffectsbe
tweencond
ition
sb,c
Δ,b
aseline
to18
mon
thsb
Relative0to
18mon
theffects
betw
eencond
ition
sb,c
SSB,kcals
SS495(401)
−277(−
375,−179)***
−206(−
309,−102)***
21(−13,54)
46(−
13,105)
−256(−
339,−174)***
−160(−
264,−56)**
MM
390(289)
−71
(−112,−31)***
−25
(−66,16)
−96
(−149,−43)***
BMI,kg/m
2SS
33.71(8.84)
−0.26
(−0.44,−
0.09)**
−0.32
(−0.66,0.02)
0.05
(−0.31,0.42)
0.24
(−0.11,0.58)
−0.21
(−0.71,0.30)
−0.08
(−0.60,0.44)
MM
33.28(8.85)
0.06
(−0.21,0.33)
−0.18
(−0.72,0.35)
−0.12
(−0.70,0.45)
Weigh
t,kg
SS91.8(25.5)
−0.58
(−1.13,−
0.04)*
−0.54
(−1.29,0.21)
0.03
(−0.74,0.80)
0.44
(−0.39,1.28)
−0.55
(−1.64,0.53)
−0.10
(−1.22,1.03)
MM
92.54(24.1)
−0.04
(−0.48,0.40)
−0.42
(−1.79,0.96)
−0.46
(−1.93,1.02)
QOL,#of
unhe
althy
days
SS8.8(9.5)
−1.7(−
2.9,−0.4)**
−1.5(−
2.8,−0.3)*
0.5(−
0.6,1.6)
0.8(−
0.9,2.4)
−1.1(−
3.3,1.0)
−0.7(−
2.9,1.5)
MM
7.4(7.6)
−0.1(−
1.0,0.7)
−0.3(−
1.2,0.6)
−0.4(−
1.6,0.7)
With
incond
ition
andbe
tweencond
ition
statistical
sign
ificanceindicatedby
asterisks:*p<0.05
,**p
<0.01
,***p<0.00
1SS
=SIPsmartERcond
ition
,MM=Mov
eMorecond
ition
,SSB=Su
gar-sw
eetene
dbe
verage
s,BM
I=Bo
dyMassInde
x,QOL=Qua
lityof
Life
a Means
(Stand
ardDeviatio
ns)areno
tad
justed
forcovaria
tes
bVa
lues
repo
rted
asmeanchan
ge(95%
Con
fiden
ceInterval).AllΔchan
gescores
represen
tvalues
from
thefirst
(earliest)tim
epo
intsubtracted
from
latertim
epo
int
c Con
ditio
ndu
mmyvaria
blecode
das
SIPsmartERvs.M
oveM
ore(base).M
odelscontrolledforba
selin
ecovaria
tesinclud
ingag
e,ge
nder,race/ethn
icity
,incom
e,ed
ucationlevel,he
alth
literacylevel,em
ploy
men
tstatus,
numbe
rof
child
ren,
smok
ingstatus,and
BMI.Th
e95
%confiden
ceintervalsarealso
adjusted
tobe
coho
rtrobu
st.A
nalytic
proced
ures
useintention-to-treat
last
observationcarriedforw
ardim
putatio
nsan
dem
pirical
mod
elsaremulti-levelm
ixed
effect
mod
els
Zoellner et al. International Journal of Behavioral Nutrition and Physical Activity (2018) 15:97 Page 9 of 16
ImplementationAmong all 235 participants in both the SIPsmartER andMoveMore conditions, call completion rates were notsignificantly different among randomized maintenanceconditions. Of the 11 possible calls, average completionrates were 4.6 (SD = 4.5; Median = 4.0; IQR = 9.0)IVR-behavior calls, 4.4 (SD = 3.4; Median = 4.0; IQR =5.0) human-delivered behavior calls, and 4.2 (SD = 4.2;Median = 2.5; IQR = 8.3) IVR control calls (F = 0.17, p =0.85). Specific to the 120 SIPsmartER participants, aver-age completion rates were also not significantly different(F = 1.52, p = 0.22), including 5.2 (SD = 4.4; Median = 5.0;IQR = 9.0) IVR-behavior calls, 4.0 (SD = 3.2; Median =3.0; IQR = 5.5) human-delivered behavior calls, and 5.0(SD = 4.1; Median = 4.0; IQR = 7.0) IVR control calls.Of the 235 maintenance participants, 191 participants
were enrolled in the IVR conditions. The averagemonthly cost of hosting the IVR system was $600/month or $7200 total per the 12 months. This equatesto $3.14/participant per month or $37.68/participanttotal for the 12-month IVR maintenance condition.A total of 94 participants were allocated in the
human-delivered behavior condition. Verified throughfinancial statements, research staff time was estimatedat $25/h ($0.41/min). According to tracking records, ittook on average 2.5 attempts to reach the participants.We used an estimate of 2 min each time a call wasattempted, including preparation time of the researchstaff. The average length of the human-delivered behav-ior calls was estimated at 7 min, an amount of timesimilar to the length of the IVR calls (i.e., 6.9 + 1.9)minutes) [40]. Therefore, the costs incurred for thehuman-delivered behavior condition were estimated
using the following approach: (1) attempts to reach partic-ipants on phone = 2.5 attempts * 2.5 min * $0.41 min * 94total participants = $192.70, (2) once on the phone =7 min * $0.41 min * 36 participants (average actuallyreached) = $103.32, (3) total per month = $296.02/monthor $3552.24 total per the 12 months, (4) since 94 partici-pants enrolled, this equates to $3.15/participant permonth or $37.78/participant total for the 12-monthhuman-delivered behavior maintenance condition.As further addressed in the discussion, the cost of
maintaining the IVR system is fixed. However, the costof human-delivered behavior maintenance condition isvariable.
DiscussionPrior systematic reviews have defined maintenance of be-havior change as a statistically significant between-groupsdifference in favor of the intervention group at the end ofthe intervention and at follow-up for at least onebehavioral outcome [20]. Following this criteria, our trialdemonstrated overall maintenance of effects for theprimary SSB outcome among SIPsmartER participants.Given the link between SSB and numerous chronic healthconditions (e.g., type 2 diabetes, cardiovascular disease,caries and oral health) [7–11], our finding establishes thatan individual-level intervention integrating behavioraltheory and health literacy concepts can maintain SSBreductions among residents in a high-risk rural region.When considering the three maintenance conditions
for the SIPsmartER participants, we found the IVR be-havioral support condition offered statistically significantadvantages over the IVR control group for the SSBoutcome. This finding supports prior literature which
Fig. 2 Average sugar-sweetened beverage (SSB) kcals at baseline, 6-months and 18-months, by SIPsmartER versus MoveMore conditions
Zoellner et al. International Journal of Behavioral Nutrition and Physical Activity (2018) 15:97 Page 10 of 16
Table
3Adjusted6–18
mon
thsou
tcom
esby
rand
omized
mainten
ance
assign
men
tin
theSIPsmartERcond
ition
(n=120)
Chang
e6to
18mon
thsa
Relative6to
18mon
theffectsbe
tweencond
ition
sa,b
Outcome
IVRbe
havior
n=47
Hum
an-delivered
behavior
n=46
IVRcontrol
n=27
IVRbe
havior
vs.
IVRcontrol
Hum
an-delivered
behavior
vs.IVR
control
IVRbe
havior
vs.H
uman-
delivered
behavior
SSB,kcals
−12.1(−
65,41)
15.6(−
47,78)
86(−
19,192)
−98.5(−
196,−0.55)*
−70
(−209,64)
27.7(−
69.6,125.2)
BMI,kg/m
20.11
(−0.28,0.51)
0.07
(−57,.70)
−0.07
(−0.60,0.46)
0.18
(−0.37,0.74)
0.13
(−0.49,0.76)
−0.05
(−0.80,0.70)
Weigh
t,kg
0.04
(−0.97,1.1)
−0.17
(−1.4,1.13)
0.36
(−1.7,2.44)
−0.32
(−2.7,2.1)
−0.53
(−2.9,1.88)
−0.21
(−1.9,1.47)
QOL,#of
unhe
althydays
0.6(−1.7,2.9)
−0.7(−
3.7,2.3)
2.4(−
0.6,5.4)
−1.8(−
5.1,1.4)
−3.1(−
8.3,2.1)
−1.3(−
5.7,3.2)
With
incond
ition
andbe
tweencond
ition
statistical
sign
ificanceindicatedby
asterisks:*p<0.05
SSB=
Suga
r-sw
eetene
dbe
verage
s,BM
I=Bo
dyMassInde
x,QOL=Qua
lityof
Life
a Value
srepo
rted
asmeanchan
ge(95%
Con
fiden
ceInterval).AllΔchan
gescores
represen
tvalues
from
thefirst
(earliest)tim
epo
intsubtracted
from
latertim
epo
int
bCon
ditio
ndu
mmyvaria
blecode
das
interactivevo
icerespon
se(IV
R)be
havior
supp
ortvs.IVR
controlcon
ditio
n;hu
man
-delivered
beha
vior
supp
ortvs.IVR
controlcon
ditio
n;IVRbe
havior
supp
ortvs.h
uman
-delivered
beha
vior
supp
ort.Mod
elscontrolledforba
selin
ecovaria
tesinclud
ingag
e,ge
nder,race/ethn
icity
,incom
e,ed
ucationlevel,he
alth
literacylevel,em
ploy
men
tstatus,n
umbe
rof
child
ren,
smok
ingstatus,and
BMI.Th
e95
%confiden
ceintervalsarealso
adjusted
tobe
coho
rtrobu
st.A
nalytic
proced
ures
useintention-to-treat
last
observationcarriedforw
ardim
putatio
nsan
dem
pirical
mod
elsaremulti-levelm
ixed
effect
mod
els
Zoellner et al. International Journal of Behavioral Nutrition and Physical Activity (2018) 15:97 Page 11 of 16
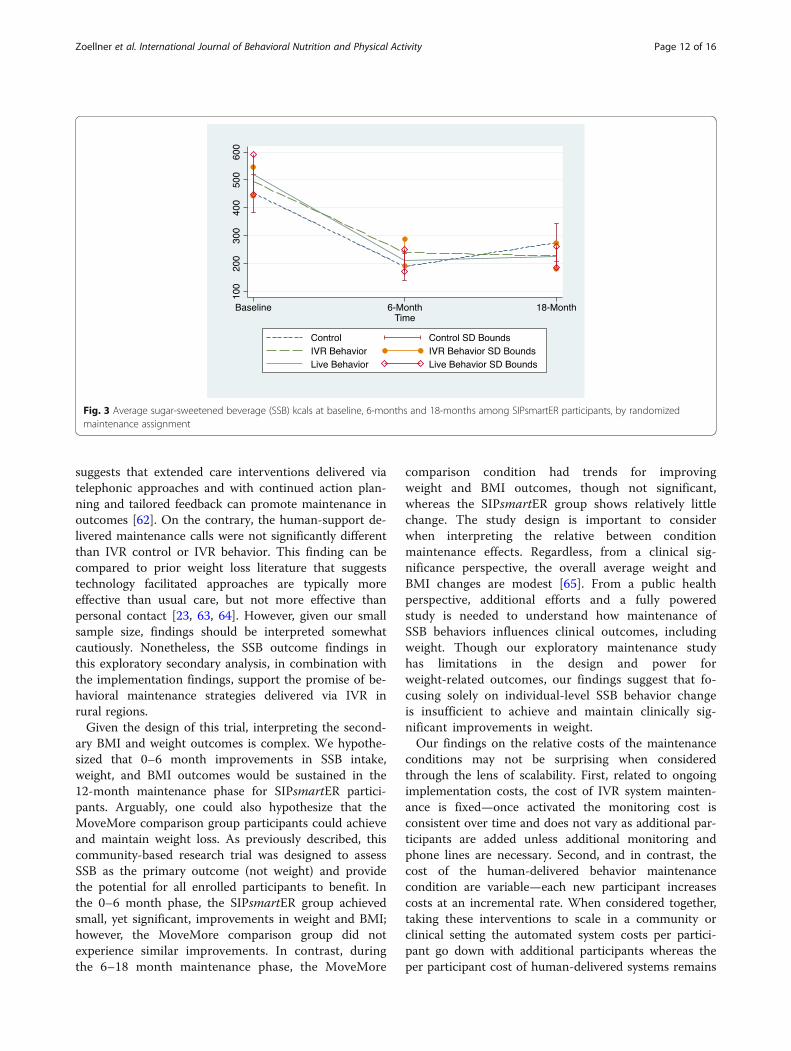
suggests that extended care interventions delivered viatelephonic approaches and with continued action plan-ning and tailored feedback can promote maintenance inoutcomes [62]. On the contrary, the human-support de-livered maintenance calls were not significantly differentthan IVR control or IVR behavior. This finding can becompared to prior weight loss literature that suggeststechnology facilitated approaches are typically moreeffective than usual care, but not more effective thanpersonal contact [23, 63, 64]. However, given our smallsample size, findings should be interpreted somewhatcautiously. Nonetheless, the SSB outcome findings inthis exploratory secondary analysis, in combination withthe implementation findings, support the promise of be-havioral maintenance strategies delivered via IVR inrural regions.Given the design of this trial, interpreting the second-
ary BMI and weight outcomes is complex. We hypothe-sized that 0–6 month improvements in SSB intake,weight, and BMI outcomes would be sustained in the12-month maintenance phase for SIPsmartER partici-pants. Arguably, one could also hypothesize that theMoveMore comparison group participants could achieveand maintain weight loss. As previously described, thiscommunity-based research trial was designed to assessSSB as the primary outcome (not weight) and providethe potential for all enrolled participants to benefit. Inthe 0–6 month phase, the SIPsmartER group achievedsmall, yet significant, improvements in weight and BMI;however, the MoveMore comparison group did notexperience similar improvements. In contrast, duringthe 6–18 month maintenance phase, the MoveMore
comparison condition had trends for improvingweight and BMI outcomes, though not significant,whereas the SIPsmartER group shows relatively littlechange. The study design is important to considerwhen interpreting the relative between conditionmaintenance effects. Regardless, from a clinical sig-nificance perspective, the overall average weight andBMI changes are modest [65]. From a public healthperspective, additional efforts and a fully poweredstudy is needed to understand how maintenance ofSSB behaviors influences clinical outcomes, includingweight. Though our exploratory maintenance studyhas limitations in the design and power forweight-related outcomes, our findings suggest that fo-cusing solely on individual-level SSB behavior changeis insufficient to achieve and maintain clinically sig-nificant improvements in weight.Our findings on the relative costs of the maintenance
conditions may not be surprising when consideredthrough the lens of scalability. First, related to ongoingimplementation costs, the cost of IVR system mainten-ance is fixed—once activated the monitoring cost isconsistent over time and does not vary as additional par-ticipants are added unless additional monitoring andphone lines are necessary. Second, and in contrast, thecost of the human-delivered behavior maintenancecondition are variable—each new participant increasescosts at an incremental rate. When considered together,taking these interventions to scale in a community orclinical setting the automated system costs per partici-pant go down with additional participants whereas theper participant cost of human-delivered systems remains
Fig. 3 Average sugar-sweetened beverage (SSB) kcals at baseline, 6-months and 18-months among SIPsmartER participants, by randomizedmaintenance assignment
Zoellner et al. International Journal of Behavioral Nutrition and Physical Activity (2018) 15:97 Page 12 of 16
the same. Two additional considerations related to costare wage rates and start-up costs. We used actual ratesof research assistant time. If the human-delivered callswere implemented in a practice setting, this rate couldbe variable if replaced with market wage rate of staff thatwould ultimately implement the intervention. Also, sincethe start-up costs for both interventions—training andquality assurance methods for staff implementing thehuman-delivered interventions and initial constructionof the IVR system were incurred in the first 6-monthphase of the trial, they were not included in our main-tenance estimates—though they would surely be consid-ered in the decision making processes for community orclinical organizations when making adoption decisions.Despite these considerations, implementation andmaintenance costs are known to be one of the mostunderreported aspects of informing the translation ofevidence-based programs into real-world practice set-tings [22, 36, 37]. Our goal was to address this gap inthe literature, while being transparent about themultitude of factors to consider when estimating andinterpreting costs to implement and maintain IVR versushuman-delivered maintenance support calls.Though call completion rates in our study were similar
across conditions, the overall 40% uptake rate (4 to 5out of 11 calls completed) remains lower than desired.However, we found that the retention rate for partici-pants in the IVR-behavioral condition was superior tothat of the human delivered behavioral support. Thisfinding may appear to contradict other studies oftechnology-based maintenance interventions which re-port low utilization of technology [66, 67]. This findingmay be explained by the fact that our IVR technologywas introduced and applied at the start of the interven-tion, not solely introduced at the maintenance phase.However, utilization rates of in-person and otherhuman-delivered interventions are also known to decreaseover time [68]. Our study is unique in comparing reten-tion rates between human and technology-delivered inter-ventions and our findings may also be the result offocusing our intervention efforts on rural participants.Nonetheless, given the recent acceleration of e/m healthoptions, additional focus on retention rates and develop-ing and testing strategies that can be used to reduce attri-tion continues to be an area in need of future research.The study has several limitations. First, the findings
may have limited generalizability beyond the targeted re-gion of rural southwest Virginia. Second, SSB outcomesare based on self-reported outcomes, yet a validatedmeasure was used. Importantly, self-reported SSB out-comes from the main Phase 1 trial were also supportedby improvement in a δ13C added sugar intake biomarkerchanges [39], which further supports the validity ofself-reported changes in this manuscript. Third, the
MoveMore comparison condition and lack of a truecontrol condition influences our findings, especiallyinterpretations of between condition effects for thesecondary weight-related outcomes. Similarly, the lack ofno contact control group should be considered wheninterpreting the maintenance findings. Fourth, sinceparticipants who did not complete any IVR calls werenot further randomized into the maintenance phase, ouradherence and effects may be somewhat inflated. Finally,our exploratory study was not specifically powered todetermine maintenance effects, hence the findingsshould be interpreted somewhat cautiously. Nonetheless,our study provides key information needed to informthe sample size of future studies examining maintenanceof SSB effects and differences between maintenance con-ditions. Our study limitations should be interpretedwithin context of the study strengths, including the tar-geted high need rural region, RCT design, and conserva-tive analysis using intent-to-treat procedures.This exploratory study reveals several key areas of
future research. Given the persistent disparities in accessto care in rural regions, there is a high need foradditional research on technology-based maintenanceinterventions in underserved and geographically dis-persed communities. Furthermore, the maintenance andextended care literature is rather complex, includingmultifaceted issues related to maintenance data inter-pretation and extended care treatment allocation [20]. Inour study, we included individuals in the maintenancephase based on participation in at least one prior IVRcall, not based on 6-month achievement of behavioral oranthropometric outcomes. This was a practical decisionbased on the desire to promote overall retention rates.However, further analyses are warranted to account forthose individuals who achieved versus did not achieveimprovements in the 6-month phase, as these findingscould reveal additional insights about the 18-monthmaintenance of effects. Likewise, within each stratumdescribed above we randomly assigned individuals intothe maintenance phase conditions. Regardless of partici-pation level in the IVR component during the initial6 months, participants were randomized into one of thethree conditions (e.g., those with either low or high en-gagement in the IVR could have been randomized tohuman-support delivered maintenance calls). While thisrandomized approach was scientifically justified to testour maintenance hypotheses, other pragmatic optionsshould also be considered in future studies. For example,rather than random assignment, a stepped care modelshould be considered such that the most effective andleast resource intensive maintenance support is provided[69]. Participants in our trial who were adequatelyengaged with the IVR could have remained in the IVRmaintenance condition, whereas those who were less
Zoellner et al. International Journal of Behavioral Nutrition and Physical Activity (2018) 15:97 Page 13 of 16
engaged in the IVR and/or failed to achieve outcomescould have been allocated to a human-delivered condi-tion. Evaluating reach, effectiveness and implementationoutcomes from a stepped care allocation scheme mayalso be useful to real-world systems. Finally, from asocio-ecological perspective, additional research isneeded to integrate evidence-based individual-level be-havioral programs aimed at achieving and maintainingSSB reduction, like SIPsmartER, with higher level envir-onmental- and policy-level approaches [12–15]. Thismulti-level effort is even more critical when extendingthe focus from SSB behavior change to the long-termimprovement of complex chronic health conditionsimpacted by excessive SSB intake (e.g., obesity, type 2diabetes, cardiovascular disease, caries and oral health).
ConclusionsIn conclusion, relative to comparison participants, theprimary SSB outcome from this RCT was maintainedamong SIPsmartER participants. Brief monthly behav-ioral based maintenance calls delivered via humansupport offered no advantage over behavioral based IVRcalls, with regard to outcomes, completion or retentionrates, or costs. While additional research is certainlywarranted, our findings suggest that using IVR tosupport SSB behaviors offers advantages as an effective,scalable, and affordable maintenance strategy in ruralregions.
AbbreviationsBMI: body mass index; IVR: interactive voice response; SSB: sugar-sweetenedbeverages
AcknowledgementsThe authors would like to acknowledge the contributions of the entireTalking Health team, including all the staff and graduate students.
FundingThe project described was supported by National Institutes of Health,National Cancer Institute (R01CA154364). The content is solely theresponsibility of the authors and does not necessarily represent the officialviews of the National Institutes of Health.
Availability of data and materialsThe datasets used and/or analysed during the current study are availablefrom the corresponding author on reasonable request.
Authors’ contributionsAll authors contributed to the writing and or revisions of this manuscriptand approved the final submitted version. Additional tasks of authorsinclude: Study conception and design: JZ, WY, YC, BD, PE. Data acquisition:JZ, VH, KP, AB, NK. Program delivery and participant management: JZ, YC, KP,AB, NK. Data analysis & interpretation: JZ, WY, VH, KP, AB.
Ethics approval and consent to participateThe Virginia Tech Institutional Review Board (FWA00000572) approved thisstudy. Written informed consent was provided by participants. IRB numberfor protocol is 12–090.
Consent for publicationNot applicable, individual level data are not reported.
Competing interestsThe authors declare that they have no competing interests.
Publisher’s NoteSpringer Nature remains neutral with regard to jurisdictional claims inpublished maps and institutional affiliations.
Author details1Department of Agricultural and Applied Economics, Virginia Tech,Blacksburg, VA 24061, USA. 2Department of Health Promotion, University ofNebraska Medical Center, Omaha, NE 68198, USA. 3School of Journalism,University of Kansas, Lawrence, KS 66045, USA. 4Department of HumanNutrition, Foods and Exercise, Virginia Tech, Blacksburg, VA 24061, USA.5Department of Movement Arts, Health Promotion & Leisure Studies,Bridgewater State University, Bridgewater, MA 02325, USA. 6Department ofPublic Health Sciences, School of Medicine, University of Virginia, P.O. Box800717, Charlottesville, VA 22908-0717, USA. 7Cancer Center without Walls atthe UVA Cancer Center, 16 East Main St, Christiansburg, VA 24073, USA.
Received: 26 October 2017 Accepted: 24 September 2018
References1. Kit BK, Fakhouri THI, Park S, Nielsen SJ, Ogden CL. Trends in sugar-
sweetened beverage consumption among youth and adults in the UnitedStates: 1999–2010. Am J Clin Nutr. 2013;98(1):180–8. https://doi.org/10.3945/ajcn.112.057943.
2. O’Neil CE, Keast DR, Fulgoni VL, Nicklas TA. Food sources of energy andnutrients among adults in the US: NHANES 2003–2006. Nutrients.2012;4(12):2097. https://doi.org/10.3390/nu4122097.
3. Sharkey JR, Johnson CM, Dean WR. Less-healthy eating behaviors have agreater association with a high level of sugar-sweetened beverageconsumption among rural adults than among urban adults. Food Nutr Res.2011;55(1):5819. https://doi.org/10.3402/fnr.v55i0.5819.
4. Thompson FE, McNeel TS, Dowling EC, Midthune D, Morrissette M, ZerutoCA. Interrelationships of added sugars intake, socioeconomic status, andrace/ethnicity in adults in the United States: National Health InterviewSurvey, 2005. J Am Diet Assoc. 2009;109(8):1376–83. https://doi.org/10.1016/j.jada.2009.05.002.
5. Zoellner J, Krzeski E, Harden S, Cook E, Allen K, Estabrooks P. Qualitativeapplication of the theory of planned behavior to understand beverageconsumption behaviors among adults. J Acad Nutr Diet. 2012;112(11):1774–84.https://doi.org/10.1016/ j.jand.2012.06.368.
6. Hedrick VE, Davy BM, You W, Porter KJ, Estabrooks PA, Zoellner JM. Dietaryquality changes in response to a sugar-sweetened beverage–reductionintervention: results from the talking health randomized controlled clinicaltrial. Am J Clin Nutr. 2017;105(4):824–33. https://doi.org/10.3945/ajcn.116.144543.
7. Malik VS, Pan A, Willett WC, Hu B. Sugar-sweetened beverages and weightgain in children and adults: a systematic review and meta-analysis. Am JClin Nutr. 2013;98(4):1084–102. https://doi.org/10.3945/ajcn.113.058362.
8. Greenwood DC, Threapleton DE, Evans CE, et al. Association betweensugar-sweetened and artificially sweetened soft drinks and type 2diabetes: systematic review and dose-response meta-analysis ofprospective studies. Br J Nutr. 2014;112(5):725–34. https://doi.org/10.1017/S0007114514001329.
9. Imamura F, O’Conner L, Ye Z, et al. Consumption of sugar sweetenedbeverages, artificially sweetened beverages, and fruit juice and incidence oftype 2 diabetes: systematic review, meta-analysis, and estimation ofpopulation attributable fraction. BMJ. 2015;351:h3576. https://doi.org/10.1136/bmj.h3576.
10. Cheungpasitporn W, Thongprayoon C, Edmonds PJ, et al. Sugar andartificially sweetened soda consumption linked to hypertension: asystematic review and meta-analysis. Clin Exp Hypertens. 2015;37(7):587–93.https://doi.org/10.3109/10641963.2015.1026044.
11. Bernabe E, Vehkalahti MM, Sheiham A, Aromaa A, Suominen AL. Sugar-sweetened beverages and dental caries in adults: a 4-year prospectivestudy. J Den. 2014;42(8):952–8. https://doi.org/10.1016/j.jdent.2014.04.011.
12. Greathouse KL, Chriqui J, Moser RP, Agurs-Collins T, Perna FM. Theassociation of soda sales tax and school nutrition laws: a concordance of
Zoellner et al. International Journal of Behavioral Nutrition and Physical Activity (2018) 15:97 Page 14 of 16
policies. Public Health Nutr. 2013:1–6. https://doi.org/10.1017/S1368980013003029.
13. Novak N, Brownell K. Taxation as prevention and as a treatment for obesity:the case of sugar-sweetened beverages. Curr Pharm Design. 2011;17(12):1218–22. https://doi.org/10.2174/138161211795656783.
14. Chriqui JF, Chaloupka FJ, Powell LM, Eidson SS. A typology of beveragetaxation: multiple approaches for obesity prevention and obesityprevention-related revenue generation. J Public Health Policy.2013;34(3):403–23. https://doi.org/10.1057/jphp.2013.17.
15. Edwards RD. Commentary: soda taxes, obesity, and the shifty behavior ofconsumers. Prev Med. 2011;52(6):417–8. https://doi.org/10.1016/j.ypmed.2011.04.011.
16. Vargas-Garcia EJ, Evans CEL, Prestwich A, Sykes-Muskett BJ, Hooson J, CadeJE. Interventions to reduce consumption of sugar-sweetened beverages orincrease water intake: evidence from a systematic review and meta-analysis.Obes Rev. 2017;18(11):1350–63. https://doi.org/10.1111/obr.12580.
17. Glasgow RE, Klesges LM, Dzewaltowski DA, Bull SS, Estabrooks P. The futureof health behavior change research: what is needed to improve translation ofresearch into health promotion practice? Ann Behav Med. 2004;27(1):3–12.https://doi.org/10.1207/s15324796abm2701_2.
18. Orleans CT. Promoting the maintenance of health behavior change:recommendations for the next generation of research and practice. HealthPsychol. 2000;19(1, Suppl):76–83. https://doi.org/10.1037/0278-6133.19.Suppl1.76.
19. Burke V, Mansour J, Beilin L, Mori T. Long-term follow-up of participants in ahealth promotion program for treated hypertensives (ADAPT). Nutr MetabCardiovasc Dis. 2008;18(3):198–206. https://doi.org/10.1016/j.numecd.2006.10.004.
20. Fjeldsoe B, Neuhaus M, Winkler E, Eakin E. Systematic review of maintenance ofbehavior change following physical activity and dietary interventions. HealthPsychol. 2011;30(1):99–109. https://doi.org/10.1037/a0021974.
21. Middleton KM, Patidar SM, Perri MG. The impact of extended care on thelong-term maintenance of weight loss: a systematic review and meta-analysis. Obes Rev. 2012;13(6):509–17. https://doi.org/10.1111/j.1467-789X.2011.00972.x.
22. Radcliff TA, Bobroff LB, Lutes LD, et al. Comparing costs of telephone vsface-to-face extended-care programs for the management of obesity inrural settings. J Acad Nutr Diet. 2012;112(9):1363–73. https://doi.org/10.1016/j.jand.2012.05.002.
23. Lee S, Lindquist R. A review of technology-based interventions to maintainweight loss. Telemed J E Health. 2015;21(3):217–32. https://doi.org/10.1089/tmj.2014.0052.
24. Patterson PD, Moore CG, Probst JC, Shinogle JA. Obesity and physicalinactivity in rural America. J Rural Health. 2004;20(2):151–9. https://doi.org/10.1111/j.1748-0361.2004.tb00022.x.
25. Meit M, Knudson A, Gilbert T, et al. The 2014 update of the rural-urbanchartbook. Bethesda: Rural Health Reform Policy Research Center; 2014.
26. Bailey A, Porter K, Hill J, Chen Y, Estabrooks P, Zoellner J. The impact ofhealth literacy on rural adults’ satisfaction with components of anintervention to improve sugar-sweetened beverage behaviors. Health EducRes. 2016;31(4):492–508 https://doi.org/10.1093/her/cyw024.
27. Estabrooks PA, Smith-Ray RL. Piloting a behavioral intervention deliveredthrough interactive voice response telephone messages to promote weightloss in a pre-diabetic population. Patient Educ Couns. 2008;72(1):34–41.https://doi.org/10.1016/j.pec.2008.01.007.
28. Piette JD, McPhee SJ, Weinberger M, Mah CA, Kraemer FB. Use ofautomated telephone disease management calls in an ethnically diversesample of low-income patients with diabetes. Diabetes Care. 1999;22(8):1302–9. https://doi.org/10.2337/diacare.22.8.1302.
29. King AC, Friedman R, Marcus B, et al. Ongoing physical activity advice byhumans versus computers: the community health advice by telephone(CHAT) trial. Health Psychol. 2007;26(6):718–27. https://doi.org/10.1037/0278-6133.26.6.718.
30. Reid RD, Pipe AL, Quinlan B, Oda J. Interactive voice response telephony topromote smoking cessation in patients with heart disease: a pilot study. PatientEduc Couns. 2007;66(3):319–26. https://doi.org/10.1016/j.pec.2007.01.005.
31. Foley P, Levine E, Askew S, et al. Weight gain prevention among black womenin the rural community health center setting: the shape program. BMC PublicHealth. 2012;12(1):305. https://doi.org/10.1186/1471-2458-12-305.
32. Glasgow RE, Vogt TM, Boles SM. Evaluating the public health impact ofhealth promotion interventions, the RE-AIM framework. Am J Public Health.1999;89(9):1322–7. https://doi.org/10.2105/AJPH.89.9.1322.
33. Gaglio B, Shoup JA, Glasgow RE. The RE-AIM framework: a systematic reviewof use over time. Am J Public Health. 2013;103(6):e38–46. https://doi.org/10.2105/AJPH.2013.301299.
34. Harden SM, Gaglio B, Shoup JA, et al. Fidelity to and comparative results acrossbehavioral interventions evaluated through the RE-AIM framework: a systematicreview. Syst Rev. 2015;4:155. https://doi.org/10.1186/s13643-015-0141-0.
35. Allen K, Zoellner J, Motley M, Estabrook P. Understanding the internal andexternal validity of health literacy interventions: a systematic literaturereview using the RE-AIM framework. J Health Commun. 2011;16(Suppl 3):55–72. https://doi.org/10.1080/10810730.2011.604381.
36. Akers JD, Estabrooks PA, Davy BM. Translational research: bridging the gapbetween long-term weight loss maintenance research and practice. J AmDiet Assoc. 2010;110(10):1511–22. https://doi.org/10.1016/j.jada.2010.07.005.
37. Goode AD, Reeves MM, Eakin EG. Telephone-delivered interventions forphysical activity and dietary behavior change an updated systematicreview. Am J Prev Med. 2012;42(1):81–8. https://doi.org/10.1016/j.amepre.2011.08.025.
38. Zoellner J, Chen Y, Davy B, et al. Talking health, a pragmatic randomized-controlled health literacy trial targeting sugar-sweetened beverageconsumption among adults: rationale, design & methods. Contemp ClinTrials. 2014;37(1):43–57. https://doi.org/10.1016/j.cct.2013.11.003.
39. Davy BM, Jahren AH, Hedrick VE, You W, Zoellner JM. Influence of anintervention targeting a reduction in sugary beverage intake on thedelta13C sugar intake biomarker in a predominantly obese, health-disparatesample. Public Health Nutr. 2017;20(1):25–9. https://doi.org/10.1017/S1368980016001439.
40. Zoellner J, Hedrick V, You W, et al. Effects of a behavioral and health literacyintervention to reduce sugar-sweetened beverages: a randomized-controlled trial. Int J Behav Nutr Phys Act. 2016;13:38. https://doi.org/10.1186/s12966-016-0362-1.
41. Hedrick VE, Davy BM, Myers EA, You W, Zoellner JM. Changes in the healthybeverage index in response to an intervention targeting a reduction insugar-sweetened beverage consumption as compared to an interventiontargeting improvements in physical activity: results from the talking healthtrial. Nutrients. 2015;7(12):10168–78. https://doi.org/10.3390/nu7125525.
42. Virginia Medically Underserved Areas (VMUAs). http://www.vdh.virginia.gov/content/uploads/sites/76/2016/06/VMUA.pdf. Accessed 6 Apr 2012.
43. USDA. Economic Research Service. Rural Classifications. https://www.ers.usda.gov/topics/rural-economy-population/rural-classifications.aspx.Accessed 23 Oct 2017.
44. Virginia Department of Health. Division of Rural Health. http://www.vdh.virginia.gov/content/uploads/sites/76/2016/06/2013VSRHP-final.pdf.Accessed 23 Oct 2017.
45. Estabrooks P, You W, Hedrick V, Reinholt M, Dohm E, Zoellner J. Apragmatic examination of active and passive recruitment methods toimprove the reach of community lifestyle programs: the talking healthtrial. Int J Behav Nutr Phys Act. 2017;14(1):7. https://doi.org/10.1186/s12966-017-0462-6.
46. Zoellner JM, Porter KJ, Chen Y, et al. Predicting sugar-sweetened behaviourswith theory of planned behaviour constructs: outcome and process resultsfrom the SIPsmartER behavioural intervention. Psychol Health.2017;32(5):509–29. https://doi.org/10.1080/08870446.2017.1283038.
47. Porter K, Chen Y, Estabrooks P, Noel L, Baily A, Zoellner J. Using teach-Backto understand participant behavioral self-monitoring skills across healthliteracy levels and behavioral condition. J Nutr Educ Behav. 2015;48(1):20–6.https://doi.org/10.1016/j.jneb.2015.08.012.
48. Golbeck AL, Ahlers-Schmidt CR, Paschal AM, Dismuke SE. A definition andoperational framework for health numeracy. Am J Prev Med. 2005;29(4):375–6. https://doi.org/10.1016/j.amepre.2005.06.012.
49. US Department of Health and Human Services, Health Resources andServices Adminstration. Health Literacy Web site. https://www.hrsa.gov/about/organization/bureaus/ohe/health-literacy/index.html. Updated August2016. Accessed 23 Oct 2017.
50. Develop and Test Materials. Centers for Disease Control and PreventionWeb site. http://www.cdc.gov/healthliteracy/developmaterials/index.html.Updated December 9, 2016. Accessed 16 Feb 2017.
51. Aufderheide P, Part II. Conference proceedings and next steps. Aspen Institutereport of the National Leadership Conferenceon Media Literacy. Washington:Communications and society program of the aspen institute; 1993.
52. Ajzen I. The theory of planned behavior. Organ Behav Human Decis Process.1991;50:179–211. https://doi.org/10.1016/0749-5978(91)90020-T.
Zoellner et al. International Journal of Behavioral Nutrition and Physical Activity (2018) 15:97 Page 15 of 16
53. Popkin BM, Armstrong LE, Bray GM, Caballero B, Frei B, Willett WC. A newproposed guidance system for beverage consumption in the United States.Am J Clin Nutr. 2006;83(3):529–42. https://doi.org/10.1093/ajcn/83/3/529.
54. Johnson RK, Appel LJ, Brands M, et al. Dietary sugars intake andcardiovascular health: a scientific statement from the American HeartAssociation. Circulation. 2009;120(11):1011–20. https://doi.org/10.1161/CIRCULATIONAHA.109.192627.
55. Weiss B, Mays M, Martz W, et al. Quick assessment of literacy in primarycare: the newest vital sign. Ann Fam Med. 2005;3:514–22. https://doi.org/10.1370/afm.405.
56. Hedrick V, Savla J, Comber D, et al. Development of a brief questionnaire toassess habitual beverage intake (BEVQ-15): sugar-sweetened beverages andtotal beverage energy intake. J Acad Nutr Diet. 2012;112(6):840–9.https://doi.org/10.1016/j.jand.2012.01.023.
57. CDC Health-Related Quality of Life (HRQOL–14) “Healthy Days Measure”.Centers for Disease control and Prevention Web site. https://www.cdc.gov/hrqol/hrqol14_measure.htm. Updated May 26, 2016. Accessed 17 Oct 2017.
58. Raab GM, Day S, Sales J. How to select covariates to include in the analysisof a clinical trial. Control Clin Trials. 2000;21(4):330–42. https://doi.org/10.1016/S0197-2456(00)00061-1.
59. Rubin DB. Multiple imputations for nonresponse in surveys. New York: JohnWiley & Sons, Inc.; 1987.
60. Laird N, Ware J. Random effects models for longitudinal data. Biometrics1982;38(963–74). doi: https://doi.org/10.2307/2529876
61. Borenstein M, Cooper H. Effect sizes for continuous data. In: Cooper H,Hedges L, Valentein J, editors. The Handbood of research synthesis andMeta analysis. 2nd ed. New York, NY: Sage Foundation; 2009. p. 221–35.
62. Perri MG, Limacher MC, Durning PE, et al. Extended-care programs forweight management in rural communities: the treatment of obesity inunderserved rural settings (TOURS) randomized trial. Arch Intern Med.2008;168(21):2347–54. https://doi.org/10.1001/archinte.168.21.2347.
63. Svetkey LP, Stevens VJ, Brantley PJ, et al. Comparison of strategies forsustaining weight loss: the weight loss maintenance randomized controlledtrial. J Am Med Assoc. 2008;299(10):1139–48. https://doi.org/10.1001/jama.299.10.1139.
64. Wieland LS, Falzon L, Sciamanna CN, et al. Interactive computer-basedinterventions for weight loss or weight maintenance in overweight orobese people. Cochrane Database Syst Rev. 2012;8(8). https://doi.org/10.1002/14651858.CD007675.pub2.
65. Wing RR, Lang W, Wadden TA, et al. Benefits of modest weight loss inimproving cardiovascular risk factors in overweight and obese individualswith type 2 diabetes. Diabetes Care. 2011;34(7):1481–6. https://doi.org/10.2337/dc10-2415.
66. Thorndike AN, Sonnenberg L, Healey E, Myint-U K, Kvedar JC, Regan S.Prevention of weight gain following a worksite nutrition and exerciseprogram: a randomized controlled trial. Am J Prev Med. 2012;43(1):27–33.https://doi.org/10.1016/j.amepre.2012.02.029.
67. Cussler EC, Teixeira PJ, Going SB, et al. Maintenance of weight loss inoverweight middle-aged women through the internet. Obesity. 2008;16(5):1052–60. https://doi.org/10.1038/oby.2008.19.
68. Katula JA, Vitolins MZ, Morgan TM, et al. The healthy living partnershipsto prevent diabetes study: 2-year outcomes of a randomized controlledtrial. Am J Prev Med. 2013;44(4):S324–32. https://doi.org/10.1016/j.amepre.2012.12.015.
69. Carels RA, Darby L, Cacciapaglia HM, et al. Applying a stepped-careapproach to the treatment of obesity. J Psychosom Res. 2005;59(6):375–83.https://doi.org/10.1016/j.jpsychores.2005.06.060.
Zoellner et al. International Journal of Behavioral Nutrition and Physical Activity (2018) 15:97 Page 16 of 16