26
The Impact of Sugar-Sweetened Beverage Consumption on the Health of San Pablo Residents A report prepared by Contra Costa Health Services for the San Pablo City Council November 15, 2011

The Impact of Sugar-Sweetened Beverage Consumption on
the Health of San Pablo Residents
A report prepared by Contra Costa Health Services for the San Pablo City Council
November 15, 2011


Authors
Wendel Brunner, PhD, MD
Abigail Kroch, PhD, MPH
Coire Reilly, BA
Tracey Rattray, MSW, MPH

Table of Contents Introduction 1
Definition of Sugar-Sweetened Beverage 1
Demographic Characteristics of San Pablo 2
Selected Demographic Characteristics of the City of San Pablo 3
Body Weight and Health 4
Obesity Prevalence among San Pablo Children 4
Obesity Prevalence among San Pablo Adults 5
Obesity Related Disease and Mortality in San Pablo 6
The Sugar-Sweetened Beverage Industry and Marketing Practices 8
San Pablo Sugar-Sweetened Beverage Consumption 9
Relationship Between Sugar-Sweetened Beverage Consumption and Obesity 9
Relationship Between Sugar-Sweetened Beverage Consumption and Dental Caries 10
Economic Costs of Obesity to Contra Costa County 11
Sugar-Sweetened Beverage Environment in San Pablo 11
Survey of Retailers within .25 mile of Helms Middle School 13
Programs San Pablo can Enact to Combat Obesity 13
Conclusion 14
References 14
Further Reading 16
Appendix A-1

1
The Impact of Sugar Sweetened Beverage Consumption on the
Health of San Pablo Residents
A Report from Contra Costa Health Services
Introduction
Obesity is a critical public health epidemic and is a leading risk factor for premature deaths and
chronic illness due to heart disease, stroke, diabetes, cancer and other conditions.1 The
residents of the City of San Pablo face higher rates of deaths and illness from these causes than
the average citizen in Contra Costa County, and children in West Contra Costa Unified School
District, which includes San Pablo, are more likely to be obese than children in other County
school districts.2
Obesity results from when a person eats and drinks more calories than he or she expends
during normal metabolic processes and physical activity. The largest single source of excess,
non-nutritional calories in the American diet is from soda and other sugar-sweetened
beverages (SSBs) and evidence shows a strong correlation between obesity and consumption of
SSBs.3 According to the report Bubbling Over: Soda Consumption and Its link to Obesity in
California, “Adults who drink soda occasionally (less than one a day) are 15% more likely to be
overweight or obese, and adults who drink one or more sodas per day are 27% more likely to
be overweight or obese than adults who do not drink soda, even when adjusting for poverty
status and race/ethnicity.”4
San Pablo has demonstrated a commitment to improving the health of its citizens through the
recent adoption of a new General Plan in 2011, which includes a comprehensive Health
Element, and by passing a resolution to be a Health Eating Active Living city.
Working to reduce the consumption of sugar-sweetened beverages is a key strategy to reducing
calorie consumption and obesity, preventing tooth decay, and creating a healthier city.
Definition of Sugar-Sweetened Beverage
For the purposes of this report, a SSB is defined as a non-alcoholic beverage, carbonated or
non-carbonated, that contains added caloric sweeteners. Included in this definition are
traditional sodas (e.g. Coca-Cola, Sprite) sports drinks (e.g. Gatorade), energy drinks (e.g.
Rockstar, Red Bull), fruit-flavored (not 100% fruit juice) drinks (i.e. juice cocktails and nectars).

2
“Diet” drinks, those that contain non-caloric sweeteners such as aspartame, are not included in
this definition, nor are coffee and tea drinks.
Demographic Characteristics of San Pablo
The City of San Pablo is home to a diverse community, the members of which are largely Latino
and other minority groups. Many families in San Pablo live below the federal poverty level and
have only a single parent. These social factors and other environmental factors have an impact
on the health outcomes of the community. Vulnerable populations have a greater risk of
obesity and increased rates of chronic diseases with which obesity is associated.

3
Selected Demographic Characteristics of the City of San Pablo
Total population 30,566
Age and Sex
Male 15,716 51%
Female 14,850 49%
0 to 19 years 9461 31%
19 to 65 years 17678 58%
65 years and over 3,427 11%
Race and Ethnicity
Hispanic or Latino 16656 54%
Not Hispanic or Latino
White 3,797 12%
African American 4267 14%
Asian 5050 17%
American Indian or Alaska Native 212 1%
Pacific Islander 19 <0%
Two or More races 443 1%
Some Other Race 142 <0%
Household Characteristics
Median household income (dollars) 46,007
Families whose income is below federal poverty level 15%
Households with children under 18 3,653 40%
Female householder, no husband present, with children under 18 853 16%
Educational Attainment
Percent high school graduate or higher 69%
Percent bachelor's degree or higher 15%
Language Spoken At Home
English only 9,453 31%
Language other than English 18,442 60%
Source: American Community Survey 2005-2009

4
Body Weight and Health:
Maintaining a healthy weight throughout the lifetime helps to avoid obesity related illness and
premature death. To estimate whether an individual is within a healthy weight range, a body
mass index (BMI) is calculated using both height and weight. BMI is analyzed in 4 categories:
underweight, normal weight, overweight, and obese. Among adults a BMI less than 20 is
considered underweight, 20-25 is normal weight, 25-30 overweight, and greater than 30 is
considered obese. Because children are growing, an age-based calculation is used that
incorporates their height and weight and categorizes BMI ranges into percentiles. Less than 5th
percentile is considered underweight, 5th-85th percentile is normal weight, 85th -95th percentile
is overweight, and greater than 95th percentile is considered obese. The weight category of
obese has the strongest association to negative health outcomes, and the majority of the
findings in this report focus on negative consequences of obesity but not overweight. More
information is available through the Centers for Disease Control and Prevention.
(http://www.cdc.gov/healthyweight/assessing/bmi/index.html).
Obesity Prevalence among San Pablo Children:
At public schools in California, students are tested yearly on physical activity using the
Fitnessgram test, which includes a measurement of height and weight that is carried out by the
test administrator. The data below on childhood obesity for San Pablo was obtained from the
2010 Fitnessgram carried out in the following schools: Bayview Elementary, Dover Elementary,
Downer Elementary, Ford Elementary, Lake Elementary, Riverside Elementary, Helms Middle
School, Middle College High School, and Richmond High School (which San Pablo high-school-
aged students attend). These schools were chosen based on their location and their student
population. A total of 1286 students were included in this analysis. The students who carried
out the test were primarily Latino or Hispanic (74%).

5
The 2010 Fitnessgram data shows that the burden of obesity in San Pablo school children is
significant. Overall 29% of school children are obese and an additional 23% are overweight.
More male students are obese than female students, a difference of 6%.
Due to the current prevalence of obesity among San Pablo youth, we project that the
prevalence of obesity in adults will increase. Based on previous studies relating obesity in
adults to their weight status as children, we predict that as adults, the cohort of children
currently residing in San Pablo will have an obesity prevalence of 42% (almost double the
current obesity prevalence of 24%) once they reach adulthood.5 This prevalence excludes
individuals who are overweight, but not obese.
Obesity Prevalence among San Pablo Adults:
Obesity prevalence for San Pablo adults was estimated using the 2009 California Health
Interview Survey. In San Pablo residents, we estimate that 58% of adults are overweight or
obese. The percentage of obese adults in this estimate is 24%.

6
*Small Area Analysis was used to calculate prevalence using the demography of San Pablo.
Obesity Related Disease and Mortality in San Pablo
Morbidity rates
The current prevalence of obesity among San Pablo adults contributes to increased rates of
disease and death due to cardiovascular disease, cancer, diabetes, as well as all cause mortality.
The California Health Interview survey was used to estimate the prevalence of obesity related
disease in San Pablo. Using empirical studies relating obesity to specific diseases, the number of
excess cases of people diagnosed with chronic diseases in San Pablo due to obesity was
calculated. The number of future cases among San Pablo children was calculated based on the
projected obesity prevalence of 42%. It is expected that there will be a substantial increase in
people living with chronic illness (morbidities) due to the projected rising obesity rate among
adults.

7
Diagnosis of obesity related chronic disease in San Pablo
Prevalence of
diagnosis
Excess diagnoses
of chronic diseases
due to current
obesity prevalence
(24%)
Excess diagnoses
of chronic diseases
due to future
obesity prevalence
(42%)
Cardiovascular Disease 4.9% 124 206
Cancer 4.8% 53 91
Diabetes 8% 909 1253
Hypertension 26% 2952 4053
Stroke 2% 65 105
*Small Area Analysis with CHIS was used to calculate prevalence using the demography of San Pablo.
Cancer and Stroke data were obtained from the 2005 CHIS survey. Cardiovascular disease, diabetes and
hypertension data were obtained from the 2009 CHIS survey. Associations between disease and obesity
were taken from empirical studies6, 7, 8, 9
Mortality Rates
The excess deaths due to obesity in San Pablo were calculated using results of previous studies,
which have estimated the relative risk of mortality among obese individuals. The annual death
rate in San Pablo is around 305 residents, and it was found that 11% of all deaths in San Pablo
could be attributed to obesity. The increased rate of obesity among this current generation of
children when they become adults will lead to an increase in the number of excess deaths due
to obesity. These excess deaths are premature deaths with an estimated loss of 2 years of life
per person due to cardiovascular disease, 10 years of life due to cancer and 9 years of life due
to diabetes.
Excess deaths due to obesity per year in San Pablo
Deaths per year
in San Pablo
Obesity attributable
percentage to
current prevalence
of 24%
Obesity attributable
percentage to
future prevalence
of 42%
Cardiovascular Disease 82 15% 23%
Cancer 66 6.9% 11%
Diabetes 10 37% 51%
All Causes 305 11% 18%
Population attributable fraction of death was calculated using empirical relationships between obesity
and mortality. 10, 11, 9
8
The Sugar-Sweetened Beverage Industry and Marketing Practices
According to Breaking Down the Chain: A Guide to the Soft Drink Industry prepared by National
Policy & Legal Analysis Network to Prevent Childhood Obesity (NPLAN) and Public Health Law &
Policy (PHLP), the soft drink industry is broken down into two main components of production –
syrup (and concentrate) manufacturing and soft drink manufacturing (creation of the final,
often carbonated, product and packaging it in bottles and cans). This industry is dominated by
only a few companies. For syrup manufacturing, Coca-Cola (40% of the market) and PepsiCo,
Inc (33% of the market) contribute 73% of the U.S. market. For soft drink manufacturing, Coca-
Cola produces 28.6%, Pepsico, Inc produces 26.8%, and Dr Pepper Snapple Group produces
8.6%. Other, much smaller companies make up the remainder in both manufacturing
processes.
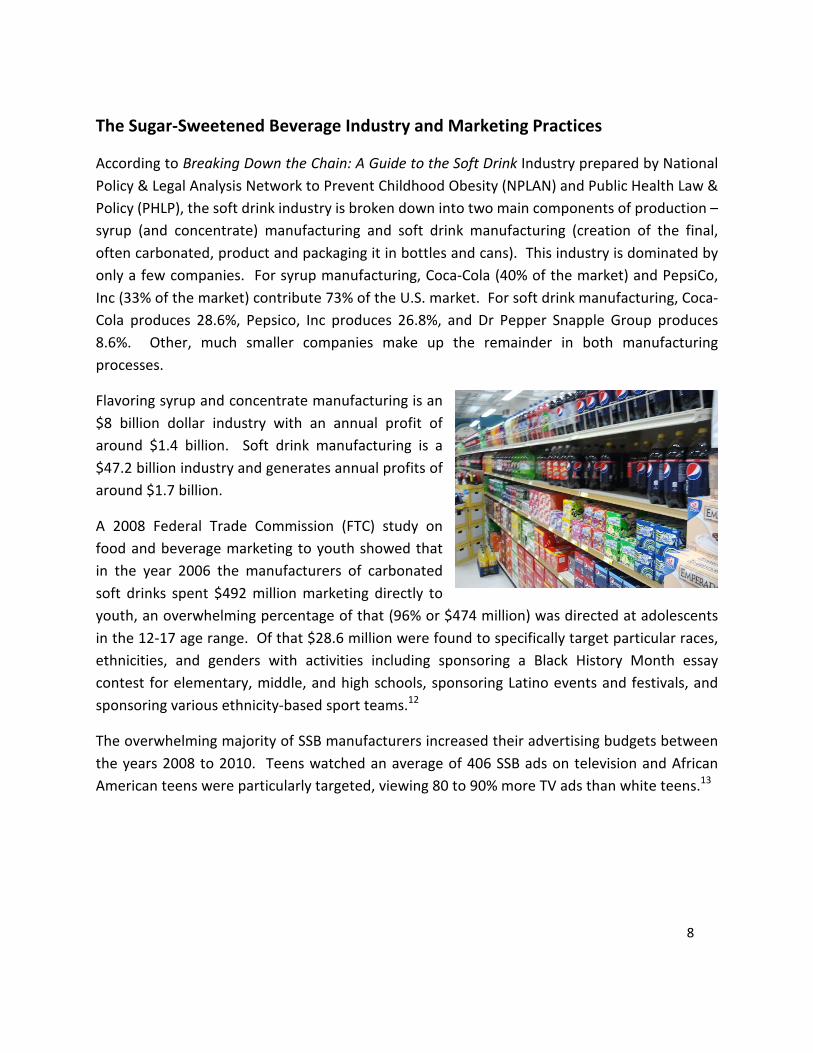
Flavoring syrup and concentrate manufacturing is an
$8 billion dollar industry with an annual profit of
around $1.4 billion. Soft drink manufacturing is a
$47.2 billion industry and generates annual profits of
around $1.7 billion.
A 2008 Federal Trade Commission (FTC) study on
food and beverage marketing to youth showed that
in the year 2006 the manufacturers of carbonated
soft drinks spent $492 million marketing directly to
youth, an overwhelming percentage of that (96% or $474 million) was directed at adolescents
in the 12-17 age range. Of that $28.6 million were found to specifically target particular races,
ethnicities, and genders with activities including sponsoring a Black History Month essay
contest for elementary, middle, and high schools, sponsoring Latino events and festivals, and
sponsoring various ethnicity-based sport teams.12
The overwhelming majority of SSB manufacturers increased their advertising budgets between
the years 2008 to 2010. Teens watched an average of 406 SSB ads on television and African
American teens were particularly targeted, viewing 80 to 90% more TV ads than white teens.13

9
San Pablo Sugar-Sweetened Beverage Consumption:
Sweetened beverage consumption was estimated for San Pablo, using the 2009 California
Health Interview Survey. Beverage consumption was highest among teens, with 73% of teens
estimated to consume one or more sweetened beverage per day (this includes sodas, fruit
drinks, sports drinks, energy drinks but not diet drinks).14 The rate was lower among children
aged 0-11; however, the rate of consumption was much greater in school-aged children than
toddlers and infants (not shown). Among adults, the rate of sweetened beverage consumption
was estimated at 44% when sweetened coffee and hot tea were included (this includes pre-
sweetened coffee and tea as well as and restaurant coffee and tea drinks to which people add
sugar). When coffee and hot tea were excluded, the rate was estimated to be 23%.
*Small Area Analysis was used to calculate rates using the demography of San Pablo.
Relationship between Sugar-Sweetened Beverage Consumption and Obesity
Using the California Health Interview Survey of adults from 2009, we calculated the
approximate additional calories consumed through sugar-sweetened beverages. Among the

10
estimated 23% of adults who consume one or more sugar-sweetened beverages per day, the
average number of servings (120 calories/adult serving3) is 2.2 with an estimated caloric
content of 258 calories. For adolescents the excess calorie consumption is much greater.
Among the estimated 73% of San Pablo adolescents who consume one or more SSBs per day,
the average number of servings (242 calories/teen serving14) is 1.8 with an estimated caloric
content of 429 calories. Sugar sweetened beverages contribute to the obesity epidemic by
adding excess calories to the diet, without additional nutrition. The following are some
examples of SSBs and their caloric content:
• A standard 12 oz. can of Coca Cola contains 140 calories and a 20 oz. bottle contains 240
calories.
• A 20 oz bottle of Minute Maid Lemonade contains 260 calories, more than the same size
bottle of Coca Cola.
• The 32 oz. 7-11 Big Gulp contains 364 calories.
• A 16 oz. bottle of Nesquik chocolate milk contains 400 calories.15
Studies show that the calories in beverages are not as satiating as calories consumed by food (a
person’s body does not register the intake of calories by becoming less hungry), and therefore
increase the overall number of calories consumed.3 According to the report Bubbling Over:
Soda Consumption and Its link to Obesity in California, “Adults who drink soda occasionally (less
than one a day) are 15% more likely to be overweight or obese, and adults who drink one or
more sodas per day are 27% more likely to be overweight or obese than adults who do not
drink soda, even when adjusting for poverty status and race/ethnicity.”4
Relationship between Sugar-Sweetened Beverage Consumption and Dental
Caries
Because children’s oral health in California is ranked the third worst state in the nation after
Arizona and Texas16, reducing or preventing children from consuming sugar-laden drinks
becomes even more important as a preventative measure. Sugar consumption is the primary
cause of dental caries in children. 17 During the 2010-2011 school year, among students in San
Pablo elementary schools visited by the Contra Costa Health Services Children’s Oral Health
Program, the percentage of students with visible tooth decay ranged from 14% to 26%.

11
Economic Costs of Obesity to Contra Costa County
According to The Economic Costs of Overweight, Obesity, and Physical Activity Among California
Adults report prepared by California Center for Public Health Advocacy, the annual health care
costs of overweight and obesity in Contra Costa County is over $404,000,000. Additionally,
each year obesity accounts for over $272,000,000 in lost workplace productivity in Contra Costa
County.18
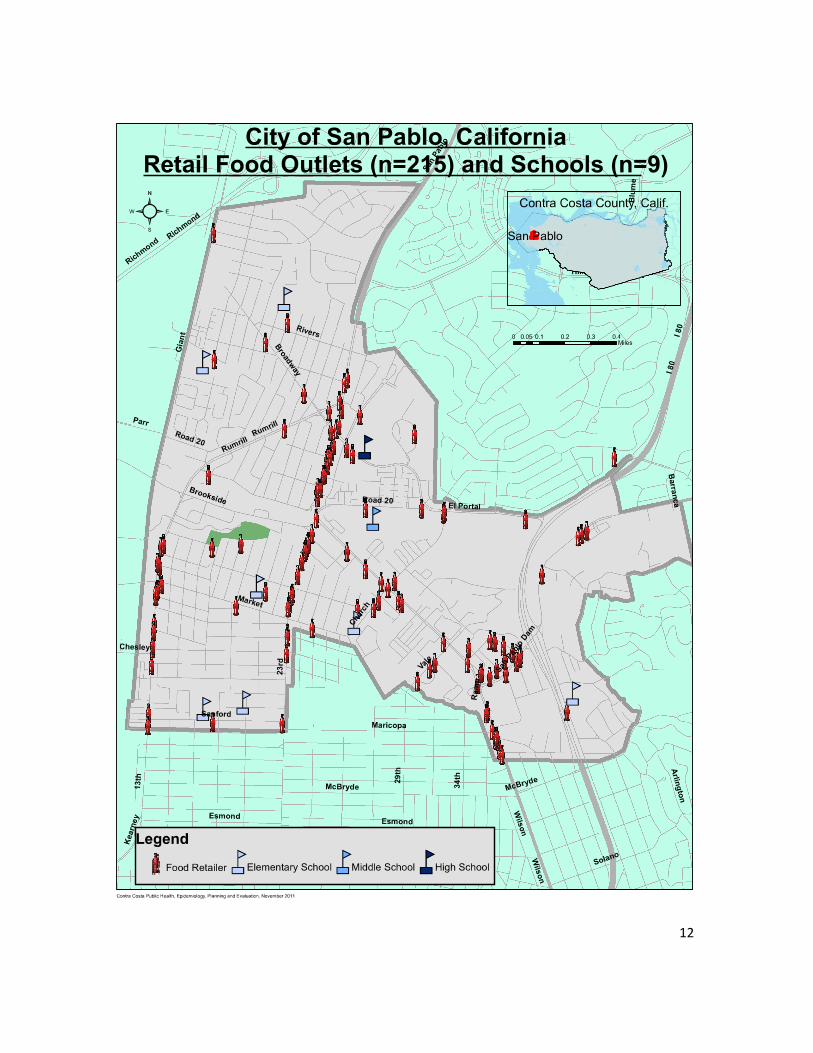
Sugar-Sweetened Beverage Environment in San Pablo
San Pablo citizens are saturated with food vendors supplying sugar-
sweetened beverages. There are 215 retail food outlets in the city of
San Pablo, including mobile food prep vehicles (n=12), ice-cream
pushcarts (n=14), retail food vehicles (n=8), restaurants (n=64),
convenience stores (n=36), and grocery stores (n=28) with the rest
being miscellaneous food retail outlets. Using population estimates
from the 2010 Census, it was estimated that 90% of the population
resides within walking distance (.25 mile) of a retailer or vendor
(26,403 of a total population of 29,139). Additionally, 81 of 215
outlets are within 0.25 mile of a school. The average number of
outlets within 0.25 mile of a school is 9.55 (minimum = 1, maximum = 30). Therefore, sugar
sweetened beverages are readily accessible to citizens, and school children while in route to
school or home. The following map plots the locations of all food vendors in the city of San
Pablo as well as the locations of schools.
12

13
Survey of Retailers within .25 mile of Helms Middle School
In September 2011, CCHS surveyed 12 retail outlets that were within walking distance (.25
miles) of Helms Middle School in central San Pablo. CCHS counted the number of different
kinds (flavors, brands) of SSB available for purchase and found a range of 35 (lowest) to 311
(highest) different kinds of SSB on the stores’ shelves. The average was 106 different types of
SSBs. In all retail outlets SSBs were the vast majority of beverages available for purchase (as
opposed to water, diet drinks, and 100% fruit juice).
All three of the full-size groceries that were surveyed
featured either an entire row (both sides of the aisle)
dedicated to SSBs or large, prominent stacked displays of
cases of SSBs. (Two groceries featured both.) CCHS did not
see a significant number of outdoor advertising for SSBs
either on store walls facing the street or on community
advertising space.
Programs San Pablo can Enact to Combat Obesity
San Pablo could implement a variety of local programs to increase healthy eating or promote
regular physical activity that would counter the influence of SSBs. There are many sources for
suggested policies and programs such as 1) The Health Element from San Pablo’s General Plan
(Chapter 8: http://www.ci.san-pablo.ca.us/DocumentView.aspx?DID=669), 2) the report, Example of
a Sugar-Sweetened Beverage Regulatory Fee Justification Study in California prepared by
Economic & Planning Systems, Inc for Public Health Law & Policy (These strategies were
recommended as statewide mitigations for sugar-sweetened beverage consumption but could
easily be modified for implementation in San Pablo.), and 3) a policy brief CA Campaign for
Healthy Beverages prepared by California Center for Public Health Advocacy
(http://www.publichealthadvocacy.org/_PDFs/beverage_policies/LocalPolicies_WaterSoda_No
v2010.pdf ).
Common themes to decrease obesity in these documents include increasing and promoting the
availability of healthy food and beverages, improving the environment (streets, parks, etc) to be
more conducive to physical activity, improving food and increasing physical activity at schools,
and educating residents about the importance of eating well and exercising. Refer to the
appendix for a list of the suggested policies and programs and to the original documents (linked
below in the Further Reading section) for the full texts.

14
Conclusion
The City of San Pablo faces higher rates of obesity and obesity-related diseases than other cities
in Contra Costa County, the effects of which result in a loss of life, well being and productivity
to San Pablo citizens and incur large costs to the city and the state. Sugar sweetened beverage
consumption is a significant source of excess, empty calories to the diets of the city’s residents
and is a major contributor to the obesity epidemic and to childhood dental caries. There are
various programs that the city can undertake to mitigate these negative affects and help
improve the lives of the citizens of San Pablo.
References
1 – Khan, Laura Kettel, PhD, Kathleen Sobush, MS, MPH, et al. (2009) Recommended Community
Strategies and Measurements to Prevent Obesity in the United States
http://www.cdc.gov/mmwr/preview/mmwrhtml/rr5807a1.htm
2 – Contra Costa Health Services (2010) Community Health Indicators for Contra Costa County.
http://cchealth.org/health_data/hospital_council/2010/pdf/2010_community_health_indicators_report
_complete.pdf
3 – Woodward-Lopez, Gail, Janice Kao, and Lorrene Ritchie. 2010. To what extent have sweetened
beverages contributed to the obesity epidemic? Public Health Nutrition p. 3.
http://www.foodpolitics.com/wp-content/uploads/Woodward-Impact-of-SSBs.PubHlthNutr-2011.pdf
4 – Babey, Susan H., Malia Jones, Hongjian Yu, and Harold Goldstein. Bubbling Over: Soda Consumption
and Its link to Obesity in California. 2009. UCLA Center for Health Policy Research.
http://www.healthpolicy.ucla.edu/pubs/Publication.aspx?pubID=375 p. 1
5 – Janssen I, Katzmarzyk PT, Srinivasan SR, Chen W, Malina RM, Bouchard C, et al. Utility of childhood
BMI in the prediction of adulthood disease: comparison of national and international references.
Obesity research. 2005 Jun;13(6):1106-15.
6 – Guh DP, Zhang W, Bansback N, Amarsi Z, Birmingham CL, Anis AH. The incidence of co-morbidities
related to obesity and overweight: a systematic review and meta-analysis. BMC public health. 2009
Jan;9(88).
7 – Rapp K, Schroeder J, Klenk J, Stoehr S, Ulmer H, Concin H, et al. Obesity and incidence of cancer: a
large cohort study of over 145,000 adults in Austria. British journal of cancer. 2005 Oct;93(9):1062-7.
15
8 – Wilson PWF, D’Agostino RB, Sullivan L, Parise H, Kannel WB. Overweight and obesity as determinants
of cardiovascular risk: the Framingham experience. Archives of internal medicine. 2002
Sep;162(16):1867-72.
9 – Mokdad AH, Ford ES, Bowman B a, Dietz WH, Vinicor F, Bales VS, et al. Prevalence of obesity,
diabetes, and obesity-related health risk factors, 2001. JAMA. 2003 Jan 1;289(1):76-9.
10 – Allison DB, Fontaine KR, Manson JE, Stevens J, VanItallie TB. Annual deaths attributable to obesity
in the United States. JAMA.1999 Oct;282(16):1530-8.
11 – Banegas J, Lopez-Garcia E, Gutierrez-Fisac J, Guallar-Castillon P, Rodriguez-Artalejo F. A simple
estimate of mortality attributable to excess weight in the European Union. European Journal of Clinical
Nutrition. 2003;57:201-208.
12 – Fry, Christine, Carrie spector, Kim Arroyo Williamson, and Ayela Mujeeb. Breaking Down the Chain:
A Guide to the Soft Drink Industry. 2011. Public Health Law & Policy and National Policy & Legal Analysis
Network. http://www.nplanonline.org/nplan/products/soda-industry-report pgs. 12-26.
13 – Harris, Jennifer, PhD, MBA, et al., Sugary Drink FACTS: Evaluating Sugary Drink Nutrition and
Marketing to Youth. Yale Rudd Center for Food Policy & Obesity.
http://www.sugarydrinkfacts.org/resources/SugaryDrinkFACTS_Report.pdf pg. Xi
14 – Hastert, T.A., Babey, S. H., Diamant, A.L., Brown, E.R., More California Teens Consume Soda and
Fast Food Each Day Than Five Servings of Fruits and Vegetables. UCLA Health Policy Research Brief, Sept.
2005.
15 – Sugar Stacks Website. http://www.sugarstacks.com/beverages.htm Accessed November 14, 2011.
16 – Ch1ldren Now, Oral Health Council Childhood Obesity & Dental Disease: Common Causes, Common
Solutions. February 2011.
http://www.childrennow.org/uploads/documents/oral_health_brief_022011.pdf pg. 2
17 – Bruce A. Dye et al., “The relationship between healthful eating practices and dental caries in
children aged 2–5 years in the United States, 1988–1994,” Journal of the American Dental Association
135 (1) 2004: pgs. 55-66.
18 – California Center for Public Health Advocacy, The Economic Costs of Overweight, Obesity, and
Physical Activity Among California Adults. September 2009.
http://publichealthadvocacy.org/_PDFs/Costofobesity_BRIEF.pdfpg. 4.
16
Further Reading
To what extent have sweetened beverages contributed to the obesity epidemic? Gail
Woodward-Lopez, Janice Kao and Lorrene Ritchie. 2010 http://www.foodpolitics.com/wp-
content/uploads/Woodward-Impact-of-SSBs.PubHlthNutr-2011.pdf
Bubbling Over: Soda Consumption and Its link to Obesity in California. Susan H. Babey, Malia
Jones, Hongjian Yu, and Harold Goldstein. 2009
http://www.healthpolicy.ucla.edu/pubs/Publication.aspx?pubID=375
Breaking Down the Chain: A Guide to the Soft Drink Industry. Fry, Christine, Carrie spector, Kim
Arroyo Williamson, and Ayela Mujeeb. 2011. Public Health Law & Policy and National Policy &
Legal Analysis Network. http://www.nplanonline.org/nplan/products/soda-industry-report
Example of a Sugar-Sweetened Beverage Regulatory Fee Justification Study in California.
December 2009. Public Health Law & Policy.
CA Campaign for Healthy Beverages. Harvey, Stefan, Kumar Chandran, Ellen Braff-Guajardo.
November 2010. California Center for Public Health Advocacy.
http://www.publichealthadvocacy.org/_PDFs/beverage_policies/LocalPolicies_WaterSoda_Nov2010.pdf
Local Beverage Policies adopted by California Cities and Counties. May 2011. California Center
for Public Health Advocacy.
http://www.publichealthadvocacy.org/_PDFs/beverage_policies/CABeveragePolicies_Cities_Counties.p
df

A - 1
Appendix
Programs San Pablo can Enact to Combat Obesity
San Pablo could implement a variety of local programs to increase healthy eating and promote
regular physical activity that would counter act the influence of SSBs. There are many sources
for suggested policies and programs such as 1) The Health Element from San Pablo's General
Plan (Chapter 8: http://www.ci.san-pablo.ca.us/DocumentView.aspx?DID=669), 2) the report
Example of a Sugar-Sweetened Beverage Regulatory Fee Justification Study in California
prepared by Economic & Planning Systems, Inc for Public Health Law & Policy (These strategies
were recommended as statewide mitigations for sugar-sweetened beverage consumption but
could easily be modified for implementation in San Pablo.), and 3) a policy brief CA Campaign
for Healthy Beverages prepared by California Center for Public Health Advocacy
(http://www.publichealthadvocacy.org/_PDFs/beverage_policies/LocalPolicies_WaterSoda_Nov2010.pd
f ).
Common themes of these documents include increasing and promoting the availability of
healthy food and beverages, improving the environment (streets, parks, etc) to be more
conducive to physical activity, and educating the residents about the importance of eating well
and exercising.
The following are summarized versions of the recommendations in these various documents.
Please refer to the documents themselves for the complete text.
San Pablo General Plan Health Element
Topic 1: Healthy Transportation and Physical Activity
• Implement street design features that facilitate walking and biking in both new and
established areas. Require a minimum standard of these features for all new
developments.
• Improve signage directing residents and visitors to public parks and recreational
facilities from all parts of the community. Integrate parks signage with bikeway and
pedestrian-oriented signage system throughout San Pablo.
• Implement Safe Routes to School to make active transportation to school safe.

A - 2
• Implement transportation demand management programs to reduce single-occupant
vehicle trips.
• Link park facility improvement priorities to a ranking system keyed to public health and
recreational goals.
• Incentivize the development of new parkland.
• Develop exercise circuit that takes advantages of existing infrastructure.
• Update joint use agreements with schools to increase access to facilities.
• Encourage and support efforts by schools to develop new and improved curricula about
the importance of exercise and good nutrition.
• Encourage businesses and non-profit organizations to offer indoor recreational facilities
and programs.
Topic 2: Healthy Food Access and Equity
• Use zoning and redevelopment programs to establish incentives for healthy food
retailers.
• Establish a Health Commission to advise the City Council on issues relating to health and
wellness.
• Support the formation of a West County Food Policy Council to identify innovative
solutions to improve local food systems.
• Work to increase participation in existing federal food assistance programs such as
Women, Infants, and Children (WIC) nutrition program and the Supplemental Nutrition
Assistance Program (SNAP, formerly Food Stamps)
• Develop and implement a healthy food purchasing and vending policies for City facilities
and operations that commits to healthy food in vending machines, at City-sponsored
events, and in meetings.
• Assess feasibility of starting a certified farmer’s market in San Pablo
• Seek ways to partner with regional Community Supported Agriculture (CSA) as an
alternative for healthy food vending

A - 3
• Implement community garden program.
• Work cooperatively with the school district and health department to improve food in
schools: establish higher nutrition standards, incorporate culturally-sensitive options,
remove unhealthy foods from vending machines, establish school gardens, and
coordinate Farm to School programs.
• Support home gardening efforts.
• Adopt zoning controls to limit the number of fast food and drive-through restaurants.
Topic 3: Access to Services and Planning for People First
• Collaborate with CCHS to monitor and maintain health
data.
• Explore health programs in neighborhood facilities.
• Recruit medical services to San Pablo
• Locate new outpatient medical facilities in underserved
neighborhoods
• Assist with conversion of liquor stores to healthier retail purposes
• Increase public awareness of youth program opportunities in and around San Pablo.
• Create a youth job development program
• Incorporate universal, lifecycle design principles in new residential developments
• Support year-round calendar of events in community parks.
• Investigate programs for involving formerly-incarcerated residents in the community.
• Encourage new businesses to give local residents preference in hiring decisions.
Topic 4: Crime Reduction and Perceptions of Safety
• Incorporate Crime Prevention Through Environmental Design (CPTED) principles in
zoning ordinance and project review.

A - 4
• Enforce property maintenance and environmental design regulations for businesses,
especially alcohol and tobacco outlets.
• Continue to enforce code to manage beverage sale locations and enforce owners on
litter, graffiti, etc.
• Ensure San Pablo has minimum illumination standards for streetlights.
• Continue community policing and relationship-building programs
• Continue to involve residents in neighborhood improvement efforts.
• Enhance aesthetics and quality of housing stock and remove blight.
Example of a Sugar-Sweetened Beverage Regulatory Fee Justification Study in California
Strategy 1: Increase Access to Healthy Foods
• Expand the availability and improve the nutritional quality of school foods and
beverages.
• Create a state incentive program to increase healthy food retailing in underserved
neighborhoods
• Support local innovation by building infrastructure within local health departments to
facilitate improved access to healthy foods
Strategy 2: Increase Access to Opportunities for Physical Activity
• Improve the quality and quantity of physical education in California public schools
• Improve the built environment in California communities to increase physical activity
Strategy 3: Educate Californians About the Risks Associated with Sugar-Sweetened Beverage
Consumption
• Establish a statewide media campaign to educate Californians about the risks associated
with sugar-sweetened beverage consumption.
A - 5
Strategy 4: Increase Access to Obesity-Related Health Care Services
• Provide reimbursement for health care services to prevent, diagnose, and treat obesity
and resulting conditions for Californians – particularly California children – enrolled in
publicly funded health insurance programs.
• Provide health care services through school-based health centers.
CA Campaign for Healthy Beverages
Sugar Sweetened Beverage Strategies:
Vending machines: Eliminate the sale of sweetened beverages in vending machines on city or
county owned property.
Public property: Eliminate the sale of sweetened beverages in city or county owned property,
or at any city or county sponsored event, meeting, or program.
Schools: Establish policies to eliminate electrolyte beverages in schools.
Marketing and sponsorships: Eliminate marketing of sweetened beverages, including
sponsorships of and the presence of logos in schools and at city or county sponsored programs
or events.
Youth venues: Eliminate the sale and marketing of sweetened beverages at zoos, museums,
parks and other places frequented by children.
Childcare, afterschool settings: Eliminate the provision or sale of sweetened beverages in
childcare and afterschool programs.
Breastfeeding: Ensure that breastfeeding is supported at workplaces and in public
buildings/events.
Public funds: Eliminate the purchase of sweetened beverages by a city or county.
Checkout lanes: Enact a city or county resolution encouraging retailers to remove sweetened
beverages from checkout lanes.
Signage: Strengthen city and county signage ordinances to limit the amount and type of signage
on stores and buildings. (The ordinance must apply to all products and all signs because legally
it cannot target a single product type.)
Density of retailers: Limit the number and/or density of sweetened beverage retailers near
schools and playgrounds.
Restaurant incentives: Establish nutrition standards for meals that include toy-giveaways and
other incentives.
Taxes: Establish a city or county tax on sweetened beverages and use the funds to support local
nutrition and physical activity efforts.
A - 6
Corporate and organizations practices: Eliminate the sale of sweetened beverages in vending
machines. Ensure the availability of free good tasting water. Eliminate marketing of sweetened
beverages, including sponsorships and the presence of logos. Eliminate the purchase of
sweetened beverages. Ensure that breastfeeding employees are supported.
Water Promotion Strategies
Water availability: Ensure the availability of free good tasting water in public schools
(implementation of SB 1413, recently enacted legislation requiring water availability during
school meals), on all property owned or leased by a city or county, and at all city/county
sponsored events.
Public property: Ensure operable, clean drinking fountains when located in city or county
owned property, and sell or provide water at city or county sponsored events, meetings, or
programs.
Youth venues: Ensure operable, clean drinking fountains when located in zoos, museums, parks
and other places frequented by children. If water is sold, ensure that prices are comparable or
lower than prices for sweetened beverages.
Childcare, afterschool settings: Ensure free safe drinking water for children and staff.
Public funds: Promote tap water consumption through purchase of reusable water bottles,
glasses, pitchers, filters, and other related items. Eliminate the purchase of bottled water in
individual serving sizes by a city or county.
Vending machines: Ensure the sale of water at prices comparable to or below prices for
sweetened drinks in vending machines on city or county owned property.
Marketing and sponsorships: Allow beverage companies to market only water, and eliminate
sponsorships, logos in schools and at city or county sponsored programs or events.
Density of retailers: Limit the number and/or density of sweetened beverage retailers near
schools and playgrounds factoring in an exemption for retailers who sell water at lower prices
than sweetened beverages.
Corporate and organizational policies: Ensure the availability of free good tasting water in
drinking fountains. Ensure the purchase of items, such as reusable bottles, filters, glasses, and
pitchers, to promote tap water consumption. Ensure water sales in vending machines. Ensure
marketing of only water via sponsorships and logos.


