Page 1
S1
Supporting Materials
Comparative Economic and Environmental Assessments of H2O2-based and
Tertiary Butyl Hydroperoxide-based Propylene Oxide Technologies
Madhav Ghanta1,2, Darryl Fahey1, Daryle Busch1,3, Bala Subramaniam1,2,* 1Center for Environmentally Beneficial Catalysis, 2Department of Chemical & Petroleum
Engineering, 3Department of Chemistry, University of Kansas, Lawrence, Kansas 66045-7609.
Number of Pages: 22
Number of Tables: 7
Number of Figures: 3
Page 2
S2
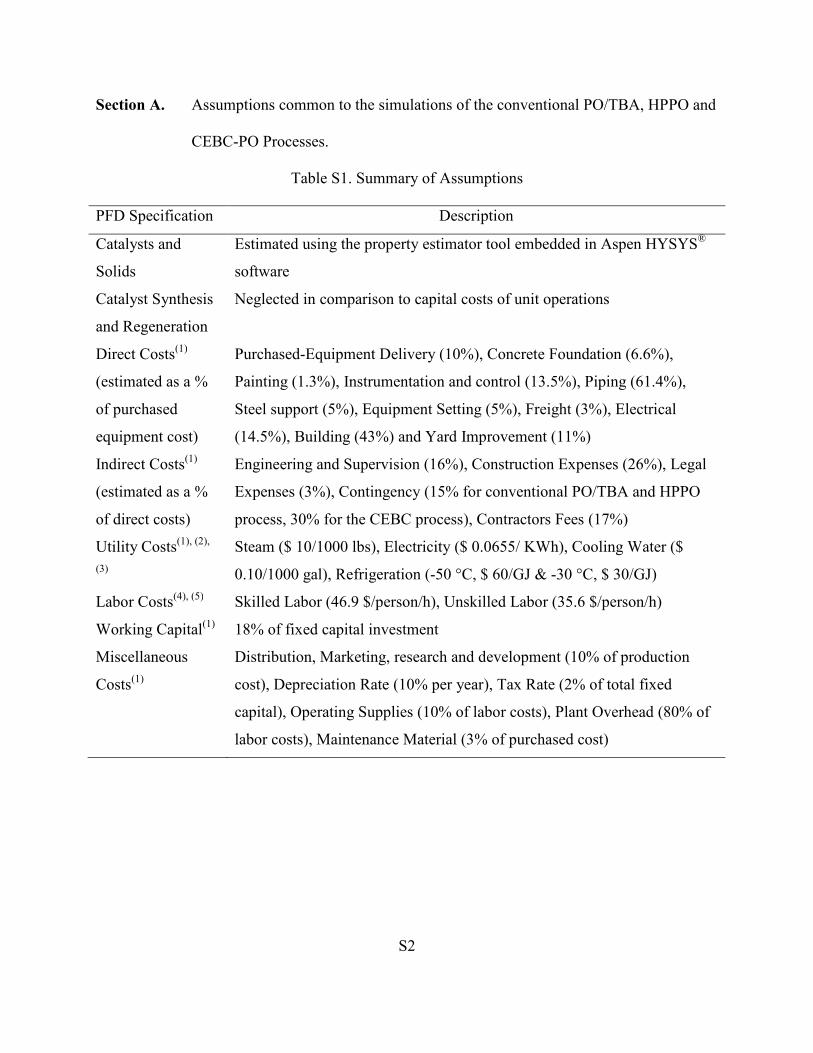
Section A. Assumptions common to the simulations of the conventional PO/TBA, HPPO and
CEBC-PO Processes.
Table S1. Summary of Assumptions
PFD Specification Description
Catalysts and
Solids
Estimated using the property estimator tool embedded in Aspen HYSYS®
software
Catalyst Synthesis
and Regeneration
Neglected in comparison to capital costs of unit operations
Direct Costs(1)
(estimated as a %
of purchased
equipment cost)
Purchased-Equipment Delivery (10%), Concrete Foundation (6.6%),
Painting (1.3%), Instrumentation and control (13.5%), Piping (61.4%),
Steel support (5%), Equipment Setting (5%), Freight (3%), Electrical
(14.5%), Building (43%) and Yard Improvement (11%)
Indirect Costs(1)
(estimated as a %
of direct costs)
Engineering and Supervision (16%), Construction Expenses (26%), Legal
Expenses (3%), Contingency (15% for conventional PO/TBA and HPPO
process, 30% for the CEBC process), Contractors Fees (17%)
Utility Costs(1), (2),
(3)
Steam ($ 10/1000 lbs), Electricity ($ 0.0655/ KWh), Cooling Water ($
0.10/1000 gal), Refrigeration (-50 °C, $ 60/GJ & -30 °C, $ 30/GJ)
Labor Costs(4), (5) Skilled Labor (46.9 $/person/h), Unskilled Labor (35.6 $/person/h)
Working Capital(1) 18% of fixed capital investment
Miscellaneous
Costs(1)
Distribution, Marketing, research and development (10% of production
cost), Depreciation Rate (10% per year), Tax Rate (2% of total fixed
capital), Operating Supplies (10% of labor costs), Plant Overhead (80% of
labor costs), Maintenance Material (3% of purchased cost)
Page 3
S3
Section B. Process Description of the Conventional PO/TBA Process
This process may be viewed in two parts (Figure S1) i-butane oxidation and propylene
epoxidation.
i-Butane oxidation reactor (Section A of Figure S1): Table S1 summarizes the mass flow rates of
the components entering and leaving i-butane oxidation and propylene epoxidation reactors and
the mass flow rates of components in the recycle streams. In Section A, recycled gases (i-butane,
butane) and make-up raw materials (i-butane and oxygen) are fed into six continuous stirred tank
reactors (CSTR) in parallel (total volume = 2143 m3).(6) i-Butane undergoes non-catalytic liquid-
phase oxidation to form t-butyl hydroperoxide (TBHP). Typical reaction conditions are 3 MPa at
135 °C with an average residence time of 10 h. Under optimized conditions, the i-butane
conversion is 37%, and the TBHP selectivity is 53 mol% based on i-butane consumption. A
major co-product of this step is t-butyl alcohol (TBA), with a selectivity of 41 mol% (based on i-
butane conversion).(7) The oxygen concentration in the liquid phase is kept below 4-7 mol%,
primarily for safety reasons.(8) Temperature control in the TBHP reactor is achieved by re-
circulating the liquid reaction mixture through a series of coolers.(7)
The liquid phase containing product TBHP, t-butanol and dissolved i-butane and n-butane
exit the reactor from the bottom. The unreacted oxygen, nitrogen, undissolved i-butane and n-
butane exit the reactor through the overhead stream (vent gases). The vent gases are partially
condensed to recover and recycle (R1) the butanes (i-butane and n-butane) whereas the non-
condensable gases (nitrogen and small quantities of oxygen) are sent to a flare where the oxygen
is used to burn off the unrecovered light hydrocarbon gases. The liquid effluent stream exiting
the reactor is sent to the butanes column (P = 0.2 MPa, T = 78-134 °C) where the light ends (i-
butane, n-butane) and byproducts (acetone and methanol formed by the decomposition of TBHP)
Page 4
S4
are separated from the TBA+TBHP mixture, which is sent to the propylene epoxidation
reactor.(9) The low concentration of methanol byproduct in the reactor effluent stream containing
TBHP may pose a safety concern. By preventing the build-up of methyl hydroperoxide in the
butanes column, the risk associated with distillation of the mixture of
TBHP+methanol+acetone+i-butane+n-butane is minimized.(10) The light ends recovered in the i-
butane column (P = 0.6 MPa, T = 118-140 °C) are recycled whereas acetone and methanol are
separated by extractive distillation with water as the separation solvent.(11) Acetone is recovered
in the acetone column (P= 0.1 MPa, T= 56-84 °C) while methanol and water are separated by
simple distillation in methanol column (P= 0.1 MPa, T= 65-91 °C). In all these columns, cooling
water is used in the condensers.
Propylene Epoxidation (Section B): In the second step, the oxidant (TBHP dissolved in TBA,
from section A), make-up enriched propylene feedstock (propylene/propane ratio is 9:1), and
recycled gases (propylene/propane) are fed into four stirred tank reactors (total volume=1080 m3)
in parallel.(12), (13) Propylene is selectively epoxidized by TBHP in the presence of a
homogeneous molybdenum-based catalyst at 121 °C and 3.5 MPa. For a residence time of 2 h,
the reported TBHP conversion is 98%, and the PO selectivity is 98.4% (based on converted
TBHP).(14), (15) Temperature control in the propylene epoxidation reactor is achieved by
vaporizing and reflux-condensing the reaction mixture.(13) The non-condensable vapors from the
reflux condenser are sent for product separation to the propylene stripper.
The reactor effluent stream containing the unreacted reactants and products are recovered in
a train of distillation columns. The spent catalyst solution is recovered as bottom product from
the separation column (P = 0.4 MPa, T = 9-140 °C). The overhead stream from the separation
column is sent to a propylene stripper (P = 0.6 MPa, T = 3-70 °C) where propylene and propane
Page 5
S5
are separated from PO, t-butanol and TBHP. The mixed propylene/propane stream is sent to a
propane stripper (P = 20 MPa, T = 50°C). The enriched propylene stream is recycled back to the
reactor (R2). PO is separated from the t-butanol and TBHP in the crude PO column (P = 0.2
MPa, T = 5-85 °C). The crude PO is further purified by distillation in a PO purification column
(P = 1.9 MPa, T = 54 °C). The condensers in the propylene stripper and crude PO column are
cooled with chilled water whereas the condensers in the separation column, propane column and
PO purification columns are cooled with ordinary cooling water. The byproduct/product weight
ratio for the PO/TBA process is 2.4.
Figure S1: Process flow diagram for the conventional PO/TBA process: (A) i-Butane
oxidation; (B) Propylene oxide production. (7), (13), (12) Table S2 lists the simulation
parameters employed in this simulation and the compositions of the recycle (R1-2)
Page 6
S6
Table S2: Simulation parameters for the conventional PO/TBA process.(7), (15), (16), (14)
Input/Output stream flow rates (lb/h) from the TBHP and PO reactors obtained from
HYSYS® simulation
TBHP production
Reaction
Conditions
Reactor: Six CSTRs in parallel
P= 3 MPa, T= 135 °C; Conversion (i-butane)= 36.9 mol%,
LHSV (Liquid Hourly Space Velocity)= 2.5 h-1
Catalyst Non-Catalytic
Product Selectivity TBHP= 53.4 mol%; TBA= 40.2 mol% (based on i-butane fed)
Propylene Epoxidation
Reaction
Conditions
Reactor: Four CSTRs in parallel
P= 3.5 MPa, T= 121 °C; Conversion (TBHP)= 98 %
Liquid Hourly Space Velocity (LHSV)= 5 h-1
Feed Composition : Propylene/Propane: 9/1
Catalyst 1.5% Mo Solution in TBA (165 ppm Mo in reaction mixture)
Product Selectivity PO= 98.4 mol% (based on TBHP consumed), 100 mol% (based on C3H6
consumed)
i-Butane Oxidation Propylene
Epoxidation
Mass Flow Rates Input Output Input Output R1 R2
Top Bottom
i-Butane 307340 757 193172 - - 193172 -
n-Butane 2640 167 2406 - - 2574 -
Oxygen 51700 440 - - - - -
Nitrogen 176 176 - - - - -
Methanol 33 - 3750 - - - -
Acetone 66 - 6765 - - - -
t-Butyl Alcohol 352 - 57590 136840 224940 350 -
t-Butyl
Hydroperoxide
572 - 99770 99770 1995 570 -
Propylene - - - 155980 110264 - 110264
Propane - - - 18898 18898 - 18898
Propylene Oxide - - - 1716 55200 - -
Refer to Figure S1 for stream identification (Rj)
Page 7
S7
Section C. Process Description of the HPPO process
Due to the lack of published information on the amylanthraquinone process, this analysis
assumes that the oxidant (H2O2) is procured from an external supplier. The process flow diagram
of the modified HPPO process (hereafter referred to as HPPO process) is shown in Figure S2.
Propylene epoxidation: A mixture of 50 wt.% H2O2/H2O, methanol, make-up reactants
(propylene/propane feed ratio of 1.5:1)(16), (17) and recycled gases (propylene/propane) are fed
into three fixed-bed catalytic reactors connected in parallel (total volume = 900 m3).(18) The mass
flow rates of components entering and leaving the reactor are summarized in Table S3. A
titanium silicate (often referred to as TS-1) catalyzes propylene epoxidation by H2O2 at 40 °C
and 2 MPa (Figure S2). The activity of the TS-1 catalyst gradually declines from an initial H2O2
conversion of 96% to 63% after two weeks, necessitating catalyst regeneration.(19) In this
analysis, roughly 90% of the H2O2 is utilized in the reactor for epoxidation while the remaining
10% unreacted H2O2 is safely decomposed. The selectivities toward PO and propylene glycol
(PG) are 95.5% and 4.5%, respectively.(16) In addition to PG, trace quantities of acetone, acetic
acid and formaldehyde are also formed as byproducts.(19) Temperature control in the PO reactor
is achieved by re-circulating part of the reaction mixture through a series of heat exchangers.
The bulk of the unreacted propylene and propane is recovered by simple depressurization in
propylene stripper 1. This propane-rich stream may be dehydrogenated to produce a mixture of
propane and propylene. The value of this enriched propane stream is credited in this analysis.
The presence of unreacted H2O2 in the reactor effluent stream poses safety concerns. Methanol
and H2O2 mixtures can form an explosive vapor phase mixture during distillation. For purposes
of this economic analysis, we assume that the unreacted H2O2 (10 mol%) is safely decomposed
to H2O and O2 post-reaction at approximately 50 °C immediately following the propylene
Page 8
S8
stripper 1. The effluent from the decomposer is a gaseous mixture of oxygen and propylene
whose composition (1 wt% propylene) lies below the lower flammability limit (LFL) of the
mixture.(8) The liquid effluent stream from the H2O2 decomposer containing PO, propylene
glycol, methanol, water and dissolved propylene/propane is fed to a propylene stripper 2 (P = 1.2
MPa, T = 50 °C) where propylene and propane are recovered. The liquid phase from this unit is
sent to a PO stripper (P = 1.2 MPa, T = 47 °C). The methanol recovery column (P = 0.4 MPa, T
= 66 °C) and the wastewater column (P = 0.5 MPa, T = 94 °C) help with the separation of
methanol and propylene glycol. The condensers in all the distillation columns utilize cooling
water. It is believed that the commercial process incorporates a proprietary H2O2 recovery and
recycle technology, details of which are not yet available in the public domain. H2O2 recovery
obviates the need for deliberate H2O2 destruction and should improve the process economics.
Page 9
S9
Figure S2: Process flow diagram for the HPPO Process.(17), (16) Table S3 lists the simulation
parameters employed in this simulation and the compositions of the recycle (R1-2).
(*) The C3H8-rich stream exiting from the overhead of the propylene stripper 1
and propylene stripper 2 is sent to a propane dehydrogenator to produce
propylene. Hence, the propane is assigned a value as a co-product.
Page 10
S10
Table S3: Simulation parameters for the Hydrogen Peroxide/Propylene Oxide (HPPO)
Process.(17), (20), (16), (21) Input/output stream flow rates (lb/h) for the PO reactor
obtained from HYSYS® simulation
Propylene Epoxidation
Reaction
Conditions
Reactor: Three Fixed Beds in parallel
P= 2 MPa; T= 40 °C; Conversion (H2O2)= 90%
Liquid Hourly Space Velocity (LHSV)= 5 h-1
Feed Composition : Propylene/Propane: 1.5/1
Catalyst Titanium Silicate (TS-1)
Product
Selectivity
PO= 95 mol%; PG= 4.5 mol% (based on H2O2 consumed in the reactor)
PO= 95.4 mol%; PG= 4.6 mol% (based on C3H6 consumed)
Propylene Epoxidation Reactor
Mass Flow Rates Input Output R1
Hydrogen
Peroxide (H2O2)
35924 3566 -
Water 35924 53054 220
Methanol 22968 22968 22968
Propane 29608 29608 -
Propylene 44413 4441 -
Propylene Oxide - 55200 -
Propylene Glycol - 3676 -
Refer to Figure S2 for stream identification (Rj)
Page 11
S11
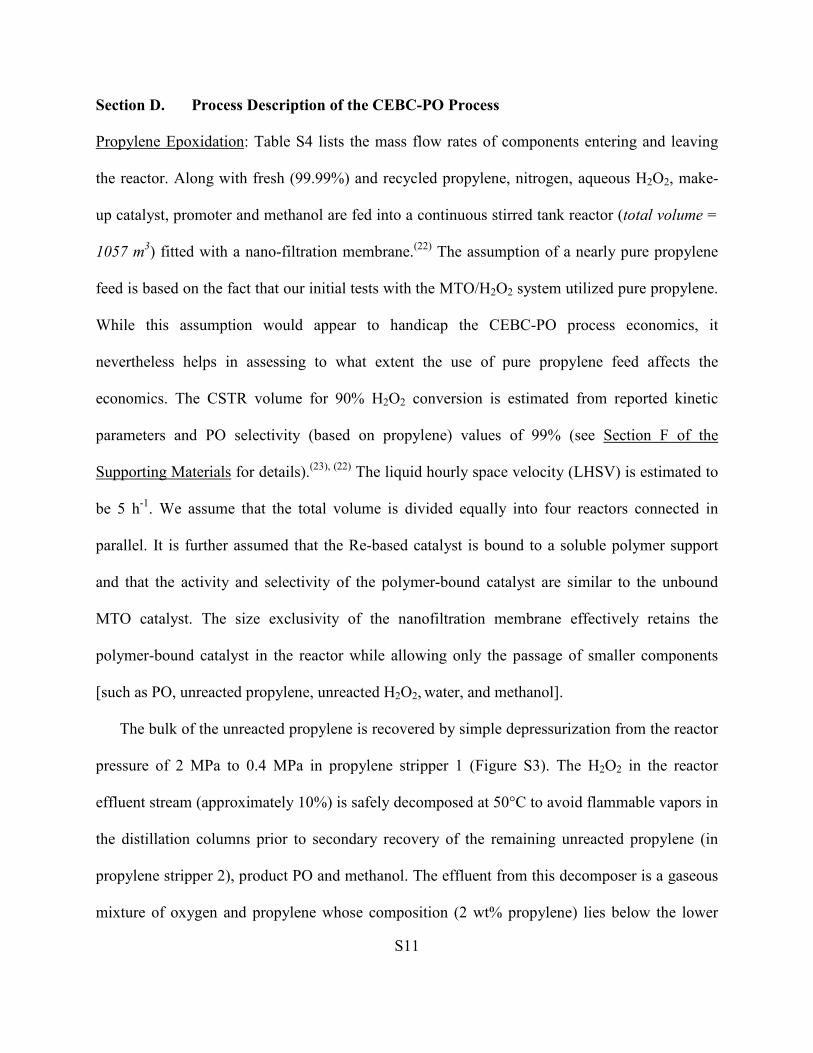
Section D. Process Description of the CEBC-PO Process
Propylene Epoxidation: Table S4 lists the mass flow rates of components entering and leaving
the reactor. Along with fresh (99.99%) and recycled propylene, nitrogen, aqueous H2O2, make-
up catalyst, promoter and methanol are fed into a continuous stirred tank reactor (total volume =
1057 m3) fitted with a nano-filtration membrane.(22) The assumption of a nearly pure propylene
feed is based on the fact that our initial tests with the MTO/H2O2 system utilized pure propylene.
While this assumption would appear to handicap the CEBC-PO process economics, it
nevertheless helps in assessing to what extent the use of pure propylene feed affects the
economics. The CSTR volume for 90% H2O2 conversion is estimated from reported kinetic
parameters and PO selectivity (based on propylene) values of 99% (see Section F of the
Supporting Materials for details).(23), (22) The liquid hourly space velocity (LHSV) is estimated to
be 5 h-1. We assume that the total volume is divided equally into four reactors connected in
parallel. It is further assumed that the Re-based catalyst is bound to a soluble polymer support
and that the activity and selectivity of the polymer-bound catalyst are similar to the unbound
MTO catalyst. The size exclusivity of the nanofiltration membrane effectively retains the
polymer-bound catalyst in the reactor while allowing only the passage of smaller components
[such as PO, unreacted propylene, unreacted H2O2, water, and methanol].
The bulk of the unreacted propylene is recovered by simple depressurization from the reactor
pressure of 2 MPa to 0.4 MPa in propylene stripper 1 (Figure S3). The H2O2 in the reactor
effluent stream (approximately 10%) is safely decomposed at 50°C to avoid flammable vapors in
the distillation columns prior to secondary recovery of the remaining unreacted propylene (in
propylene stripper 2), product PO and methanol. The effluent from this decomposer is a gaseous
mixture of oxygen and propylene whose composition (2 wt% propylene) lies below the lower
Page 12
S12
flammability limit (LFL).(8) The effluent from the decomposer is sent to a PO stripper where the
product PO is recovered (P = 1.2 MPa, T = 56 °C). Methanol is separated from water in the
wastewater column (P = 0.3 MPa, T = 27 °C). The condensers in all the distillation columns
utilize cooling water.
Figure S3: Process flow diagram for the CEBC-PO Process.(24), (22), (23) Table S4 lists the
simulation parameters employed in this simulation and the compositions of the
recycle (R1-2)
Page 13
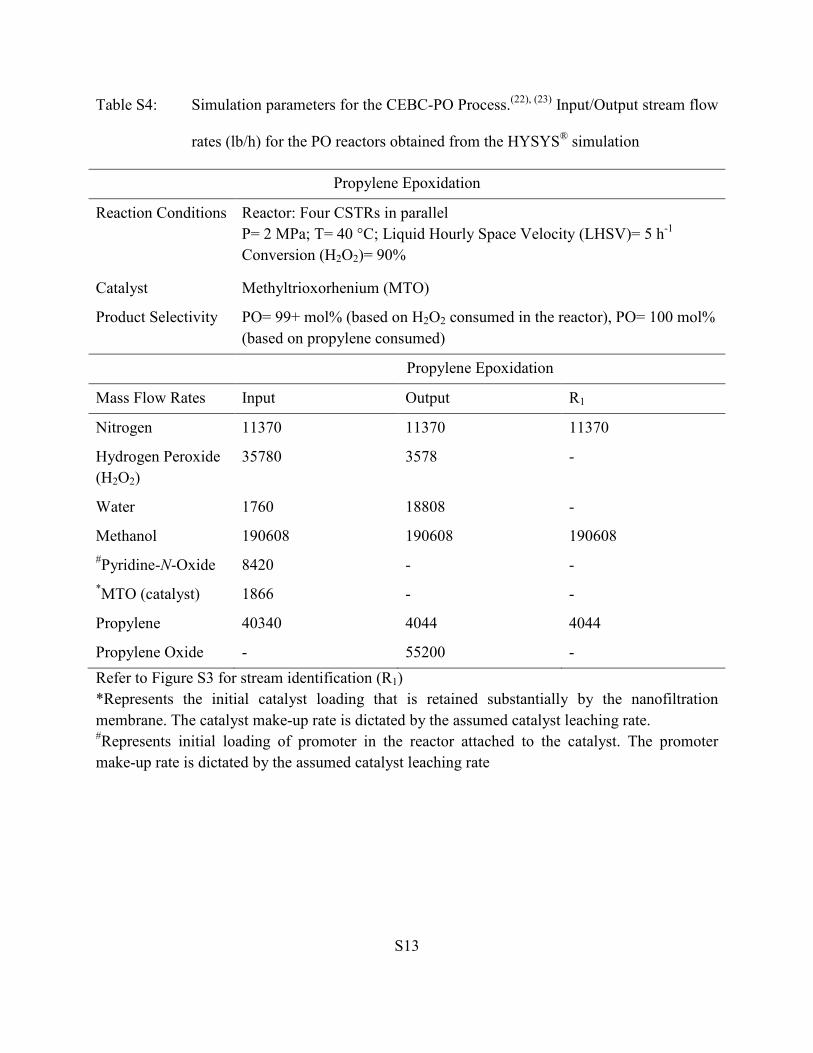
S13
Table S4: Simulation parameters for the CEBC-PO Process.(22), (23) Input/Output stream flow
rates (lb/h) for the PO reactors obtained from the HYSYS® simulation
Propylene Epoxidation
Reaction Conditions Reactor: Four CSTRs in parallel
P= 2 MPa; T= 40 °C; Liquid Hourly Space Velocity (LHSV)= 5 h-1
Conversion (H2O2)= 90%
Catalyst Methyltrioxorhenium (MTO)
Product Selectivity PO= 99+ mol% (based on H2O2 consumed in the reactor), PO= 100 mol%
(based on propylene consumed)
Propylene Epoxidation
Mass Flow Rates Input Output R1
Nitrogen 11370 11370 11370
Hydrogen Peroxide
(H2O2)
35780 3578 -
Water 1760 18808 -
Methanol 190608 190608 190608
#Pyridine-N-Oxide 8420 - -
*MTO (catalyst) 1866 - -
Propylene 40340 4044 4044
Propylene Oxide - 55200 -
Refer to Figure S3 for stream identification (R1)
*Represents the initial catalyst loading that is retained substantially by the nanofiltration
membrane. The catalyst make-up rate is dictated by the assumed catalyst leaching rate. #Represents initial loading of promoter in the reactor attached to the catalyst. The promoter
make-up rate is dictated by the assumed catalyst leaching rate
Page 14
S14
Section E. Impact Categories considered in this analysis and their descriptions
Table S5. Impact Categories considered in this analysis and their descriptions
Impact Category Description
Greenhouse Gas
Emissions
Change in atmospheric temperatures caused by the buildup of chemicals that
trap heat from the reflected sunlight that would have otherwise passed
out to earth’s atmosphere
Acidification Quantifies the potential emissions (such as SO2 and NOx) that increase the
acidity of water and soil systems
Ecotoxicity Quantifies the potential ecological harm of unit quantity of chemical released
into an evaluative (soil, water and air) environment
Eutrophication Estimates the potential release of chemicals containing N or P to either air or
water
Human Health
Cancer
Estimates the potential of a chemical released into an evaluative environment
to cause human cancer effects
Human Health
Non-Cancer
Estimates the potential of a chemical released into an evaluative environment
to cause human non-cancer effects
Smog Air Estimates the potential of a chemical released to air to cause smog via
photochemical reactions
Ozone Depletion
Potential
Estimates the potential of chemical released to air to destroy ozone based on
chemical’s reactivity and lifetime
Page 15
S15
Section F. Estimation of reactor volume for the CEBC-PO Process
The reactor is modeled as a CSTR and epoxide formation (represented by the following
stoichiometry) is assumed to be the only reaction.
)()()()( 2632263 DOHCOHCBOHAHC +→+
The rate of hydrogen peroxide (limiting reagent) consumption at the operating conditions is
given by(25)
VCkr BB
'=− (1)
The steady state conversion of hydrogen peroxide (XB) is obtained from a material balance as
follows:
( )BB
Xk
vXV
−=
1' (2)
Volumetric feed rate (v) = 5.59 m3/h
Hydrogen peroxide conversion (XB) = 0.90
Pseudo first order rate constant for the propylene epoxidation (k’) = 0.04752 h-1
Volume of the reactor (V) = 1057 m3
Page 16
S16
Section G. Methodology to extract the Environmental Impact Factors for TRACI from GaBi
The potential adverse environmental impacts caused by the fugitive emissions at the plant
are estimated using empirical equations available in literature. TRACI, environmental impact
factors used in the estimation of environmental impacts are extracted from GaBi® software using
the following methodology:
1. Create a new plan.
2. Create a new process in the plan rather than using the existing USLCI datasets.
3. Define the various components that constitute as fugitive emissions as process streams in the
process.
4. Input the estimated quantitative data in the process and execute the plan.
The differences in the predicted and reported data (total waste generated) may be attributed
to the increase in fugitive emissions with the aging of flanges and other connections. Such
temporal variations in fugitive emissions from various unit operations is not accounted for by the
empirical equations available in the literature. 26
Page 17
S17
Table S6. Comparison of emissions obtained from Toxic Release Inventory data for
LyondellBasell’s Bayport, TX facility and those predicted by GaBi® software.(27)
Impact Units LyondellBasell PO/TBA Process
GaBi®,
gate-to-gate
millions
EPA Toxic Release
Inventory (gate-to-gate),
millions
Total
Waste
Released
Waste
Acidification [mol H+ Eq.] 0 N/A N/A
Ecotoxicity-Air [kg 2,4-DCP Eq.] 1.29(10-3) 2.4(10-2) 0.35(10-3)
Ecotoxicity- Surface Soil [kg Benzene Eq.] 0 0.27(10-6) 0.27(10-6)
Ecotoxicity Water [kg 2,4-DCP Eq.] 1.72 2.73 0.49
Eutrophication [kg N Eq.] 0 N/A N/A
Greenhouse Gas Emissions [kg CO2 Eq.] 1.32(10-2) N/A N/A
Human Health Cancer-Air [kg Benzene Eq.] 0.25 N/A N/A
Human Health Cancer-SS [kg Benzene Eq.] 0 0.36 6.2(10-3)
Human Health Cancer-Water [kg Benzene Eq.] 0.96 0.96 0.012
Human Health Criteria- Air
Point Source
[kg PM 2,5 Eq.] 0 N/A N/A
Human Health Non-Cancer Air [kg Toluene Eq.] 0.052 0.10 0.17(10-2)
Human Health Non-Cancer SS [kg Toluene Eq.] 0.94 0.71 0.012
Human Health Non-Caner
Water
[kg Toluene Eq.] 0.67 0.41 0.007
Ozone Depletion Potential [kg CFC-11 Eq.] 0 N/A N/A
Smog Potential [kg NOx Eq.] 0.0051 0.032 0.2(10-3)
DCP: Dichlorophenoxyace, Eq.: Equivalent, N/A: Data not available in the toxic release
inventory
Page 18
S18
Section H. Predicted cradle-to-gate environmental impact assessment
Table S7. Predicted cradle-to-gate environmental impacts for producing propylene oxide by the
conventional PO/TBA, HPPO and CEBC-PO processes
Impact Units Conventional
PO/TBA
Process,
millions
HPPO
Process,
millions
CEBC-PO
Process,
millions
Acidification [mol H+ Eq.] 572 465 493
Ecotoxicity-Air [kg 2,4-DCP Eq.] 18.2 3.33 3.42
Ecotoxicity Surface Soil [kg Benzene Eq.] 6.3(10-2) 4.0(10-2) 4.0(10-2)
Ecotoxicity Water [kg 2,4-DCP Eq.] 212.6 132.9 138.2
Eutrophication [kg N Eq.] 0.32 0.21 0.30
Greenhouse Gas Emissions [kg CO2 Eq.] 3561 2598 2827
Human Health Cancer-Air [kg Benzene Eq.] 0.38 0.62 0.67
Human Health Cancer-SS [kg Benzene Eq.] 0.22(10-3) 0.12(10-3) 0.12(10-3)
Human Health Cancer-
Water
[kg Benzene Eq.] 0.315 0.227 0.23
Human Health Criteria- Air
Point Source
[kg PM 2,5 Eq.] 3.75 3.02 3.21
Human Health Non-Cancer
Air
[kg Toluene Eq.] 5031 946 954
Human Health Non-Cancer
SS
[kg Toluene Eq.] 4.88 3.19 3.08
Human Health Non-Caner
Water
[kg Toluene Eq.] 8444
6317 6569
Ozone Depletion Potential [kg CFC-11 Eq.] 4.11(10-5) 7.4(10-5) 7.7(10-5)
Smog Potential [kg NOx Eq.] 5.61 (10-3) 4.7(10-3) 4.5(10-3)
DCP: Dichlorophenoxyace, Eq.: Equivalent
Page 19
S19
Notation
CB concentration of hydrogen peroxide in the liquid phase, kmol m-3
k’ pseudo first order constant for propylene epoxidation includes catalyst concentration, h-1
-rB rate of hydrogen peroxide consumption, kmol m-3 h-1
v volumetric flow rate of the reactor effluent stream, m3 h-1
V volume of the reactor, m3
XB steady state hydrogen peroxide conversion in the reactor
References
1. Peters, M.S. Timmerhaus, K.D., Plant Design and Economics For Chemical Engineers.
Fourth ed1991, New York: McGraw Hill Inc. 910.
2. U. S. Energy Information Administration-Electricity. 2011,
http://www.eia.gov/energyexplained/index.cfm?page=electricity_in_the_united_states.
3. U. S. Energy Information Administration-Natural Gas. 2011.
4. U.S. Bureau of Labor Statistics. 2010, http://www.bls.gov/cpi/.
5. Engineering News Record. 2010, www.enr.com.
6. Thomas, K.A.; Preston, K.L. Reaction of Isobutane with Oxygen, USPTO 5436375,
1995, Texaco Chemical Company: United States. p. 7.
7. John C. J. Jr. Oxidation of Isobutane to Tertiary Butyl Hydroperoxide, U.S. Patent
5149885, 1992, Arco Chemical Technology: United States.
8. Zabetakis, M.G., Flammability Characteristics of combustible gases and vapor. 1st
ed1939: U.S. Department of Interior, US Bureau of Mines.
Page 20
S20
9. Wang, Y.W.; Duh, Y.S.; Shu, C.M. Characterization of the Self-Reactive decomposition
of tert-Butyl hydroperoxide in three different diluents. Proc. Saf. Prog. 2007, 26 (4), 299-
303.
10. Arai, M., Kobayahi, M.,Tamura, M., Explosion of Methanol Distillation Column of
Detergent Manufacturing Plant, 1991: Ichihara, Chiba, Japan. p. 12.
11. Botia, D.C.; Riveros, D.C.; Ortiz, P.; Gil, I.D.; Sanchez, O.F. Vapor-Liquid Equilibrium
in Extractive Distillation of the Acetone/Methanol System Using Water as Entrainer and
Pressure Reduction. Ind. & Eng. Chem. Res. 2010, 49 (13), 6176-6183.
12. Wu, C.-N.T.; Taylor, M.E.; Mueller, M.A. Controlled Epoxidation of Propylene, U.S.
Patent 5410077, 1995, Texaco Chemical Company: United States.
13. Preston, K.L.; Wu, C.-N.T.; Taylor, M.E.; Mueller, M.A. Staged Epoxidation of
Propylene with Recycle, USPTO 5349072, 1994, Texaco Chemical Company: United
States. p. 12.
14. Issacs, B.H. Preparation Of Soluble Molybdenum Catalysts for Epoxidation of Olefins,
U.S. Patent 4590172, 1986, Atlantic Richfield Company: Unites States.
15. Stein, T.W.; Gilman, H.; Bobeck, R.L. Epoxidation Process, U.S. Patent 3849451, 1974,
Halcon International: United States.
16. Vora, B.V.; Pujado, P.R. Process For Producing Propylene Oxide, United States
5599955, 1997, UOP: United States.
17. Pujado, P.R.; Hammerman, J.I. Integrated Process For The Production Of Propylene
Oxide, U.S. Patent 5599956, 1997, UOP: United States.
Page 21
S21
18. Brocker, F.J.; Haake, M.; Kaibel, G.; Rohrbacher, G.; Schwab, E.; Stroezel, M.
Isothermal Operations of Heterogeneously Catalyzed Three Phase Reactions, USPTO
7576246, 2009, BASF: United States. p. 8.
19. Teles, J.H.; Rehfinger, A.; Berg, A.; Rudolf, P.; Rieber, N.; Bassler, P. Method For
Producing An Epoxide, USPTO 2003/0187284 A1, 2006, BASF Aktiengesellschaft:
United States. p. 9.
20. Ullmann, F., Propylene Oxide, In Ullmann's Encyclopedia of Industrial Chemistry, S.
Hawkins, Russey, W.E., Pilkart-Muller, M., Editors. 2003, Wiley-VCH: Weinhem.
21. Thiele, G.F.; Roland, E. Propylene epoxidation with hydrogen peroxide and titanium
silicalite catalyst: Activity, deactivation and regeneration of the catalyst. J. of Mol. Cat.
A-Chem. 1997. 117 (1-3), 351-356.
22. Busch, D.H.; Subramaniam, B.; Lee, H.J.; Shi, T.P. Process for Selective Oxidation of
Olefins to Epoxides, U.S. Patent 7649101 B2, Editor 2010, University of Kansas: United
States.
23. Lee, H.J.; Shi, T.P.; Busch, D.H.; Subramaniam, B. A greener, pressure intensified
propylene epoxidation process with facile product separation. Chem. Eng. Sci., 2007. 62
(24), 7282-7289.
24. Subramaniam, B.; Busch, D.H.; Lee, H.J.; Ghanta, M.; Shi, T.-P. Process for Selective
Oxidation of Olefins to Epoxides, USPTO 8080677 B2, 2011, University of Kansas:
United States.
25. Ghanta, M.; Lee, H.J.; Busch, D.H.; Subramaniam, B. Highly Selective Homogeneous
Ethylene Epoxidation in Gas (Ethylene)-Expanded Liquid: Transport and Kinetic Studies.
AIChE J., 2012. 10.1002/aic.13789.
Page 22
S22
26. Allen, D.T. Shonnard, D., Green Engineering: Environmentally-Conscious Design of
Chemical Processes2002, New Jersey: Prentice Hall: Upper Saddle River.
27. Toxic Release Inventory-LyondellBasell Chemical Company Bayport Facility. 2012,
http://iaspub.epa.gov/triexplorer/release_fac_profile?TRI=77507RCCHM10801&year=2
010&trilib=TRIQ1&FLD=&FLD=RELLBY&FLD=TSFDSP&OFFDISPD=&OTHDISP
D=&ONDISPD=&OTHOFFD=.


![The Effect of Hindered Phenol Stabilizers on Oxygen Induction … · hydrogen atom from another polymer chain to form a hydroperoxide [ROOH]. The hydroperoxide can The hydroperoxide](https://static.documents.pub/doc/80x56/5cc1221488c993ed078b9533/the-effect-of-hindered-phenol-stabilizers-on-oxygen-induction-hydrogen-atom.jpg)

