www.sciencemag.org/cgi/content/full/334/6057/821/DC1 Supporting Online Material for A Burkholderia pseudomallei Toxin Inhibits Helicase Activity of Translation Factor eIF4A Abimael Cruz-Migoni, Guillaume M. Hautbergue, Peter J. Artymiuk, Patrick J. Baker, Monika Bokori-Brown, Chung-Te Chang, Mark J. Dickman, Angela Essex-Lopresti, Sarah V. Harding, Nor Muhammad Mahadi, Laura E. Marshall, George W. Mobbs, Rahmah Mohamed, Sheila Nathan, Sarah A. Ngugi, Catherine Ong, Wen Fong Ooi, Lynda J. Partridge, Helen L. Phillips, M. Firdaus Raih, Sergei Ruzheinikov, Mitali Sarkar-Tyson, Svetlana E. Sedelnikova, Sophie J. Smither, Patrick Tan, Richard W. Titball, Stuart A. Wilson,* David W. Rice* *To whom correspondence should be addressed. E-mail: [email protected] (S.A.W.); [email protected] (D.W.R.) Published 11 November 2011, Science 334, 821 (2011) DOI: 10.1126/science.1211915 This PDF file includes: Materials and Methods Figs. S1 to S13 Tables S1 to S3 Full Reference List
A Burkholderia pseudomallei Toxin Inhibits Helicase Activity of Translation Factor eIF4A
Abimael Cruz-Migoni, Guillaume M. Hautbergue, Peter J. Artymiuk, Patrick J. Baker, Monika Bokori-Brown, Chung-Te Chang, Mark J. Dickman, Angela Essex-Lopresti, Sarah V. Harding, Nor Muhammad Mahadi, Laura E. Marshall, George W. Mobbs, Rahmah Mohamed, Sheila Nathan, Sarah A. Ngugi, Catherine Ong, Wen Fong Ooi, Lynda J. Partridge, Helen L. Phillips, M. Firdaus Raih, Sergei Ruzheinikov, Mitali
Sarkar-Tyson, Svetlana E. Sedelnikova, Sophie J. Smither, Patrick Tan, Richard W. Titball, Stuart A. Wilson,* David W. Rice*
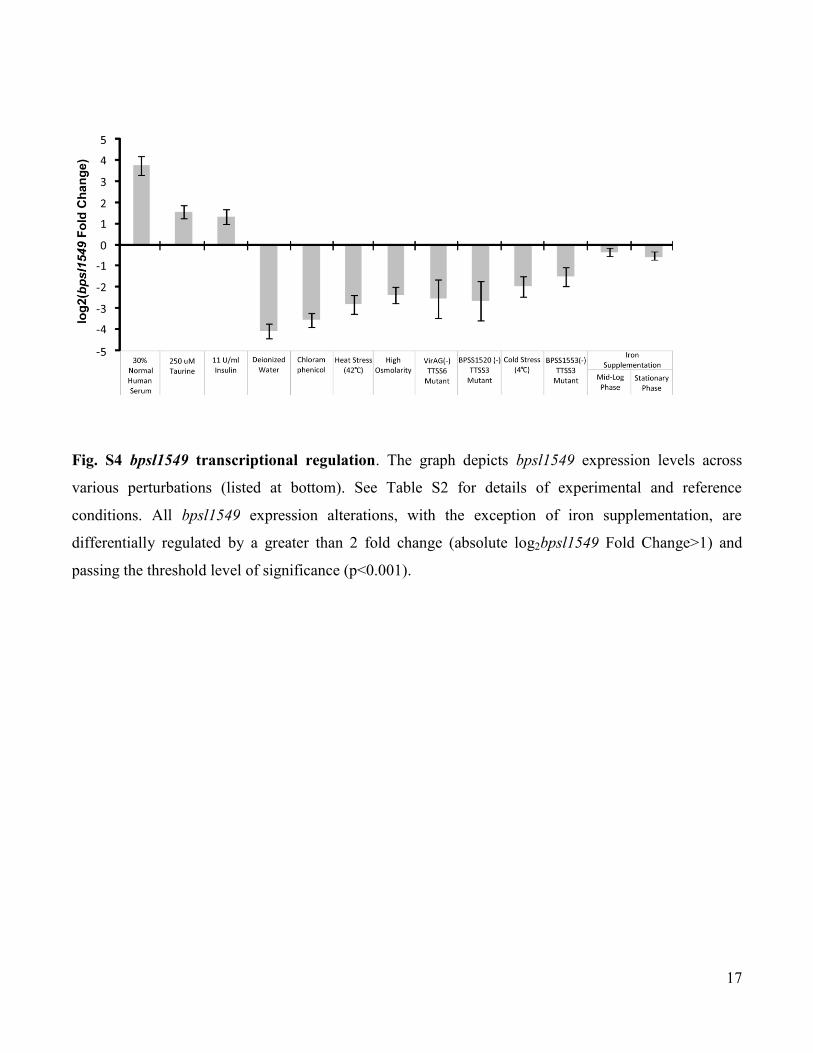
Fig. S4 bpsl1549 transcriptional regulation. The graph depicts bpsl1549 expression levels across
various perturbations (listed at bottom). See Table S2 for details of experimental and reference
conditions. All bpsl1549 expression alterations, with the exception of iron supplementation, are
differentially regulated by a greater than 2 fold change (absolute log2bpsl1549 Fold Change>1) and
passing the threshold level of significance (p<0.001).
18
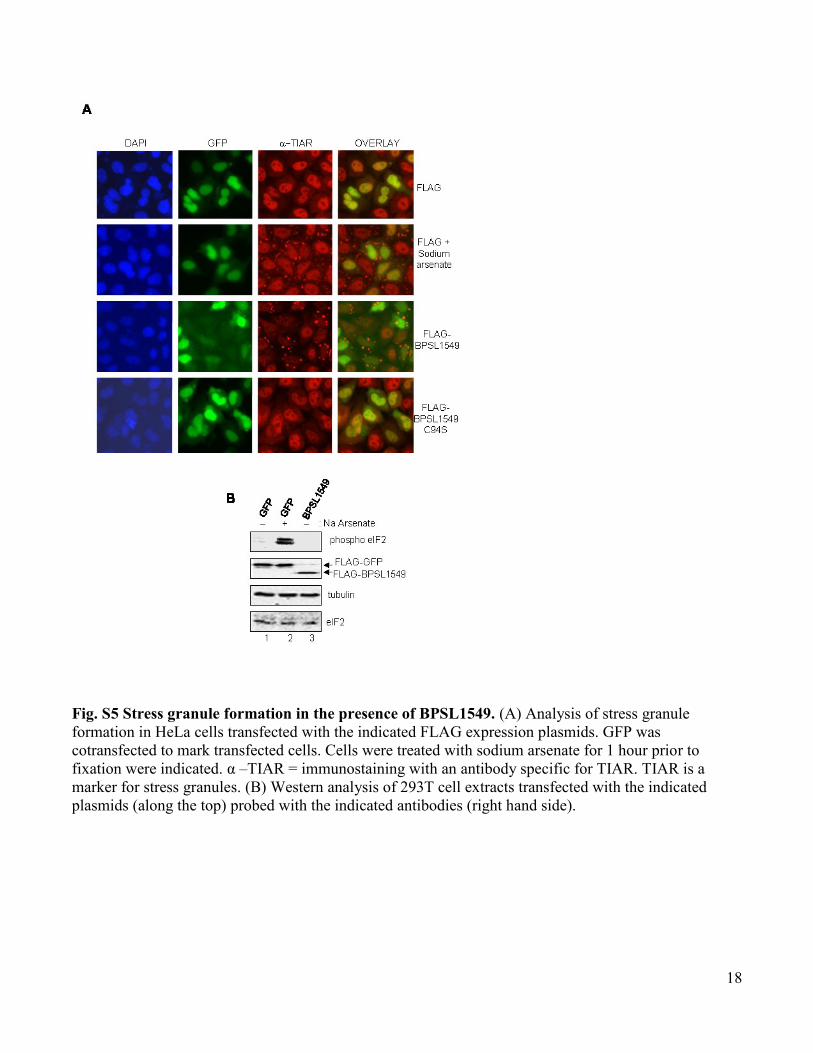
Fig. S5 Stress granule formation in the presence of BPSL1549. (A) Analysis of stress granule
formation in HeLa cells transfected with the indicated FLAG expression plasmids. GFP was
cotransfected to mark transfected cells. Cells were treated with sodium arsenate for 1 hour prior to
fixation were indicated. α –TIAR = immunostaining with an antibody specific for TIAR. TIAR is a
marker for stress granules. (B) Western analysis of 293T cell extracts transfected with the indicated
plasmids (along the top) probed with the indicated antibodies (right hand side).
19
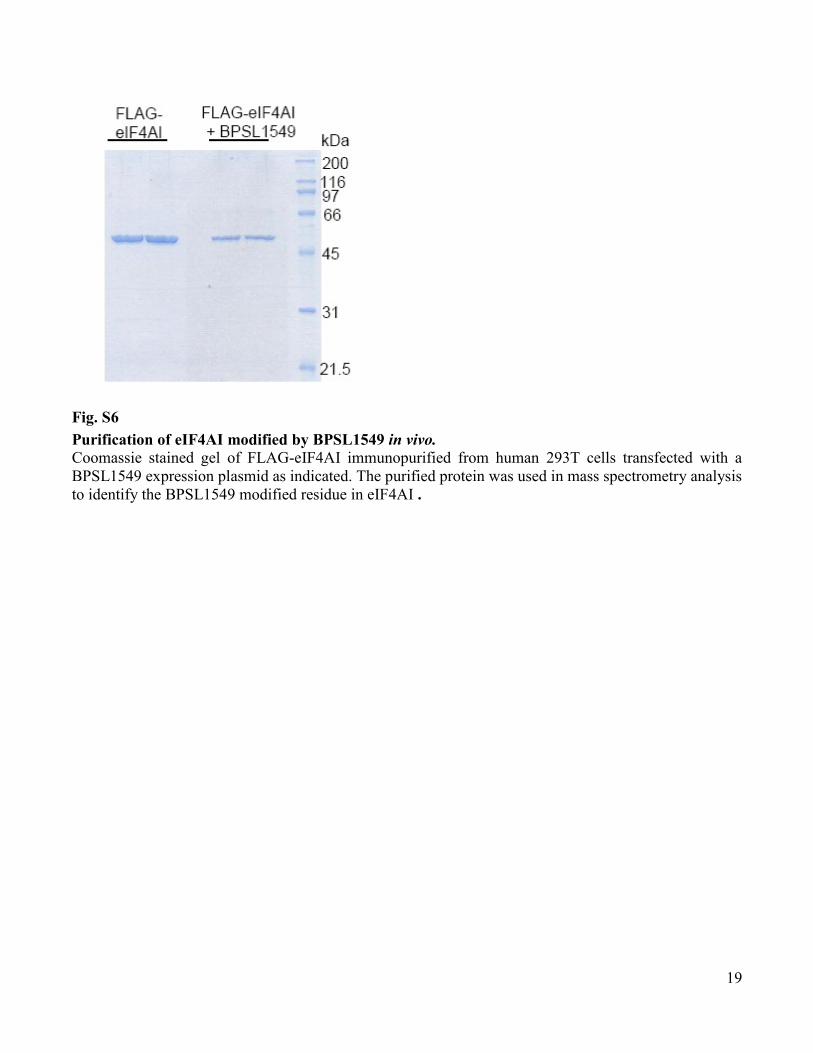
Fig. S6
Purification of eIF4AI modified by BPSL1549 in vivo. Coomassie stained gel of FLAG-eIF4AI immunopurified from human 293T cells transfected with a
BPSL1549 expression plasmid as indicated. The purified protein was used in mass spectrometry analysis
to identify the BPSL1549 modified residue in eIF4AI .
20
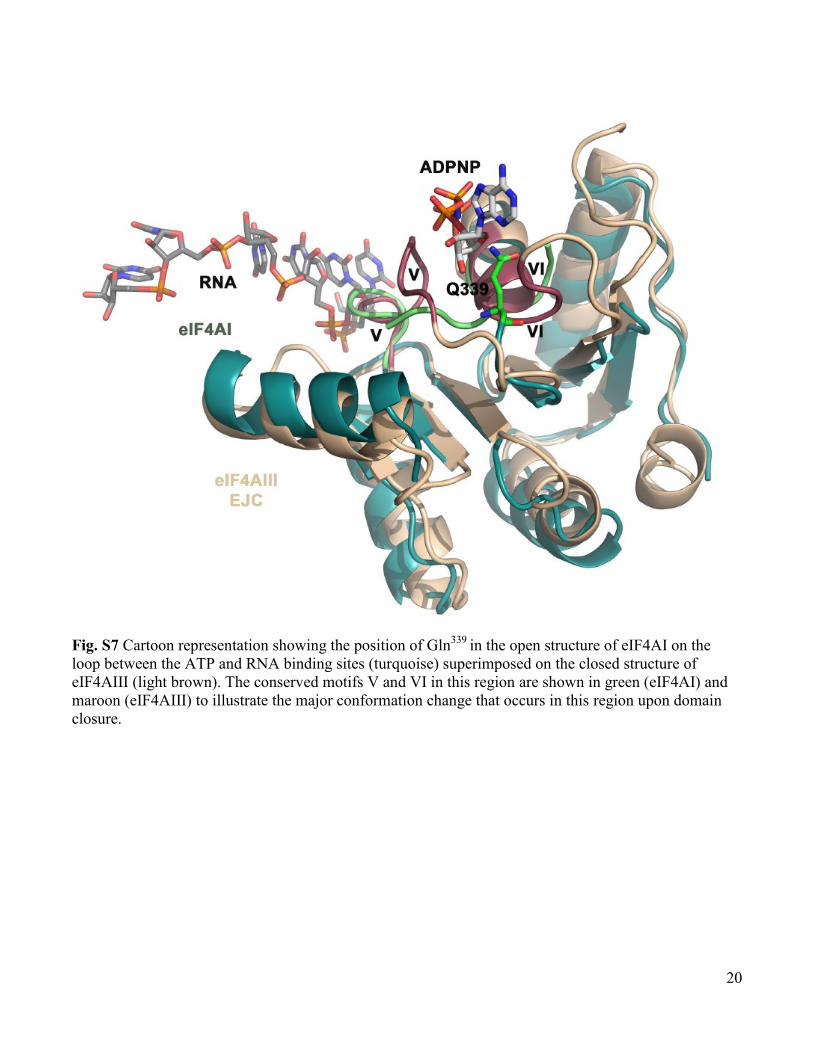
Fig. S7 Cartoon representation showing the position of Gln339
in the open structure of eIF4AI on the
loop between the ATP and RNA binding sites (turquoise) superimposed on the closed structure of
eIF4AIII (light brown). The conserved motifs V and VI in this region are shown in green (eIF4AI) and
maroon (eIF4AIII) to illustrate the major conformation change that occurs in this region upon domain
closure.
21
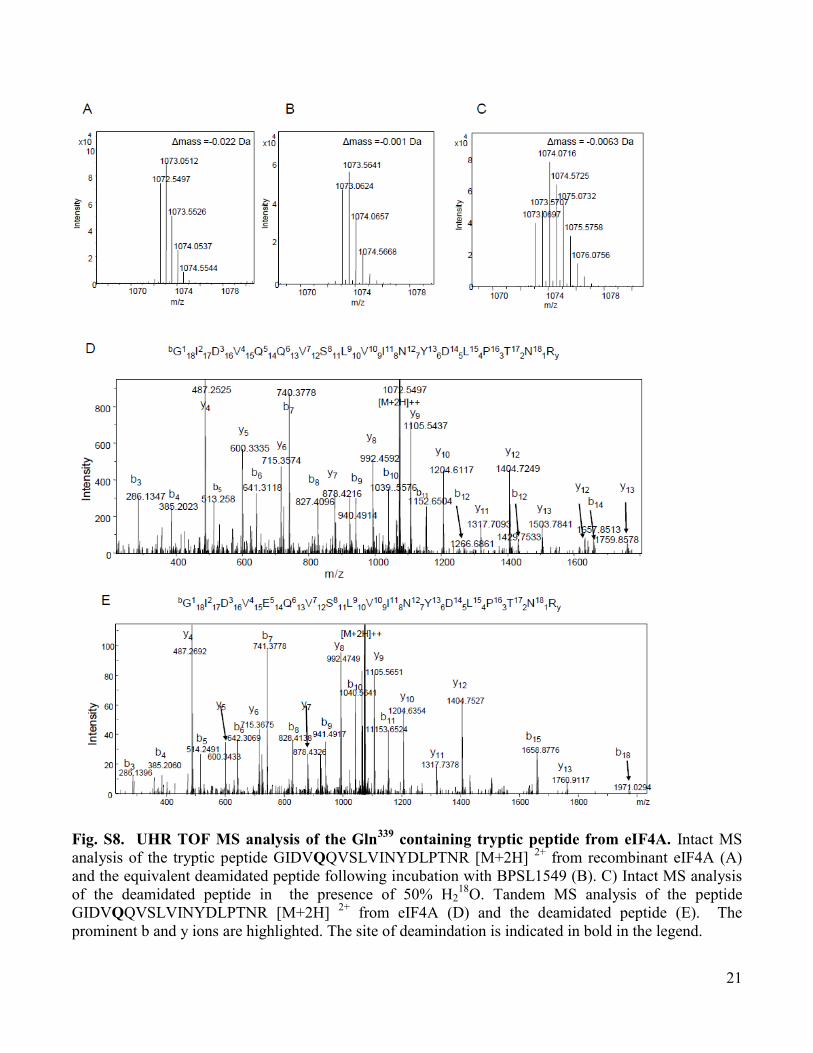
Fig. S8. UHR TOF MS analysis of the Gln339
containing tryptic peptide from eIF4A. Intact MS
analysis of the tryptic peptide GIDVQQVSLVINYDLPTNR [M+2H] 2+
from recombinant eIF4A (A)
and the equivalent deamidated peptide following incubation with BPSL1549 (B). C) Intact MS analysis
of the deamidated peptide in the presence of 50% H218
O. Tandem MS analysis of the peptide
GIDVQQVSLVINYDLPTNR [M+2H] 2+
from eIF4A (D) and the deamidated peptide (E). The
prominent b and y ions are highlighted. The site of deamindation is indicated in bold in the legend.
22
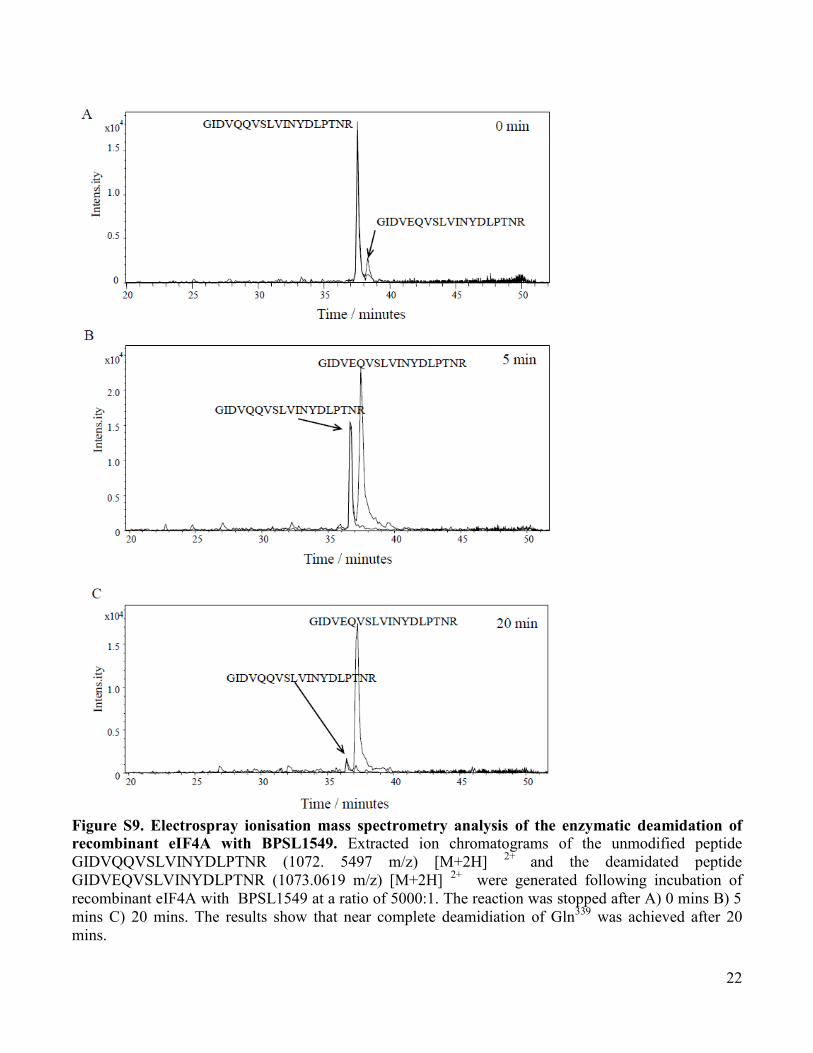
Figure S9. Electrospray ionisation mass spectrometry analysis of the enzymatic deamidation of
recombinant eIF4A with BPSL1549. Extracted ion chromatograms of the unmodified peptide
GIDVQQVSLVINYDLPTNR (1072. 5497 m/z) [M+2H] 2+
and the deamidated peptide
GIDVEQVSLVINYDLPTNR (1073.0619 m/z) [M+2H] 2+
were generated following incubation of
recombinant eIF4A with BPSL1549 at a ratio of 5000:1. The reaction was stopped after A) 0 mins B) 5
mins C) 20 mins. The results show that near complete deamidiation of Gln339
was achieved after 20
mins.
23
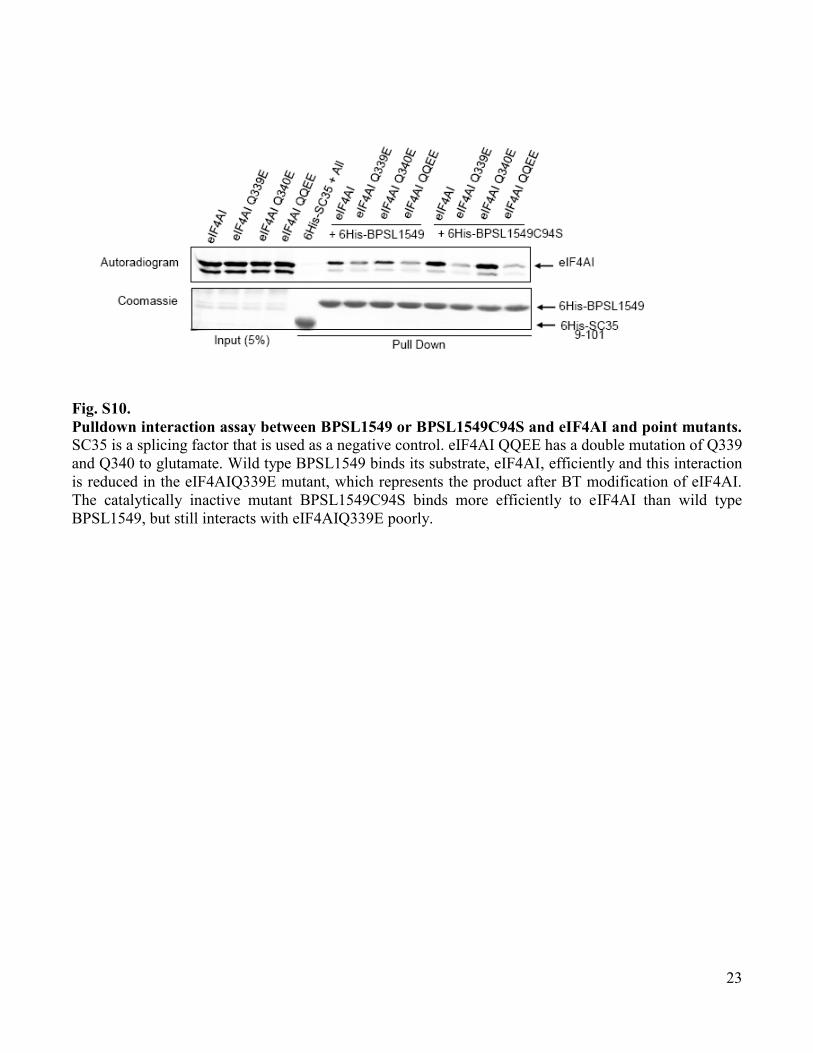
Fig. S10.
Pulldown interaction assay between BPSL1549 or BPSL1549C94S and eIF4AI and point mutants.
SC35 is a splicing factor that is used as a negative control. eIF4AI QQEE has a double mutation of Q339
and Q340 to glutamate. Wild type BPSL1549 binds its substrate, eIF4AI, efficiently and this interaction
is reduced in the eIF4AIQ339E mutant, which represents the product after BT modification of eIF4AI.
The catalytically inactive mutant BPSL1549C94S binds more efficiently to eIF4AI than wild type
BPSL1549, but still interacts with eIF4AIQ339E poorly.
24
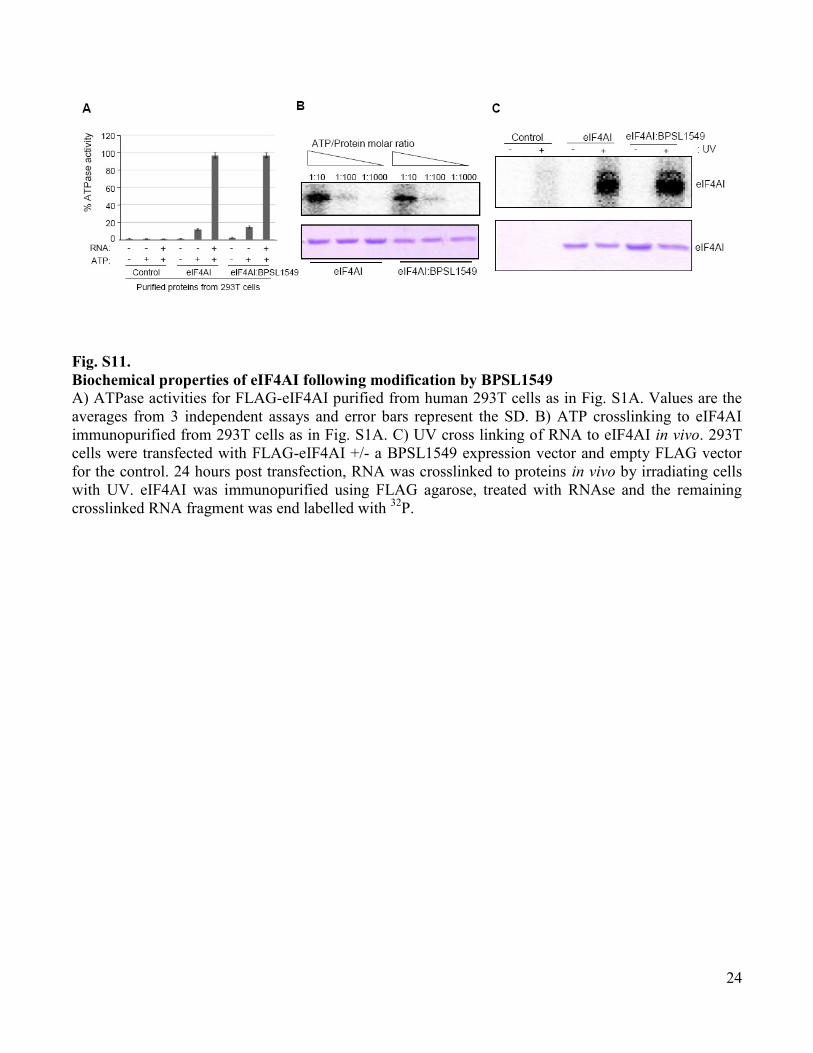
Fig. S11.
Biochemical properties of eIF4AI following modification by BPSL1549
A) ATPase activities for FLAG-eIF4AI purified from human 293T cells as in Fig. S1A. Values are the
averages from 3 independent assays and error bars represent the SD. B) ATP crosslinking to eIF4AI
immunopurified from 293T cells as in Fig. S1A. C) UV cross linking of RNA to eIF4AI in vivo. 293T
cells were transfected with FLAG-eIF4AI +/- a BPSL1549 expression vector and empty FLAG vector
for the control. 24 hours post transfection, RNA was crosslinked to proteins in vivo by irradiating cells
with UV. eIF4AI was immunopurified using FLAG agarose, treated with RNAse and the remaining
crosslinked RNA fragment was end labelled with 32
P.
25
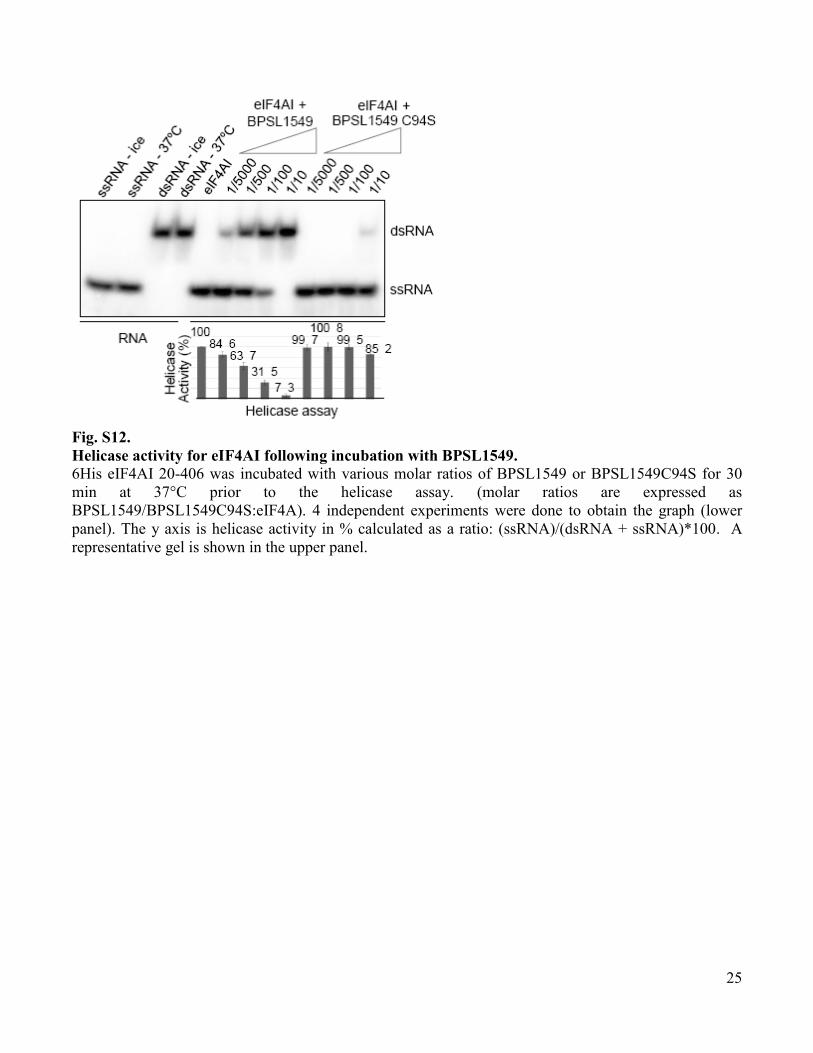
Fig. S12.
Helicase activity for eIF4AI following incubation with BPSL1549.
6His eIF4AI 20-406 was incubated with various molar ratios of BPSL1549 or BPSL1549C94S for 30
min at 37°C prior to the helicase assay. (molar ratios are expressed as
BPSL1549/BPSL1549C94S:eIF4A). 4 independent experiments were done to obtain the graph (lower
panel). The y axis is helicase activity in % calculated as a ratio: (ssRNA)/(dsRNA + ssRNA)*100. A
representative gel is shown in the upper panel.
26
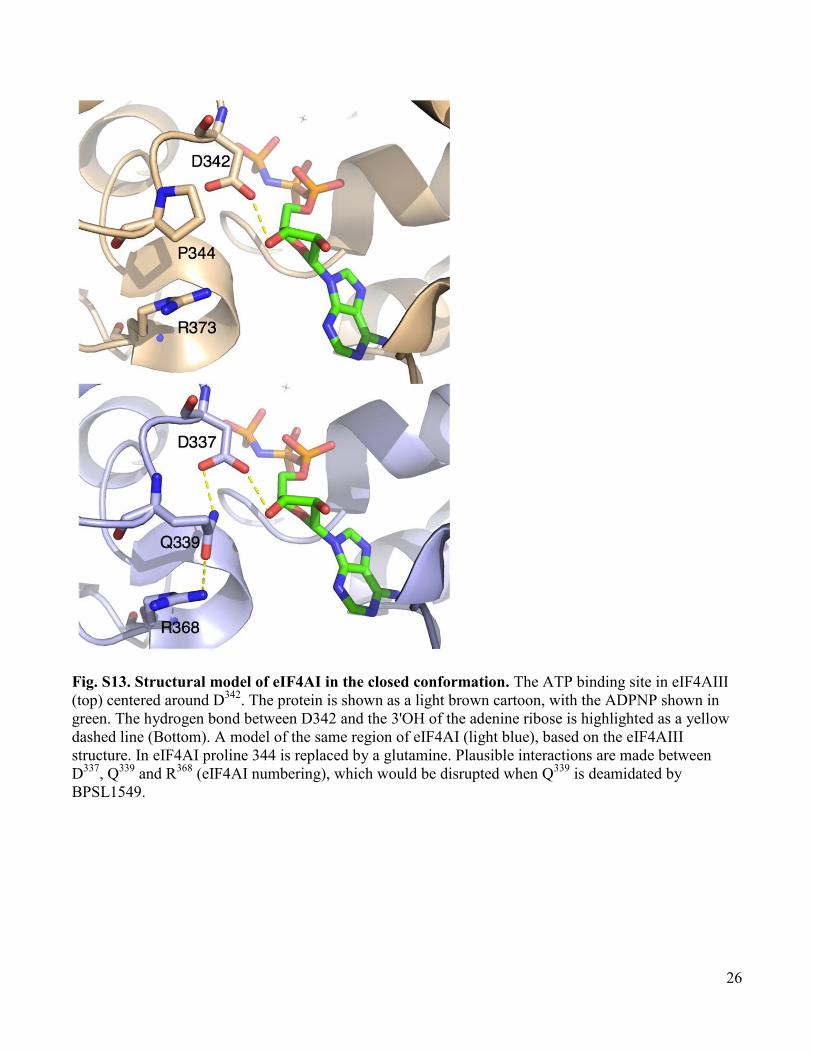
Fig. S13. Structural model of eIF4AI in the closed conformation. The ATP binding site in eIF4AIII
(top) centered around D342
. The protein is shown as a light brown cartoon, with the ADPNP shown in
green. The hydrogen bond between D342 and the 3'OH of the adenine ribose is highlighted as a yellow
dashed line (Bottom). A model of the same region of eIF4AI (light blue), based on the eIF4AIII
structure. In eIF4AI proline 344 is replaced by a glutamine. Plausible interactions are made between
D337
, Q339
and R368
(eIF4AI numbering), which would be disrupted when Q339
is deamidated by
BPSL1549.
27
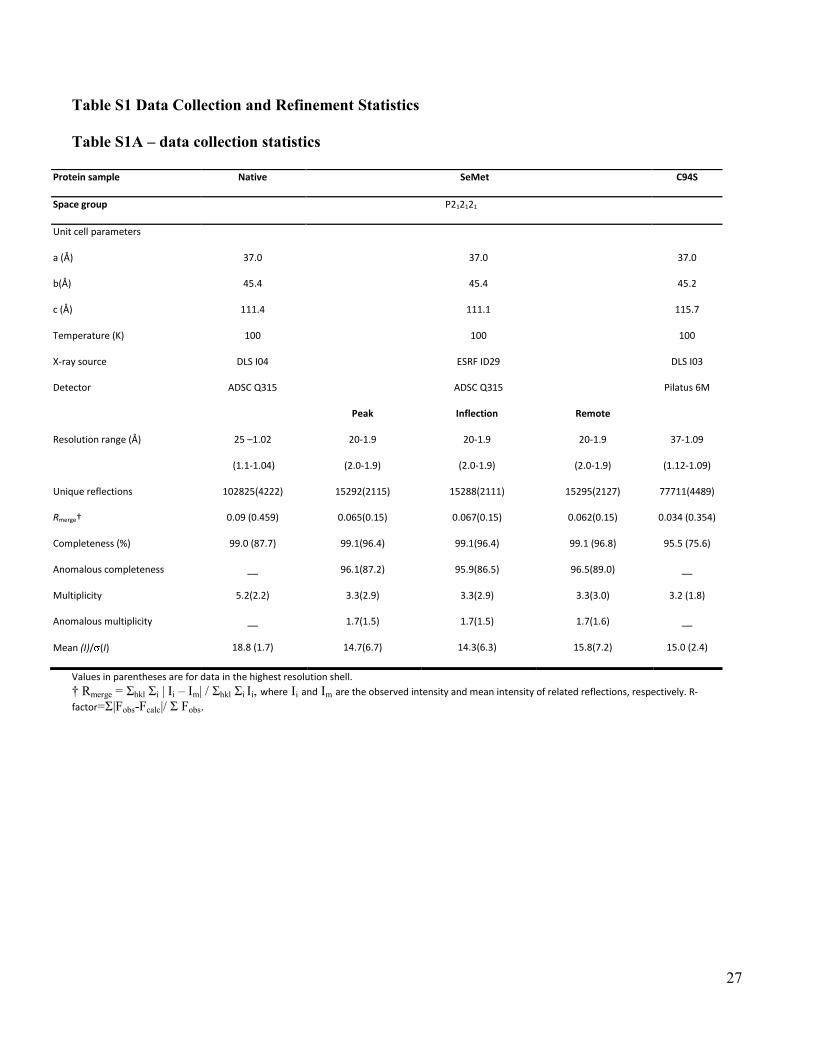
Table S1 Data Collection and Refinement Statistics
Table S1A – data collection statistics
Values in parentheses are for data in the highest resolution shell. † Rmerge = Σhkl Σi | Ii – Im| / Σhkl Σi Ii, where Ii and Im are the observed intensity and mean intensity of related reflections, respectively. R-
Mean (I)/ (I) 18.8 (1.7) 14.7(6.7) 14.3(6.3) 15.8(7.2) 15.0 (2.4)
28
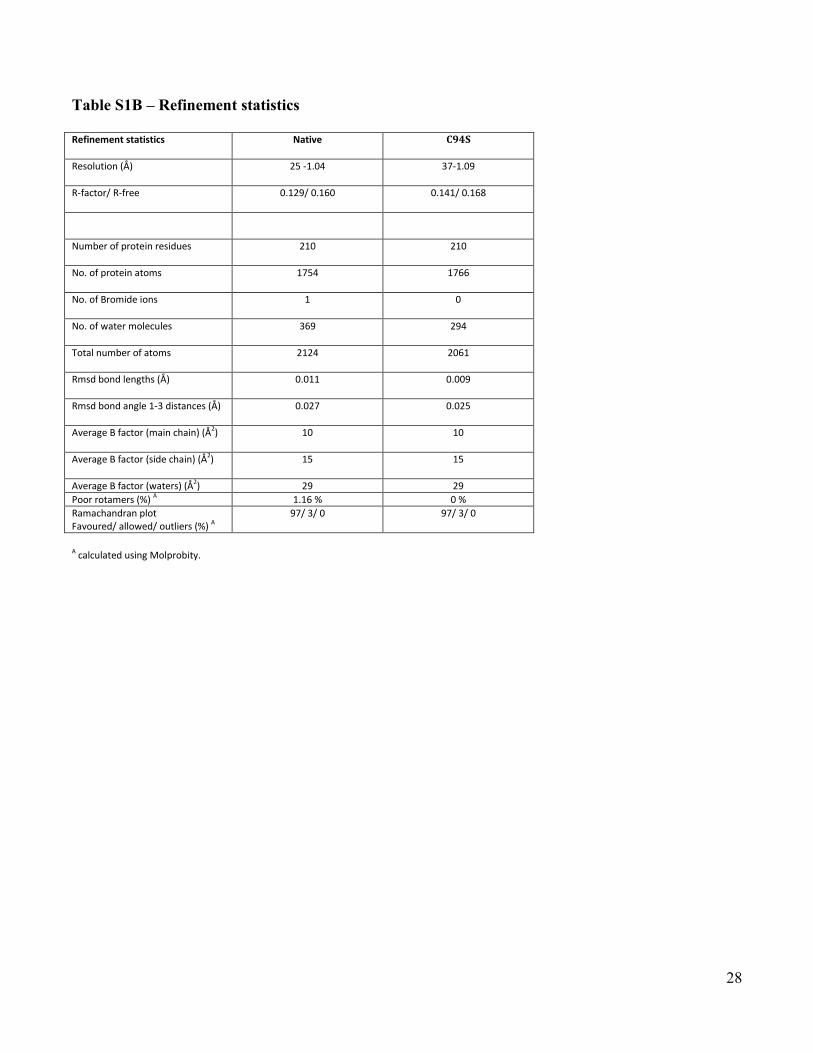
Table S1B – Refinement statistics
Refinement statistics Native C94S
Resolution (Å) 25 -1.04 37-1.09
R-factor/ R-free 0.129/ 0.160 0.141/ 0.168
Number of protein residues 210 210
No. of protein atoms 1754 1766
No. of Bromide ions 1 0
No. of water molecules 369 294
Total number of atoms 2124 2061
Rmsd bond lengths (Å) 0.011 0.009
Rmsd bond angle 1-3 distances (Å) 0.027 0.025
Average B factor (main chain) (Å2) 10 10
Average B factor (side chain) (Å2) 15 15
Average B factor (waters) (Å2) 29 29
Poor rotamers (%) A 1.16 % 0 %
Ramachandran plot Favoured/ allowed/ outliers (%) A
97/ 3/ 0 97/ 3/ 0
A calculated using Molprobity.
29
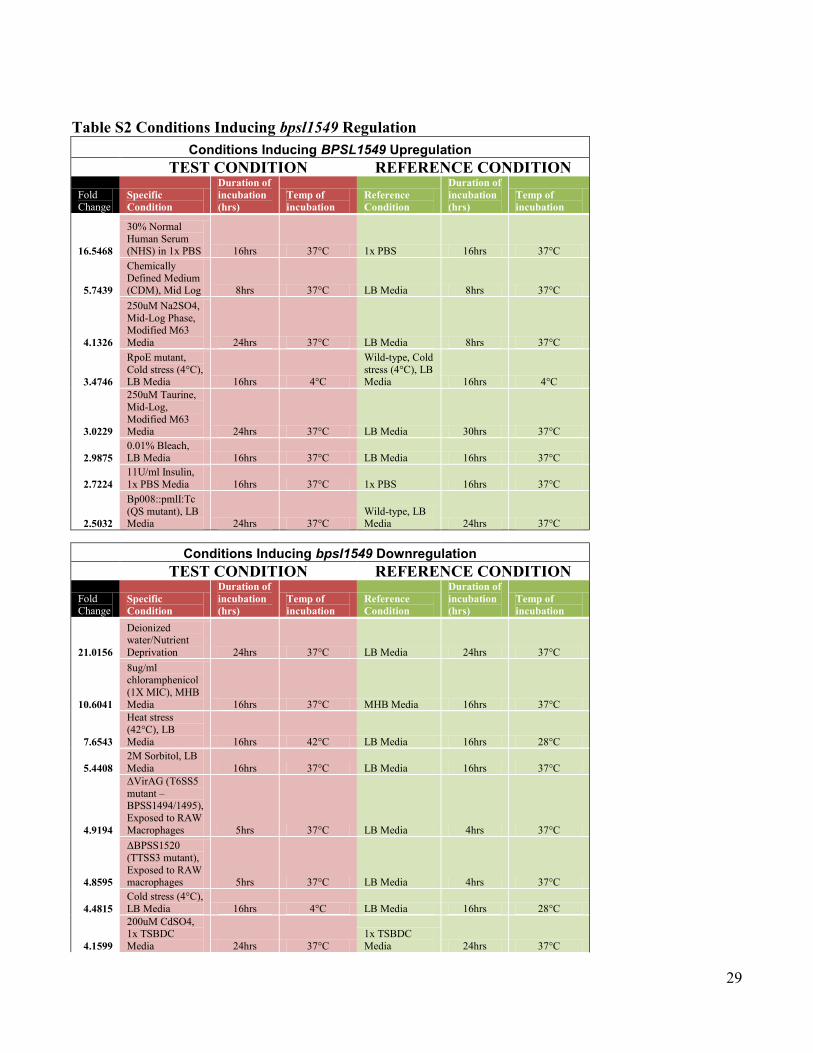
Table S2 Conditions Inducing bpsl1549 Regulation
Conditions Inducing BPSL1549 Upregulation
TEST CONDITION REFERENCE CONDITION
Fold Change
Specific
Condition
Duration of
incubation
(hrs)
Temp of
incubation
Reference
Condition
Duration of
incubation
(hrs)
Temp of
incubation
16.5468
30% Normal
Human Serum (NHS) in 1x PBS 16hrs 37°C 1x PBS 16hrs 37°C
5.7439
Chemically
Defined Medium (CDM), Mid Log 8hrs 37°C LB Media 8hrs 37°C
4.1326
250uM Na2SO4,
Mid-Log Phase,
Modified M63
Media 24hrs 37°C LB Media 8hrs 37°C
3.4746
RpoE mutant,
Cold stress (4°C), LB Media 16hrs 4°C
Wild-type, Cold
stress (4°C), LB Media 16hrs 4°C
3.0229
250uM Taurine,
Mid-Log,
Modified M63 Media 24hrs 37°C LB Media 30hrs 37°C
2.9875
0.01% Bleach,
LB Media 16hrs 37°C LB Media 16hrs 37°C
2.7224
11U/ml Insulin,
1x PBS Media 16hrs 37°C 1x PBS 16hrs 37°C
2.5032
Bp008::pmlI:Tc
(QS mutant), LB Media 24hrs 37°C
Wild-type, LB Media 24hrs 37°C
Conditions Inducing bpsl1549 Downregulation
TEST CONDITION REFERENCE CONDITION
Fold Change
Specific
Condition
Duration of
incubation
(hrs)
Temp of
incubation
Reference
Condition
Duration of
incubation
(hrs)
Temp of
incubation
21.0156
Deionized water/Nutrient
Deprivation 24hrs 37°C LB Media 24hrs 37°C
10.6041
8ug/ml chloramphenicol
(1X MIC), MHB
Media 16hrs 37°C MHB Media 16hrs 37°C
7.6543
Heat stress
(42°C), LB
Media 16hrs 42°C LB Media 16hrs 28°C
5.4408
2M Sorbitol, LB
Media 16hrs 37°C LB Media 16hrs 37°C
4.9194
ΔVirAG (T6SS5
mutant – BPSS1494/1495),
Exposed to RAW
Macrophages 5hrs 37°C LB Media 4hrs 37°C
4.8595
ΔBPSS1520
(TTSS3 mutant),
Exposed to RAW macrophages 5hrs 37°C LB Media 4hrs 37°C
4.4815
Cold stress (4°C),
LB Media 16hrs 4°C LB Media 16hrs 28°C
4.1599
200uM CdSO4, 1x TSBDC
Media 24hrs 37°C
1x TSBDC
Media 24hrs 37°C
30
3.5271
2ug/ml
ceftazidime (1X MIC), MHB
Media 16hrs 37°C MHB Media 16hrs 37°C
2.5799
ΔBPSS1553 (TTSS3 mutant),
LB Media 3hrs 37°C LB Media 3hrs 37°C
31
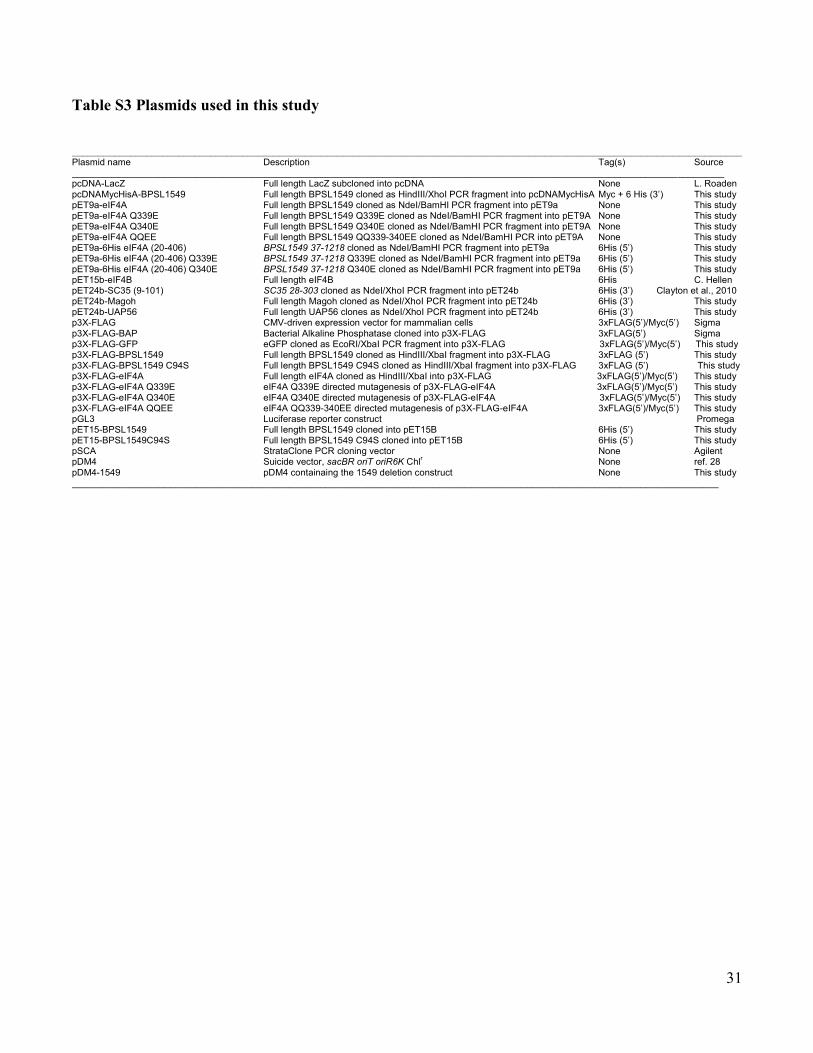
Table S3 Plasmids used in this study
______________________________________________________________________________________________________________________________ Plasmid name Description Tag(s) Source ______________________________________________________________________________________________________________________________ pcDNA-LacZ Full length LacZ subcloned into pcDNA None L. Roaden pcDNAMycHisA-BPSL1549 Full length BPSL1549 cloned as HindIII/XhoI PCR fragment into pcDNAMycHisA Myc + 6 His (3’) This study pET9a-eIF4A Full length BPSL1549 cloned as NdeI/BamHI PCR fragment into pET9a None This study pET9a-eIF4A Q339E Full length BPSL1549 Q339E cloned as NdeI/BamHI PCR fragment into pET9A None This study pET9a-eIF4A Q340E Full length BPSL1549 Q340E cloned as NdeI/BamHI PCR fragment into pET9A None This study pET9a-eIF4A QQEE Full length BPSL1549 QQ339-340EE cloned as NdeI/BamHI PCR into pET9A None This study pET9a-6His eIF4A (20-406) BPSL1549 37-1218 cloned as NdeI/BamHI PCR fragment into pET9a 6His (5’) This study pET9a-6His eIF4A (20-406) Q339E BPSL1549 37-1218 Q339E cloned as NdeI/BamHI PCR fragment into pET9a 6His (5’) This study pET9a-6His eIF4A (20-406) Q340E BPSL1549 37-1218 Q340E cloned as NdeI/BamHI PCR fragment into pET9a 6His (5’) This study pET15b-eIF4B Full length eIF4B 6His C. Hellen pET24b-SC35 (9-101) SC35 28-303 cloned as NdeI/XhoI PCR fragment into pET24b 6His (3’) Clayton et al., 2010 pET24b-Magoh Full length Magoh cloned as NdeI/XhoI PCR fragment into pET24b 6His (3’) This study pET24b-UAP56 Full length UAP56 clones as NdeI/XhoI PCR fragment into pET24b 6His (3’) This study p3X-FLAG CMV-driven expression vector for mammalian cells 3xFLAG(5’)/Myc(5’) Sigma p3X-FLAG-BAP Bacterial Alkaline Phosphatase cloned into p3X-FLAG 3xFLAG(5’) Sigma p3X-FLAG-GFP eGFP cloned as EcoRI/XbaI PCR fragment into p3X-FLAG 3xFLAG(5’)/Myc(5’) This study p3X-FLAG-BPSL1549 Full length BPSL1549 cloned as HindIII/XbaI fragment into p3X-FLAG 3xFLAG (5’) This study p3X-FLAG-BPSL1549 C94S Full length BPSL1549 C94S cloned as HindIII/XbaI fragment into p3X-FLAG 3xFLAG (5’) This study p3X-FLAG-eIF4A Full length eIF4A cloned as HindIII/XbaI into p3X-FLAG 3xFLAG(5’)/Myc(5’) This study p3X-FLAG-eIF4A Q339E eIF4A Q339E directed mutagenesis of p3X-FLAG-eIF4A 3xFLAG(5’)/Myc(5’) This study p3X-FLAG-eIF4A Q340E eIF4A Q340E directed mutagenesis of p3X-FLAG-eIF4A 3xFLAG(5’)/Myc(5’) This study p3X-FLAG-eIF4A QQEE eIF4A QQ339-340EE directed mutagenesis of p3X-FLAG-eIF4A 3xFLAG(5’)/Myc(5’) This study pGL3 Luciferase reporter construct Promega pET15-BPSL1549 Full length BPSL1549 cloned into pET15B 6His (5’) This study pET15-BPSL1549C94S Full length BPSL1549 C94S cloned into pET15B 6His (5’) This study pSCA StrataClone PCR cloning vector None Agilent pDM4 Suicide vector, sacBR oriT oriR6K Chl
r None ref. 28
pDM4-1549 pDM4 containaing the 1549 deletion construct None This study _____________________________________________________________________________________________________________________________
References 1. W. J. Wiersinga, T. van der Poll, N. J. White, N. P. Day, S. J. Peacock, Melioidosis: Insights
into the pathogenicity of Burkholderia pseudomallei. Nat. Rev. Microbiol. 4, 272 (2006). doi:10.1038/nrmicro1385 Medline
2. V. Ngauy, Y. Lemeshev, L. Sadkowski, G. Crawford, Cutaneous melioidosis in a man who was taken as a prisoner of war by the Japanese during World War II. J. Clin. Microbiol. 43, 970 (2005). doi:10.1128/JCM.43.2.970-972.2005 Medline
3. R. Stone, Racing to defuse a bacterial time bomb. Science 317, 1022 (2007). doi:10.1126/science.317.5841.1022 Medline
4. L. Buetow, G. Flatau, K. Chiu, P. Boquet, P. Ghosh, Structure of the Rho-activating domain of Escherichia coli cytotoxic necrotizing factor 1. Nat. Struct. Biol. 8, 584 (2001). doi:10.1038/89610 Medline
5. G. Flatau et al., Toxin-induced activation of the G protein p21 Rho by deamidation of glutamine. Nature 387, 729 (1997). doi:10.1038/42743 Medline
6. K. A. Spriggs et al., Canonical initiation factor requirements of the Myc family of internal ribosome entry segments. Mol. Cell. Biol. 29, 1565 (2009). doi:10.1128/MCB.01283-08 Medline
7. W. K. Low et al., Inhibition of eukaryotic translation initiation by the marine natural product pateamine A. Mol. Cell 20, 709 (2005). doi:10.1016/j.molcel.2005.10.008 Medline
8. S. Mokas et al., Uncoupling stress granule assembly and translation initiation inhibition. Mol. Biol. Cell 20, 2673 (2009). doi:10.1091/mbc.E08-10-1061 Medline
9. J. M. Caruthers, E. R. Johnson, D. B. McKay, Crystal structure of yeast initiation factor 4A, a DEAD-box RNA helicase. Proc. Natl. Acad. Sci. U.S.A. 97, 13080 (2000). doi:10.1073/pnas.97.24.13080 Medline
10. Y. Endo, K. Tsurugi, The RNA N-glycosidase activity of ricin A-chain. The characteristics of the enzymatic activity of ricin A-chain with ribosomes and with rRNA. J. Biol. Chem. 263, 8735 (1988). Medline
11. A. Pause, N. Méthot, Y. Svitkin, W. C. Merrick, N. Sonenberg, Dominant negative mutants of mammalian translation initiation factor eIF-4A define a critical role for eIF-4F in cap-dependent and cap-independent initiation of translation. EMBO J. 13, 1205 (1994). Medline
12. C. B. F. Andersen et al., Structure of the exon junction core complex with a trapped DEAD-box ATPase bound to RNA. Science 313, 1968 (2006); 10.1126/science.1131981. doi:10.1126/science.1131981 Medline
13. T. Sengoku, O. Nureki, A. Nakamura, S. Kobayashi, S. Yokoyama, Structural basis for RNA unwinding by the DEAD-box protein Drosophila Vasa. Cell 125, 287 (2006). doi:10.1016/j.cell.2006.01.054 Medline
14. A. Marintchev et al., Topology and regulation of the human eIF4A/4G/4H helicase complex in translation initiation. Cell 136, 447 (2009). doi:10.1016/j.cell.2009.01.014 Medline
15. J. Cui et al., Glutamine deamidation and dysfunction of ubiquitin/NEDD8 induced by a bacterial effector family. Science 329, 1215 (2010); 10.1126/science.1193844. doi:10.1126/science.1193844 Medline
16. J. H. Orth et al., Pasteurella multocida toxin activation of heterotrimeric G proteins by deamidation. Proc. Natl. Acad. Sci. U.S.A. 106, 7179 (2009). Medline
17. K. Mack, R. W. Titball, The detection of insertion sequences within the human pathogen Burkholderia pseudomallei which have been identified previously in Burkholderia cepacia. FEMS Microbiol. Lett. 162, 69 (1998). doi:10.1111/j.1574-6968.1998.tb12980.x Medline
18. S. V. Harding et al., The identification of surface proteins of Burkholderia pseudomallei. Vaccine 25, 2664 (2007). doi:10.1016/j.vaccine.2006.12.006 Medline
19. J. L. Gardy et al., PSORTb v.2.0: Expanded prediction of bacterial protein subcellular localization and insights gained from comparative proteome analysis. Bioinformatics 21, 617 (2005). doi:10.1093/bioinformatics/bti057 Medline
20. J. D. Bendtsen, H. Nielsen, G. von Heijne, S. Brunak, Improved prediction of signal peptides: SignalP 3.0. J. Mol. Biol. 340, 783 (2004). doi:10.1016/j.jmb.2004.05.028 Medline
21. G. M. Sheldrick, Experimental phasing with SHELXC/D/E: Combining chain tracing with density modification. Acta Crystallogr. D 66, 479 (2010). doi:10.1107/S0907444909038360 Medline
22. G. M. Sheldrick, A short history of SHELX. Acta Crystallogr. A 64, 112 (2008). doi:10.1107/S0108767307043930 Medline
23. H. M. Grindley, P. J. Artymiuk, D. W. Rice, P. Willett, Identification of tertiary structure resemblance in proteins using a maximal common subgraph isomorphism algorithm. J. Mol. Biol. 229, 707 (1993). doi:10.1006/jmbi.1993.1074 Medline
24. L. Holm, S. Kääriäinen, P. Rosenström, A. Schenkel, Searching protein structure databases with DaliLite v.3. Bioinformatics 24, 2780 (2008). doi:10.1093/bioinformatics/btn507 Medline
25. H. M. Berman et al., The Protein Data Bank. Nucleic Acids Res. 28, 235 (2000). doi:10.1093/nar/28.1.235 Medline
26. V. B. Chen et al., MolProbity: All-atom structure validation for macromolecular crystallography. Acta Crystallogr. D 66, 12 (2010). doi:10.1107/S0907444909042073 Medline
27. P. Skehan et al., New colorimetric cytotoxicity assay for anticancer-drug screening. J. Natl. Cancer Inst. 82, 1107 (1990). doi:10.1093/jnci/82.13.1107 Medline
28. D. L. Milton, R. O’Toole, P. Horstedt, H. Wolf-Watz, Flagellin A is essential for the virulence of Vibrio anguillarum. J. Bacteriol. 178, 1310 (1996). Medline
29. M. Sarkar-Tyson et al., Polysaccharides and virulence of Burkholderia pseudomallei. J. Med. Microbiol. 56, 1005 (2007). doi:10.1099/jmm.0.47043-0 Medline
30. C. A. Logue, I. R. Peak, I. R. Beacham, Facile construction of unmarked deletion mutants in Burkholderia pseudomallei using sacB counter-selection in sucrose-resistant and sucrose-sensitive isolates. J. Microbiol. Methods 76, 320 (2009). doi:10.1016/j.mimet.2008.12.007 Medline
31. L. J. Reed, H. Muench, A simple method of estimating fifty percent endpoints. Am. J. Hyg. 27, 493 (1938).
32. T. Nandi et al., A genomic survey of positive selection in Burkholderia pseudomallei provides insights into the evolution of accidental virulence. PLoS Pathog. 6, e1000845 (2010). doi:10.1371/journal.ppat.1000845 Medline
33. C. Ong et al., Patterns of large-scale genomic variation in virulent and avirulent Burkholderia species. Genome Res. 14, 2295 (2004). doi:10.1101/gr.1608904 Medline
34. J. H. Chang et al., Crystal structure of the eIF4A-PDCD4 complex. Proc. Natl. Acad. Sci. U.S.A. 106, 3148 (2009). doi:10.1073/pnas.0808275106 Medline
35. H. Shi, O. Cordin, C. M. Minder, P. Linder, R. M. Xu, Crystal structure of the human ATP-dependent splicing and export factor UAP56. Proc. Natl. Acad. Sci. U.S.A. 101, 17628 (2004). doi:10.1073/pnas.0408172101 Medline
36. K. M. Chan, D. Delfert, K. D. Junger, A direct colorimetric assay for Ca2+-stimulated ATPase activity. Anal. Biochem. 157, 375 (1986). doi:10.1016/0003-2697(86)90640-8 Medline
37. M. P. Stevens et al., Attenuated virulence and protective efficacy of a Burkholderia pseudomallei bsa type III secretion mutant in murine models of melioidosis. Microbiology 150, 2669 (2004). doi:10.1099/mic.0.27146-0 Medline
38. G. Shalom, J. G. Shaw, M. S. Thomas, In vivo expression technology identifies a type VI secretion system locus in Burkholderia pseudomallei that is induced upon invasion of macrophages. Microbiology 153, 2689 (2007). doi:10.1099/mic.0.2007/006585-0 Medline