97
Pradhan Mantri Krishi Sinchayee Yojana (PMKSY) District Irrigation Plan (2016-2020) SURENDRANAGAR, GUJARAT SURENDRANAGAR

Pradhan Mantri Krishi Sinchayee Yojana (PMKSY)
District Irrigation Plan (2016-2020)SURENDRANAGAR, GUJARAT
SURENDRANAGAR

Pradhan Mantri Krishi Sinchayee Yojana (PMKSY)
District Irrigation Plan (2016-2020)SURENDRANAGAR, GUJARAT
SURENDRANAGAR

0 | P a g e
CONTENTS
EXECUTIVE SUMMARY ...................................................................................................................... 3
INTRODUCTION.................................................................................................................................... 7
Background ............................................................................................................................................. 7
Vision ..................................................................................................................................................... 12
Objective ................................................................................................................................................ 12
Strategy/approach................................................................................................................................ 13
Programme Components .................................................................................................................... 13
Rationale/ Justification ....................................................................................................................... 15
Methodology ......................................................................................................................................... 16
Chapter 1. General Information of the District ................................................................. 18
1.1 District Profile ................................................................................................................................. 18
1.2 Demography .................................................................................................................................... 20
1.3 Biomass and Livestock .................................................................................................................. 22
1.4 Agro-Ecology, Climate, Hydrology and Topography ................................................................ 23
1.5 Soil Profile ....................................................................................................................................... 24
1.6 Land Use Pattern ............................................................................................................................ 25
Chapter 2. District Water Profile ............................................................................................ 29
2.1 Irrigation Based Classification ..................................................................................................... 29
2.2 Area Wise, Crop Wise Irrigation Status ...................................................................................... 29
2.3 Production and Productivity of Major Crops ............................................................................. 30
Chapter 3. Water Availability ................................................................................................... 33
3.1 Status of Water Availability .......................................................................................................... 33
3.2 Status of Ground Water Availability ........................................................................................... 34
3.3 Status of Command Area .............................................................................................................. 38
3.4 Various Sources of Irrigation ....................................................................................................... 39
Chapter 4. Water Requirement /Demand ........................................................................... 41
4.1 Domestic Water Demand .............................................................................................................. 41
4.2 Crop water Requirement .............................................................................................................. 42
4.3 Livestock ......................................................................................................................................... 42
4.4 Industrial Water Requirement .................................................................................................... 43
4.5 Water Demand for Power Generation ........................................................................................ 43
1 | P a g e
4.6 Water demand ................................................................................................................................ 43
4.7 Water Budget .................................................................................................................................. 45
Chapter 5. Strategic Action Plan for Irrigation in District under PMKSY ............. 46
5.1 Year wise total Plan of the district: .............................................................................................. 46
5.2 Department wise plan ................................................................................................................... 48
5.3 Component wise plan .................................................................................................................... 48
5.4 Block wise Plan ............................................................................................................................... 49
5.5 Monitoring and Evaluation .......................................................................................................... 50
5.6 Expected Output and Outcome: .................................................................................................. 51
5.7 Suggestions ..................................................................................................................................... 52
Annexure ................................................................................................................................................ 55

2 | P a g e
LIST OF TABLES
Table 1.1: District Profile ........................................................................................................................ 18
Table 1.2: Administrative set-up of Surendra Nagar ........................................................................... 18
Table 1.3: Distribution of male, female and children population in blocks of Surendra Nagar .... 20
Table 1.4: Category wise population in blocks of Surendra Nagar ................................................ 21
Table 1.5: Population of small animals in the blocks of Surendra Nagar ......................................... 22
Table 1.6: Population of large animals in the blocks of Surendra Nagar ...................................... 22
Table 3.1: Status of water availability in Surendra Nagar(MCM) ................................................. 33
Table 3.2: Status of block as per central ground water board notification ...................................... 36
Table 3.3: Block-wise percentage distributions of water samples into different EC ...................... 36
Table 3.4: Status of Command Area (Area in Ha)............................................................................ 39
Table 3.5: Existing type of irrigation – Ground water irrigation ....................................................... 40
Table 4.1: Domestic Water Demand (MCM) ....................................................................................... 41
Table 4.2: Crop Water Requirement in Million Cubic Meter ........................................................... 42
Table 5.1: Summary of PMKSY plan District Surendra Nagar, Gujarat. (in Rs. Lakh) ............. 46
LIST OF FIGURES & Maps
Figure 1.1: Block wise male and female population of Surendra Nagar District ......................... 20
Figure 1.2: Block wise percentage of SC, ST & General population in Surendra NagarDistrict .... 21
Figure 1.3: block wise population of small and large animals in Surendra Nagar ..................... 23
Figure 1.4: TGA, GCA and Cropping Intensities of the blocks ..................................................................... 27
Figure 5.1: Block wise share in PMKSY Plan of Surendra Nagar District ........................................ 50
Map 1 Administrative Map of Surendranagar ............................................................................................ 19
Map 2 Soil use map ..................................................................................................................................... 24
Map 3 Land use map ................................................................................................................................... 26
Map 4 River & Water bodies map of Surendra Nagar District .................................................................... 35
Map 4 Canal map of Surendra Nagar District ............................................................................................. 37
Map 6 Watershed map of Surendra Nagar District .................................................................................... 38

3 | P a g e
EXECUTIVE SUMMARY
In an agrarian economy like India, agriculture utilizes the major share of country‟s
exploitable water resources. Though the sector utilizes the maximum share of
exploitable water resources, availability of the same at different locations to different
extent makes it vital to adopt effective utilization of water through storage, channelizing
and judicial use. At some places like Punjab and Haryana, the environmental and socio-
economic rationale for this capture by the sector is now being questioned. Accordingly,
it is needed to challenge and change the fundamentals of the prevailing view of water
resources exploitation. A new and more suitable approach to water resources allocation
is necessary if the population is to be adequately fed, without further degradation and
destruction of the critical ecosystem services. Water productivity needs to be enhanced
considerably, and economic cost-benefit analysis and pricing regimes can play a
significant role in such a process. However, these economic measures will not be
sufficient on their own. They will need to be reinforced by technological innovation and
institutional changes in order to encourage a more equitable distribution of resources
and to mitigate potential international conflicts across 'shared' water basins.
Water has unique characteristics that determine both its allocation and use as a resource
by agriculture. Agricultural use of water for irrigation is itself contingent on land
resources. In a situation of growing water scarcity and rising demands for non-
agricultural (household and industrial) use of water, reassessment of sectoral allocations
of water are inevitable. In developing countries, irrigated agriculture plays a vital role in
contributing towards domestic food security and poverty alleviation. Therefore,
achievement of these objectives is dependent on adequate allocations of water to
agriculture. Justification of such allocations requires that irrigated agriculture be a cost-
effective means of achieving stated political or social objectives, such as food security or
poverty alleviation, and that all externalities be taken into account in the pricing
mechanism. Improved allocation of irrigation water is required within the agriculture
sectors in order to achieve greater efficiency in the use of irrigation water and existing
irrigation infrastructure. Reallocation is also required in order to reduce waterlogging
and salinization of irrigated land, to decrease the negative environmental impacts and
other externalities of irrigation (caused by over extraction of groundwater and depletion
and pollution of surface water).
Government of India launched Pradhan Mantri Krishi Sinchayee Yojana (PMKSY) to
address the constraints in providing assured irrigation as well as increasing efficiency
and productivity of current water use to bring more prosperity to the rural areas.
Priorities of Government of India were reflected in the Hon‟ble President‟s address to
the joint Session of the Parliament of 16th Lok Sabha where he indicated that “Each
drop of water is precious. Government is committed to giving high priority to water
security. It will complete the long pending irrigation projects on priority and launch the
„Pradhan Mantri Krishi Sinchayee Yojana‟ with the motto of „Har Khet Ko Pani‟. There is
4 | P a g e
a need for seriously considering all options including linking of rivers, where feasible;
for ensuring optimal use of our water resources to prevent the recurrence of floods and
drought. By harnessing rain water through „Jal Sanchay‟ and „Jal Sinchan‟, we will
nurture water conservation and ground water recharge. Micro irrigation will be
popularised to ensure „Per drop-More crop”.
PMKSY has been approved with an indicative outlay of Rs.50,000 crore over a period of
five years from 2015-16 to 2019-20. The programme is an amalgamation of on-going
schemes of Ministry of Water Resources, River Development and Ganga Rejuvenation,
Ministry of Agriculture & Cooperation and Ministry of Rural Development. The existing
schemes AIBP, CADWM, MI, SWMA, Watershed& Convergence with MGNREGA were
brought together under the umbrella program of PMKSY. Further the scheme seeks
convergence with scheme like Mahatma Gandhi National Rural Employment Guarantee
Scheme (MGNRES), Rashtriya Krishi Vikas Yojana (RKVY), Jawaharlal Nehru National
Solar Mission and Rural Electrification programmes (JLNNSM&REP), Rural
Infrastructure Development Fund (RIDF), Members of Parliament Local Area
Development Scheme (MPLAD), Members of Legislative Assembly Local Area
Development Fund (MLALAD), Local Body Funds (LBF), Working Plan of State Forest
Department (WPSFD) etc. The PMKSY will be implemented in an area development
mode only by adopting a decentralized state level planning and projectised execution
structure that will allow the state to draw up their own irrigation development plans
based on DIPs and SIPs with a horizon of 5-7 years. The program will be supervised and
coordinated utilizing the existing mechanism and structure available under Rashtriya
Krishi Vikas Yojana (RKVY) program with state agriculture department acting as the
State Nodal Agency for implementation of PMKSY. However, the implementing
departments for the four components like AIBP, PMKSY (Har Khet Ko Pani), PMKSY
(Per drop more crop) and PMKSY (watershed development) will be decided by the
respective program ministry/department.
During the course of preparation of District Irrigation Plan (DIP) the team visited
Surendra Nagar district to collect data and have interaction with all the stakeholders.
Methodology adopted to prepare DIP included collection of primary and secondary data
from field from various sources including published documents and websites. Various
meetings were held to obtain ground level realities and data from key
personnel/stakeholders through structured, unstructured interviews, focused group
discussions etc. Meetings with various State Government departments and related
institutions were held. GIS maps of the area‟s/clusters were studied to understand the
land morphology, topography of the district. Team members also participated in the
State Level workshop and held active discussions with GoI officers, State Level officers
and scientists of various institutions. In the district at Panchayat level schemes were
identified as per the need and potential and resolutions were passed by the Panchayat to
include the schemes in PMKSY. On the basis of detailed discussion and analysis of data,
5 | P a g e
the team arrived at the projections of various components of PMKSY and Department
wise plan for four years from 2016-17 to 2019-20 as detailed in the plan.
Brief about the district: Surendra Nagar district has 10 Developmental
Blocks/Talukas, 537 Gram Panchayats and 571 inhabited villages. The economy of
Surendra Nagar district mainly depends on agriculture and cotton industry in particular
and the district is largest producer of cotton and also has the first cotton trading
exchange of India. Surendra Nagar falls in North Saurashtra agro climatic zone which
represents the subtropical conditions with semi-arid climate. The zone receives average
annual rainfall of 537 mm.
The total geographical area (TGA) of Surendra Nagar is 10.46 Lakh hectares (as per
2010-11). The largest block of the district is Dasada which comprises TGA of 164,600
hectare i.e. about 15.74% of the TGA of the district. Dasada is followed by Dhagandhraa
with TGA of 136,900 ha. The Gross Cropped Area of the district is 6.49 Lakh hectares
out of which 107,090 hectare i.e. 17.8% of the area falls in Dasada Block, followed by
Dhragandara block having 14.84% of the district.
Demographic details: The population density of Surendra Nagar district as recorded
by 2011 census is 168 people per sq. km. which is 4th lowest in the state. However there
is 16.67% increase in density from 144 people per sq. km as per census 2001 data. Thus
a constant rise in population can be seen in the district. The growth rate has been
accordingly factored in while calculating the water requirement. Looking at the different
water requirement in rural and urban areas the same has also been considered.
Accordingly considering the growth rate of population of the district, the quantity of
water required in 2020 for domestic consumption shall be approximately 57.28 MCM
which is 4.309MCM more than the present water requirement.
Livestock: Further the livestock population has been factored. The current livestock
population in the district is 1,099,909 of which 206,549 are poultry and small
ruminants while 893,360 are large ruminants. Based on the projected water
requirement for livestock in 2020, the gap has been assessed. The total potential which
has to be created for livestock in 2020 is 2.60 MCM.
Agriculture: The cropping intensity of the district is 104.2 which is quite low. Among
the blocks Chotila has maximum cropping intensity of 110.8 followed by Dhagandhraa
block where it is 109.1. Dasada block has the lowest cropping intensity of 100 only. This
is due to low irrigation potential in these districts. Since, the most important water
consumption sector is agriculture. Accordingly based on the individual crop
requirements and area under various crops the water requirement has been assessed for
crops.

6 | P a g e
As per the data provided out of the total Kharif sown area, 45.56% is rainfed area while
54.45% is irrigated while in case of Rabi sown area 76.1% is irrigated and 23.9% is
rainfed. Among horticultural crops 90% area under fruits and 100 percent areas under
vegetable, spices and flowers have been considered as irrigated.
Water budget: The present crop water potential of the district has been assessed at
1717.51 MCM annually, while total crop water requirement of the district has been
assessed at 2909.04 MCM. Whereas, a total of 1953.75 MCM of surface irrigation and 520.60
MCM of groundwater is available currently. Based on the above data the water budgeting has
been done. In the district of Surendra nagar the current water demand is higher than the
current availability of water, the total water gap for the district has been estimated at
503.4 for the current period and 510.58 MCM during 2020, i.e. the supply of water is in-
sufficient to meet the demand of the district. It was also observed that only some blocks
are having sufficient supply of water while 6 out of 10 blocks are having water scarcity.
In order to address this gap to a certain extent the DIP of the district has been prepared
with a total budget of INR 235092Lakh. The DIP has taken care that all the important
departments are included in the plan and shall be contributing to successful
implementation over the period of next four years. The command area that is likely to be
benefitted under the current plan is 4,70,000 ha.
The DIP includes 05 chapters along with introduction chapter that explain the profile of
district, its water requirement for agriculture and allied sector, water availability,
assessment of water requirement for various sectors and strategic action plan for
augmentation and effective management of available water resources.
Limitation: During the year 2013 Halvad block was excluded from district while
retaining some portion and new block Thangadh was formed. However no separate data
is available for the block regarding area, cropping pattern etc. Thus the same could not
be included in calculation.

7 | P a g e
INTRODUCTION
Background
Preparation of decentralized area specific district planning process visualized in various
plans took concrete shape through the years and initiatives like specific guidelines on
methodologies and processes for preparation of district plans; framework for
preparation of perspective plan, medium term and annual plans by then planning
commission in 1969 and the 73rd and 74th constitutional amendments conferring
constitutional status to Panchayats at district and sub district level; local self-
government in urban areas; constitution of district planning committee to consolidate
the plans prepared at Panchayats and municipalities and prepare a draft development
plan for the whole district.
The decentralized planning process was further strengthened through emphasis by
planning commission on preparation of district level plans and making it an integral
part of the process of preparation of the states 11th five year plan. The Planning
commission issued guidelines in August 2006 for preparation of the district plans. The
guidelines define the District Planning as „the process of preparing an integrated plan
for the local government sector in a district taking into account the resources (natural,
human and financial) available and covering the sectoral activities and schemes
assigned to the district level and below and those implemented through local
governments in a state. The document that embodies this statement of resources and
their allocation for various purposes is known as the District Plan”.
Government of India through a resolution in National Development Council on 29th May
2007 conceived a special Additional Central Assistance Scheme (ACAS) to address the
slow growth of agriculture and allied sectors by incentivizing states to draw up plans for
their agriculture sectors more comprehensively. The NDC resolution states "GoI
introduced a new Additional Central Assistance Scheme to incentivize states to draw up
plans for their agriculture sector more comprehensively, taking agro-climatic
conditions, natural resource issues and technology into account, and integrating
livestock, poultry and fisheries, etc. This involved a new scheme for Additional Central
Assistance (ACA) to State Plans, administered by the Union Ministry of Agriculture over
and above its existing Centrally Sponsored Schemes, to supplement the State-specific
strategies including special schemes for beneficiaries of land reforms. The newly created
National Rainfed Area Authority on request, was to assist States in planning for rainfed
areas".
The NDC in its resolution advised the states to prepare a comprehensive district
agriculture plans (C-DAP) that will fully utilize available resources and include allied
agriculture sectors. Further, GOI issued a manual on preparation of comprehensive

8 | P a g e
district agriculture plans to help the states prepare C-DAP. As per these guidelines, the
objective of district planning is „to design an integrated and participatory action plan for
the development of local area in general and agriculture and allied sectors in particular‟.
The objectives of Comprehensive District Agriculture Plan (C-DAP) were:
To prepare a Comprehensive District Agriculture Plan (C-DAP) through
participatory process involving various organisations and stakeholders.
To enable optimum utilisation of scarce natural, physical & financial resources.
To assess and plan for the infrastructure required to support the agriculture
development.
To establish linkages with the required institutional support services, like
credit, technology transfer, ICT, research etc.
To evolve an action plan for achieving sustainable agricultural growth with food
security and cropping system that will improve farmers‟ income.
The guidelines required the state/district authorities to (i) ensure that the agricultural
plans are prepared for the district and then integrated into the agricultural plans of the
State based on the agro-climatic conditions, availability of technology, trained
manpower and natural resources; (ii) local needs / crops / feed and fodder / animal
husbandry / dairying / fisheries / priorities are reflected in the plan; (iii) productivity
gaps for important crops and livestock and fisheries are reduced; and (iv) the returns to
the farmers from these are maximized.
The latest move in the process of strengthening of decentralized planning process was
the Government of India guidelines issued in 2015 in the form of a template for the
preparation of District Irrigation Plan (DIP) and State Irrigation Plan (SIP) as part of
the Pradhan Mantri Krishi Sinchayee Yojana (PMKSY) program and made the
preparation of DIP and SIP mandatory for the states to receive funds from the program.
The present report is a product of these long drawn efforts of Government of India to
strengthen the decentralized planning process in the country focusing on the vital
resource i.e., water.
Water is of vital importance for human & animal life, maintenance of ecological balance
and promotion of developmental activities. Considering its vital importance and ever
increasing demand for water, in the face of population growth, urbanization &
industrialization and considerations of climatic change, making water, an increasingly a
scarce resource, available to multiple uses, planning and management of this vital
resources, utilization of water economically, optimally and equitably assumes greater
importance.
According to the 12th Five year Plan the water budget estimates of India by Ministry of
Water Resources suggests an availability of 1123 billion cubic meters (BCM) against a
current estimated demand of 710 BCM. The Standing Committee of the Ministry of

9 | P a g e
Water Resources estimates that this water demand will rise to 1093 BCM by 2025.
Though the existing water availability in the immediate future seems to be adequate,
with the near constant supply of water resources in the face of increasing demand on
account of population growth, urbanisation and industrialization will strain the water
supply-demand balance.
The per capita water availability which stood at 5,177 cubic meters in 1951 was reduced
to 1820 cubic meters in 2001 while the international prescribed limit is 1800 cubic
meters. The projected per capita availability of water is 1341 cubic meters in 2025 and
1140 cubic meters in 2050 suggesting shortage of water in the medium term1. Further,
the all India water balance estimates does not reflect the variations in water balance
across time and space- certain areas having a positive water balance and the others
facing acute shortage. The problem is further accentuated by water quality related
issues.
With the abundant surface and ground water supply in the first five decades since
independence, more than 80 percent of the total available water resources were
allocated for irrigation purposes and the rest meeting the domestic and industrial
demands. In a recent study2on the demand for water from agriculture, domestic and
industrial uses in 2000, 2025 and 2050 seems to suggest that domestic demand (34
BCM in 2000, 66 BCM in 2025 and 101 BCM in 2050) and industrial demand (42 BCM
in 2000, 92 BCM in 2025 and 161 BCM in 2050) for water will utilize the total balance
water available while agriculture demand for water will be (605 BCM in 2000, 675 BCM
in 2025 and 637 BCM in 2050). This change is partly because of the changing sectoral
contributions of India‟s GDP and also partly because of dynamics of irrigation
development in the country where the initial expansion in area under irrigation is
propelled by the availability of abundant water resources and availability of good quality
land. This is no longer the case in many of the states where the availability of land and
water are serious constraints for further expansion of irrigation. Further, as per the
erstwhile planning commission up to March 2012 out of 141 million hectares of net sown
area in the country 114 (or 81%) million hectares is Irrigation Potential Created (IPC)
and 88 (or 62%) million hectares is Irrigation Potential Utilised (IPU) leaving almost
20% of irrigated potential unutilized. This leaves 40 percent of the net sown area in the
country dependent on rainfall which makes farming a high risk and less productive.
The competing demands for water resources and the emerging issues and concerns were
to be addressed through certain basic principles and commonality in approaches in
1Ministry of Water Resources (2011), Strategic Plan for Ministry of Water Resources, Government of India, New
Delhi. 2 Amarasinghe, U.A., Shah T., Turral, H. and Anand, B.K. 2007. India’s water future to 2025-
2050:Business-as-usual scenario and deviations. Research Report 123, International Water Management
Institute, Colombo.

10 | P a g e
dealing with planning, development and management of water resources3 under an
Integrated Water Resource Management framework. The main objectives of water
resource management as delineated in National Water Policy 2012 are:
a) Planning, development and management of water resources need to be governed
by common integrated perspective considering local, regional, State and national
context, having an environmentally sound basis, keeping in view the human,
social and economic needs.
b) Principle of equity and social justice must inform use and allocation of water.
c) Good governance through transparent informed decision making is crucial to the
objectives of equity, social justice and sustainability. Meaningful intensive
participation, transparency and accountability should guide decision making and
regulation of water resources.
d) Water needs to be managed as a common pool community resource held, by the
state, under public trust doctrine to achieve food security, support livelihood, and
ensure equitable and sustainable development for all.
e) Water is essential for sustenance of eco-system, and therefore, minimum
ecological needs should be given due consideration.
f) Safe Water for drinking and sanitation should be considered as pre-emptive
needs, followed by high priority allocation for other basic domestic needs
(including needs of animals), achieving food security, supporting sustenance
agriculture and minimum eco-system needs. Available water, after meeting the
above needs, should be allocated in a manner to promote its conservation and
efficient use.
g) All the elements of the water cycle, i.e., evapo-transpiration, precipitation, runoff,
river, lakes, soil moisture, and ground water, sea, etc., are interdependent and the
basic hydrological unit is the river basin, which should be considered as the basic
hydrological unit for planning.
h) Given the limits on enhancing the availability of utilizable water resources and
increased variability in supplies due to climate change, meeting the future needs
will depend more on demand management, and hence, this needs to be given
priority, especially through (a) evolving an agricultural system which economizes
on water use and maximizes value from water, and (b) bringing in maximum
efficiency in use of water and avoiding wastages.
i) Water quality and quantity are interlinked and need to be managed in an
integrated manner, consistent with broader environmental management
approaches inter-alia including the use of economic incentives and penalties to
reduce pollution and wastage.
3Ministry of Water Resources, National Water Policy, 2012, Government of India, New Delhi.

11 | P a g e
j) The impact of climate change on water resources availability must be factored
into water management related decisions. Water using activities need to be
regulated keeping in mind the local geo climatic and hydrological situation.
Government of India launched Pradhan Mantri Krishi Sinchayee Yojana (PMKSY) to
address the constraints in providing assured irrigation as well as increasing efficiency
and productivity of current water use to bring more prosperity to the rural areas.
Priorities of Government of India were reflected in the Hon‟ble President‟s address to
the joint Session of the Parliament of 16th Lok Sabha where he indicated that “Each
drop of water is precious. Government is committed to giving high
priority to water security. It will complete the long pending irrigation
projects on priority and launch the ‘Pradhan Mantri Krishi Sinchayee
Yojana’ with the motto of ‘Har Khet Ko Pani’. There is a need for seriously
considering all options including linking of rivers, where feasible; for
ensuring optimal use of our water resources to prevent the recurrence of
floods and drought. By harnessing rain water through ‘Jal Sanchay’ and
‘Jal Sinchan’, we will nurture water conservation and ground water
recharge. Micro irrigation will be popularized to ensure ‘Per drop-More
crop”.
PMKSY has been approved with an indicative outlay of Rs.50,000 crore over a period of
five years from 2015-16 to 2019-20. The programme is an amalgamation of on-going
schemes of Ministry of Water Resources, River Development and Ganga Rejuvenation,
Ministry of Agriculture & Cooperation and Ministry of Rural Development. The existing
schemes AIBP, CADWM, MI, SWMA,and Watershed& Convergence with MGNREGA
were brought together under the umbrella program of PMKSY. Further the scheme
seeks convergence with scheme likeMahatma Gandhi National Rural Employment
Guarantee Scheme (MGNRES), Rashtriya Krishi Vikas Yojana (RKVY), Jawaharlal
Nehru National Solar Mission and Rural Electrification programmes (JLNNSM&REP),
Rural Infrastructure Development Fund (RIDF), Members of Parliament Local Area
Development Scheme (MPLAD), Members of Legislative Assembly Local Area
Development Fund (MLALAD), Local Body Funds (LBF), Working Plan of State Forest
Department (WPSFD) etc. The PMKSY will be implemented in an area development
mode only by adopting a decentralized state level planning and projectized execution
structure that will allow the state to draw up their own irrigation development plans
based on DIPs and SIPs with a horizon of 5-7 years. The program will be implemented
as part of Rashtriya Krishi Vikas Yojana (RKVY) with state agriculture department
acting as the State Nodal Agency. However, the implementing departments for the four
components like AIBP, PMKSY (Har Khet Ko Pani), PMKSY (Per drop more crop) and
PMKSY (watershed development) will be decided by the respective program
ministry/department.
12 | P a g e
The funds under this program would be provided to the states as per the pattern of
assistance of Centrally Sponsored Schemes (CSS) decided by the Ministry of Finance
and NITI Aayog. During 2015-16 the existing pattern of assistance of ongoing scheme
was continued. An outlay of Rs. 50,000 crore has been approved for 2015-20. The
financial assistance provided to the state governments from this centrally sponsored
scheme is subject to fulfillment of certain conditions. Firstly, a state will become eligible
to access PMKSY fund only if it has prepared the District Irrigation Plans (DIP) and
State Irrigation Plan (SIP), excepting for the initial year, and the expenditure in water
resource development for agriculture sector in the year under consideration is not less
than the baseline expenditure, which is defined as the average of the expenditure in
irrigation sector irrespective of the department in the state plan in three years prior to
the year under consideration. Secondly, States will be given additional weightage for
levying charges on water and electricity for irrigation purposes, so as to ensure
sustainability of the programme. Thirdly, interstate allocation of PMKSY fund will be
decided based on
Share of percentage of unirrigated area in the state vis-à-vis national average
including prominence of areas classified under Desert Development Programme
(DDP) and Drought Prone Area Development Programme (DPAP)
Increase in percentage share of expenditure on water resource development for
agriculture sector in State Plan expenditure in the previous year over three years
prior to it and
Improvement in irrigation efficiency in the state.
Vision
The overreaching vision of Pradhan Mantri Krishi Sinchayee Yojana (PMKSY) will be to
ensure access to some means of protective irrigation to all agricultural farms in the
country, to produce „per drop more crop‟, thus bringing much desired rural prosperity.
Objective
The objectives of the PMKSY are to:
a) Achieve convergence of investments in irrigation at the field level (preparation of
district level and, if required, sub district level water use plans).
b) Enhance the physical access of water on the farm and expand cultivable area
under assured irrigation (Har Khet Ko Pani),
c) Integration of water source, distribution and its efficient use, to make best use of
water through appropriate technologies and practices.
d) Improve on-farm water use efficiency to reduce wastage and increase availability
both in duration and extent,

13 | P a g e
e) Enhance the adoption of precision-irrigation and other water saving technologies
(More crop per drop).
f) Enhance recharge of aquifers and introduce sustainable water conservation
practices
g) Ensure the integrated development of rainfed areas using the watershed
approach towards soil and water conservation, regeneration of ground water,
arresting runoff, providing livelihood options and other NRM activities.
h) Promote extension activities relating to water harvesting, water management and
crop alignment for farmers and grass root level field functionaries.
i) Explore the feasibility of reusing treated municipal waste water for peri-urban
agriculture, and
j) Attract greater private investments in irrigation.
Strategy/approach
To achieve these objectives PMKSY adopted strategies that include
a) Creation of new water sources; repair, restoration and renovation of defunct
water sources; construction of water harvesting structures, secondary & micro
storage, groundwater development, enhancing potentials of traditional water
bodies at village level like Jal Mandir (Gujarat); Khatri, Kuhl (H.P.); Zabo
(Nagaland); Eri, Ooranis (T.N.); Dongs (Assam); Katas, Bandhas (Odisha and
M.P.) etc.
b) Developing/augmenting distribution network where irrigation sources (both
assured and protective) are available or created;
c) Promotion of scientific moisture conservation and run off control measures to
improve ground water recharge so as to create opportunities for farmers to access
recharged water through shallow tube/dug wells;
d) Promoting efficient water conveyance and field application devices within the
farm viz, underground piping system, Drip & Sprinklers, pivots, rain-guns and
other application devices etc.;
e) Encouraging community irrigation through registered user groups/farmer
producers‟ organisations/ NGOs; and
f) Farmer oriented activities like capacity building, training and exposure visits,
demonstrations, farm schools, skill development in efficient water and crop
management practices (crop alignment) including large scale awareness on more
crop per drop of water through mass media campaign, exhibitions, field days, and
extension activities through short animation films etc.
Programme Components
PMKSY has following four components:

14 | P a g e
1. Accelerated Irrigation Benefit Programme (AIBP)
To focus on faster completion of ongoing Major and Medium Irrigation including
National Projects.
2. PMKSY (Har Khet ko Pani)
This component focuses on-
a) Creation of new water sources through Minor Irrigation (both surface and ground
water)
b) Repair, restoration and renovation of water bodies; strengthening carrying
capacity of traditional water sources, construction rain water harvesting
structures (Jal Sanchay);
c) Command area development, strengthening and creation of distribution network
from source to the farm;
d) Ground water development in the areas where it is abundant, so that sink is
created to store runoff/ flood water during peak rainy season.
e) Improvement in water management and distribution system for water bodies to
take advantage of the available source which is not tapped to its fullest capacity
(deriving benefits from low hanging fruits). At least 10% of the command area to
be covered under micro/precision irrigation.
f) Diversion of water from source of different location where it is plenty to nearby
water scarce areas, lift irrigation from water bodies/rivers at lower elevation to
supplement requirements beyond IWMP and MGNREGS irrespective of
irrigation command.
g) Creating and rejuvenating traditional water storage systems like Khatri, Kuhl etc.
at feasible locations.
3. PMKSY (Per Drop More Crop)
a) Programme management, preparation of State/District Irrigation Plan, approval
of annual action plan, Monitoring etc.
b) Promoting efficient water conveyance and precision water application devices
like drips, sprinklers, pivots, rain-guns in the farm (Jal Sinchan);
c) Topping up of input cost particularly under civil construction beyond permissible
limit (40%), under MGNREGS for activities like lining inlet, outlet, silt traps,
distribution system etc.
d) Construction of micro irrigation structures to supplement source creation
activities including tube wells and dug wells (in areas where ground water is
available and not under semi critical/ critical/ over exploited category of

15 | P a g e
development) which are not supported under AIBP, PMKSY (Har Khet Ko Pani),
PMKSY (Watershed) and MGNREGS as per block/district irrigation plan.
e) Secondary storage structures at tail end of canal system to store water when
available in abundance (rainy season) or from perennial sources like streams for
use during dry periods through effective on-farm water management;
f) Water lifting devices like diesel/ electric/ solar pump sets including water
carriage pipes, underground piping system.
g) Extension activities for promotion of scientific moisture conservation and
agronomic measures including cropping alignment to maximize use of available
water including rainfall and minimize irrigation requirement (Jal Sarankchan);
h) Capacity building, training and awareness campaign including low cost
publications, use of pico projectors and low cost films for encouraging potential
use water source through technological, agronomic and management practices
including community irrigation.
i) The extension workers will be empowered to disseminate relevant technologies
under PMKSY only after requisite training is provided to them especially in the
area of promotion of scientific moisture conservation and agronomic measures,
improved/ innovative distribution system like pipe and box outlet system, etc.
Appropriate Domain Experts will act as Master Trainers.
j) Information Communication Technology (ICT) interventions through NeGP-A to
be made use in the field of water use efficiency, precision irrigation technologies,
on farm water management, crop alignment etc. and also to do intensive
monitoring of the Scheme.
4. PMKSY (Watershed Development)
a) Effective management of runoff water and improved soil & moisture conservation
activities such as ridge area treatment, drainage line treatment, rain water
harvesting, in-situ moisture conservation and other allied activities on watershed
basis.
b) Converging with MGNREGS for creation of water source to full potential in
identified backward rainfed blocks including renovation of traditional water
bodies
Rationale/ Justification
In reference to the status and need of irrigation, the water resource management
including irrigation related priorities was identified for Surendra Nagar district by the
peoples‟ representatives of district with support from administration and technical
experts. For instance the reports of Strategic Research and Extension Plan (SREP)
prepared under ATMA program, Comprehensive District Agriculture Plan (C-DAP)
prepared as part of Rashtriya Krishi Vikas Yojana (RKVY), Potential Linked Credit Plans

16 | P a g e
(PLP) of NABARD and the Integrated District Development Plan etc. identified number
of irrigation related issues for Surendra Nagar district including (i) promoting water use
efficiency through sprinkler and drip irrigation; (iii) promoting protected polyhouse
cultivation to minimize risk factors and enhance quality and productivity; (iv)
Improvement of on-farm water delivery and efficiency of existing irrigation systems; (v)
promotion of soil conservation of arable & non-arable land through engineering
measures; (vi) creation of new water harvesting structures, check dams, ponds, tanks,
etc (vii) increase the forest cover in the district and (viii) land improvement measures.
Methodology
During the course of preparation of District Irrigation Plan (DIP) the team visited
Surendra Nagar district to collect data and have interaction with all the stakeholders.
Methodology adopted to prepare DIP is outlined in brief as under:
a) Collection of primary and secondary data from field from various sources
including published documents and websites.
b) Various meetings were held to obtain ground level realities and data from key
personnel/stakeholders through structured, unstructured interviews, focused
group discussions etc.
c) Meetings with various State Government departments and related institutions
were held
d) Meeting through VC was also held with State Level authorities.
e) GIS maps of the area‟s/clusters were studied to understand the land
morphology, topography of the district.
f) Focused group discussions and interaction with of agriculture officers,
horticulture officers, soil conservation officers, extension officers, rural
development department, animal husbandry department, irrigation officers
both at blocks and district level for identifying the key issues and focus areas of
the region.
g) Discussion with NABARD officer of Surendra Nagar district was also held
during the visit.
h) Team members also participated in the State Level workshop and held active
discussions with GoI officers, State Level officers and scientists of various
institutions
i) In the district at Panchayat level schemes were identified as per the need and
potential and resolutions were passed by the Panchayat to include the schemes
in PMKSY. The Panchayat resolutions were then consolidated and put up in the
Block Development Committee and a block plan was put up in the Zila
Parishad along with the programme of other line departments participating in
implementation of PMKSY. Besides IWMP prepared by District Water

17 | P a g e
Development agency was also proposed and approved by the Zila Parishad
Surendra Nagar in its meeting.
On the basis of detailed discussion and analysis of data, the team arrived at the
projections of various components of PMKSY and Department wise plan for four years
from 2016-17 to 2019-20 as detailed in the plan.
18 | P a g e
CHAPTER 1. GENERAL INFORMATION OF THE
DISTRICT
1.1 District Profile
The District is situated in the Saurashtra region of Gujarat state and lies between 22°00'
and 23°05' North latitude and 69º45' to 72º15' East longitude. Surendra Nagar district
covers 5.31% of total geographical area of Gujarat. This district is surrounded by
districts in east and south, Rann of Kutch in the north.
The local inhabitants mainly depend on agriculture for their subsistence. Large and
small scale industrial development has taken place randomly all over the district.
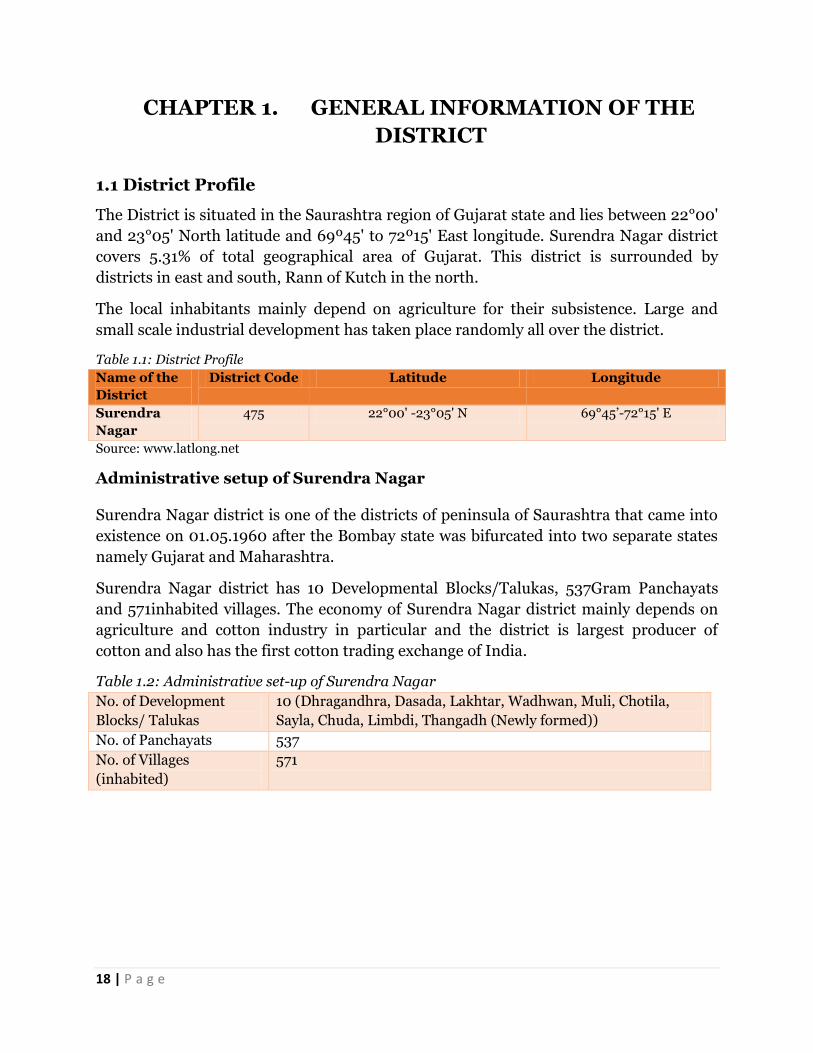
Table 1.1: District Profile
Name of the
District
District Code Latitude Longitude
Surendra
Nagar
475 22°00' -23°05' N 69°45‟-72°15' E
Source: www.latlong.net
Administrative setup of Surendra Nagar
Surendra Nagar district is one of the districts of peninsula of Saurashtra that came into
existence on 01.05.1960 after the Bombay state was bifurcated into two separate states
namely Gujarat and Maharashtra.
Surendra Nagar district has 10 Developmental Blocks/Talukas, 537Gram Panchayats
and 571inhabited villages. The economy of Surendra Nagar district mainly depends on
agriculture and cotton industry in particular and the district is largest producer of
cotton and also has the first cotton trading exchange of India.
Table 1.2: Administrative set-up of Surendra Nagar
No. of Development
Blocks/ Talukas
10 (Dhragandhra, Dasada, Lakhtar, Wadhwan, Muli, Chotila,
Sayla, Chuda, Limbdi, Thangadh (Newly formed))
No. of Panchayats 537
No. of Villages
(inhabited)
571
19 | P a g e
Map 1 Administrative Map of Surendranagar
For administrative purpose, the district is divided into ten Development Blocks or
Talukas with their headquarters at Dhragandhra, Dasada, Lakhtar, Wadhwan, Muli,
Chotila, Sayla, Chuda, Limbdi, Thangadhfor developmental purposes. The district is
headed by the Collector & District Magistrate. At the Sub Division level an officer called
Prant Officer & SDM holds the office and a Mamlatdar in each Taluka Office for the
smooth administration and quick disposal of services to the people of the district.
The District Development Officer looks after the development activities of the district
supported by the Taluka Development Officers in each Taluka along with Chief Judicial
Magistrate, Executive Engineers and other officers look after their respective
departments for carrying out development and regulatory functions. At Village level,

20 | P a g e
Talati cum Mantri functions under Gram Panchayat and carry out revenue and
developmental work of the Government.
1.2 Demography
As per 2011 census, the total population of the district can be calculated as 1585268 out
of which population of female and male are 763443 and 821825 respectively.
Table 1.3: Distribution of male, female and children population in blocks of Surendra Nagar
Block Population
Male Female Total
Dhrangadhra 113961 104080 218041
Dasada 93468 87173 180641
Lakhtar 38932 36674 75606
Wadhwan 186434 172891 359325
Muli 61556 57346 118902
Chotila 114729 106126 220855
Sayla 71327 67316 138643
Chuda 50609 47307 97916
Limbdi 90809 84530 175339
Total 821825 763443 1585268
Source: Census of India, 2011
Recent data not available subsequent to inclusion of Halvad block in Morbi district and
formation of new block Thangadh in Surendranagar in 2013
Wadhwan is the most populated block of the district whereas Lakhtar has lowest
population (Table 1.3). The population density of Surendra Nagar district as recorded by
2011 census is 168 people per sq. km. which is 4th lowest in the state. However there is
16.67% increase in density from 144 people per sq. km as per census 2001 data. The
current population density is much lower as compared to the population density of the
State (308 person per sq.km.).
Figure 1.1: Block wise male and female population of Surendra Nagar District
0
0.2
0.4
0.6
0.8
1
1.2

21 | P a g e
In terms of sex-ratio, Surendra Nagar has 929 females per 1,000 males as against 919
females per 1,000 males of state average. Sex ratio in all the Talukas is unfavorable
(<1000 male) to females. It is highest in Sayla (944 female per 1000 male) and lowest
in Dhrangadhra (913 female per 1000 male).
Category wise household and population
Looking at the category-wise data it can be seen that Scheduled Casted and Tribes form
just 11.44 percent of the total district population. In percentage terms, Limbdi has
maximum that i.e., 24.22 percent SC & ST Population, while Chotila has the minimum
i.e., 6.35 percent.
Table 1.4: Category wise population in blocks of Surendra Nagar
Name of Sub-
District
Total
population
Total
scheduled
castes
population
Total scheduled
tribes population
General
Population
Dhragandhra 218041 23257 513 194271
Dasada 180641 25335 365 154941
Lakhtar 75606 10827 206 64573
Wadhwan 359325 36220 1575 321530
Muli 118902 11851 176 106875
Chotila 220855 20148 426 200281
Sayla 138643 9129 143 129371
Chuda 97916 9453 104 88359
Limbdi 175339 21963 17643 135733
Total 1585268 168183 21151 1395934
Figure 1.2: Block wise percentage of SC, ST & General population in Surendra NagarDistrict
Source: Census of India, 2011
050000
100000150000200000250000300000350000400000
Total population Total scheduled castes population Total scheduled tribes population General Population

22 | P a g e
1.3 Biomass and Livestock
Livestock Population
The current livestock population in the district is 1,229,265 of which 240,052 are
poultry and small ruminants while 989,213 are large ruminants. Thus the district
majorly has large ruminants of which indigenous cows constitute 52% of the total large
animals followed by 36% buffaloes. Small ruminants mainly comprise of goats (65.66%)
and Sheep (32.20%).
Out of the total livestock in Surendra Nagar district, 26.95% of the animals are from
Chotila Block and 13.99 percent from Sayla Block. Minimum livestock i.e., 2.77 percent
has been reported in Lakhtar block.
Table 1.5: Population of small animals in the blocks of Surendra Nagar
Sr.
No.
Name of
Block/Taluka
Small Animals
Poultry
(No.)
Ducks
(No.)
Pigs
(No.)
Goats
(No.)
Sheep
(No.)
Total
1 Chotila 35 2 0 20999 10370 31406
2 Chuda 17 0 0 5430 1493 6940
3 Dasada 223 0 0 21309 6034 27566
4 Dhrangadhra 369 0 0 19736 8892 28997
5 Lakhtar 270 0 0 4187 404 4861
6 Limbdi 384 0 0 8215 641 9240
7 Muli 112 0 0 20751 14259 35122
8 Sayla 42 0 0 27693 17481 45216
9 Wadhwan 3596 0 0 12022 1583 17201
Total 5048 2 0 140342 61157 206549 Source: Livestock Census, Gujarat, 2012 (Data for new block Thangadh not available)
Table 1.6: Population of large animals in the blocks of Surendra Nagar
Sr.
No.
Name of
Block/Ta
luka
Large Animals
Indigenous
Cow (Nos.)
Hybrid
Cow (No.)
In
Descriptive
Buffalo
(No.)
Hybrid
Buffalo
(No.)
Any other
MilchorMeatA
nimal(Nos.)
Draft Animal
(Buffalo/yak/
bulls/any
other (Nos.)
Total
1 Chotila 249773 318 81509 NA NA 34801 366401
2 Chuda 15233 418 13911 NA NA 4744 34306
3 Dasada 36992 125 32753 NA NA 6555 76425
4 Dhrangad
hra
41553 80 41560 NA NA 9725 92918
5 Lakhtar 14240 54 13826 NA NA 4618 32738
6 Limbdi 19319 863 20003 NA NA 6703 46888
7 Muli 27561 124 36067 NA NA 11967 75719

23 | P a g e
8 Sayla 41221 326 41008 NA NA 21027 103582
9 Wadhwan 28067 634 28091 NA NA 7591 64383
Total 473959 2942 308728 NA NA 107731 893360
Source: Livestock Census, Gujarat, 2012 (Data for new block Thangadh not available)
Figure 1.3: block wise population of small and large animals in Surendra Nagar
1.4 Agro-Ecology, Climate, Hydrology and Topography
Surendra Nagar falls in North Saurashtra agro climatic zone which represents the
subtropical conditions with semi-arid climate. The zone receives average annual rainfall
of 537 mm. Surendra Nagar district receives the average rainfall of 744 mm mostly
during the rainy season. Temperature during summers ranges from 24 to 40 degrees
while in winters it ranges from 17 to 32 degrees.
S
r
N
Name of
Block
Agro
Ecolo
gical
Zone
Type
Block
Area
(ha)
Normal
Annual
Rainfall
(mm)
No of
Rain
y
Days
(No)
Average Monthly Temperature (°C)
Period
Summer
(April-May)
Winter
(Oct-Mar)
Rainy
(June-Sept)
Mi
n.
Ma
x.
Me
an
Mi
n
Max Mea
n
Mi
n
Max Mea
n
1 Dhragand
hra
North
Sauras
htra
136978 707 29
24 40 32 17 32 24.7 25 34 29.5
2 Dasada 163011 766 28
3 Lakhtar 74177 685 29
4 Wadhwan 79739 757 34
5 Muli 93576 704 28
6 Chotila 105823 837 32
7 Sayla 97292 746 30
0100000200000300000400000500000600000700000800000900000
1000000
Small Animals-Total
Large Animals-Total

24 | P a g e
8 Chuda 51278 672 25
9 Limbdi 120096 909 32
Total 921970
1.5 Soil Profile
Surendra Nagar is characterized by „very deep soil‟ and „moderately deep soil‟ in some
parts of the district. The soil texture is majorly clayey. The soils of Surendra Nagar can
be broadly classified into three main categories:
a. Medium black soils
b. Red Sandy soils
c. Silty soils
Medium black soils generally occur at shallow depths (less than 5m) where basalts/shale
forms the main rock unit and is exposed on the surface in the south, southwest and
central part of the area. These soils are good in fertility but not suitable for heavy
irrigation. The red sandy soils occur in north east, east and south east part of the area.
The silty soils are found along a narrow strip close to the little Rann of Kachchh in the
north east and along shallow alluvial tracts and hard rock areas in central uplands has
appreciable content of sand.
Table 1.7: Soil Profile of the district
Sr.
No.
Name of
Taluka
Soil Type
Major Soil Classes Area (ha) Percent Area
1 Dhragandhra Medium Black Silty Loam 82140 60%
2 Dasada Sandy Loam 98760 61%
3 Lakhtar Medium Black Clay Loam 73500 99%
4 Wadhwan Medium Black Silty Loam 79400 100%
5 Muli Sandy Loam 93600 100%
6 Chotila Silty Loam 105800 100%
7 Sayla Sandy Loam 97300 100%
8 Chuda Medium Black, Silty Loam 51300 100%
9 Limbdi Medium Black Clay Loam 78065 65%
Map 2 Soil use map

25 | P a g e
1.6 Land Use Pattern
The total geographical area (TGA) of Surendra Nagar is 10.46 Lakh hectares (as per
2010-11 data including Halvad block). The largest block of the district is Dasada which
comprises TGA of 164,600 hectares i.e. about 15.74% of the TGA of the district. Dasada
is followed by Dhagandhraa with TGA of 136,900 hectares.The Gross Cropped Area of
the district is 6.49 Lakh hectares out of which 107,090 hectares i.e. 17.8% of the area
falls in Dasada Block, followed by Dhragandara block having 14.84% of the district.
Looking at the net cultivable area data, it can be seen that out of total 7.04 Lakh
Hectare,Dasada has maximum Net Cultivable Area of 101,581 ha followed by
Dhagandhraa Block.
The cropping intensity of the district is 104.2 which is quite low. Among the blocks
Chotila has maximum cropping intensity of 110.8 followed by Dhagandhraa block where
it is 109.1. Dasada block has the lowest cropping intensity i.e. 100 only.

26 | P a g e
Surendra Nagar district has only 5% of total area under forests. Sayla and Dhagandhraa
blocks are leading in terms of forest area with 9% forest area followed by Chotila block
where it is 8% of the total geographical area.
Table 1.8: Land Use Pattern of Surendra Nagar district (Area in ha.)
Blocks Geographical Area (''00ha)
Forest Area
Net Cultivable Area
Land under non-agri use
Cultivable Waste
Permanent Pastures
Current Fallows
Other Fallows
Gross cropped area
Cropping intensity (%)
Dhangadhraa
1369 12779 98120 6975 1015 3483 1082 450 107090
109.1
Desada 1646 8724 101581 8821 2601 6012 19708 430 101581
100
Lakhatar 735 883 57276 3233 872 2393 3665 340 57976 101.2
Vadhavan 794 456 62569 5410 266 3393 1454 100 63584 101.6
Muli 936 3470 62468 4553 410 4671 460 110 67001 107.3
Chotila 1058 8344 65092 7718 1836 10320 346 380 72092 110.8
Sayala 973 8696 58871 6953 1710 4439 2198 780 60017 101.9
Chuda 513 699 41700 1200 1832 1090 473 100 42062 100.9
Limbadi 1201 770 76257 5992 3664 5194 10037 240 77257 101.3
Total 9225 44821
623934 50855 14206 40995 39423 2930 648660
103.8
TGA- Total Geographical Area, GCA- Gross Cropped Area, NSA- Net Sown Area, AST- Area
Sown more than once
Map 3 Land use map

27 | P a g e
Figure 1.4: TGA, GCA and Cropping Intensities of the blocks

28 | P a g e
94
96
98
100
102
104
106
108
110
112
0
20000
40000
60000
80000
100000
120000
Gross Cropped Area(1) Net Sown Area (2) Cropping Intensity (%)

29 | P a g e
CHAPTER 2. DISTRICT WATER PROFILE
2.1 Irrigation Based Classification
As per the latest data available Surendra Nagar has only 46.00 percent of gross sown
area as irrigated. Among the blocks Dhragandhara is the leading block with 82.00
percent gross irrigated area whereas Limbadi has minimum i.e., 11.00 percent area
under irrigation.
Table 2.1 : Block-wise irrigation status.
Name of Block/ Taluka Gross Irrigated
Area in ha Rainfed Area in ha
Gross Cultivated
Area
Chotila 39449.3 30665.7 70115
Chuda 4952 37650 42602
Dasada 55849.9 112791.1 168641
Dhangdhra 122095.9 26858.1 148954
Lakhatar 19018.55 65529.95 84548.5
Limbadi 10376.49 81798 92174.45
Muli 50780.2 40541.8 91322
Sayala 37858.8 20770.2 58629
Vadhavan 43165.1 40867.9 84033
Surendra Nagar dist 383546.24 457472.71 841018.95
(Data for new block Thangadh not available)
2.2 Area Wise, Crop Wise Irrigation Status
Surendra Nagar district has cotton based industry since it is the largest producer of
cotton in the state and is the first district to have a cotton auction centre. District has
major area under cotton during Kharif season and Wheat during Rabi season. It also has
large areas under Bajra, Jowar, sesame, castor and groundnut. Among the horticultural
crops cumin is the most grown crop in the district.
Out of the total Kharif sown area,45.56% is rainfed area while 54.45% is irrigated while
in case of Rabi sown area 76.1% is irrigated and 23.9% is rainfed. Among horticultural
crops 90% area under fruits and 100 percent areas under vegetable, spices and flowers
have been taken as irrigated.

30 | P a g e
Table 2.2: Cropping Season-wise, Area-wise irrigation status
Season Rainfed Irrigated Total
Area
(ha)
Producti
on
(Qtn/Yr)
Productiv
ity or
Yield
(kg/ha)
Area
(ha)
Producti
on
(Qtn/Yr)
Productiv
ity or
Yield
(kg/ha)
Area(ha) Productio
n (Qtn/Yr)
Product
ivity or
Yield
(kg/ha)
Kharif 178343 39663483
.2 22240 213193 65450251 30700 391536 408137126 104240
Rabi 7558 872949 11550 24069 7959618 33070 31627 41083473 129900
Summer 0 0 0 4273 544978 12754 4273 3898172 91228
Horticultu
re/ &
Plantation
603 21923.7 3634 136132 5190031 3634 136708 5211955 3634
Total 185901 40536432 11263 384963 74476043 25508 570864 458330726 108456
Among the crop categories, cereals, pulses and oilseeds are majorly rainfed. Fibre crops
comprise of cotton and approximately 50 percent of the total area under cotton is
irrigated. Among the Rabi crops major area under cereals is irrigated while that under
pulses and oilseeds is rainfed.
Table 2.3: Cropping season wise, Crop category Wise Irrigation Status
Crop Type Kharif (Area in ha.) Rabi (Area in ha.) Summer (Area in
ha.)
Horticulture
&Plantation crops (Area
in ha.)
Irrigat
ed
Rainfe
d
Total Irriga
ted
Rainfe
d
Total Irrigat
ed
Rai
nfed
Total Irrigat
ed
Rainf
ed
Total
(A)Cereals 258 49843 50102 17999 7804 25803 732 0 732 0 0 0
(B) Coarse
Cereals 0 53 53 0 0 0 0 0 0 0 0 0
(C) Pulses 210 12014 12224 4021 12359 16380 1080 0 1080 0 0 0
(D) Oil
Seeds 26355 72843 99198 2946 1356 4302 3591 0 3591 0 0 0
(E) Fibre 190774 190023 380797 0 0 0 0 0 0 0 0 0
(F) Any
other
crops
15507 71711 87218 71560 33631 105191 23990 0 23990 136132 575 136708
Total 233104 396487 629591 96526 55150 151676 29393 0 29393 136132 575 136708
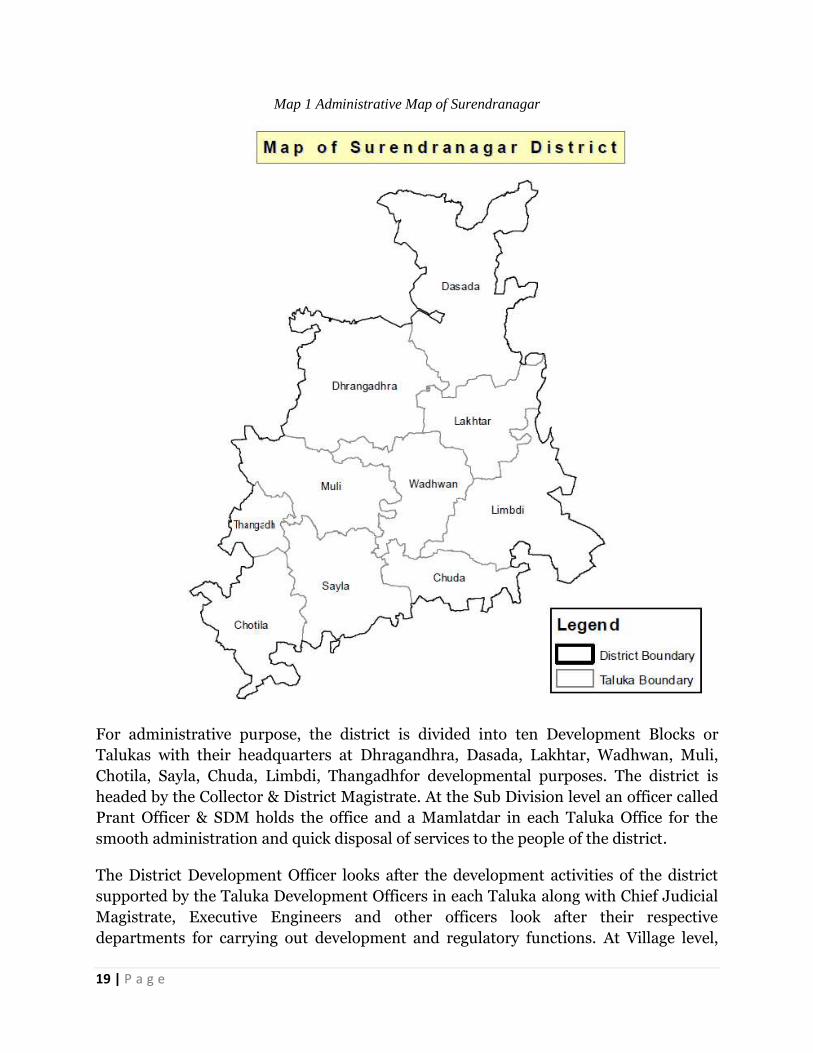
2.3 Production and Productivity of Major Crops
Cotton, Wheat, Bajra, Jowar, Ground nut and Cumin are the major crops grown in the
district. The crop-wise area, production, productivity and irrigation status of the major
crops is given in table 2.4 below:

31 | P a g e
Table 2.4: Crop-wise area, production, productivity and irrigation status in Surendra Nagar
Season Rainfed Irrigated Total
Area
(ha)
Producti
on
(Qtn/Yr)
Productiv
ity or
Yield
(kg/ha)
Area
(ha)
Productio
n
(Qtn/Yr)
Product
ivity or
Yield
(kg/ha)
Area(ha
)
Product
ion
(Qtn/Yr
)
Producti
vity or
Yield
(kg/ha)
Kharif
Paddy 226 45200 20000 0 0 0 226 NA NA
Jowar 23240 NA NA 0 0 0 23240 235421
2
10130
Bajri 14376 NA NA 240 NA NA 14616 194392
8
13300
Maize 0 0 0 0 0 0 0 0 0
Ragi 0 0 0 0 0 0 0 0 0
Mung 2783 NA NA 100 NA NA 2883 142997 4960
Math 759 NA NA 0 0 0 759 34383 4530
Udid 553 NA NA 110 NA NA 663 49725 7500
Tur 15 NA NA 0 0 0 15 1500 10000
Groundnut 9480 NA NA 5585 NA NA 15065 291809
1
19370
Castor 34822 NA NA 12745 NA NA 47567 116348
88
24460
Sesamum 17033 NA NA 8025 NA NA 25058 113763
3
4540
Cotton 67562 1513389 2240 186203 12475601 6700 253765 139889
90
4470
Guar seed 7494 NA NA 185 NA NA 7679 418506 5450
Rabi
Wheat 0 0 0 16874 5580232 33070 16874 558023
2
33070
Jowar 767 NA NA 5 0 0 772 83839 10860
Maize 0 0 0 0 0 0 0 0 0
Gram 6595 NA NA 1822 NA NA 8417 1013407 12040
Rapeseed &
mustard
196 NA NA 2437 NA NA 2633 409695 15560
Sugarcane 0 0 0 55 NA NA 55 36410 66200
Isabgul 0 0 0 245 NA NA 245 16342 6670
Fennel 0 0 0 2631 NA NA 2631 488577 18570
Summer
Groundnut 0 0 0 624 NA NA 624 119933 19220
Bajra 0 0 0 672 NA NA 672 167194 24880
Maize 0 0 0 60 NA NA 60 NA NA
32 | P a g e
Mung 0 0 0 0 0 0 NA NA 6430
Udid 0 0 0 80 NA NA 80 NA NA
Sesamum 0 0 0 2837 NA NA 2837 140999 4970
Horticulture & Plantation
Fruits 603 0 0 5432.4 88126 14600 6036 88126 14600
Vegetables 0 0 0 19290 294751 15280 19290 294751 15280
Spices 0 0 0 118059 138129 1170 118059 138129 1170
Flowers 0 0 0 43 190 4410 43 190 4410

33 | P a g e
CHAPTER 3. WATER AVAILABILITY
3.1 Status of Water Availability
River/ Khads/ Tributaries
There are no major rivers flowing through Surendra Nagar district. Surface Irrigation
comprises mainly of Canal irrigation from SSNNL. Some of the important irrigation
projects in the respective blocks are as follows:
a. Dhangadhra: Chandrabagha, Kankavati and Satapar
b. Dasada: Vinod and Navarangpara
c. Lakhatar: Saraghara and Sakar
d. Wadhavan: Khodiyar
e. Muli: Ranipat
f. Chotila: Gadhechi, Bandiyabeli, Mevasa and Baamanbore
g. Sayala: Nanamatri, Ori and Goraiya
h. Limbadi: Mulbavla and Ranagadh
i. Chuda: Chanchaka
(Data not available for new block Thangadh)
Table 3.1 shows the current water availability in the district. It can be seen that a total of
1953.75 MCM of surface irrigation and 520.60 MCM of groundwater is available
currently.
Table 3.1: Status of water availability in Surendra Nagar(MCM)
S.No. Sources Kharif Rabi Summer Total
1 Surface irrigation 692.62 1217.37 43.76 1953.75
(I) Canal(major & medium
irrigation)
420.53 1194.43 0.00 1614.96
Dasada 68.70 428.00 0.00 496.70
Chotila 5.90 0.00 0.00 5.90
Dhrangadhra 81.99 191.30 0.00 273.29
Lakhtar 68.30 155.50 0.00 223.80
Limbdi 112.05 241.94 0.00 353.99
Chuda 33.80 78.86 0.00 112.66
Wadhwan 49.80 98.81 0.00 148.61
(Ii) Minor irrigation tanks 20.52 22.94 43.76 87.22
Chotila 5.34 2.88 8.22 16.44
Than 2.84 1.54 4.38 8.76
Dhrangadhra 4.81 0.44 5.55 10.8
Lakhtar 1.64 1.1 2.74 5.48
Limbdi 0 11.54 11.54 23.08

34 | P a g e
3.2 Status of Ground Water Availability
Ground Water Quality
In Surendra Nagar district there is a total recharge of 520.60 MCM of which there is
draft of 374.98 MCM for various purposes such as agriculture, animal husbandry,
domestic and industrial. All the blocks are under safe category as per the CGWB
notification. The Ground Water Resources and Irrigation Potential of the district were
calculated as on March 2011 in collaboration with the Government of Gujarat using the
methodology suggested by ―Ground Water Estimation Committee (GEC-97). These
Chuda 0 1.55 1.55 3.1
Patdi 0.98 0.6 1.58 3.16
Sayla 2.66 1.78 4.44 8.88
Muli 1.39 0.94 2.33 4.66
Wadhwan 0.86 0.57 1.43 2.86
(Iii) Lift irrigation/diversion - - - -
(Iv) Various water bodies including
rain water harvesting
251.57 0 0 251.57
Chotila 45.72 0 0 45.72
Than 0 0 0 0
Dhrangadhra 46 0 0 46
Lakhtar 1 0 0 1
Limbdi 16.16 0 0 16.16
Chuda 10.12 0 0 10.12
Patdi 7.29 0 0 7.29
Sayla 65.06 0 0 65.06
Muli 28.66 0 0 28.66
Wadhwan 31.56 0 0 31.56
(V) Treated effluent received from
stp
- - -
(Vi) Untreated effluent - - - -
(Vii) Perennial sources of water - - - -
2 Ground water 480.39 40.21 - 520.6
-
Dhragandhra 154.39 4.08 - 158.47
Dasada 24.73 1.45 - 26.18
Lakhtar Saline -
Wadhwan 28.38 14.53 - 42.91
Muli 86.47 7.92 - 94.39
Chotila 70.51 5.33 - 75.84
Sayla 68.21 4.27 - 72.48
Chuda 27.98 1.13 - 29.11
Limbdi 19.72 1.5 - 21.22
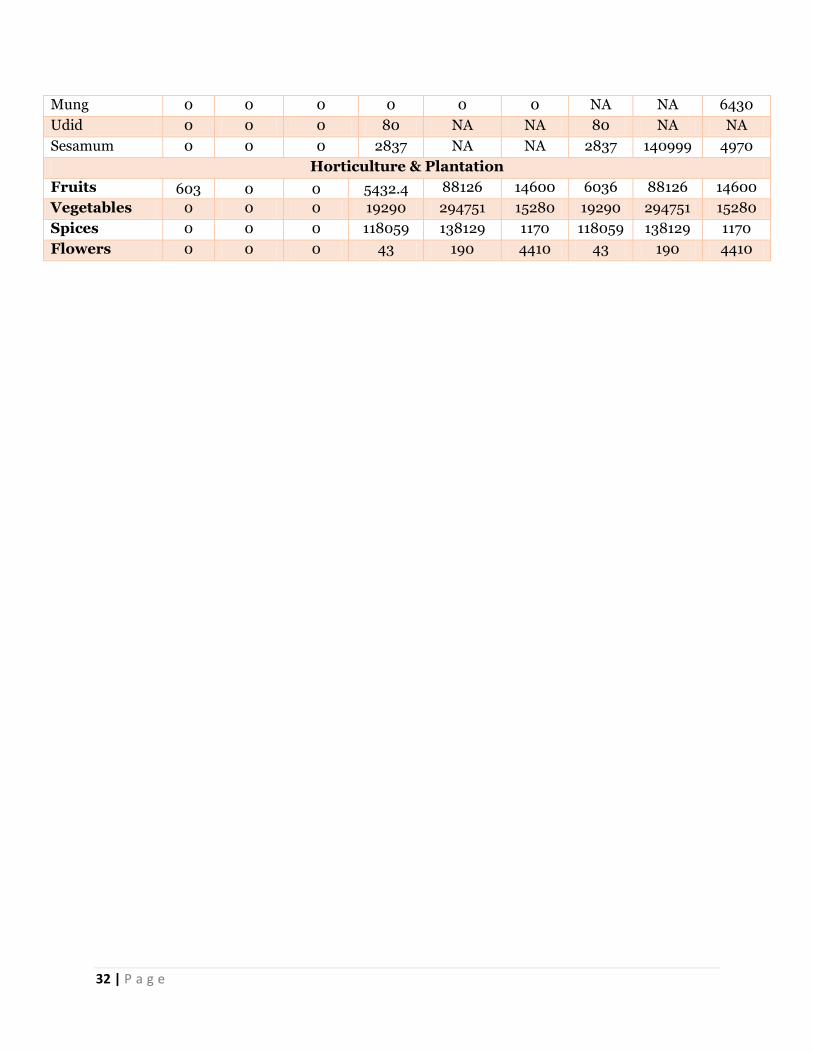
35 | P a g e
resources were computed after reorganization of the districts. The ground water
resources for different Talukas of the district are given in the Table 3.1. The annual
ground water recharge varies from 2122.60 ha m. in Limbdi Taluka to 15846.89 ha m. in
Dhrangardha Taluka and total gross recharge for the district is 66302.55 ha m. The net
available recharge, after leaving natural discharge for non-monsoon period varies from
2016.47 (Limbdi) to 15054.54 ha m. (Dhrangardha), the recharge for district is
62987.43 ha m. The ground water of Lakhatar block is found to be saline.
Map 4 River & Water bodies map of Surendra Nagar District

36 | P a g e
Table 3.2: Status of block as per central ground water board notification
Sr.
No.
Name of
Block/
Taluka
Status of Block as
per Central Ground
Water Board
Notification
Ground Water (MCM)
Critical Semi-
Critical
Safe Draft Recharge Gap
1 Chotila Safe 45.52 72.04 26.53
2 Chuda Safe 18.08 27.66 9.57
3 Dasada Safe 13.48 22.75 9.27
4 Dhangadhra Safe 91.79 148.64 56.85
5 Lakhtar Saline
6 Limbdi Safe 7.20 19.88 12.68
7 Muli Safe 56.98 86.56 29.58
8 Sayala Safe 40.45 68.86 28.41
9 Wadhvan Safe 21.81 40.68 18.87 (Data for new block Thangadh not available)
In order to assess the quality of ground water 164 water samples were tested. In general,
the water of this district has been found to be alkaline. The percentage distribution of
water samples into different EC is given the table below:
Table 3.3: Block-wise percentage distributions of water samples into different EC
Blocks Permissible
(%) Moderately
Safe (%) Moderately Unsafe (%)
Unsafe (%)
Dhangadhraa 0 0 35 65
Desada 0 0 0 100
Lakhatar 0 0 14.3 85.7
Vadhavan 0 0 15.4 84.6
Muli 0 15 50 35
Chotila 0 5 65 30
Sayala 0 15 50 35
Chuda 0 55 0 45
Limbadi 0 0 7.7 92.3
Total 0 10 26.38 63.62 (Data for new block Thangadh not available)
37 | P a g e
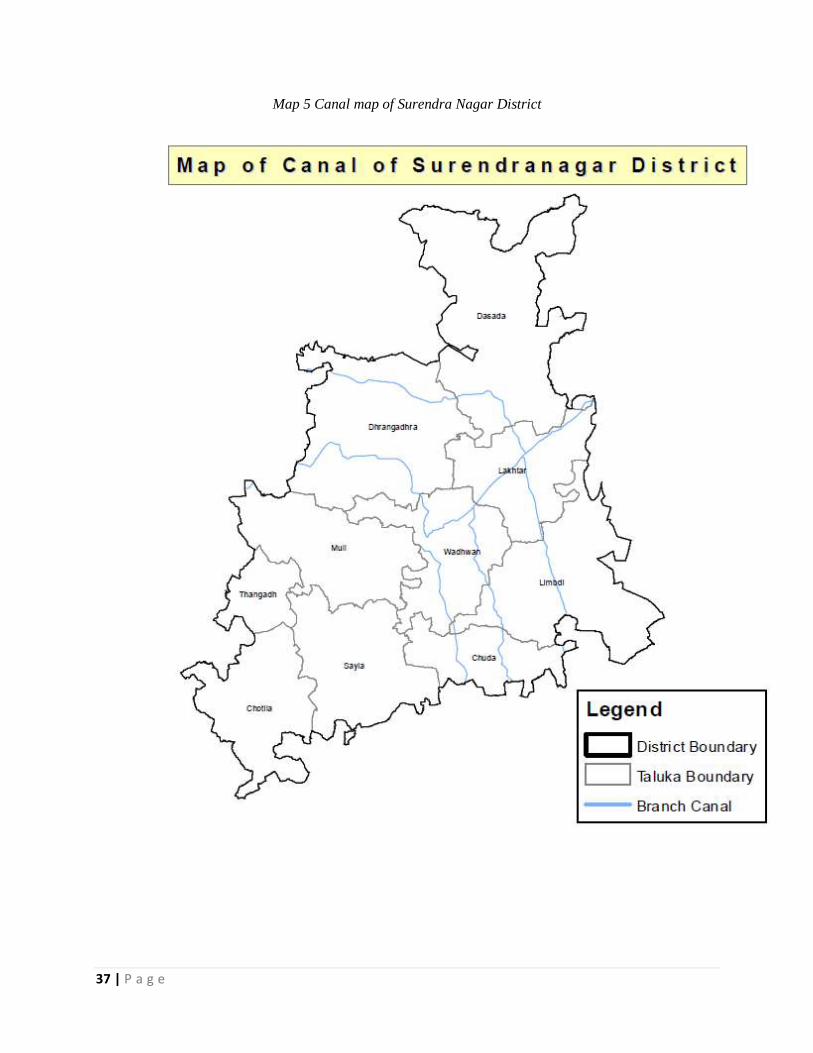
Map 5 Canal map of Surendra Nagar District

38 | P a g e
Map 6 Watershed map of Surendra Nagar District
3.3 Status of Command Area
Total area developed through major and medium canal irrigation is 201,606 Ha in the
district. While the command from Surface and Minor Irrigation scheme is 36538.6 Ha.
In Dasada, maximum area i.e., 93895 Ha hectares of land is irrigated through canal

39 | P a g e
command, while Lakhatar block has the minimum command area under canal
irrigation.
Table 3.4: Status of Command Area (Area in Ha) S.No. Name of the
Village
Information of Canal Command Information on the other Services
Command
Total Area
Total Developed Undeveloped Total Developed Undeveloped Developed Undevel.
Area Area Area Area Area Area Command Command
1 2 3 4 5 6 7 8 4+7 5+8
A Canal(Major & Medium Irrigation)
1 Lakhtar 42307.00 32449.00 9858.00 NA NA NA NA NA
2 Dasada 93895.00 62660.00 31235.00 NA NA NA NA NA
3 limbadi 65404.00 18151.00 47253.00 NA NA NA NA NA
4 Wadhavan 26685 17985 8700 0 0 0 17985.00 8700.00
5 Dhrangadhra 51661 43829 7832 0 0 0 43829.00 7832.00
6 Chuda 21297 9939 11358 0 0 0 9939.00 11358.00
Total 201606 113260 88346 NA NA NA NA NA
Surface/Minor Irrigation Scheme
1 Chotila-Than 6886 4709 2177 100 80 20 4789 2197
2 Dhrangadhra 4689.4 2662.6 2026.8 150 70 80 2732.6 2106.8
3 Lakhtar 1078.4 718.4 360 0 0 0 718.4 360
4 Limbdi-
Chuda
4711 2600.8 2110.2 210 180 30 2780.8 2140.2
5 Dasada
(Patdi)
1011.2 661.8 349.6 0 0 0 661.8 349.6
6 Sayla-Muli 11949.6 8371.8 3577.8 0 0 0 8371.8 3577.8
7 Wadhvan 6213 3307.6 2905.4 150 110 40 3417.6 2945.4
Total 36538.6 23032 13506.8 610 440 170 23472 13676.8
Source: SSNL and State irrigation department ((Data for new block Thangadh not available)
3.4 Various Sources of Irrigation
It can be seen from the table below that wells are the major source of groundwater
irrigation while government large, medium and minor irrigation canals are the major
source for surface water irrigation.

40 | P a g e
Table 3.5: Existing type of irrigation – Ground water irrigation
Blocks Govt.
Canal
Commun
ity Ponds
including
small
Individua
l /Pvt.
Ponds
Govt.
Reservoi
r /Dams
Community
/ Govt.
open wells
Other
Sources
Including
Traditiona
lWHS
Total
irrigation
sources
Area in Ha
Lakhtar 42307
50 1141 1768 200.94 45466.94
Dasada 93895
3106 729 97730
Limbadi 66237
300 913.5 4203 1314 72967.5
Chotila 3907
156 5072 21422 4632.18 35189.18
Dhrangadhra 52737
3139 31143 1314 88333
Chuda 22130
913.5
4700.3 27743.8
Sayla 1140 5974.8 660 3666.3 35472 4686 51599.1
Muli 1140 5974.8
3666.3
4686 15467.1
Wadhvan 29649
905 10949 3156 44659
Total 313142 11949.6 1166 19417 108063 25418 479156
Source: C-DAP and SSNL and State Irrigation Department (Data for new block Thangadh not
available)
Rain water harvesting structures provides an independent water supply during regional
water restrictions and in developed countries is often used to supplement the main
supply. It provides water when there is a drought, can help mitigate flooding of low-
lying areas, and reduces demand on wells which may enable groundwater levels to be
sustained. It also helps in the availability of potable water as rainwater is substantially
free of salinity and other salts. It can be an important form of source of water for a semi-
arid district like Surendra Nagar.
Although the district is receiving fairly good amount of rainfall there is lack of proper
lots of water harvesting structures and practices. Also due to topography of land, limited
area is under irrigation in the district. As a result cropping intensity is also quite low in
the district and there is great potential for improvement of the same. Further micro
irrigation is also a good solution for increasing cropping intensity along-with water
conservation. With the efforts of the state government, micro irrigation is slowly
picking up pace in the district.

41 | P a g e
CHAPTER 4. WATER REQUIREMENT /DEMAND
The previous chapters deals with the general profile, water profile and water availability
of Surendra Nagar district. In the present chapter it is the current (2015) and projected
(2020) demand of water for various sectors. The demand for water has been assessed on
the basis of data obtained from different departments.
4.1 Domestic Water Demand
Data of Census 2011 and 2001 has been considered to arrive at the growth rate of
population of the district. As per Census 2011, the district has shown an annual growth
rate of 2.001%. Current population (in 2015) has been calculated by assuming a growth
rate of 8% (2.001% × 4 Years) over a period of four years (from 2011-2015). Projected
population has been calculated in similar way by assuming a growth rate of 10%
(2.001% × 5 Years) over the period of five years (from 2015-2020).
It has been assumed that per capita daily water requirement of people residing in urban
areas of the district is 140litres and for population in rural areas, the daily per capita
daily water requirement is 100litres.Using the same norms, block-wise domestic water
supply demand has been worked out and is given in table 4.1 below.
Table 4.1: Domestic Water Demand (MCM)
Sr.
No. Blocks
Population
in 2015
Water
Demand
(MCM)
Present
Water
Potential
(MCM)
Projected
population in
2020
Gross Water
Demand(MCM)
1 Chotila 220855 6.096 6.096 161073 6.59
2 Chuda 97916 6.268 6.268 165630 6.78
3 Dasada 180641 7.146 7.146 188820 7.73
4 Dhangdhra 218041 0.524 0.524 13843 0.57
5 Lakhatar 75606 4.637 4.637 122528 5.01
6 Limbadi 175339 5.215 5.215 137807 5.64
7 Muli 118902 6.892 6.892 182125 7.45
8 Sayala 138643 6.081 6.081 160687 6.58
9 Vadhavan 359325 4.295 4.295 113485 4.64
TOTAL 1585268 52.967 52.967 1399648 57.28
It can be inferred from the table that considering the growth rate of population of the
district, the quantity of water required in 2020 for domestic consumption shall be
approximately 57.28 MCM which is 4.313MCM more than the present water
requirement.

42 | P a g e
4.2 Crop water Requirement
Crop water requirement for the blocks and district have been calculated based upon the
cropping pattern followed in the various blocks of the district. Cropping pattern under
irrigated and rainfed system is different in the district. Oilseeds and cotton based
cropping system is followed under unirrigated conditions in all the blocks. Under
irrigated conditions, in almost all the blocks vegetable based cropping system is
followed. However, under irrigated system, wheat, cotton and horticulture based
cropping systems are also being followed.
Area under different crops has been discussed in Chapter 2 (Table 2.2). Taking into
account, the water requirement (Table 4.2), requirement of water for different crops
have been worked out. Existing water potential available (being utilized) has been
assumed as the water used in irrigated land. As per the calculation the existing water
potential comes to 1717.51 MCM while required potential comes to 2909.04, thus
leaving a gap of 1191.53 MCM.
Table 4.2: Crop Water Requirement in Million Cubic Meter
Block Crop Area Sown
(ha)
Irrigated
area(ha)
Water
Potential
Required
(MCM)
Existing Water
Potential(MCM)
Water
Potential
to be
Created
(MCM)
Chotila Agri and
Horticulture
70115.00 39449.30 259.03 216.76 42.27
Chuda 42602.00 4952.00 168.79 69.21 99.57
Dasada 168641.00 55849.90 467.68 147.27 320.41
Dhangdhra 148954.00 122095.90 452.85 335.23 117.62
Lakhatar 84548.50 19018.55 182.55 26.12 156.43
Limbadi 92174.45 10376.49 236.15 115.21 120.94
Muli 91322.00 50780.20 359.18 271.86 87.32
Sayala 58629.00 37858.80 406.95 320.58 86.37
Vadhavan 84033.00 43165.10 375.86 215.28 160.59
Total 841018.95 383546.24 2909.04 1717.51 1191.53 (Crop production and area Data for new block Thangadh not available)
4.3 Livestock
The requirement of water for livestock of the district has been derived from the
Department of Animal Husbandry. The table below represents the animal wise water
requirement as well as total water requirement of the district for livestock.
The block wise water estimation for livestock is as follows;

43 | P a g e
Table 4.3: Livestock water demand (in MCM)
4.3 Livestock Water Demand
Block Totalnumber of
live stock
Presentwaterdemand
(MCM)
Water demand in
2020 (MCM)
Existing Water
potential (MCM)
Water
potential to be
created
(MCM)
Chotila 397807 8.75 10.09 8.75 1.34
Chuda 41246 0.83 0.95 0.83 0.13
Dasada 103991 1.86 2.15 1.86 0.29
Dhrangadhra 121915 2.26 2.60 2.26 0.35
Lakhtar 37599 0.79 0.91 0.79 0.12
Limbdi 56128 1.13 1.30 1.13 0.17
Muli 110841 1.86 2.15 1.86 0.29
Sayla 148798 2.54 2.93 2.54 0.39
Wadhwan 81584 1.55 1.79 1.55 0.24
Total 4279451 17.47 20.15 17.56 2.60
* it is assumed that present water requirement of animal is met from existing water usage and hence existing potential is equal to existing
demand.
(Livestock Data for new block Thangadh not available)
Based on the projected water requirement for livestock in 2020, the gap has been
assessed. The total potential which has to be created for livestock in 2020 is 5.29MCM.
This has been assessed on the terms of the following:
Per capita daily water requirement for cows/buffaloes 60 litres, sheep/goats/pigs
6 litres and Poultry 0.3 liters.
For projecting the water demand of livestock, growth rate as deduced from
census has been considered during calculations. It is assumed that present water
requirement of livestock is met from existing water usage and hence existing
potential is equal to existing demand.
4.4 Industrial Water Requirement
The water demand for industries in the district of Surendra Nagar was reportedly
meagre, amounting to 0.02 MCM.
4.5 Water Demand for Power Generation
The district is not having any thermal or nuclear power plant where water may be
consumed. Therefore, demand of water for power generation has been taken as nil.
4.6 Water demand
This section presents the total water demand of the district and has been calculated by
summing up all major sectors consuming water. The current water demand has been
indicated in Table 4.4 and the projected water demand has been depicted in Table 4.5.

44 | P a g e
Table 4.4: Present Water Demand of the district for various sectors (2015)
S.
No.
Block Components Total,
MCM Domestic Crop Livestock Industrial Power
generation
1 CHOTILA 6.10 259.03 8.75 273.88
2 CHUDA 6.27 168.79 0.83 175.89
3 DASADA 7.15 467.68 1.86 476.69
4 DHANGDHRA 0.52 452.85 2.26 455.63
5 LAKHATAR 4.64 182.55 0.79 187.98
6 LIMBADI 5.22 236.15 1.13 242.5
7 MULI 6.89 359.18 1.86 367.93
8 SAYALA 6.08 406.95 2.54 415.57
9 VADHAVAN 4.29 375.86 1.55 0.02 381.7
TOTAL 47.15 2909.04 21.56 0.02 0.00 2977.75
(Data for new block Thangadh not available)
The present water demand of the district has been assessed at 2977.77MCM annually,
with Dasada being the block with maximum water requirement (476.69 MCM).
Dhagandhara and Sayala blocks stand at 2nd and 3rd position with approximate
requirement of 455.63 MCM and 415.57 MCM.
Table 4.5: Total Water Demand of the district for various sectors (Projected for 2020)
S.
No.
Block Components Total,
MCM Domestic Crop Livestock Industrial Powergeneration
1 CHOTILA 6.59 259.03 10.09 275.71
2 CHUDA 6.78 168.79 0.95 176.52
3 DASADA 7.73 467.68 2.15 477.56
4 DHANGDHRA 0.57 452.85 2.60 456.02
5 LAKHATAR 5.01 182.55 0.91 188.47
6 LIMBADI 5.64 236.15 1.30 243.09
7 MULI 7.45 359.18 2.15 368.78
8 SAYALA 6.58 406.95 2.93 416.46
9 VADHAVAN 4.64 375.86 1.79 0.02 382.32
TOTAL 50.99 2909.04 24.87 0.02 0.00 2984.93
(Data for new block Thangadh not available)
During 2020, total water requirement of the district has been assessed at 2984.93
MCM. The projected requirement of the blocks is almost in the similar proportion to
present requirement.
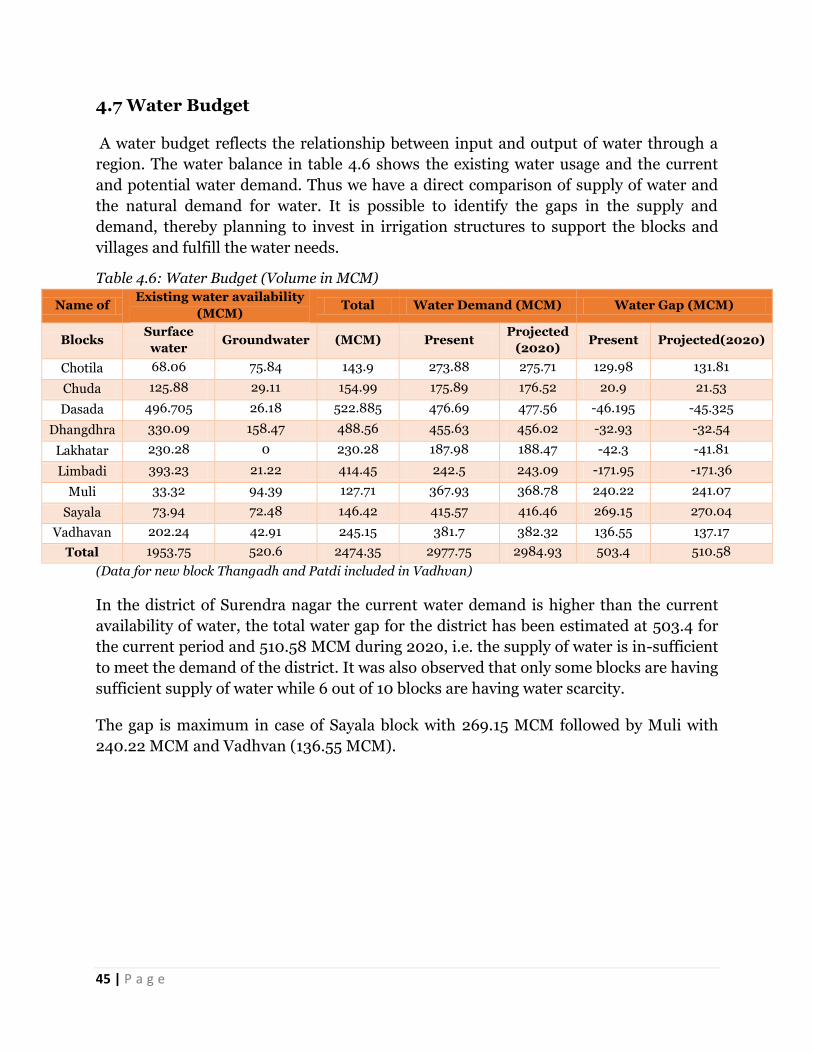
45 | P a g e
4.7 Water Budget
A water budget reflects the relationship between input and output of water through a
region. The water balance in table 4.6 shows the existing water usage and the current
and potential water demand. Thus we have a direct comparison of supply of water and
the natural demand for water. It is possible to identify the gaps in the supply and
demand, thereby planning to invest in irrigation structures to support the blocks and
villages and fulfill the water needs.
Table 4.6: Water Budget (Volume in MCM)
Name of Existing water availability
(MCM) Total Water Demand (MCM) Water Gap (MCM)
Blocks Surface
water Groundwater (MCM) Present
Projected
(2020) Present Projected(2020)
Chotila 68.06 75.84 143.9 273.88 275.71 129.98 131.81
Chuda 125.88 29.11 154.99 175.89 176.52 20.9 21.53
Dasada 496.705 26.18 522.885 476.69 477.56 -46.195 -45.325
Dhangdhra 330.09 158.47 488.56 455.63 456.02 -32.93 -32.54
Lakhatar 230.28 0 230.28 187.98 188.47 -42.3 -41.81
Limbadi 393.23 21.22 414.45 242.5 243.09 -171.95 -171.36
Muli 33.32 94.39 127.71 367.93 368.78 240.22 241.07
Sayala 73.94 72.48 146.42 415.57 416.46 269.15 270.04
Vadhavan 202.24 42.91 245.15 381.7 382.32 136.55 137.17
Total 1953.75 520.6 2474.35 2977.75 2984.93 503.4 510.58
(Data for new block Thangadh and Patdi included in Vadhvan)
In the district of Surendra nagar the current water demand is higher than the current
availability of water, the total water gap for the district has been estimated at 503.4 for
the current period and 510.58 MCM during 2020, i.e. the supply of water is in-sufficient
to meet the demand of the district. It was also observed that only some blocks are having
sufficient supply of water while 6 out of 10 blocks are having water scarcity.
The gap is maximum in case of Sayala block with 269.15 MCM followed by Muli with
240.22 MCM and Vadhvan (136.55 MCM).

46 | P a g e
CHAPTER 5. STRATEGIC ACTION PLAN FOR
IRRIGATION IN DISTRICT UNDER PMKSY
5.1 Year wise total Plan of the district:
Total plan for four years works out to be Rs. 235092 lakh (Table5.1).
Table 5.1: Summary of PMKSY plan District Surendra Nagar, Gujarat. (in Rs. Lakh)
Block Total Planning (Rs. In lacs)
2016-17 2017-18 2018-19 2019-20
A State Irrigation Department
Chuda 463.08 -- 33.89 256.81 149.06 23.31
Chotila 361.00 -- 40.00 170.00 108.00 43.00
Dhrangandhra 1446.50 -- 205.00 661.83 491.67 88.00
Limbdi 354.00 -- 13.75 129.75 153.75 56.75
Muli 569.60 -- 124.68 137.68 172.48 134.78
Dasada 124.00 -- 64.00 35.00 25.00 0.00
Wadhvan 775.40 -- 262.38 252.38 100.08 160.58
Sayla 988.39 -- 55.38 307.02 326.63 299.38
Lakhatar 60.00 -- 0.00 0.00 15.00 45.00
B GSWMA
Chuda 864.50 -- 617.22 247.28 0.00 0.00 Chotila 1620.42 -- 1027 328.48 137.12 127.82 Dhrangandhra 1931.38 -- 1753.8 177.58 0.00 0.00 Limbdi 625.28 -- 625.28 0.00 0.00 0.00 Muli 1600.74 -- 895.46 420.326 143.665 141.285 Dasada 2358.14 -- 1576.1 489.23 292.81 0.00 Wadhvan 299.85 -- 299.85 0.00 0.00 0.00 Sayla 1420.83 -- 877.52 271.54 136.51 135.26 Lakhatar 241.52 -- 241.52 0.00 0.00 0.00 Others 1839.68 -- 865.31 628.13 189.37 156.87 MGNREGA 900.58 -- 874.29 26.29
C GGRC
Chuda 1013.53 -- 311.85 233.89 233.89 233.89
Chotila 758.31 -- 233.33 175.00 175.00 175.00
Dhrangandhra 3270.96 -- 1006.45 754.84 754.84 754.84
Limbdi 411.50 -- 126.61 94.96 94.96 94.96
Muli 2967.96 -- 913.22 684.91 684.91 684.91
Dasada 2703.29 -- 831.78 623.84 623.84 623.84
Wadhvan 2903.05 -- 893.25 669.93 669.93 669.93
Sayla 1466.38 -- 451.19 338.40 338.40 338.40
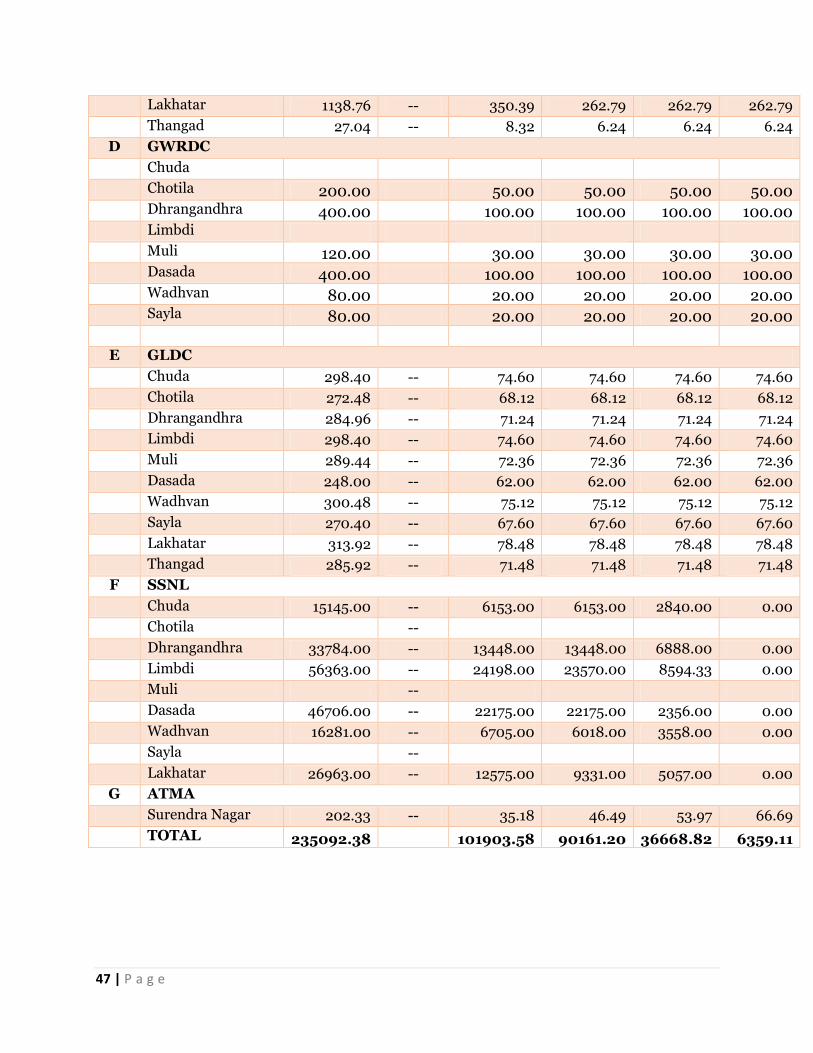
47 | P a g e
Lakhatar 1138.76 -- 350.39 262.79 262.79 262.79
Thangad 27.04 -- 8.32 6.24 6.24 6.24
D GWRDC
Chuda Chotila 200.00 50.00 50.00 50.00 50.00 Dhrangandhra 400.00 100.00 100.00 100.00 100.00 Limbdi Muli 120.00 30.00 30.00 30.00 30.00 Dasada 400.00 100.00 100.00 100.00 100.00 Wadhvan 80.00 20.00 20.00 20.00 20.00 Sayla 80.00 20.00 20.00 20.00 20.00 E GLDC
Chuda 298.40 -- 74.60 74.60 74.60 74.60
Chotila 272.48 -- 68.12 68.12 68.12 68.12
Dhrangandhra 284.96 -- 71.24 71.24 71.24 71.24
Limbdi 298.40 -- 74.60 74.60 74.60 74.60
Muli 289.44 -- 72.36 72.36 72.36 72.36
Dasada 248.00 -- 62.00 62.00 62.00 62.00
Wadhvan 300.48 -- 75.12 75.12 75.12 75.12
Sayla 270.40 -- 67.60 67.60 67.60 67.60
Lakhatar 313.92 -- 78.48 78.48 78.48 78.48
Thangad 285.92 -- 71.48 71.48 71.48 71.48
F SSNL
Chuda 15145.00 -- 6153.00 6153.00 2840.00 0.00
Chotila --
Dhrangandhra 33784.00 -- 13448.00 13448.00 6888.00 0.00
Limbdi 56363.00 -- 24198.00 23570.00 8594.33 0.00
Muli --
Dasada 46706.00 -- 22175.00 22175.00 2356.00 0.00
Wadhvan 16281.00 -- 6705.00 6018.00 3558.00 0.00
Sayla --
Lakhatar 26963.00 -- 12575.00 9331.00 5057.00 0.00
G ATMA
Surendra Nagar 202.33 -- 35.18 46.49 53.97 66.69
TOTAL 235092.38 101903.58 90161.20 36668.82 6359.11

48 | P a g e
5.2 Department wise plan
Analysis of PMKSY plan (Table5.2) for the period from 2016-17 to 2019-20 indicates
that SSNL has the maximum share of Rs 195242 lakh(84%). This is followed by GGRC
amounting to Rs. 16661 lakh (7.2%). GSWMA has its own structural arrangements
(GSWMA, District Watershed Development Unit, PIA, and Watershed Committee) from
state to village level for implementation of program and has system of internal
monitoring of project activities through different means. For preparation of DIP, the
watershed component information is collected from various levels and incorporated in
this document for the years 2016-20.
Table 5.2: Department-wise plan
SN Scheme Total 2016-17 2017-18 2018-19 2019-20
Fund Area Fund Area Fund Area Fund Area Fund Area
1 State Irrigation Department
5142 4720 799 345 1950 1736 1542 1517 851 1122
2 GSWMA-Water Shed
12802 10908 8779 7108 2563 3089 899 323 561 388
3 MGNREGA 901 - 874 - 26 - - - - -
3 GGRC 16661 37189 5126 11443 3845 8582 3845 8582 3845 8582
4 GWRDC 1280 520 320 130 320 130 320 130 320 130
5 GLDC 2862 6679 716 1670 716 1670 716 1670 716 1670
6 SSNL 195242 410380 85254 169452 80695 167696 29293 73233 0 0
7 ATMA 202 28855 35 4445 46 6835 54 7710 67 9865
Total 235092 499251 101904 194592 90161 189737 36669 93164 6359 21756
5.3 Component wise plan
As discussed above about various components of PMKSY, the plan is prepared
accordingly. Table 5.3 shows component wise plan for 4 years starting from 2016-17 to
2019-20. Hark Khet ko Pani components is Rs. 126879 lakh, which is to be executed
mainly by Panchayat irrigation Department. Accelerated Irrigation Benefits Programme
(AIBP) has the second highest allocation with Rs. 76367 lakh (32%) which shall be
executed by State Irrigation Department. Per drop more crop component of Rs.
17941lakh (07.60%) will be executed by GGRC. This component has two sub components
namely micro irrigation and supplementary water management activities. Total Rs.202
lakh has been proposed for extension and training purpose, which shall be undertaken
by ATMA. Watershed component will be taken care of by the Gujarat Watershed
Development Agency. However all the stakeholders need to have coordination among
them to have the maximum irrigation efficiency and to avoid duplication of efforts and
resources.

49 | P a g e
Table 5.3: Component wise plan (Amt in Rs. Lakh)
2016-17 2017-18 2018-19 2019-20 Total
Fund Area Area Area Area Area
AIBP 40221 62401 36146 61799 76367 124200
Har khet ko pani
46548 109066 47215 109303 31550 76419 1566 2791 126879 297579
Per drop more crop (Micro Irrigation)
5446 11573 4165 8712 4165 8712 4165 8712 17941 37709
PMKSY Watershed
8779 7108 2563 3089 899 323 561 387.65 12802 10908
MGNREGA 874 26 901 0
Capacity Building -ATMA
35 4445 46 6835 54 7710 67 9865 202 28855
Total 101904 194593 90161 189738 36669 93164 6359 21756 235092 499251
5.4 Block wise Plan
There are 10 blocks in Surendra Nagar district. Total PMKSY plan for four years is Rs.
235092 lakh. Block wise year wise plan is given in Table 5.4 .It is observed that the
maximum amount of Rs. 58376lakh is proposed for Limbdi block which is 25% of total
plan of the district. Fig. 5.1 shows the share of blocks in the plan.
Table 5.4: Block wise year wise PMKSY Plan of Surendra Nagar District
2016-17 2017-18 2018-19 2019-20 Total
CHUDA 7387 7043 3324 356 18110 CHOTILA 1615 869 565 488 3537 DHRANGANDHRA 16781 15291 8332 1038 41443 LIMBDI 25235 23947 8944 250 58376 MULI 2233 1423 1130 1087 5872 DASADA 25006 23562 3486 810 52864 WADHVAN 8452 7113 4450 950 20964 SAYLA 1668 1082 916 885 4551 LAKHATAR 13442 9750 5440 410 29042 THANGAD 83 82 83 84 333 Total 101904 90161 36669 6359 235092

50 | P a g e
Figure 5.1: Block wise share in PMKSY Plan of Surendra Nagar District
5.5 Monitoring and Evaluation
The Strategic Action Plan of PMKSY will be monitored by the respective departments
through the regular reporting system and component wise progress will be monitored by
the District Level Irrigation Committee. Further, the activities, outputs and outcomes
will be reported in web based MIS of PMKSY for review at state and national level. Some
of the key indicators that will be used to monitor and evaluate the progress of PMKSY
include:
Annual irrigation water supply per unit irrigated area measured as the ratio of
total volume of irrigation water supplied at intake divided by total area irrigated
in all seasons
Potential created and utilized measured as the ratio of total potential utilised
(measured crop area) to irrigation potential created
Output (agricultural production) per unit irrigated area measured as the ratio of
total value of agriculture production divided by the total irrigated area.
Output (agricultural production) per unit irrigation water supply measured as the
ratio of total value of agriculture production divided by the total volume of
irrigated water supplied.
Total Operations & Maintenance (O&M) cost per unit irrigated area measured as
the total Management, Operation and Maintenance (MOM) costs for the system
divided by total area irrigated (potential utilised).
CHUDA8% CHOTILA
1%
DHRANGANDHRA18%
LIMBDI25%
MULI2%
DASADA23%
WaADHVAN9%
SAYLA2% LAKHATAR
12%
THANGAD0%

51 | P a g e
Total Operations & Maintenance (O&M) cost per unit volume of water supplied
measured as total Management, Operation and Maintenance (MOM) costs for the
system divided Total volume of water supplied (all uses)
Equity performance measured as actual area irrigated in head, middle and tail
divided by Command area in head, middle and tail.
GSWMA has its own structural arrangements (GSWMA, District Watershed
Development Unit, PIA, and Watershed Committee) from state to village level for
implementation of program and has system of internal monitoring of project
activities through different means. GSWMA has its own web based monitoring
system as Soil Water Resource Management System (SWaRSys). The said system is
online and helps not only for the monitoring/documentation of all the main project
activities but also facilitates to collect and collate monthly and quarterly data from
District level offices.
5.6 Expected Output and Outcome:
As stated earlier the gross irrigated area in the district is 500107 hectare which is only
around 51% of 989969 hectare which is the gross cropped area. Further 17% of the total
agricultural net sown area of Surendra Nagar district falls in Dasada Block. The total
irrigated area under agriculture in Dasada block is 33% of the gross cropped area in the
district. Sayla, Muli blocks are leading blocks in terms of percentage irrigated land.
Currently the water requirement of crops for the existing cropping pattern works out to
be 1717.51 MCM and if the gross cropped area is to be brought under irrigated area, an
additional 1191.53 MCM of water potential is required to be created. Though the water
(surface and ground water) is available in the district yet it will not be feasible to create
irrigation potential to the extent of 100% as the construction of irrigation project may
not be economically viable even if it is technically feasible. Due to tough terrain, high
head, small and fragmented land holdings, per hectare cost may be very high. Moreover
it may not be feasible to develop all the sources within a short span of four years for
which the plan is being prepared.
Keeping in view the above constraints, a plan to develop additional command area
of 499251ha has been proposed under PMKSY Programme. Additional irrigation
potential of 433206 ha is likely to be generated though the programme over the period
of 4 years. Har Khet Ko Pani component of PMKSY comprising SSNNL and Water
Resource Department of Surendra Nagar district plan to cover additional area of 297579
Ha. Ground Water Department has proposed to bring additional irrigation area of 4720
ha under Har Khet ko Pani. It is proposed to improve irrigation potential by Repair,
Renovation & Restoration (RRR) of water bodies and Flow irrigation schemes tapping
surface water. Besides Water Harvesting structures along with ground water
development and recharge structure have also been proposed to create irrigation

52 | P a g e
potential by harvesting rainwater. Potential of 37709 ha is proposed to be covered under
PMKSY „Per Drop More Crop component‟ by GGRC and GWRDC.
PMKSY-Watershed Component (erstwhile named as Integrated Watershed
Management Programme) is one of the flagship program of Govt. of India. The main
objectives of this is to restore the ecological balance by harnessing, conserving and
developing degraded natural resources such as soil, vegetative cover and water. Gujarat
is one of the largest States in context of land area treatment under PMKSY-Watershed
project. The important activities carried out under this projects are Soil moisture
conservation, Water harvesting, Vegetative cover and Plantation, Agricultural
production and Productivity improvement, Dairy development, Agro processing,
Livelihood and Income Generating Activities etc. In Gujarat PMKSY-Watershed
component is implemented through a State Level Nodal Agency constituted as Gujarat
State Watershed Management Agency (GSWMA), an autonomous society supported
under the Rural Development Department (RDD) of Government of Gujarat. GSWMA
has vision of “Enhancing the quality of rural population through Sustainable, Equitable
and Participatory Natural resources Management” and also has Mission of “Creating
sustainable rural livelihoods through scientific and Integrated Watershed Development
Approach”. PMKSY watershed component of GSWMA proposes to develop a command
area of 10907.61 lakh ha of area during the next 4 years.
Further, these PMKSY projects are expected to generate non-recurring employment to
an extent of 2.87 crore mandays over the period of 4years that shall result in additional
income of approximately INR 49400 Lakh taking per manday rate of INR 178. Moreover
the additional command area of 433000ha planned to be brought under irrigation shall
generate an additional recurring employment of 1.86 Lakh jobs at the rate of 2.33 ha
average land holding by farmers. The PMKSY interventions are likely to generate an
additional income of Rs. 7794 lakh to the farmers of the district. This is based on the
assumption of at least 60% of potential utilised and Rs. 30,000 per ha incremental
income from rainfed to irrigated farming.
5.7 Suggestions
For successful implementation of PMKSY plan it is suggested that:
All the stakeholders should convene meeting of Panchayat samitis and then
finalise the village plan and prepare DPR.
Convergence of the programmes should be looked upon so as to avoid
duplication of projects.
The Department should supplement each other so that the maximum
irrigation efficiency is achieved.

53 | P a g e
Agriculture and Horticulture Department should take micro irrigation
projects in the command of minor irrigation projects completed or likely to be
completed in near future.
All the irrigation projects should have a component of water conveyance so
that the each drop of water is judiciously utilized.
Where ever feasible solar pump sets should be installed.
All the structures planned should be geo tagged and marked on map, so that
social monitoring of the projects can be conducted. This will also avoid the
duplicity.
Priority should be given to projects minimize the gap in potential created and
potential utilized.
Execution of the scheme should be expeditiously completed.
There should be smooth fund flow to timely complete the project.
***

54 | P a g e
Strategic Action plan for Irrigation in District under PMSKY
Concerned ministry/ department
Component Activity Total number/ capacity(cum )
Command area/ lrrigation potential (ha)
Period of implementation^/ 7 yrs)
Estimated cost (in rs. Lakh)
MOWR AIBP Major irrigation 453 124199 1-3 year 76367
MOWR Medium irrigation - - - -
MOWR Other works - - - -
MOWR HAR KHET KO PANI
Lift irrigation 81 32995.76 4yrs
MOWR Ground water development
2178
MOWR Rrr of water bodies
MOWR Construction of field channels
MOWR Lined field channels 33 46191 4 years 2964
MOWR Ugpl 4974 286181 1-2 years 118875
MOWR HAR KHET KO PANI
Farm pond and whs 1400 6678.64 4 years 2862
MOWR PER DROP MORE CROP (MICRO IRRIGATION)
Dpap drip 11288 18331 4 years 14995
MOWR Dpap sprinkler 7527 12041 4 years 1666
MOWR Non -dpap drip - - - -
MOWR Non -dpap sprinkler - - - -
MOWR Ggrc-tubewell with drip
26 520 4 years 1280
DOLR-MORD
PMKSY WATERSHED
Watershed 9412202 10907 4 years 12802
DOLR-MORD
CONVERGENCE WITH MGNREGA
Convergence with mgnrega
4 years 900
DORD-MORD
CAPACITY BUILDING -ATMA
2521 - 4 YEARS 202

55 | P a g e
Annexure
Department-wise, Year-wise Strategic Action Plan
1. Strategic Action Plan of Water Resource Department Rupees in Lakh
Components Work 2016-17
2017-18 2018-19 2019-20
Total
HKP Lift Irrigation/Groundwater Develop. /RRR of water bodies
339.88 895.21 616.80 325.88 2178
Other works 459.19 1055.25 924.86 524.91 2964
Total 799.07 1950.46 1541.66 850.79 5142
2. Strategic Action Plan for Sardar Sarovar Narmada Nigam Limited (SSNNL) Rupees in Lakh
Components Work 2016-17 2017-18 2018-19
2019-20
Total Comand Area (ha)
AIBP Major Irrigation Canal
40220.11 36146.5 0 0 76367 124199
HKP lining of field channel
45033.2
44548.52
29293
0 118875 286181
Total 85253.31
80695.02
29293
0 195242
410380
3. Strategic Action Plan for Gujarat Water Resource Development Corporation (GWRDC)
Rupees in Lakh
Components Work 2016-17 2017-18 2018-19 2019-20
Total Comand Area (ha)
HKP Tube Well with Drip
320 320 320 320 1280 520
4. Strategic Action Plan for Gujarat Land Development Corporation (GLDC) Rupees in Lakh
Components Work 2016-17 2017-18
2018-19
2019-20
Total Comand Area (ha)
HKP Farm pond 231.75 231.75 231.75 231.75 927 6678.72 Sim pond 220 220 220 220 880
Village Pond 182 182 182 182 728 WHS 81.75 81.75 81.75 81.75 327
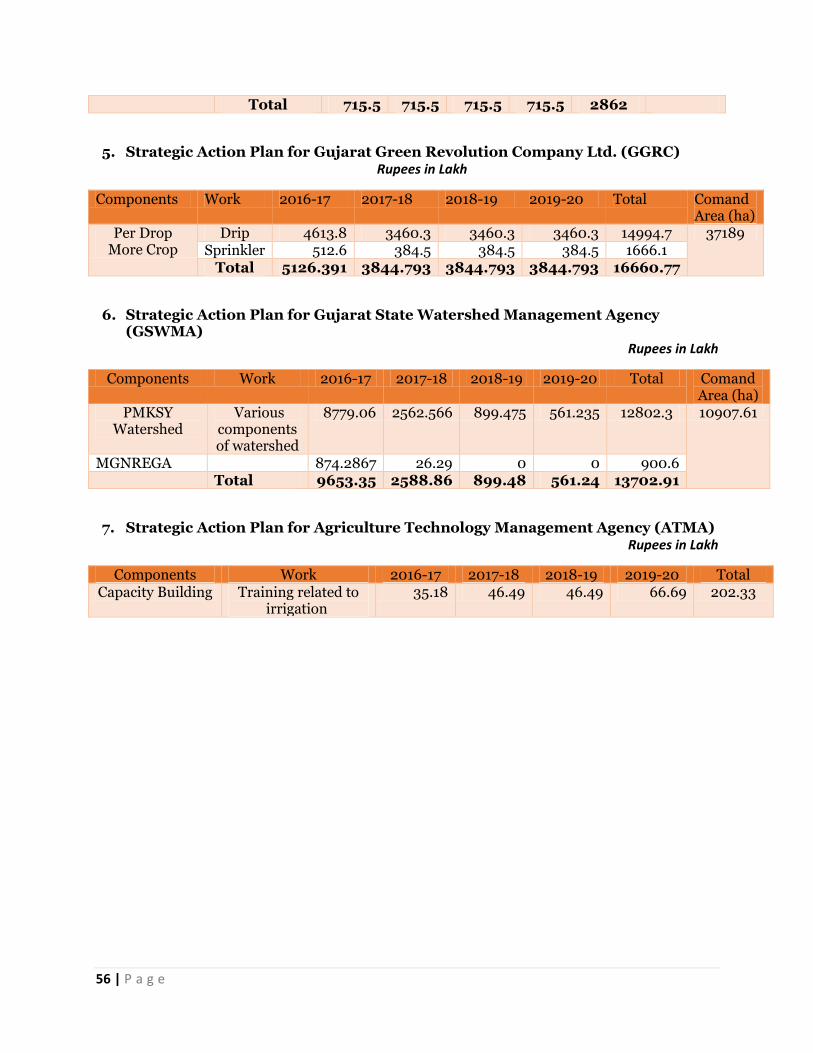
56 | P a g e
Total 715.5 715.5 715.5 715.5 2862
5. Strategic Action Plan for Gujarat Green Revolution Company Ltd. (GGRC) Rupees in Lakh
Components Work 2016-17 2017-18 2018-19 2019-20 Total Comand Area (ha)
Per Drop More Crop
Drip 4613.8 3460.3 3460.3 3460.3 14994.7 37189 Sprinkler 512.6 384.5 384.5 384.5 1666.1
Total 5126.391 3844.793 3844.793 3844.793 16660.77
6. Strategic Action Plan for Gujarat State Watershed Management Agency (GSWMA)
Rupees in Lakh
Components Work 2016-17 2017-18 2018-19 2019-20 Total Comand Area (ha)
PMKSY Watershed
Various components of watershed
8779.06 2562.566 899.475 561.235 12802.3 10907.61
MGNREGA 874.2867 26.29 0 0 900.6 Total 9653.35 2588.86 899.48 561.24 13702.91
7. Strategic Action Plan for Agriculture Technology Management Agency (ATMA) Rupees in Lakh
Components Work 2016-17 2017-18 2018-19 2019-20 Total Capacity Building Training related to
irrigation 35.18 46.49 46.49 66.69 202.33

57 | P a g e
head Name Of Scheme and Work Estimated
Amount ( In Lacs )
Planning ( Rs. In lacs)
District/Taluka 2016-17 2017-
18 2018-
19 2019-
20
A. Work Plan of Water Resource Department
Chuda taluka Har khet ko Pani Rangapur CD ta.Chuda 52 12 40 0 0
Har khet ko Pani chachka MI maintenance and repairing
5 0 0 3 2
Har khet ko Pani vejalki 2nd class MI scheme maintenance and repairing
4 0 0 2 2
Vansal Irri. Scheme.
Other Works Cleaning of Earthan dam of vansal Irri. Scheme. Minor Scheme Tal Chuda Dist. S'nagar
6.33 1.08 1.5 1.75 2
Other Works Desilting work of Reseavoir of vansal Irri. Scheme. Minor Scheme Tal Chuda Dist. S'nagar
34 9 8 9 8
Other Works ERM Work of Canal Network of Vansal Irri. Scheme
275 0 150 125 0
Other Works Strenthening of Earthen Dam of Vansal Irri. Scheme
35 0 35 0 0
Other Works Survey Work of Canal Section of Vansal Irri. Scheme
0.45 0.45 0 0 0
Other Works Survey Work of Earthen Dam profile work of Vansal Irri. Scheme
0.38 0.38 0 0 0
Other Works P.I.M. Work of Vansal Irrri. Scheme
2.62 2.62 0 0 0
Other Works Service Road on canal Network ofVansal irri. Scheme
15 0 15 0 0

58 | P a g e
Other Works Providing of Toilet Block on Dam site Vansal irri. Scheme
1.55 1.55 0 0 0
Other Works
Desilting of Canal Earth work & Minor repairing of canal for kharif/Ravi irri. Seasonof Vansal irri. Scheme Network &
14.5 2.5 3 4 5
Chotila taluka Har khet ko Pani Pipariyali CD ta.Chotila 100 0 30 50 20
Har khet ko Pani Kantharia CD Ta.Chotila 30 0 30 0 0
Har khet ko Pani Naliyeri CD ta.Chotila 40 0 40 0 0
Har khet ko Pani Zupada CD ta. Chotila 60 0 30 30 0
Other Works Repairing work of canal network of Morsal irrigation scheme
10 5 5 0 0
Other Works Lining work of minors of Morsal irrigation scheme
20 0 20 0 0
Har khet ko Pani Desilting work of reservoir of Dhari irrigation scheme
20 2.5 2.5 12.5 2.5
Har khet ko Pani Deepening work of pond-2 4 2 2 0 0
Har khet ko Pani moldi MI scheme maintenance and repairing
5 0 0 3 2
Har khet ko Pani chanpa MI scheme maintenance and repairing
4 0 0 0 2
Har khet ko Pani kundhada MI scheme maintenance and repairing
5 5 0 0 0
Har khet ko Pani mevasa MI scheme maintenance and repairing
5 0 5 0 0
Har khet ko Pani bamanbore MI scheme maintenance and repairing
5 0 5 0 0
Har khet ko Pani gadhechi MI scheme maintenance and repairing
7 0 0 7 0
Har khet ko Pani gunda MI scheme maintenance and repairing
3 0 0 0 3

59 | P a g e
Har khet ko Pani rampara(chobari) MI scheme maintenance and repairing
5 0 0 5 0
Har khet ko Pani bandiyabeli MI scheme maintenance and repairing
5 0 0 0 5
Har khet ko Pani vijaliya 2nd class MI scheme maintenance and repairing
4 0 0 0 4
Har khet ko Pani Sarsana 2nd class MI scheme maintenance and repairing
29 25 0 0 4
Than Taluka Har khet ko Pani bandiyabeli MI scheme maintenance and repairing
5.00 0.00 0.00 0.00 5.00
Har khet ko Pani vijaliya 2nd class MI scheme maintenance and repairing
4.00 0.00 0.00 0.00 4.00
Har khet ko Pani Sarsana 2nd class MI scheme maintenance and repairing
29.00 25.00 0.00 0.00 4.00
Dhrangadhra taluka
Har khet ko Pani Devachadi CD ta.Drangdhara 41.67 0 30 11.67 0
Har khet ko Pani Methan-1 CD Ta. Dhrandhara 59.83 20 39.83 0 0
Har khet ko Pani Methan-2 CD Ta. Dhrandhara 50 25 25 0 0
Har khet ko Pani Bavali CD ta.Drangadhra 75 15 50 10 0
Har khet ko Pani Rayagadh -1 CD ta. Dhrangadhara
60 0 30 30 0
Har khet ko Pani Rayagadh -2 CD ta. Dhrangadhara
30 0 30 0 0
Har khet ko Pani Rayagadh- Lu. Ta. Dhranagadhara
35 0 15 20 0
Har khet ko Pani Satapar-1 CD ta.Dhrangadhara 45 0 20 25 0
Har khet ko Pani Sajjanapar CD ta. Dhrangadhara 35 15 20 0 0
Har khet ko Pani Satapar-2 CD ta.Dhrangadhara 35 0 20 15 0
Har khet ko Pani Juna Ghansyamagadh CD ta.Dhrangadhara
40 0 20 20 0
Other Works RRR Work & Structure Strenghning Falku M I
75 12 14 15 16

60 | P a g e
Other Works Desilting of Dam Falku M I 87 12 15 18 20
Other Works Pond Deepning Fulku M I 12 2 2 2 3
Other Works Strenghning of Dam Falku M I 650 80 270 270 17
Other Works Canal Maintanance Falku M I 30 3 5 6 8
Har khet ko Pani gujarvadi MI scheme maintenance and repairing
9 0 4 5 0
Har khet ko Pani vavdi MI scheme maintenance and repairing
5 0 5 0 0
Har khet ko Pani bharada 2nd class MI scheme maintenance and repairing
9 0 6 3 0
Har khet ko Pani kankavati MI scheme maintenance and repairing
15 5 5 5 0
Har khet ko Pani ghanshyam gadh MI maintenance and repairing
12 0 4 4 4
Har khet ko Pani Satapar MI maintenance and repairing
10 0 5 5 0
Har khet ko Pani Sarval 2nd class scheme maintenance and repairing
14 0 5 5 4
Har khet ko Pani Chandrabhaga MI maintenance and repairing
12 0 6 6 0
Limbdi taluka Har khet ko Pani Limadi (Bodia) CD ta.Limadi 123 0 50 73 0
Har khet ko Pani Sauka CD ta. Limbadi 56 0 16 30 10
Har khet ko Pani Umedpar/Siyani CD ta.Limbadi 130 10 60 40 20
Har khet ko Pani gedi MI scheme maintenance and repairing
15 0 0 7 8
Har khet ko Pani liyad 2nd class MI sheme maintenance and repairing
10 0 0 0 5
Har khet ko Pani kataria 2nd class MI sceme maintenance and repairing
10 0 0 0 5
Har khet ko Pani ranagadh MI scheme maintenance and repairing
10 0 0 0 5
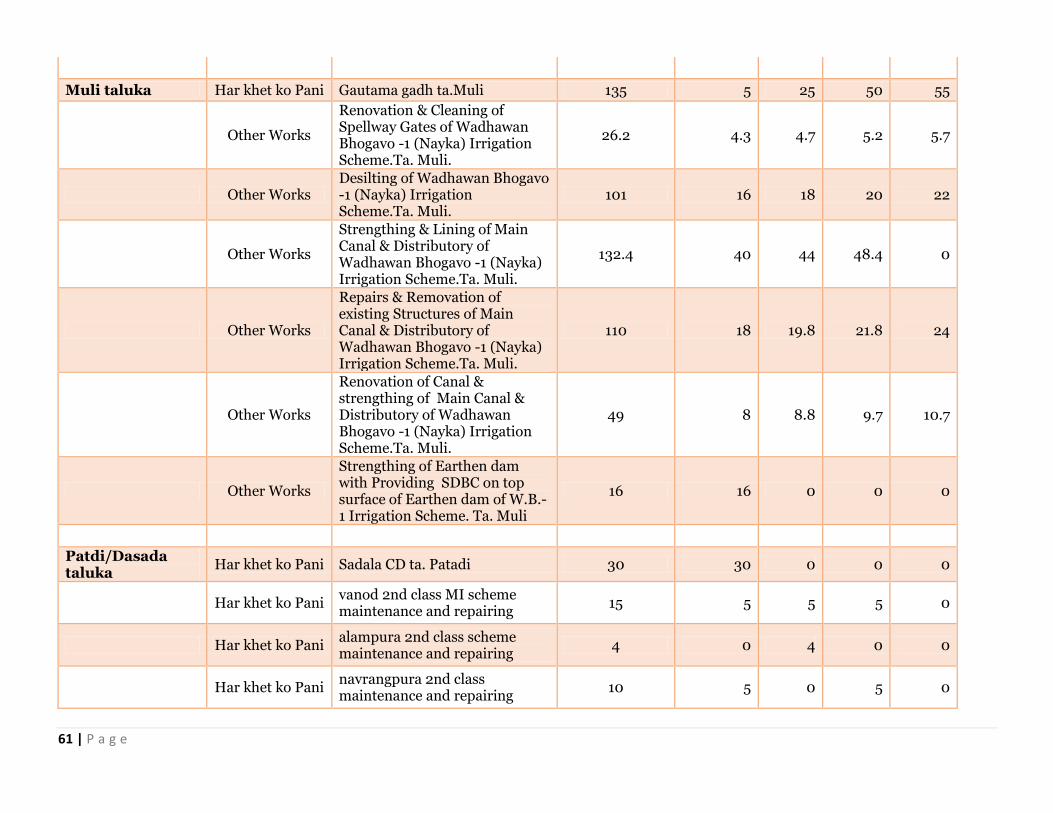
61 | P a g e
Muli taluka Har khet ko Pani Gautama gadh ta.Muli 135 5 25 50 55
Other Works
Renovation & Cleaning of Spellway Gates of Wadhawan Bhogavo -1 (Nayka) Irrigation Scheme.Ta. Muli.
26.2 4.3 4.7 5.2 5.7
Other Works Desilting of Wadhawan Bhogavo -1 (Nayka) Irrigation Scheme.Ta. Muli.
101 16 18 20 22
Other Works
Strengthing & Lining of Main Canal & Distributory of Wadhawan Bhogavo -1 (Nayka) Irrigation Scheme.Ta. Muli.
132.4 40 44 48.4 0
Other Works
Repairs & Removation of existing Structures of Main Canal & Distributory of Wadhawan Bhogavo -1 (Nayka) Irrigation Scheme.Ta. Muli.
110 18 19.8 21.8 24
Other Works
Renovation of Canal & strengthing of Main Canal & Distributory of Wadhawan Bhogavo -1 (Nayka) Irrigation Scheme.Ta. Muli.
49 8 8.8 9.7 10.7
Other Works
Strengthing of Earthen dam with Providing SDBC on top surface of Earthen dam of W.B.-1 Irrigation Scheme. Ta. Muli
16 16 0 0 0
Patdi/Dasada taluka
Har khet ko Pani Sadala CD ta. Patadi 30 30 0 0 0
Har khet ko Pani vanod 2nd class MI scheme maintenance and repairing
15 5 5 5 0
Har khet ko Pani alampura 2nd class scheme maintenance and repairing
4 0 4 0 0
Har khet ko Pani navrangpura 2nd class maintenance and repairing
10 5 0 5 0
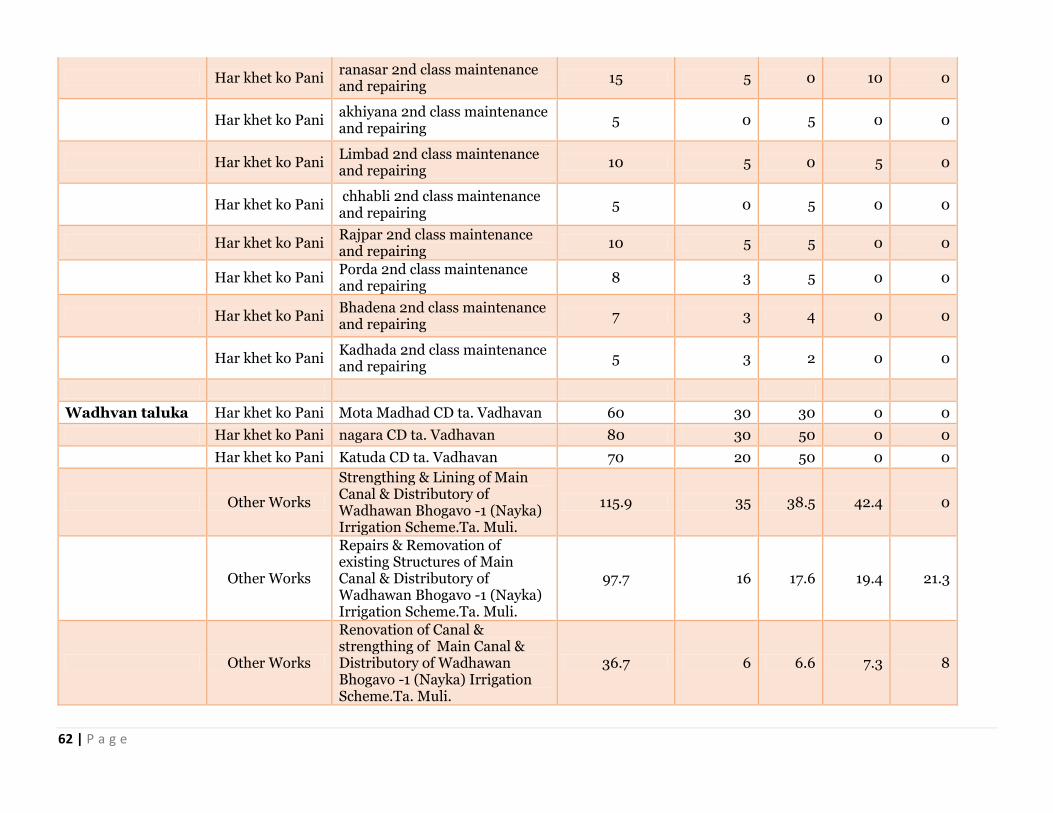
62 | P a g e
Har khet ko Pani ranasar 2nd class maintenance and repairing
15 5 0 10 0
Har khet ko Pani akhiyana 2nd class maintenance and repairing
5 0 5 0 0
Har khet ko Pani Limbad 2nd class maintenance and repairing
10 5 0 5 0
Har khet ko Pani chhabli 2nd class maintenance and repairing
5 0 5 0 0
Har khet ko Pani Rajpar 2nd class maintenance and repairing
10 5 5 0 0
Har khet ko Pani Porda 2nd class maintenance and repairing
8 3 5 0 0
Har khet ko Pani Bhadena 2nd class maintenance and repairing
7 3 4 0 0
Har khet ko Pani Kadhada 2nd class maintenance and repairing
5 3 2 0 0
Wadhvan taluka Har khet ko Pani Mota Madhad CD ta. Vadhavan 60 30 30 0 0
Har khet ko Pani nagara CD ta. Vadhavan 80 30 50 0 0
Har khet ko Pani Katuda CD ta. Vadhavan 70 20 50 0 0
Other Works
Strengthing & Lining of Main Canal & Distributory of Wadhawan Bhogavo -1 (Nayka) Irrigation Scheme.Ta. Muli.
115.9 35 38.5 42.4 0
Other Works
Repairs & Removation of existing Structures of Main Canal & Distributory of Wadhawan Bhogavo -1 (Nayka) Irrigation Scheme.Ta. Muli.
97.7 16 17.6 19.4 21.3
Other Works
Renovation of Canal & strengthing of Main Canal & Distributory of Wadhawan Bhogavo -1 (Nayka) Irrigation Scheme.Ta. Muli.
36.7 6 6.6 7.3 8

63 | P a g e
Other Works
Renovation & Cleaning of Spellway Wadhawan Bhogavo -2 (Dholidhaja) Irrigation Scheme.Ta. Wadhawan.
16.1 2.6 2.9 3.2 3.5
Other Works
Strengthing of Earthen dam with Providing BSG & SDBC on top surface of Earthen dam of W.B.-2 Irrigation Scheme. Ta. Wadhawan.
170 70 0 0 100
Other Works Repairs to Spill Way of W.B.-2 Irrigation Scheme. Ta. Wadhawan.
84 40 44 0 0
Har khet ko Pani gundiyala MI scheme maintenance and repairing
15 0 0 0 0
Har khet ko Pani kholadiyad 2nd class MI scheme maintenance and repairing
15 0 0 0 15
Har khet ko Pani baldana 2nd class MI scheme maintenance and repairing
15 0 0 15 0
Sayla taluka Nimbhani irrigation scheme
Other Works Repairing work of Generator room of Nimbhani irrigation scheme
13 5 8 0 0
Other Works Repairing work of canal network of Nimbhani irrigation scheme
15 0 5 10 0
L.B.-1 Irri. Scheme.
Har khet ko Pani Cleaning of Earthan dam of LB-1Irri. Scheme. Scheme Tal SaylaDist. S'nagar
14.86 2.36 2.75 3 3.25
Har khet ko Pani Desilting work of Reseavoir of L.B.-1 Irri. Scheme. Minor Scheme Tal Sayla Dist. S'nagar
131 20 26 27 28
Other Works ERM Work of Canal Network of LB-1 Irri. Scheme
685 0 241 240 204

64 | P a g e
Har khet ko Pani Providing up and down step of limbdi Bhogavo 1 irrigation scheme
4.84 4.84 0 0 0
Other Works P.I.M. Work of Limbdi Bhogavo-1 Irrri. Scheme
10.14 4 6.14 0 0
Har khet ko Pani Providing of service Road on canal Network Of LB-1 Irrigation Scheme
45 0 0 0 45
Har khet ko Pani Providing Of Toilet Block on Dam site LB-1 irri. Scheme
1.55 1.55 0 0 0
Har khet ko Pani
Desilting of Canal Earth work & Minor repairing of canal for kharif/Ravi irri. Seasonof Limbdi bhogavo-1 irri. Scheme Network &
40 7 7.5 8 8.5
Har khet ko Pani ratadki MI scheme maintenance and repairing
5 0 0 5 0
Har khet ko Pani nagadka 2nd class MI scheme maintenance and repairing
5 0 0 5 0
Har khet ko Pani sorimbhada 2nd class MI scheme maintenance and repairing
5 0 0 5 0
Har khet ko Pani adala 2nd class MI scheme maintenance and repairing
5 0 0 5 0
Har khet ko Pani chorvira MI scheme maintenance and repairing
8 0 0 8 0
Lakhatar taluka Har khet ko Pani sarghara MI sceme maintenance and repairing
15 0 0 15 0
Har khet ko Pani sakar MI sceme maintenance and repairing
15 0 0 0 15
Har khet ko Pani lilapur 2nd class MI scheme maintenance and repairing
15 0 0 0 15

65 | P a g e
Har khet ko Pani kalyanpara 2nd class MI sceme maintenance and repairing
15 0 0 0 15
B. Work Plan- Gujarat Watershed Management Agency (GWSMA)
Wadhwan
WaterShed excluding
MGNREGA Watershed Development
299.85 299.85 0 0 0
Lakhtar 241.52 241.52 0 0 0
Chuda 864.5 617.22 247.28 0 0
Dhrangdhra 1931.38 1753.8 177.58 0 0
Limbdi 625.28 625.28 0 0 0
Muli 1600.736 895.46 420.326 143.665 141.285
Chotila 1620.42 1027 328.48 137.12 127.82
Sayla 1420.83 877.52 271.54 136.51 135.26
Patdi 2358.14 1576.1 489.23 292.81
Other components
1839.68 865.31 628.13 189.37 156.87
C. Work Plan of Gujarat Green Revolution Company (GGRC)
Chotila Per Drop More Crop
Drip Irrigation
209.99 157.5 157.5 157.5
Chuda Per Drop More Crop
Drip Irrigation
280.67 210.5 210.5 210.5
Dasada Per Drop More Crop
Drip Irrigation
748.6 561.45 561.45 561.45
Dhangadhra Per Drop More Crop
Drip Irrigation
905.8 679.35 679.35 679.35
Lakhtar Per Drop More Crop
Drip Irrigation
315.35 236.51 236.51 236.51
Limbdi Per Drop More Crop
Drip Irrigation 370.35 113.95 85.46 85.46 85.46
Muli Per Drop More Drip Irrigation 2671.17 821.9 616.42 616.42 616.42

66 | P a g e
Crop
Sayla Per Drop More Crop
Drip Irrigation 1319.74 406.07 304.56 304.56 304.56
Thangadh Per Drop More Crop
Drip Irrigation 24.34 7.49 5.62 5.62 5.62
Vadhvan Per Drop More Crop
Drip Irrigation 2612.74 803.92 602.94 602.94 602.94
Chotila Per Drop More Crop
Sprinkler Irrigation 75.83 23.33 17.5 17.5 17.5
Chuda Per Drop More Crop
Sprinkler Irrigation 101.35 31.19 23.39 23.39 23.39
Dasada Per Drop More Crop
Sprinkler Irrigation 270.33 83.18 62.38 62.38 62.38
Dhangadhra Per Drop More Crop
Sprinkler Irrigation 327.1 100.64 75.48 75.48 75.48
Lakhtar Per Drop More Crop
Sprinkler Irrigation 113.88 35.04 26.28 26.28 26.28
Limbdi Per Drop More Crop
Sprinkler Irrigation 41.15 12.66 9.5 9.5 9.5
Muli Per Drop More Crop
Sprinkler Irrigation 296.8 91.32 68.49 68.49 68.49
Sayla Per Drop More Crop
Sprinkler Irrigation 146.64 45.12 33.84 33.84 33.84
Thangadh Per Drop More Crop
Sprinkler Irrigation 2.7 0.83 0.62 0.62 0.62
Vadhvan Per Drop More Crop
Sprinkler Irrigation 290.3 89.32 66.99 66.99 66.99
D. Gujarat Water Resource Development Corporation
Dasada Per Drop more crop
New Tubewell with Drip 400 100 100 100 100
Dhangadhra Per Drop more crop
New Tubewell with Drip 400 100 100 100 100
Vadhavan Per Drop more crop
New Tubewell with Drip 80 20 20 20 20
Chotila Per Drop more crop
New Tubewell with Drip 200 50 50 50 50
Muli Per Drop more crop
New Tubewell with Drip 120 30 30 30 30

67 | P a g e
Sayala Per Drop more crop
New Tubewell with Drip 80 20 20 20 20
E. Gujarat State Land Development Corporation
Chuda Har Khet ko Pani
Farm pond 98.56 24.64 24.64 24.64 24.64
Sim pond 80 20 20 20 20
Village pond 84 21 21 21 21
WHS 35.84 8.96 8.96 8.96 8.96
Chotila Har Khet ko Pani
Farm pond 89.6 22.4 22.4 22.4 22.4
Sim pond 100 25 25 25 25
Village pond 56 14 14 14 14
WHS 26.88 6.72 6.72 6.72 6.72
Thangadh Har Khet ko Pani
Farm pond 94.08 23.52 23.52 23.52 23.52
Sim pond 100 25 25 25 25
Village pond 56 14 14 14 14
WHS 35.84 8.96 8.96 8.96 8.96
Dasada Har Khet ko Pani
Farm pond 80.64 20.16 20.16 20.16 20.16
Sim pond 80 20 20 20 20
Village pond 56 14 14 14 14
WHS 31.36 7.84 7.84 7.84 7.84
Dhagadhra Har Khet ko Pani
Farm pond 89.6 22.4 22.4 22.4 22.4
Sim pond 80 20 20 20 20
Village pond 84 21 21 21 21
WHS 31.36 7.84 7.84 7.84 7.84
Muli Har Khet ko Pani
Farm pond 98.56 24.64 24.64 24.64 24.64
Sim pond 80 20 20 20 20
Village pond 84 21 21 21 21
WHS 26.88 6.72 6.72 6.72 6.72

68 | P a g e
Lakhtar Har Khet ko Pani
Farm pond 94.08 23.52 23.52 23.52 23.52
Sim pond 100 25 25 25 25
Village pond 84 21 21 21 21
WHS 35.84 8.96 8.96 8.96 8.96
Limbadi Har Khet ko Pani
Farm pond 98.56 24.64 24.64 24.64 24.64
Sim pond 80 20 20 20 20
Village pond 84 21 21 21 21
WHS 35.84 8.96 8.96 8.96 8.96
Vadhvan Har Khet ko Pani
Farm pond 80.64 20.16 20.16 20.16 20.16
Sim pond 100 25 25 25 25
Village pond 84 21 21 21 21
WHS 35.84 8.96 8.96 8.96 8.96
Sayla Har Khet ko Pani
Farm pond 103.04 25.76 25.76 25.76 25.76
Sim pond 80 20 20 20 20
Village pond 56 14 14 14 14
WHS 31.36 7.84 7.84 7.84 7.84
E. Sardar Sarovar Narmada Nigam Ltd. (SSNNL)
Dasada AIBP Major Irrigation 4474 2237 2237
Dasada Har Khet ko Pani
Construction of field Channels 28884.8 14442.4 14442.4
Wadhavan AIBP Major Irrigation 4921 2460 2460
Dhrangadhra AIBP Major Irrigation 13119 6559.5 6559.5
Limbdi AIBP Major Irrigation 29885 14943 14943
Lakhtar AIBP Major Irrigation 6988 3494 3494
Dasada AIBP Major Irrigation 6279 3139.5 3139.5
Chuda AIBP Major Irrigation 6626 3313 3313
Wadhavan Har Khet ko Pani
UGPL 10674 3558 3558 3558

69 | P a g e
Dhrangadhra Har Khet ko Pani
UGPL 20664.4 6888.13 6888.1 6888.1
Limbdi Har Khet ko Pani
UGPL 25783.2 8594.4 8594.4 8594.4
Lakhtar Har Khet ko Pani
UGPL 15171.2 5057.07 5057.1 5057.1
Dasada Har Khet ko Pani
UGPL 7067.6 2355.87 2355.9 2355.9
Chuda Har Khet ko Pani
UGPL 8518.8 2839.6 2839.6 2839.6
Lakhtar AIBP Major Irrigation 3114.8 3114.8
Limbadi/dasada AIBP Major Irrigation 272.64 272.64
Wadhvan AIBP Major Irrigation 686.17 686.17
Lakhtar Har Khet ko Pani
Lined Field Channels 1689.24 909.3 779.94
Limbadi/dasada Har Khet ko Pani
Lined Field Channels 421.68 388.5 33.18
GSWMA:
Sr.No Activity Unit Physical Target for FY (2016-17)

70 | P a g e
SURENDRANAGAR
Unit Cost (In Lakhs)
Storage Volume (Cubic Meter)
Command
Area/ Irrigati
on Potential (Ha.)
Person days/Mandays Planned
Convergence
Unit Amount
(In Lakhs)
Name of Schemes
1 Animal camp No. 125 82.41 0 0 0 0 0.00
2 Animal water trough (Havada)
No. 1 3.10 0 0 0 0 0.00
3 Causeway on connecting roads
No. 6 28.84 0 0 22 3 4.80 Panchayat
4 Check / Protection wall No. 1 3.54 0 0 1313 0 0.00
5
Demonstration for Agricultural / Animal Husbandry Productivity Enhancement
No. 0 0.00 0 0 0 0 0.00
6 Drainage line correction (To prevent flooding of Gamtal)
rmt 5 13.34 0 0 2100 2 2.51 Panchayat
7 Drinking water facility No. 12 29.21 900 1254 0 0.00
8 Fencing for protection from wild animals
rmt. 0 0.00 0 0 0 0 0.00
9 Grassland/Gauchar Development
Ha. 0 0.00 0 0 0 0 0.00
10 Improvised and energy efficient smashan gruh (Cemetery )
No. 0 0.00 0 0 0 0 0.00
12 Panchayat Well Repair & Pump Room
No. 1 0.53 0 0 272 0 0.00
13 Rain water harvesting system
No. 155 70.49 102140 38836 0 0.00

71 | P a g e
14 Recharge / Repair of open wells
No. 51 24.54 0 0 4505 0 0.00
15 Repair / development of artificial water bodies
No. 0 0.00 0 0 0 0 0.00
16 Revival of natural water bodies with recharge activities
No. 1 2.00 0 0 411 253 6.36 MGNREG
A
17 Sanitation facilities/Sewerage line
rmt 1 1.37 0 0 0 0 0.00
18 Use solar power for productive activities
No. 0 0.00 0 0 0 0 0.00
19 Wind energy development
No. 0 0.00 0 0 0 0 0.00
20 OTHERS (Specifiy activities )
0 0
21 CULVERT No. 1 3.59 0 0 0 1 2.95 Panchayat
22 Inlet Gutter No. 0 0.00 0 0 0 0 0.00
23 Repairing of waste weir No. 1 2.44 0 0 640 0 0.00
24 Tree protection Otta No. 1 0.82 0 0 421 0 0.00
25 Road Repairing No. 0 0.01 0 0 0 0 0.00
26 Washing Ghat Repairing No. 0 0.00 0 0 0 0 0.00
27 Snanghat No. 0 0.00 0 0 0 1 2.50 Panchayat
28 Gate No. 0 0.00 0 0 0 1 2.40 Panchayat
0
0 Land Development 0 0 0.00 0 0 0 0 0.00
1 Farm Bunding rmt. 222914 645.91 245278 226810 89474 69.69 GLDC,
MGNREGA
2 Afforestation Ha. 127 217.09 0 0 20065 16 31.95
3 Agriculture Demo No. 15 2.00 0 0 0 0 0.00
4 Agro Forestry Ha. 834 119.82 0 0 5846 0 0.00
5 Horticulture Ha. 530 34.28 0 0 105 10 1.50
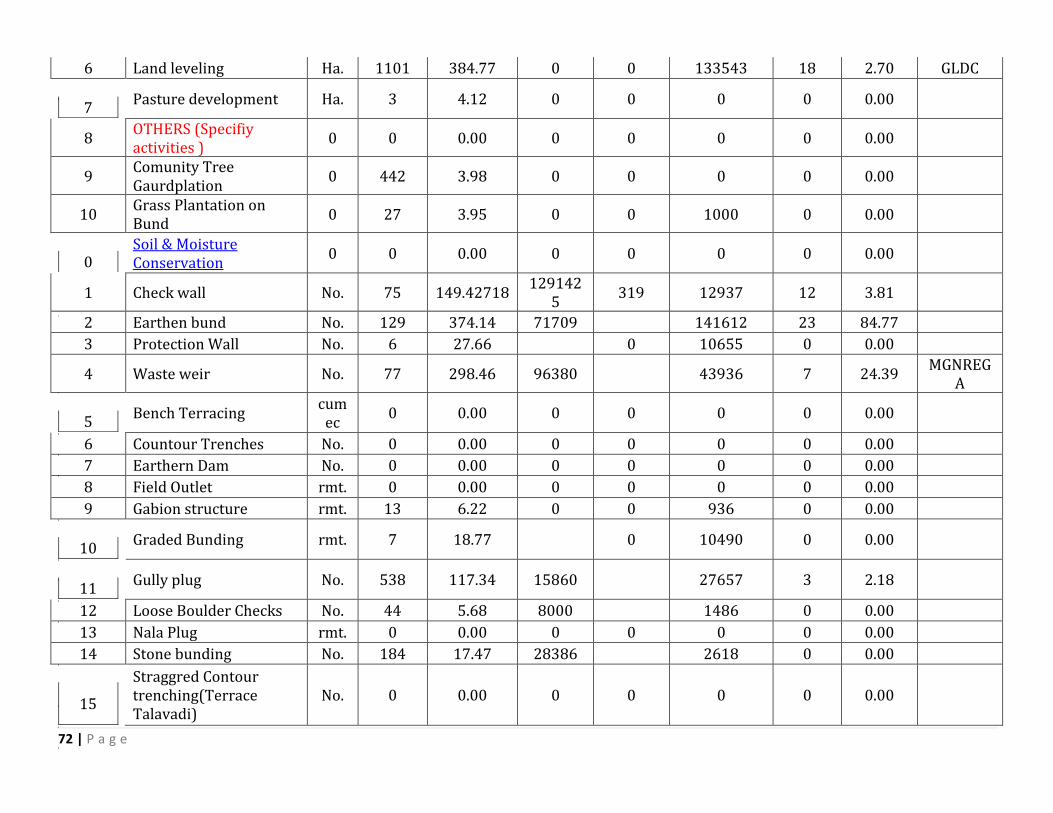
72 | P a g e
6 Land leveling Ha. 1101 384.77 0 0 133543 18 2.70 GLDC
7
Pasture development Ha. 3 4.12 0 0 0 0 0.00
8 OTHERS (Specifiy activities )
0 0 0.00 0 0 0 0 0.00
9 Comunity Tree Gaurdplation
0 442 3.98 0 0 0 0 0.00
10 Grass Plantation on Bund
0 27 3.95 0 0 1000 0 0.00
0
Soil & Moisture Conservation
0 0 0.00 0 0 0 0 0.00
1 Check wall No. 75 149.42718 129142
5 319 12937 12 3.81
2 Earthen bund No. 129 374.14 71709 141612 23 84.77
3 Protection Wall No. 6 27.66 0 10655 0 0.00
4 Waste weir No. 77 298.46 96380 43936 7 24.39 MGNREG
A
5
Bench Terracing cum
ec 0 0.00 0 0 0 0 0.00
6 Countour Trenches No. 0 0.00 0 0 0 0 0.00
7 Earthern Dam No. 0 0.00 0 0 0 0 0.00
8 Field Outlet rmt. 0 0.00 0 0 0 0 0.00
9 Gabion structure rmt. 13 6.22 0 0 936 0 0.00
10
Graded Bunding rmt. 7 18.77 0 10490 0 0.00
11
Gully plug No. 538 117.34 15860 27657 3 2.18
12 Loose Boulder Checks No. 44 5.68 8000 1486 0 0.00
13 Nala Plug rmt. 0 0.00 0 0 0 0 0.00
14 Stone bunding No. 184 17.47 28386 2618 0 0.00
15
Straggred Contour trenching(Terrace Talavadi)
No. 0 0.00 0 0 0 0 0.00

73 | P a g e
16 OTHERS (Specifiy activities )
No. 0
17 Peripheral Earthen Bund
rmt. 0 0.00 0 0 0 0 0.00
18 FLOW CHANNEL No. 5 16.41 0 0 5766 0 0.00
19 Earhen Canal No. 0 0.01 0 0 0 0 0.00
20
Farm Masonary Outlet No. 29 5.47 0 0 3073 0 0.00
21 Ground Trench No. 20333 7.79 0 0 4376 0 1.53
22 Sleb Culvert No. 0
23 Soakpit No. 0 0.00 0 0 0 675 16.94
24 Water Inlet Gutter No. 0 0.00 0 0 0 0 0.00
25 New Pond with Waste weir
No. 1 7.78 0 0 0 0 0.00
26 Inlet Gutter No. 2 4.24 0 0 2845 6 13.71
0
0 Water Harvesting Structure
0 0 0.00 0 0 0 0 0.00
1 Cause way cum Chek dam
No. 86 310.77365 756284 629 52028.667 1.5 5.25
2
Check dam No. 371 1294.8526
25 276024
0 3857 213098.33 5 18.06
3
Village/Community Pond
No. 74 274.28571
17 214304 237 48392 22.5 79.856
4 Farm Pond No. 752 262.73166
67 311970 409 89868.232 461
73.796667
5 Percolation Tank No. 12 30.07 7350 5259 6 3.43
6 Pond Inlet No. 14 58.98 0 0 7000 0 0.00
7 Pond Outlet No. 35 108.58 116816 30468 0 0.00
8
OTHERS (Specifiy activities )
No. 33 20.74 0 0 0 0 0.00
9 Causeway No. 0 0.51 0 0 0 0 0.00

74 | P a g e
10 Farm Masonary Outlet No. 29 5.47 0 0 3073 0 0.00
11 Ground Trench No. 20333 7.79 0 0 4376 0 1.53
12 Sleb Culvert No. 0 0.00 0 0 0 0 0.00
0
0
0
0
Existing/Old Water Harvesting Structure Maintance (Renovation & Repair)
0 0 0.00 0 0 0 0 0.00
1 Deepening/Desiltation Of Pond
No. 127 446.41895
17 124231
4 1641 144855.02
32.33333
122.413
2 Deepening Of Percolation Tank
No. 4 11.38 49824 11 720 3 12.01 0
3 Desiltation of Checkdam No. 1 4.0829 0 0 0 0 0 0
4 Repairing of Checkdam No. 4 11.076666
67 33012 4 1892.3333 0 0 0
5 Repairing of waste weir No. 1 2.44 0 0 640 0 0.00
6 Causway Reparing No. 0 0.00 0 0 0 0 0.00
7
Deepening Gutter No. 4 11.38 0 0 0 3 12.01
Ground Water Recharging Structures
0 0 0.00 0 0 0 0 0.00
1 Dugwell Recharge No. 85 24.59 0 0 2400 27 4.59
2 Farm Recharge Filter No. 0 0.00 0 0 0 0 0.00
3
Holiya in farm/Field No. 0 0.00 0 0 0 0 0.00
4
Pond Recharge structure
No. 0 0.00 0 0 0 0 0.00
5 Retaining wall No. 0 0.00 0 0 0 0 0.00
6 Irrigation well No. 0 0.00 0 0 0 5 6.25

75 | P a g e
7 Under Ground Dyke No. 0 46.01 0 0 0 0 0.00
8
Recharge Bore wells No. 70 18.47 0 0 0 70 18.47
0 0.00 0 0 0 0 0.00
S.No Sub Activity Name 0 0 0.00 0 0 0 0 0.00
1
AGRICULTURE ACTIVITIES
No. 6926 1082.64 0 0 8984 1477 731.77
GGRC & Horti. Dept.
MGNREGA, Self
contribution
2 AGRO PROCESSING ACTIVITIES
No. 462 234.45 0 0 0 65 9.38
3 Animal Husbandry No. 1658 579.91 0 0 7377 132 34.73
Horti. Dept.
MGNREGA
4 Establishing linkages No. 4 4.18 0 0 0 0 0.00
5 Local traditional handicraft
No. 52 20.26 0 0 340 3 1.30
6 Minor Activities No. 239 282.23 0 0 140 38 14.05
7 Non0conventional Energy Sources
No. 70 20.47 0 0 340 25 3.90
Capacity Building, Monitoring & Evaluation
No. 0 78.00
Administration No. 0 514.29
Consolidation phase No. 0 273.02
Total 279244.
48 8779.06
7352191.50
7108.12 1326782.46 92879.8
4 1427.47 0.00

76 | P a g e
Sr.No
Activity SURENDRANAG
AR
Unit
Physical Target for FY (2017-18)
Unit Cost (In Lakhs)
Storage Volume (Cubic Meter)
Command Area/ Irrigatio
n Potential (Ha.)
Person days/Mandays Planned
Convergence
Unit Amount
(In Lakhs)
Name of
Schemes
1 Animal camp No. 40 15.60 0 0 0 0 0
2 Animal water trough (Havada)
No. 1 1.00 0 0 0 0 0
3 Causeway on connecting roads
No. 1 7.64 0 0 565 2 5
4 Check / Protection wall No. 1 3.90 0 0 350 1 1
5
Demonstration for Agricultural / Animal Husbandry Productivity Enhancement
No. 0 0.00 0 0 0 0 0
6 Drainage line correction (To prevent flooding of Gamtal)
rmt 0 0.00 0 0 0 0 0
7 Drinking water facility No. 7 8.85 0 0 0 0 0
8 Fencing for protection from wild animals
rmt. 0 0.00 0 0 0 0 0
9 Grassland/Gauchar Development
Ha. 0 0.00 0 0 0 0 0
10 Improvised and energy efficient smashan gruh (Cemetery )
No. 0 0.00 0 0 0 0 0
12 Panchayat Well Repair & No. 0 0.00 0 0 0 0 0

77 | P a g e
Pump Room
13 Rain water harvesting system
No. 33 21.61 51500 6716 0 0
14 Recharge / Repair of open wells
No. 0 0.00 0 0 0 0 0
15 Repair / development of artificial water bodies
No. 0 0.00 0 0 0 0 0
16 Revival of natural water bodies with recharge activities
No. 0 0.00 0 0 0 0 0
17 Sanitation facilities/Sewerage line
rmt 0 0.00 0 0 0 0 0
18 Use solar power for productive activities
No. 0 0.00 0 0 0 0 0
19 Wind energy development
No. 0 0.00 0 0 0 0 0
20 OTHERS (Specifiy activities )
0 0
21 CULVERT No. 0 0.00 0 0 0 0 0
22 Inlet Gutter No. 0 0.00 0 0 0 0 0
23 Repairing of waste weir No. 0 0.00 0 0 0 0 0
24 Tree protection Otta No. 0 0.00 0 0 0 0 0
25 Road Repairing No. 0 0.00 0 0 0 0 0
26 Washing Ghat Repairing No. 0 0.00 0 0 0 0 0
27 Snanghat No. 0 0.00 0 0 0 0 0
28 Gate No. 0 0.00 0 0 0 0 0
0
0 Land Development 0 0 0.00 0 0 0 0 0
1 Farm Bunding rmt. 116 70.89 0 0 2301 0 0
2 Afforestation Ha. 52 58.17 0 0 4065 0 0
3 Agriculture Demo No. 0 0.00 0 0 0 0 0

78 | P a g e
4 Agro Forestry Ha. 272 22.32 0 0 1779 0 0
5 Horticulture Ha. 22 6.15 0 0 80 0 0
6 Land leveling Ha. 44 7.21 0 0 1025 0 0
7
Pasture development Ha. 0 0.00 0 0 0 0 0
8 OTHERS (Specifiy activities )
0 0 0.00 0 0 0 0 0
9 Comunity Tree Gaurdplation
0 391 3.53 0 0 0 0 0
10 Grass Plantation on Bund 0 0 0.00 0 0 0 0 0
0
Soil & Moisture Conservation
0 0 0.00 0 0 0 0 0
1 Check wall No. 17 29.775 292723 0 6139 0 0 0
2 Earthen bund No. 45 140.35 33676 67207 5 18
3 Protection Wall No. 0 0.00 0 0 0 0 0
4 Waste weir No. 21 71.63 56661 23598 1 4
5
Bench Terracing cume
c 0 0.00 0 0 0 0 0
6 Countour Trenches No. 0 0.00 0 0 0 0 0
7 Earthern Dam No. 0 0.00 0 0 0 0 0
8 Field Outlet rmt. 0 0.00 0 0 0 0 0
9 Gabion structure rmt. 16 6.47 0 0 936 0 0
10
Graded Bunding rmt. 2 6.16 0 1748 0 0
11
Gully plug No. 113 21.53 14400 5187 0 0
12 Loose Boulder Checks No. 0 0.00 0 0 235 0 0
13 Nala Plug rmt. 0 0.00 0 0 0 0 0
14 Stone bunding No. 156 15.18 28050 2021 0 0
15
Straggred Contour trenching(Terrace Talavadi)
No. 0 0.00 0 0 0 0 0

79 | P a g e
16 OTHERS (Specifiy activities )
No. 0
17 Peripheral Earthen Bund rmt. 0 0.00 0 0 0 0 0
18 FLOW CHANNEL No. 1 3.10 0 0 956 0 0
19 Earhen Canal No. 0 0.00 0 0 0 0 0
20
Farm Masonary Outlet No. 29 5.46 0 0 3067 0 0
21 Ground Trench No. 20333 7.79 0 0 4376 0 2
22 Sleb Culvert No. 0
23 Soakpit No. 0 0.00 0 0 0 0 0
24 Water Inlet Gutter No. 0 0.00 0 0 0 0 0
25 New Pond with Waste weir
No. 0 0.00 0 0 0 0 0
26 Inlet Gutter No. 3 11.21 0 0 1845 0 0
0
0 Water Harvesting Structure
0 0 0.00 0 0 0 0 0
1 Cause way cum Chek dam No. 39 141.930
5 342966 558 43900.6667 1.5 5.25
2
Check dam No. 100 393.712 744000 1048 96370.3333 2 5
3
Village/Community Pond No. 30 100.514
7 86880 175 24018 0 0
4 Farm Pond No. 222 71.3016
7 86580 115 25300.2322 4
2.716666667
5 Percolation Tank No. 0 0.00 0 0 0 0 0
6 Pond Inlet No. 1 2.00 0 0 0 0 0
7 Pond Outlet No. 14 50.06 97600 23003 0 0
8
OTHERS (Specifiy activities )
No. 0 0.00 0 0 0 0 0
9 Causeway No. 0 0.00 0 0 0 0 0

80 | P a g e
10 Farm Masonary Outlet No. 29 5.46 0 0 3067 0 0
11 Ground Trench No. 20333 7.79 0 0 4376 0 2
12 Sleb Culvert No. 0 0.00 0 0 0 0 0
0
0
0
0
Existing/Old Water Harvesting Structure Maintance (Renovation & Repair)
0 0 0.00 0 0 0 0 0
1 Deepening/Desiltation Of Pond
No. 58 159.435
6 567356 1115 61937.4944
11.33
30.515
2 Deepening Of Percolation Tank
No. 0 0 0 0 0 0 0 0
3 Desiltation of Checkdam No. 2 4.0625 0 38 0 0 0 0
4 Repairing of Checkdam No. 2 4.51666
7 16506 40 1522.33333 0 0 0
5 Repairing of waste weir No. 0 0.00 0 0 0 0 0
6 Causway Reparing No. 0 0.00 0 0 0 0 0
7
Deepening Gutter No. 0 0.00 0 0 0 0 0
Ground Water Recharging Structures
0 0 0.00 0 0 0 0 0
1 Dugwell Recharge No. 0 0.00 0 0 0 0 0
2 Farm Recharge Filter No. 0 0.00 0 0 0 0 0
3
Holiya in farm/Field No. 0 0.00 0 0 0 0 0
4
Pond Recharge structure No. 0 0.00 0 0 0 0 0
5 Retaining wall No. 0 0.00 0 0 0 0 0
6 Irrigation well No. 0 0.00 0 0 0 0 0

81 | P a g e
7 Under Ground Dyke No. 0 0.00 0 0 0 0 0
8
Recharge Bore wells No. 0 0.00 0 0 0 0 0
0 0.00 0 0 0 0 0
S.No Sub Activity Name 0 0 0.00 0 0 0 0 0
1
AGRICULTURE ACTIVITIES
No. 1066 211.08 0 0 2849 365 218
2 AGRO PROCESSING ACTIVITIES
No. 188 46.82 0 0 0 9 6
3 Animal Husbandry No. 382 95.19 0 0 677 124 34
4 Establishing linkages No. 3 4.18 0 0 0 0 0
5 Local traditional handicraft
No. 5 3.40 0 0 0 0 0
6 Minor Activities No. 106 81.81 0 0 0 29 10
7 Non0conventional Energy Sources
No. 34 5.68 0 0 0 0 0
Capacity Building, Monitoring & Evaluation
No. 0 65.00
Administration No. 0 279.78
Consolidation phase No. 0 283.35
Total 44329.2
0 2562.57
2418897.50
3088.83 421218.70 553.3
3 342.34 0.00

82 | P a g e
Sr.No
Activity SURENDRANAG
AR
Unit
Physical Target for FY (2018-19)
Unit Cost (In Lakhs)
Storage Volume (Cubic Meter)
Command Area/ Irrigatio
n Potential
(Ha.)
Person days/Mandays Planned
Convergence
Unit Amoun
t (In Lakhs)
Name of
Schemes
1 Animal camp No. 10 5.50 0 0 0 0 0.00
2 Animal water trough (Havada)
No. 0 0.00 0 0 0 0 0.00
3 Causeway on connecting roads
No. 0 0.00 0 0 0 0 0.00
4 Check / Protection wall No. 0 0.00 0 0 0 0 0.00
5
Demonstration for Agricultural / Animal Husbandry Productivity Enhancement
No. 0 0.00 0 0 0 0 0.00
6 Drainage line correction (To prevent flooding of Gamtal)
rmt 0 0.00 0 0 0 0 0.00
7 Drinking water facility No. 7 8.85 0 0 0 0 0.00
8 Fencing for protection from wild animals
rmt. 0 0.00 0 0 0 0 0.00
9 Grassland/Gauchar Development
Ha. 0 0.00 0 0 0 0 0.00
10 Improvised and energy efficient smashan gruh (Cemetery )
No. 0 0.00 0 0 0 0 0.00
12 Panchayat Well Repair & Pump Room
No. 0 0.00 0 0 0 0 0.00
13 Rain water harvesting system
No. 6 6.09 0 0 4785 0 0.00

83 | P a g e
14 Recharge / Repair of open wells
No. 0 0.00 0 0 0 0 0.00
15 Repair / development of artificial water bodies
No. 0 0.00 0 0 0 0 0.00
16 Revival of natural water bodies with recharge activities
No. 0 0.00 0 0 0 0 0.00
17 Sanitation facilities/Sewerage line
rmt 0 0.00 0 0 0 0 0.00
18 Use solar power for productive activities
No. 0 0.00 0 0 0 0 0.00
19 Wind energy development No. 0 0.00 0 0 0 0 0.00
20 OTHERS (Specifiy activities )
0 0
21 CULVERT No. 0 0.00 0 0 0 0 0.00
22 Inlet Gutter No. 0 0.00 0 0 0 0 0.00
23 Repairing of waste weir No. 0 0.00 0 0 0 0 0.00
24 Tree protection Otta No. 0 0.00 0 0 0 0 0.00
25 Road Repairing No. 0 0.00 0 0 0 0 0.00
26 Washing Ghat Repairing No. 0 0.00 0 0 0 0 0.00
27 Snanghat No. 0 0.00 0 0 0 0 0.00
28 Gate No. 0 0.00 0 0 0 0 0.00
0
0 Land Development 0 0 0.00 0 0 0 0 0.00
1 Farm Bunding rmt. 37365 132.66 20850 67239 9001 12.74
2 Afforestation Ha. 20 20.54 0 0 6127 1 1.73
3 Agriculture Demo No. 0 0.00 0 0 0 0 0.00
4 Agro Forestry Ha. 443 10.68 0 0 1268 0 0.00
5 Horticulture Ha. 0 0.00 0 0 0 0 0.00
6 Land leveling Ha. 246 23.06 0 35379 0 0.00

84 | P a g e
7
Pasture development Ha. 0 0.00 0 0 0 0 0.00
8 OTHERS (Specifiy activities )
0 0 0.00 0 0 0 0 0.00
9 Comunity Tree Gaurdplation
0 0 0.00 0 0 0 0 0.00
10 Grass Plantation on Bund 0 0 0.00 0 0 0 0 0.00
0
Soil & Moisture Conservation
0 0 0.00 0 0 0 0 0.00
1 Check wall No. 0 0 0 0 0 0 0 0
2 Earthen bund No. 14 24.49 0 0 8337 0 0.00
3 Protection Wall No. 0 0.00 0 0 0 0 0.00
4 Waste weir No. 12 21.27 50000 14932 0 0.00
5
Bench Terracing cume
c 0 0.00 0 0 0 0 0.00
6 Countour Trenches No. 0 0.00 0 0 0 0 0.00
7 Earthern Dam No. 0 0.00 0 0 0 0 0.00
8 Field Outlet rmt. 0 0.00 0 0 0 0 0.00
9 Gabion structure rmt. 14 6.47 0 0 936 0 0.00
10
Graded Bunding rmt. 1 2.68 0 0 0 0 0.00
11
Gully plug No. 31 7.03 0 0 562 0 0.00
12 Loose Boulder Checks No. 0 0.00 0 0 0 0 0.00
13 Nala Plug rmt. 0 0.00 0 0 0 0 0.00
14 Stone bunding No. 25 10.20 0 0 0 0 0.00
15
Straggred Contour trenching(Terrace Talavadi)
No. 0 0.00 0 0 0 0 0.00
16 OTHERS (Specifiy activities )
No. 0
17 Peripheral Earthen Bund rmt. 0 0.00 0 0 0 0 0.00

85 | P a g e
18 FLOW CHANNEL No. 0 0.00 0 0 0 0 0.00
19 Earhen Canal No. 0 0.00 0 0 0 0 0.00
20
Farm Masonary Outlet No. 29 5.46 0 0 3067 0 0.00
21 Ground Trench No. 20333 7.79 0 0 4376 0 0.00
22 Sleb Culvert No. 0 0.00 0 0 0 0 0.00
23 Soakpit No. 0 0.00 0 0 0 0 0.00
24 Water Inlet Gutter No. 0 0.00 0 0 0 0 0.00
25 New Pond with Waste weir No. 0 0.00 0 0 0 0 0.00
26 Inlet Gutter No. 1 3.28 0 0 1845 0 0.00
0
0 Water Harvesting Structure
0 0 0.00 0 0 0 0 0.00
1 Cause way cum Chek dam No. 8 24.6180
4 70352 95 6915.666667 0 0 0
2
Check dam No. 32 90.1595 238080 64 7252.333333 0 0 0
3
Village/Community Pond No. 16 36.3316
7 46336 23 4588 0 0 0
4 Farm Pond No. 91 29.8266
7 35490 7 4998.23221 0 0 0
5 Percolation Tank No. 0 0.00 0 0 0 0 0.00
6 Pond Inlet No. 0 0.00 0 0 0 0 0.00
7 Pond Outlet No. 4 11.43 0 0 0 0 0.00
8
OTHERS (Specifiy activities )
No. 0 0.00 0 0 0 0 0.00
9 Causeway No. 0 0.00 0 0 0 0 0.00
10 Farm Masonary Outlet No. 29 5.46 0 0 3067 0 0.00
11 Ground Trench No. 20333 7.79 0 0 4376 0 0.00
12 Sleb Culvert No. 0 0.00 0 0 0 0 0.00

86 | P a g e
0
0
0
0
Existing/Old Water Harvesting Structure Maintance (Renovation & Repair)
0 0 0.00 0 0 0 0 0.00
1 Deepening/Desiltation Of Pond
No. 18 46.8102
7 176076 94 22904.49438
8.3333
7.2 0
2 Deepening Of Percolation Tank
No. 0 0 0 0 0 0 0 0
3 Desiltation of Checkdam No. 1 4.0625 0 0 0 0 0 0
4 Repairing of Checkdam No. 1 4.51666
7 8253 40 1522.333333 0 0 0
5 Repairing of waste weir No. 0 0.00 0 0 0 0 0.00
6 Causway Reparing No. 0 0.00 0 0 0 0 0.00
7
Deepening Gutter No. 0 0.00 0 0 0 0 0.00
Ground Water Recharging Structures
0 0 0.00 0 0 0 0 0.00
1 Dugwell Recharge No. 0 0.00 0 0 0 0 0.00
2 Farm Recharge Filter No. 0 0.00 0 0 0 0 0.00
3
Holiya in farm/Field No. 0 0.00 0 0 0 0 0.00
4
Pond Recharge structure No. 0 0.00 0 0 0 0 0.00
5 Retaining wall No. 0 0.00 0 0 0 0 0.00
6 Irrigation well No. 0 0.00 0 0 0 0 0.00
7 Under Ground Dyke No. 0 0.00 0 0 0 0 0.00
8
Recharge Bore wells No. 0 0.00 0 0 0 0 0.00
0 0.00 0 0 0 0 0.00
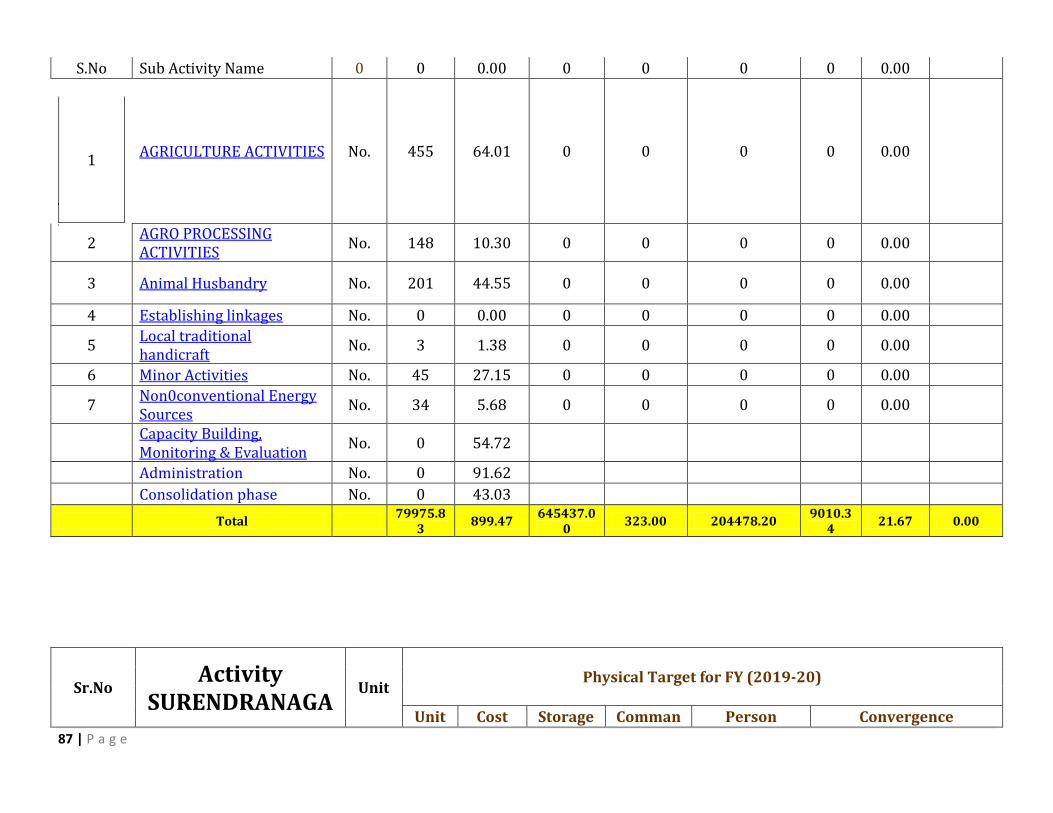
87 | P a g e
S.No Sub Activity Name 0 0 0.00 0 0 0 0 0.00
1
AGRICULTURE ACTIVITIES No. 455 64.01 0 0 0 0 0.00
2 AGRO PROCESSING ACTIVITIES
No. 148 10.30 0 0 0 0 0.00
3 Animal Husbandry No. 201 44.55 0 0 0 0 0.00
4 Establishing linkages No. 0 0.00 0 0 0 0 0.00
5 Local traditional handicraft
No. 3 1.38 0 0 0 0 0.00
6 Minor Activities No. 45 27.15 0 0 0 0 0.00
7 Non0conventional Energy Sources
No. 34 5.68 0 0 0 0 0.00
Capacity Building, Monitoring & Evaluation
No. 0 54.72
Administration No. 0 91.62
Consolidation phase No. 0 43.03
Total 79975.8
3 899.47
645437.00
323.00 204478.20 9010.3
4 21.67 0.00
Sr.No Activity
SURENDRANAGAUnit
Physical Target for FY (2019-20)
Unit Cost Storage Comman Person Convergence

88 | P a g e
R (In Lakhs)
Volume (Cubic Meter)
d Area/ Irrigation Potential
(Ha.)
days/Mandays Planned Uni
t
Amount (In
Lakhs)
Name of Scheme
s
1 Animal camp No. 6 4.25 0 0 0 0 0.00
2 Animal water trough (Havada)
No. 0 0.00 0 0 0 0 0.00
3 Causeway on connecting roads
No. 0 0.00 0 0 0 0 0.00
4 Check / Protection wall No. 0 0.00 0 0 0 0 0.00
5
Demonstration for Agricultural / Animal Husbandry Productivity Enhancement
No. 0 0.00 0 0 0 0 0.00
6 Drainage line correction (To prevent flooding of Gamtal)
rmt 0 0.00 0 0 0 0 0.00
7 Drinking water facility No. 6 8.85 0 0 0 0 0.00
8 Fencing for protection from wild animals
rmt. 0 0.00 0 0 0 0 0.00
9 Grassland/Gauchar Development
Ha. 0 0.00 0 0 0 0 0.00
10 Improvised and energy efficient smashan gruh (Cemetery )
No. 0 0.00 0 0 0 0 0.00
12 Panchayat Well Repair & Pump Room
No. 0 0.00 0 0 0 0 0.00
13 Rain water harvesting system
No. 0 0.00 0 0 0 0 0.00
14 Recharge / Repair of open wells
No. 0 0.00 0 0 0 0 0.00
15 Repair / development of artificial water bodies
No. 0 0.00 0 0 0 0 0.00

89 | P a g e
16 Revival of natural water bodies with recharge activities
No. 0 0.00 0 0 0 0 0.00
17 Sanitation facilities/Sewerage line
rmt 0 0.00 0 0 0 0 0.00
18 Use solar power for productive activities
No. 0 0.00 0 0 0 0 0.00
19 Wind energy development No. 0 0.00 0 0 0 0 0.00
20 OTHERS (Specifiy activities )
0 0
21 CULVERT No. 0 0.00 0 0 0 0 0.00
22 Inlet Gutter No. 0 0.00 0 0 0 0 0.00
23 Repairing of waste weir No. 0 0.00 0 0 0 0 0.00
24 Tree protection Otta No. 0 0.00 0 0 0 0 0.00
25 Road Repairing No. 0 0.00 0 0 0 0 0.00
26 Washing Ghat Repairing No. 0 0.00 0 0 0 0 0.00
27 Snanghat No. 0 0.00 0 0 0 0 0.00
28 Gate No. 0 0.00 0 0 0 0 0.00
0
0 Land Development 0 0 0.00 0 0 0 0 0.00
1 Farm Bunding rmt. 56 31.55 16800 570 0 0.00
2 Afforestation Ha. 1 0.49 0 0 0 0 0.00
3 Agriculture Demo No. 0 0.00 0 0 0 0 0.00
4 Agro Forestry Ha. 0 0.00 0 0 0 0 0.00
5 Horticulture Ha. 0 0.00 0 0 0 0 0.00
6 Land leveling Ha. 0 0.00 0 0 0 0 0.00
7
Pasture development Ha. 0 0.00 0 0 0 0 0.00
8 OTHERS (Specifiy activities )
0 0 0.00 0 0 0 0 0.00

90 | P a g e
9 Comunity Tree Gaurdplation 0 0 0.00 0 0 0 0 0.00
10 Grass Plantation on Bund 0 0 0.00 0 0 0 0 0.00
0
Soil & Moisture Conservation
0 0 0.00 0 0 0 0 0.00
1 Check wall No. 0 0 0 0 0 0 0 0
2 Earthen bund No. 10 29.99 0 0 0 0 0.00
3 Protection Wall No. 0 0.00 0 0 0 0 0.00
4 Waste weir No. 0 0.00 0 0 0 0 0.00
5
Bench Terracing cume
c 0 0.00 0 0 0 0 0.00
6 Countour Trenches No. 0 0.00 0 0 0 0 0.00
7 Earthern Dam No. 0 0.00 0 0 0 0 0.00
8 Field Outlet rmt. 0 0.00 0 0 0 0 0.00
9 Gabion structure rmt. 7 4.55 0 0 0 0 0.00
10
Graded Bunding rmt. 1 5.35 0 0 0 0 0.00
11
Gully plug No. 25 5.36 0 0 0 0 0.00
12 Loose Boulder Checks No. 0 0.00 0 0 0 0 0.00
13 Nala Plug rmt. 0 0.00 0 0 0 0 0.00
14 Stone bunding No. 26 9.20 0 0 0 0 0.00
15
Straggred Contour trenching(Terrace Talavadi)
No. 0 0.00 0 0 0 0 0.00
16 OTHERS (Specifiy activities )
No. 0
17 Peripheral Earthen Bund rmt. 0 0.00 0 0 0 0 0.00
18 FLOW CHANNEL No. 0 0.00 0 0 0 0 0.00
19 Earhen Canal No. 0 0.00 0 0 0 0 0.00
20
Farm Masonary Outlet No. 0 0.00 0 0 0 0 0.00
21 Ground Trench No. 0 0.00 0 0 0 0 0.00
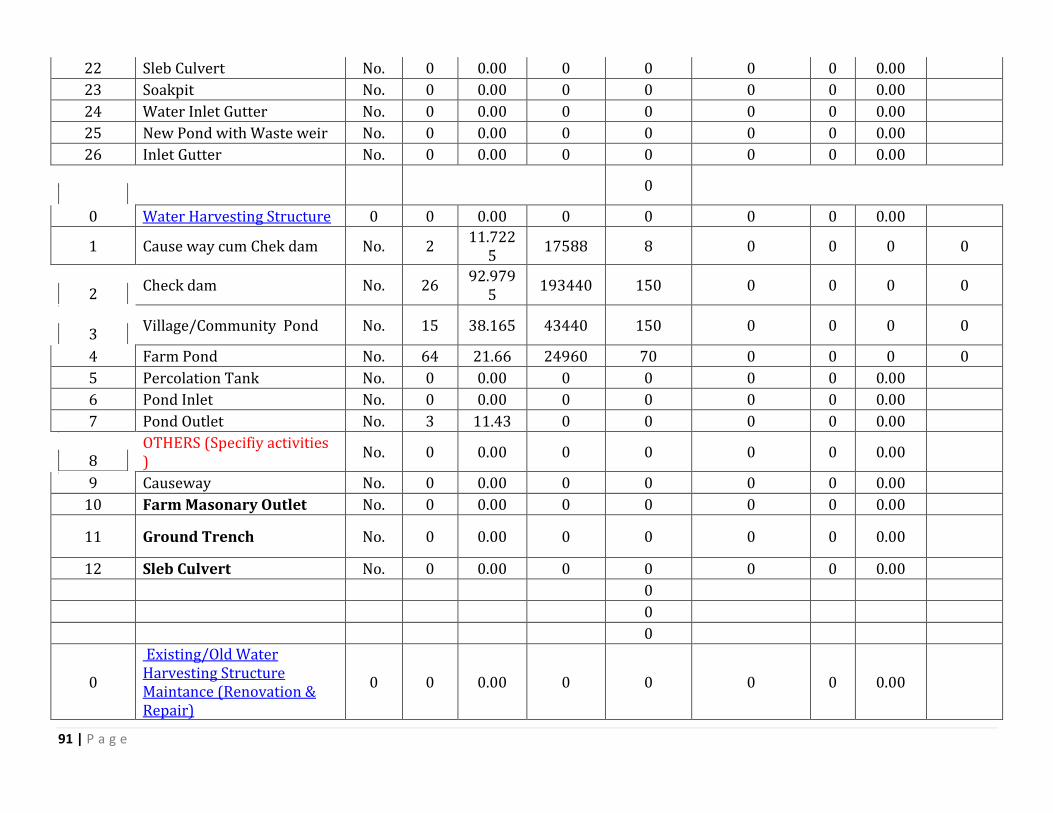
91 | P a g e
22 Sleb Culvert No. 0 0.00 0 0 0 0 0.00
23 Soakpit No. 0 0.00 0 0 0 0 0.00
24 Water Inlet Gutter No. 0 0.00 0 0 0 0 0.00
25 New Pond with Waste weir No. 0 0.00 0 0 0 0 0.00
26 Inlet Gutter No. 0 0.00 0 0 0 0 0.00
0
0 Water Harvesting Structure 0 0 0.00 0 0 0 0 0.00
1 Cause way cum Chek dam No. 2 11.722
5 17588 8 0 0 0 0
2
Check dam No. 26 92.979
5 193440 150 0 0 0 0
3
Village/Community Pond No. 15 38.165 43440 150 0 0 0 0
4 Farm Pond No. 64 21.66 24960 70 0 0 0 0
5 Percolation Tank No. 0 0.00 0 0 0 0 0.00
6 Pond Inlet No. 0 0.00 0 0 0 0 0.00
7 Pond Outlet No. 3 11.43 0 0 0 0 0.00
8
OTHERS (Specifiy activities )
No. 0 0.00 0 0 0 0 0.00
9 Causeway No. 0 0.00 0 0 0 0 0.00
10 Farm Masonary Outlet No. 0 0.00 0 0 0 0 0.00
11 Ground Trench No. 0 0.00 0 0 0 0 0.00
12 Sleb Culvert No. 0 0.00 0 0 0 0 0.00
0
0
0
0
Existing/Old Water Harvesting Structure Maintance (Renovation & Repair)
0 0 0.00 0 0 0 0 0.00

92 | P a g e
1 Deepening/Desiltation Of Pond
No. 4 16.085 39128 7 0 0 0 0
2 Deepening Of Percolation Tank
No. 0 0 0 0 0 0 0 0
3 Desiltation of Checkdam No. 1 4.0625 0 3 0 0 0 0
4 Repairing of Checkdam No. 0 0 0 0 0 0 0 0
5 Repairing of waste weir No. 0 0.00 0 0 0 0 0.00
6 Causway Reparing No. 0 0.00 0 0 0 0 0.00
7
Deepening Gutter No. 0 0.00 0 0 0 0 0.00
Ground Water Recharging Structures
0 0 0.00 0 0 0 0 0.00
1 Dugwell Recharge No. 0 0.00 0 0 0 0 0.00
2 Farm Recharge Filter No. 0 0.00 0 0 0 0 0.00
3
Holiya in farm/Field No. 0 0.00 0 0 0 0 0.00
4
Pond Recharge structure No. 0 0.00 0 0 0 0 0.00
5 Retaining wall No. 0 0.00 0 0 0 0 0.00
6 Irrigation well No. 0 0.00 0 0 0 0 0.00
7 Under Ground Dyke No. 0 0.00 0 0 0 0 0.00
8
Recharge Bore wells No. 0 0.00 0 0 0 0 0.00
0 0.00 0 0 0 0 0.00
S.No Sub Activity Name 0 0 0.00 0 0 0 0 0.00
AGRICULTURE ACTIVITIES No. 156 51.76 0 0 0 0 0.00

93 | P a g e
1
2 AGRO PROCESSING ACTIVITIES
No. 144 6.01 0 0 0 0 0.00
3 Animal Husbandry No. 126 29.95 0 0 0 0 0.00
4 Establishing linkages No. 0 0.00 0 0 0 0 0.00
5 Local traditional handicraft No. 2 0.70 0 0 0 0 0.00
6 Minor Activities No. 35 14.59 0 0 0 0 0.00
7 Non0conventional Energy Sources
No. 33 5.68 0 0 0 0 0.00
Capacity Building, Monitoring & Evaluation
No. 0 25.60
Administration No. 0 63.42
Consolidation phase No. 0 67.85
Total 749.0
0 561.24
335356.00
387.65 570.00 0.00 0.00 0.00

COTTON
CASTOR SEEDS


