Journal of Vision (2003) 3, 369-379 http://journalofvision.org/3/5/4/ 369
Surface color perception under two illuminants:The second illuminant reduces color constancy
Joong Nam Yang
Department of Psychology,
University of Chicago, Chicago, IL, USA
Steven K. ShevellDepartments of Psychology and Ophthalmology &
Visual Science, University of Chicago, Chicago, IL, USA
This study investigates color perception in a scene with two different illuminants. The two illuminants, in opposite cornerssimultaneously shine on a (simulated) scene with an opaque dividing wall, which controls how much of the scene isilluminated by each source. In the first experiment, the height of the dividing wall was varied. This changed the amount ofeach illuminant reaching objects on the opposite side of the wall. Results showed that the degree of color constancydecreased when a region on one side of the wall had cues to both illuminants, suggesting that cues from the secondilluminant are detrimental to color constancy. In a later experiment, color constancy was found to improve when thespecular highlight cues from the second illuminant were altered to be consistent with the first illuminant. This corroborates
the influence of specular highlights in surface color perception, and suggests that the reduced color constancy in the firstexperiment is due to the inconsistent, though physically correct, cues from the two illuminants.
Keywords: surface color, color constancy, illuminant estimation, cue inconsistency
Introduction
Judging the color of a surface is easy even though thelight reaching the eye results from two distinct physicalproperties: the surface spectral reflectance and the spectralpower distribution of the illuminant. Only the reflectanceis a property of the surface, so the retinal image of thesurface is always ambiguous with respect to the reflectance.
Yet, the visual system is able to extract a stable surfacecolor. This is the phenomenon of color constancy.
Several theoretical frameworks have been proposed toexplain how the visual system achieves color constancy.MacLeod and Golz (in press) propose that the colorconstancy problem is readily tractable if the illuminantspectral power distribution is assumed to beappromixated by Gaussians. This assumption is based onthe premise that human color perception starts with threecone types whose sensitivities can be closely approximatedby Gaussian functions. Zaidi (1998) shows that the colorconstancy problem can be simplified by invokingheuristics based on the correlation between naturalsurfaces and illuminants. Brainard and Freeman (1997) use a Bayesian approach: given prior distributions, they develop a way of estimating posterior distributions forilluminants and surfaces in a given scene. In the linear-models approach to surface color perception (Pokorny,Shevell, & Smith, 1991; Hurlbert, 1998; Maloney, 1999),the problem is mathematically solvable under theassumption that lights and surfaces can be summarized by a small number of basis functions (Maloney, 1986;Dannemiller, 1993). The subspace computation of
Maloney and Wandell (1986) is an algorithm that exploitssuch an assumption. Other theories employ additionalassumptions about the surfaces in the scene, such asreference surfaces, averages, or mutual reflection(Buchsbaum, 1980; Brill, 1978; Funt, Drew, & Ho, 1991;Lee 1986; D’Zmura & Iverson, 1993; Land & MaCann,1971).
Human color perception is not perfectly color
constant. Empirical studies show clear deviations fromcolor constancy ( Arend & Reeves, 1986; Arend, Reeves,Schirillo, Goldstein, 1991; Jin & Shevell, 1996; Brainard,1998; Kraft & Brainard, 1999; Nascimento & Foster,2000; Yang & Maloney, 2001; Yang & Shevell, 2002).Color constancy performance in human vision varies alsofrom scene to scene, which is consistent with thehypothesis that surface color perception involves error-prone estimation of the illuminant (Maloney & Yang, inpress). This raises the question of how features of theretinal image are used to estimate the illuminant. Proposedcues to the illuminant include mutual reflection (Funt etal., 1991), specular reflection boundaries (D’Zmura &Lennie, 1986), shadows (D’Zmura, 1992), illuminantgradients (Ullman, 1976), brightest spots (Land, 1986), andspecular highlights that reflect the illuminating light.Empirical tests show that color perception is affected by specular highlights ( Yang & Maloney, 2001), mutualreflection (Bloj, Kersten, & Hulbert, 1999), binoculardisparity ( Yang & Shevell, 2002), and perceptualorganization (Schrillo & Shevell, 2000).
The present study was conducted to answer thefollowing question: How does a second illuminant affectcolor constancy when both illuminants shine on part of
the scene? Is color perception affected by cues availablefrom the second illuminant? If so, do the added cues helpor hinder color constancy?
We know of no explicit solution aimed at answeringthese questions, although a few reports are related to theproblem. D’Zmura and Iverson (1993) have shown intheir theoretical framework that when the same scene is
seen twice under two different illuminants, it ismathematically possible, with certain assumptions, tosolve the color constancy problem. This is not directly applicable to the questions in the present study becausehere the two illuminants coexist in the scene at the sametime. Second, a single-illuminant color constancy algorithm could be extended to a multi-illuminant scene(Tominaga & Wandell, 1989; D’Zmura & Lennie, 1986;Lee, 1986; see also Brill, 1990). These algorithms may behelpful when an entire scene is lit by two or moreilluminants at the same time, which is only part of theproblem here.
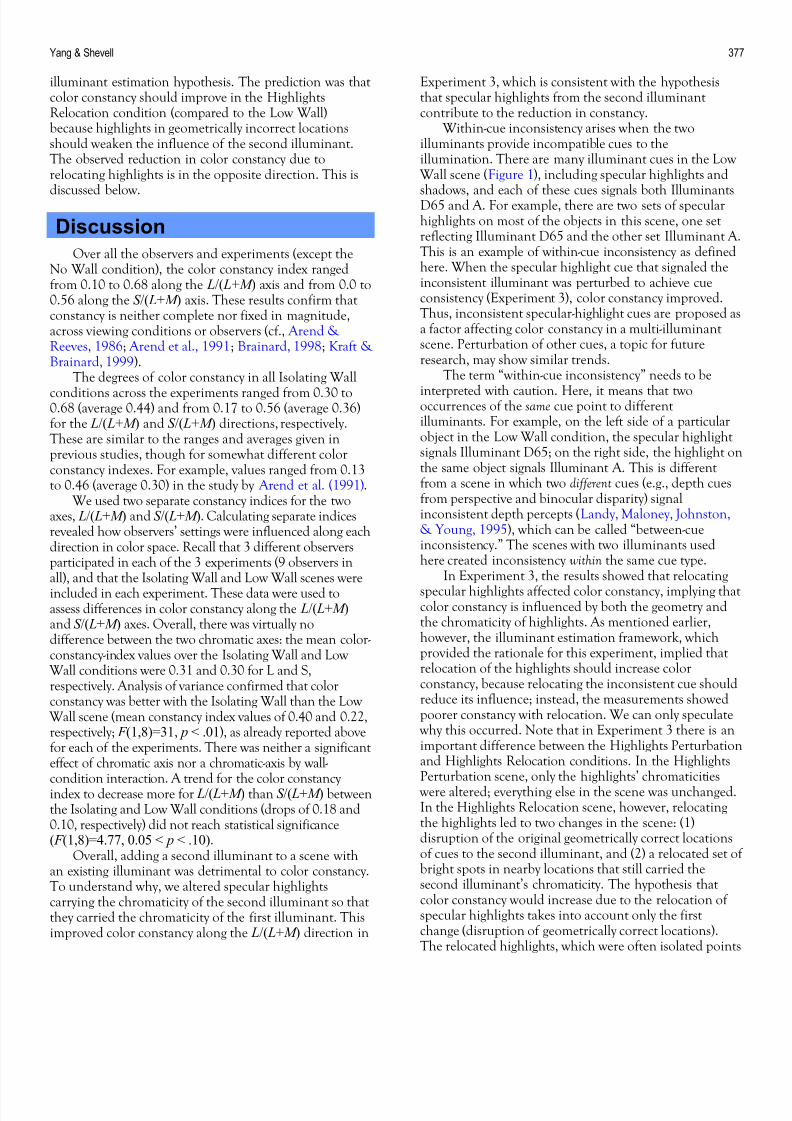
The problem of color constancy posed by the present
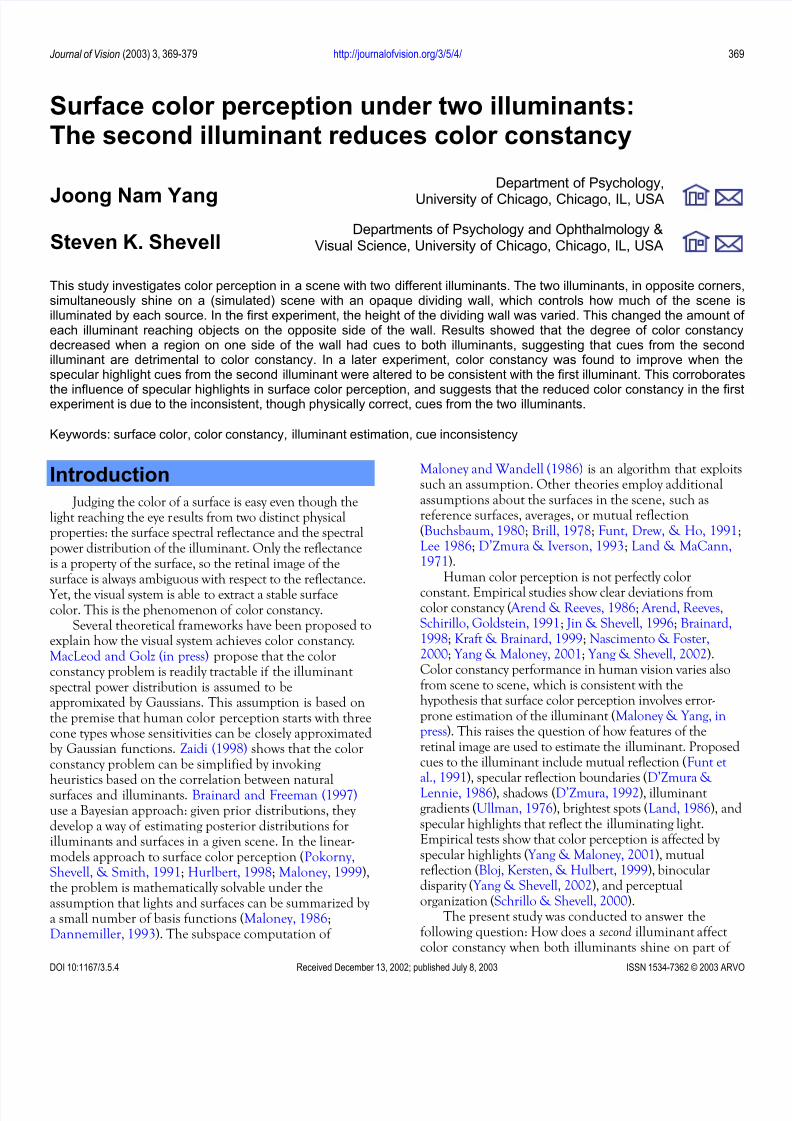
study is illustrated in Figure 1. In the top left (Isolating Wall) stereogram, the center-dividing wall is sufficiently high so that the illuminant on either side does not reachthe opposite region. Thus, each side of the wall has itsown color constancy problem involving one illuminant.This is similar to studies of simultaneous color constancy (e.g., Arend & Reeves, 1986). In the top right (High Wall)and bottom left (Low Wall) stereograms, the dividing wallis not as tall so that each illuminant also reaches part of the scene on the other side of the wall. This is a form of the two-illuminant color-constancy problem; each sidenow has two parts, one lit by one illuminant and theother by both illuminants. This may or may not affect
color constancy. Empirically, we find that color constancy is poorer in the Low Wall scene (bottom left) than in theIsolating Wall scene (top left).
In a later experiment, specular highlights (Blake &Bulthoff, 1990, 1991) were perturbed ( Yang & Maloney,2001) to investigate their role in the two-illuminantproblem. Specular highlights carrying the chromaticity of
the second illuminant were altered to carry thechromaticity of the first illuminant. Measurements show this improved color constancy.
General Method
Apparatus We used a binocular CRT set-up in which each eye
viewed a separate display. The images from the twodisplays were fused using mirrors (for details, see Yang &Shevell, 2002).
Stimulus Configuration All scenes were rendered with the three-dimensional
rendering software RADIANCE (Larson & Shakespeare,1997). Lights and surfaces were rendered using 9-step-function rendering in order to accurately determine thelight at each point in the scene ( Yang & Maloney, 2001; Yang, 1999). The surfaces were chosen from the Munsell
Book of Colors (Kelley, Gibson, & Nickerson, 1943): G6/6 for the objects, BG 5/4 for the background, and N1/ for the wall. The wall had a checkerboard pattern tomake it appear more distinct.
The Isolating Wall scene in Figure 1 shows the
Isolating Wall
No WallLow Wall
High Wall
Figure 1. Stereograms used in Experiment 1. Each scene has many identical objects against a uniform background. From the left and
right upper corners of the scene shine two separate illuminants, Illuminants D65 and A in this example. There are four different
stereograms that vary in how much light from the second illuminant falls on the opposite side of the stimulus: Isolating Wall, in which the
wall did not allow any light from the second illuminant beyond the wall; High Wall, in which the wall was lowered, so light from the
second illuminant fell only near the far edge of the opposite side; Low Wall, in which the wall was lowered further so that more light from
the second illuminant fell on the opposite side; and No Wall, in which both illuminants fell on the whole scene.
stimulus (with crossed fusion) from which all otherstimuli were derived. The scene includes 14 objects oneach side of the wall. The background, surfaces, andobjects on each side were illuminated by separateilluminants, one at the top-left corner and the other atthe top-right corner. The illuminants created shadows,mutual reflections, and specular highlights, as well as
attached shadows and illuminant gradients. A smallsquare test patch for asymmetric matching was locatedon one of the objects (the top right-most object) on theleft side of the wall; a similar comparison patch was onanother object (the top left-most object) on the rightside of the wall. Except in the No Wall condition inFigure 1, the second illuminant did not fall on the twopatches; that is, the test patch and comparison patch were in the shadow of the wall for the other threeconditions.
Results
Experiment 1
Purpose
This experiment investigated the role of a secondilluminant, which partially fell on an existing scene that
already had its own illuminant. The scenes were varied interms of how much of each region was lit by the secondilluminant.
Stimuli
Four scenes, all stereograms for crossed fusion, wereused (Figure 1). In the Isolating Wall condition (top left),the scene was divided by an opaque wall, which was highenough to block any illuminating light from the oppositeside. The bottom of the wall was perpendicular to thebackground plane. Thus light from only one illuminantfell on each side of the wall. In the High Wall condition(top right), the wall was lowered somewhat, so that the
second illuminant crossed over to the other side of the wall, but the light from the second illuminant fell in only a small area at the far edge of each region (and far fromthe test and comparison patches). In the Low Wall condition (bottom left), the wall was lowered further sothat more of each side was lit by the second illuminant. Inthis case, the second illuminant contributed more toshadows, specular highlights, and mutual reflections.Note, however, that the second illuminant did not fall onthe test or comparison patch. In the No Wall condition
Observers
All observers were paid volunteers. They had normal
color vision verified with a Neitz anamoloscope, andnormal binocular vision as tested with the Titmus StereoTest. Three observers participated in each of theexperiments. A day before the experimental sessionsstarted, observers were given 1-2 hours of practice tofamiliarize themselves with the task.
Procedure
After one minute of adaptation to the scene,observers adjusted the chromaticity of the test patch (onthe left side) to match the color appearance of thecomparison patch in the right region. The observers were free to move their eyes around the image.
Asymmetric matches were measured for five test colorsspecified in MacLeod and Boynton (1979) (l,s)chromaticity space: (0.70, 0.99), (0.62, 0.99), (0.66,1.79), (0.66, 0.22), and (0.66, 1.00). The last of thesefive was metameric to Equal Energy White (EEW). Notethat the unit of s is arbitrary and normalized here to 1.0for EEW. The luminance of the test patch was heldconstant for all scenes (19 cd/m2), and was lower thanthe luminance in many nearby areas. For example, theluminance of the object on which the test resided was30.3, 20.9, 29.0, and 14.0 cd/m2 left of, right of, above,and below the test patch. Observers adjusted theappearance of the test patch using two sets of keys on
the keyboard. Each measurement was repeated threetimes in a single session and then averaged. Eachcondition was repeated on three days. Measurements were averaged over the three days. The presentationorder of the stimuli was randomized.
Illuminant D65 Illuminant A
Low wall
No wallSecond illuminant
Isolating wall
High wall
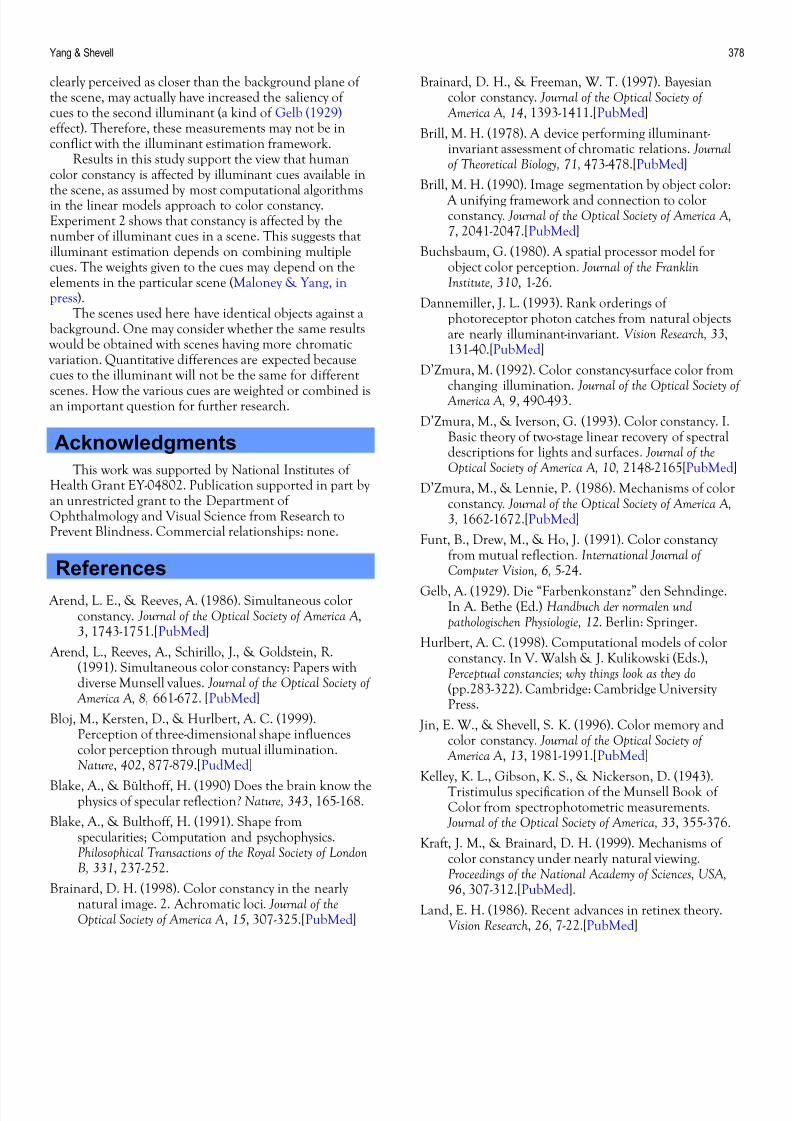
Figure 2. Schematic of the scenes in Figure 1. Left. A side view
of the stimuli. The horizontal line indicates the background
surface and the thick vertical bar, the opaque wall. Right. A top
view of the scenes. The gray areas indicate how much of each
side receives light from the illuminant on the opposite side.
(bottom right), the wall was eliminated and the entirescene was lit by both illuminants. Figure 2 presents aschematic of the scenes in Figure 1; the left part shows aside view of the stimuli and the right part shows a top view of the scene.
Note that illuminant gradients were created becausethe illuminants were not infinitely distant light sources.
In all scenes, the illuminants were positioned in the rightand left corners, and behind the observer. If the lightsources were infinitely far away from the surfaces, then inthe No Wall condition, a single effective illuminant would be the sum of the two illuminants. The scenes inFigure 1 have Illuminant D65 on the left and Illuminant A on the right. Another identical set of stimuli wasrendered using Illuminant D65 on both sides. These twosets of scenes were used in Experiment 1.
Results
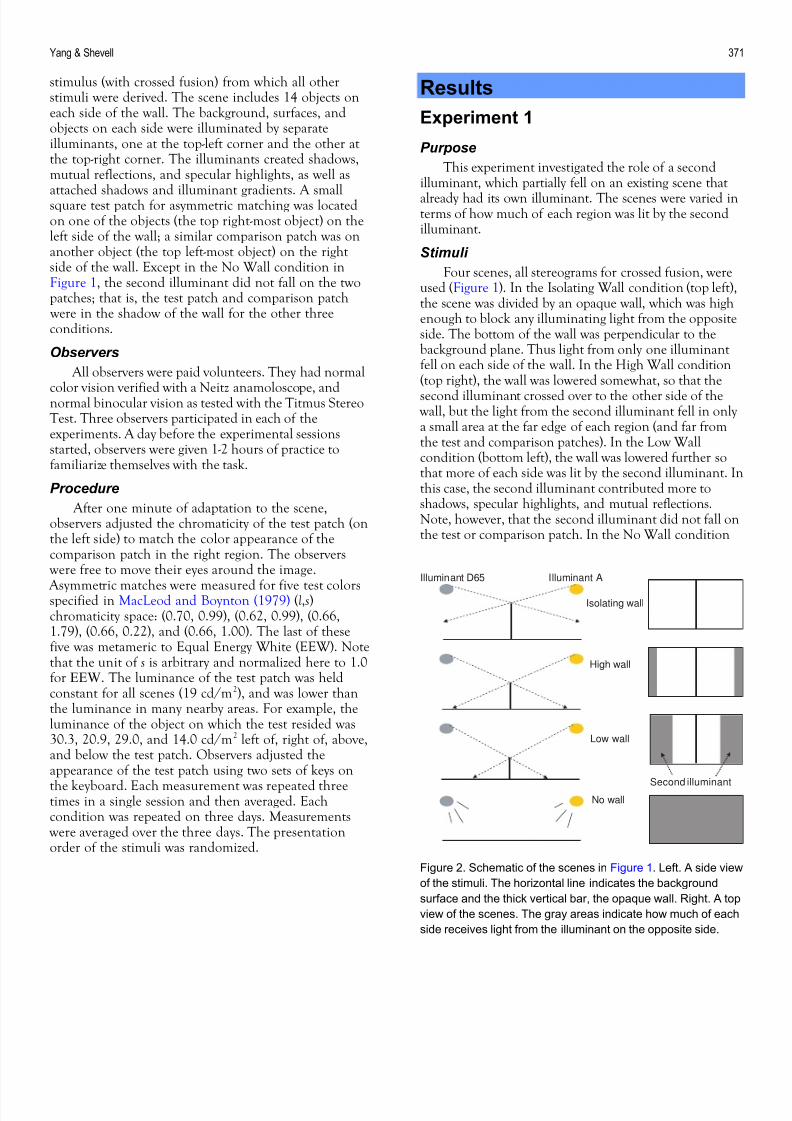
Figure 3 shows the asymmetric matching results inthe MacLeod-Boynton cone space (MacLeod & Boynton,
1979). Each column shows results for one of the fourstimulus conditions in Figure 1, and each row is for one
of the observers. The vertical axis is S /( L+M ) and thehorizontal axis is L/( L+M ). Filled squares and circlesindicate, respectively, the light reflected from a neutralequal-reflecting surface at the location of the right-sidecomparison patch, with Illuminant D65 on both sides(D65-D65) or D65 on the left and A on the right (D65- A). The coordinates of these two points are displaced
from their spectral power distributions of (0.66, 1.05) and(0.70, 0.34), respectively, due to mutual reflections in theimage. For example, in the Isolating Wall scene, thesecoordinates are (0.68, 0.81) and (0.71, 0.51), respectively.Open squares in Figure 3 represent matches when theilluminants are the same on both sides (D65), whereasopen circles represent matches when the illuminants aredifferent (Illuminant D65 on the left and Illuminant A on the right). If the arrows showing the change in matchsettings with a change in the right-side illuminant (fromD65 to A) were equal to the dotted arrow (the vectorindicating the shift in light falling on the comparison-patch location due to changing illuminants), then the
results would indicate perfect color constancy. Except forthe No Wall condition, the arrows generally are similar to
Discussionthe dotted illuminant vector in direction but vary inmagnitude. Overall, the results show fairly good colorconstancy with the Isolating Wall or the High Wallscenes, less good constancy with the Low Wall, and poorconstancy with No Wall.
The main finding in Experiment 1 is that when asecond illuminant is introduced into a region that isalready illuminated by another light, color constancy declines. As discussed in the “Introduction,” introducinga second illuminant makes the problem of colorconstancy more complex. Empirically we find here that it
also reduces the degree of color constancy. This may be
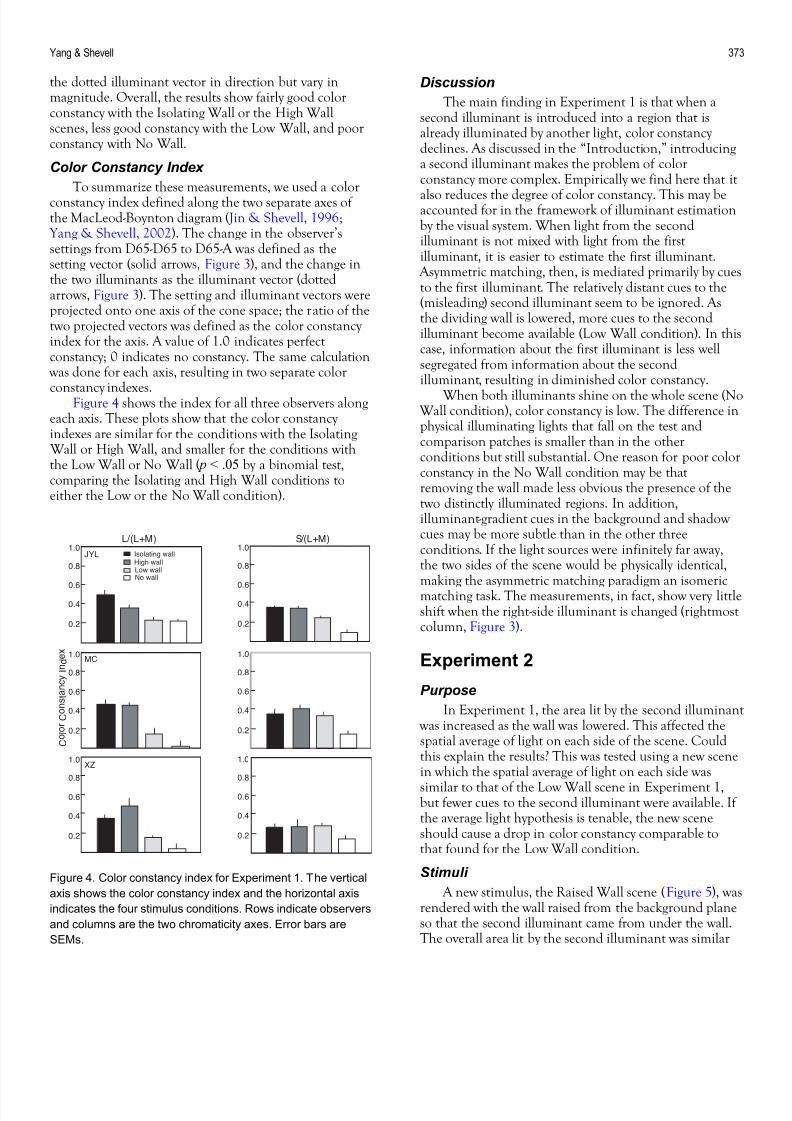
Color Constancy Index
To summarize these measurements, we used a colorconstancy index defined along the two separate axes of the MacLeod-Boynton diagram ( Jin & Shevell, 1996; Yang & Shevell, 2002). The change in the observer’ssettings from D65-D65 to D65-A was defined as thesetting vector (solid arrows, Figure 3), and the change inthe two illuminants as the illuminant vector (dottedarrows, Figure 3). The setting and illuminant vectors wereprojected onto one axis of the cone space; the ratio of thetwo projected vectors was defined as the color constancy index for the axis. A value of 1.0 indicates perfectconstancy; 0 indicates no constancy. The same calculation was done for each axis, resulting in two separate color
constancy indexes.
accounted for in the framework of illuminant estimationby the visual system. When light from the secondilluminant is not mixed with light from the firstilluminant, it is easier to estimate the first illuminant. Asymmetric matching, then, is mediated primarily by cuesto the first illuminant. The relatively distant cues to the(misleading) second illuminant seem to be ignored. Asthe dividing wall is lowered, more cues to the secondilluminant become available (Low Wall condition). In thiscase, information about the first illuminant is less wellsegregated from information about the secondilluminant, resulting in diminished color constancy.
When both illuminants shine on the whole scene (No Wall condition), color constancy is low. The difference inphysical illuminating lights that fall on the test andcomparison patches is smaller than in the otherconditions but still substantial. One reason for poor colorconstancy in the No Wall condition may be thatremoving the wall made less obvious the presence of thetwo distinctly illuminated regions. In addition,illuminant-gradient cues in the background and shadow cues may be more subtle than in the other threeconditions. If the light sources were infinitely far away,the two sides of the scene would be physically identical,making the asymmetric matching paradigm an isomericmatching task. The measurements, in fact, show very littleshift when the right-side illuminant is changed (rightmostcolumn, Figure 3).
Figure 4 shows the index for all three observers alongeach axis. These plots show that the color constancy indexes are similar for the conditions with the Isolating Wall or High Wall, and smaller for the conditions withthe Low Wall or No Wall ( p < .05 by a binomial test,comparing the Isolating and High Wall conditions toeither the Low or the No Wall condition).
JYL
MC
XZ1.0
0.8
0.6
0.4
0.2
1.0
0.8
0.6
0.4
0.2
1.0
0.8
0.6
0.4
0.2
1.0
0.8
0.6
0.4
0.2
1.0
0.8
0.6
0.4
0.2
1.0
0.8
0.6
0.4
0.2
L/(L+M) S/(L+M)
Isolating wallHigh wallLow wallNo wall
C o l o r C o
n s t a n c y I n
d e x
Experiment 2
Purpose
In Experiment 1, the area lit by the second illuminan was increased as the wall was lowered. This affected thespatial average of light on each side of the scene. Couldthis explain the results? This was tested using a new scenein which the spatial average of light on each side was
similar to that of the Low Wall scene in Experiment 1,but fewer cues to the second illuminant were available. If the average light hypothesis is tenable, the new sceneshould cause a drop in color constancy comparable tothat found for the Low Wall condition.
Stimuli Figure 4. Color constancy index for Experiment 1. The vertical
axis shows the color constancy index and the horizontal axis
indicates the four stimulus conditions. Rows indicate observers
and columns are the two chromaticity axes. Error bars are
SEMs.
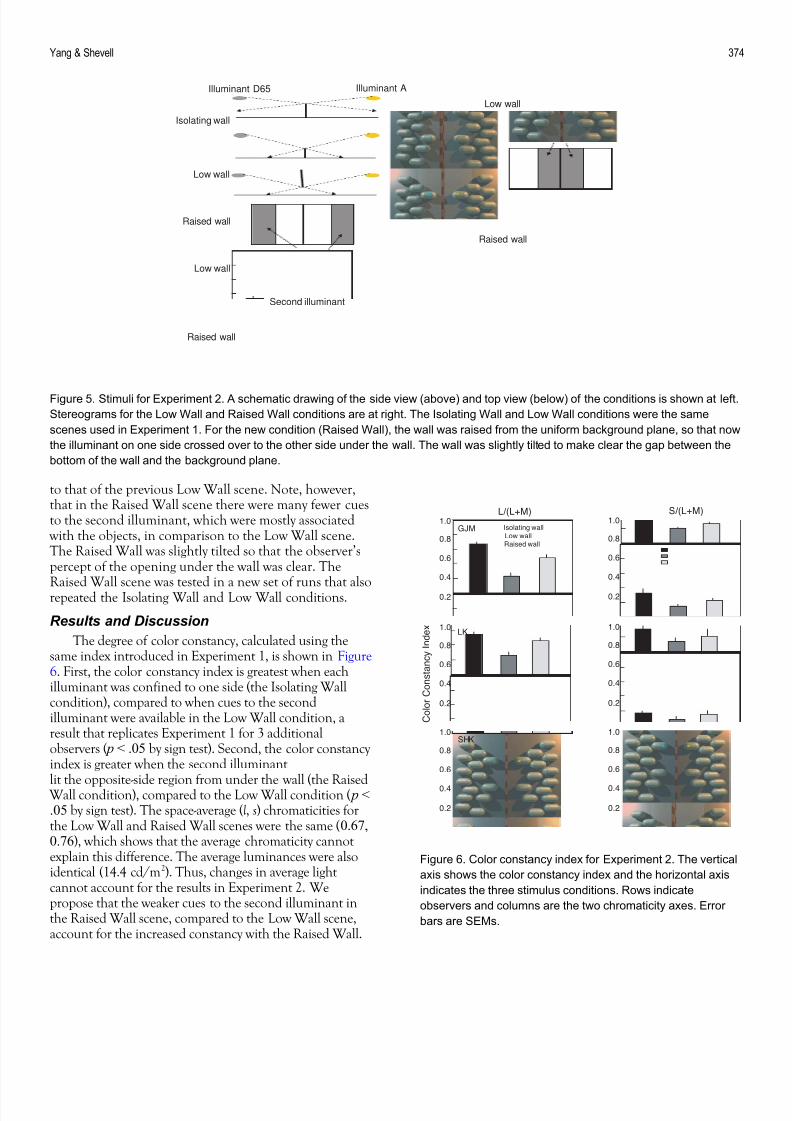
A new stimulus, the Raised Wall scene (Figure 5), wasrendered with the wall raised from the background planeso that the second illuminant came from under the wall.The overall area lit by the second illuminant was similar
Figure 5. Stimuli for Experiment 2. A schematic drawing of the side view (above) and top view (below) of the conditions is shown at left.
Stereograms for the Low Wall and Raised Wall conditions are at right. The Isolating Wall and Low Wall conditions were the same
scenes used in Experiment 1. For the new condition (Raised Wall), the wall was raised from the uniform background plane, so that now
the illuminant on one side crossed over to the other side under the wall. The wall was slightly tilted to make clear the gap between the
bottom of the wall and the background plane.
to that of the previous Low Wall scene. Note, however,that in the Raised Wall scene there were many fewer cuesto the second illuminant, which were mostly associated with the objects, in comparison to the Low Wall scene.The Raised Wall was slightly tilted so that the observer’spercept of the opening under the wall was clear. TheRaised Wall scene was tested in a new set of runs that alsorepeated the Isolating Wall and Low Wall conditions.
GJM
LK
SHK1.0
0.8
0.6
0.4
0.2
1.0
0.8
0.6
0.4
0.2
1.0
0.8
0.6
0.4
0.2
1.0
0.8
0.6
0.4
0.2
1.0
0.8
0.6
0.4
0.2
1.0
0.8
0.6
0.4
0.2
L/(L+M) S/(L+M)
Isolating wallLow wallRaised wall
C o l o r C o n s t a n c y I n d e x
Figure 6. Color constancy index for Experiment 2. The vertical
axis shows the color constancy index and the horizontal axis
indicates the three stimulus conditions. Rows indicate
observers and columns are the two chromaticity axes. Error
bars are SEMs.
Results and Discussion
The degree of color constancy, calculated using thesame index introduced in Experiment 1, is shown in Figure6. First, the color constancy index is greatest when eachilluminant was confined to one side (the Isolating Wallcondition), compared to when cues to the secondilluminant were available in the Low Wall condition, aresult that replicates Experiment 1 for 3 additionalobservers ( p < .05 by sign test). Second, the color constancy index is greater when the second illuminant
lit the opposite-side region from under the wall (the Raised Wall condition), compared to the Low Wall condition ( p <.05 by sign test). The space-average (l, s) chromaticities forthe Low Wall and Raised Wall scenes were the same (0.67,0.76), which shows that the average chromaticity cannotexplain this difference. The average luminances were alsoidentical (14.4 cd/m2). Thus, changes in average lightcannot account for the results in Experiment 2. Wepropose that the weaker cues to the second illuminant inthe Raised Wall scene, compared to the Low Wall scene,account for the increased constancy with the Raised Wall.
The results in Experiment 1 showed that the secondilluminant hampers color constancy, but why? Weapproached this question by using the cue perturbationmethod (Maloney & Landy, 1989; Landy, Maloney,
Johnston, & Young, 1995; a detailed description of thecue perturbation method involving specular highlights isin Yang & Maloney, 2001). The specular-highlight cue tothe second illuminant was perturbed, such that this cue, which carried the second illuminant chromaticity, wasreplaced by a cue carrying the first illuminantchromaticity. This perturbation was expected to revealhow the second illuminant influences color constancy.
The perturbation of specular highlights, however,physically changes the small bright spots in the scene. Toassess whether constancy depends on specular-highlightcues versus just the light from highlights, another scene was constructed. The original (unperturbed) specular
highlights were changed in location so that the highlights were not in their geometrically correct locations. Thus, if the effect of highlights is due to their chromaticities andluminances rather than to their proper geometricalrelations as specular reflections, changing their locationsshould cause no change in the observer’s performance,because the moved specular highlights are still somewherein the scene at their original chromaticities andluminances.
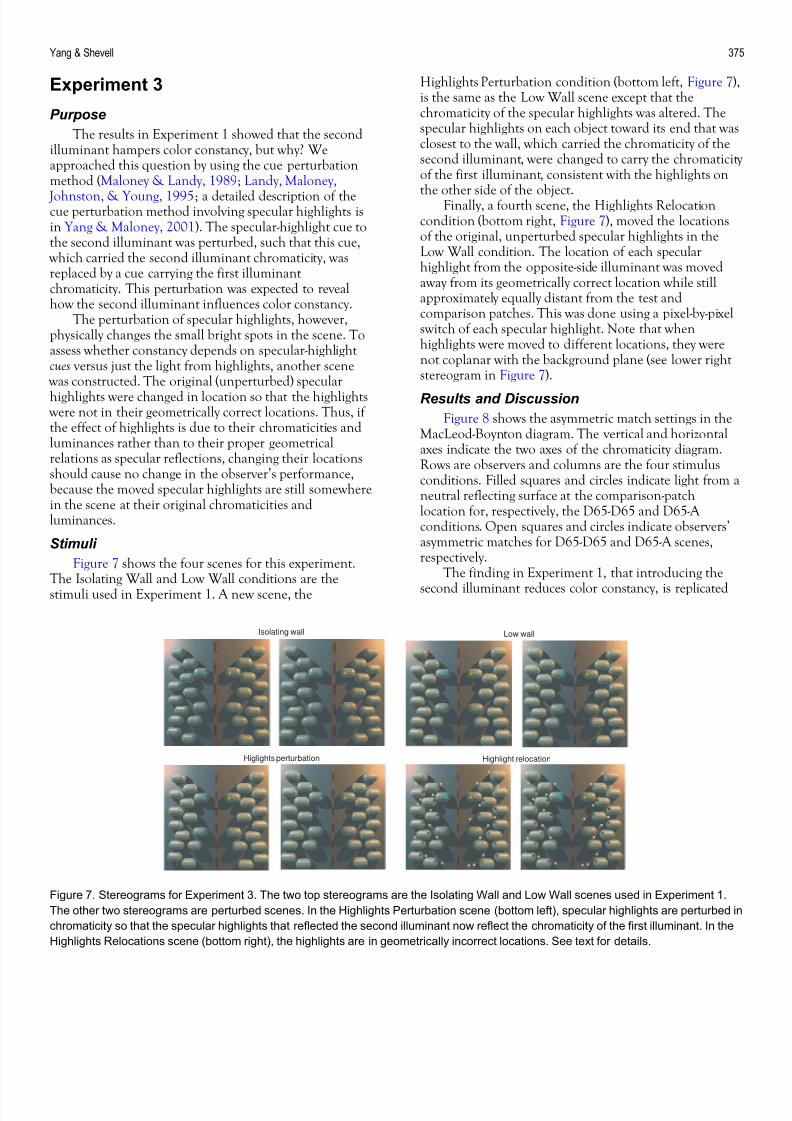
Stimuli
Figure 7 shows the four scenes for this experiment.The Isolating Wall and Low Wall conditions are the
stimuli used in Experiment 1. A new scene, the
Highlights Perturbation condition (bottom left, Figure 7),is the same as the Low Wall scene except that thechromaticity of the specular highlights was altered. Thespecular highlights on each object toward its end that wasclosest to the wall, which carried the chromaticity of thesecond illuminant, were changed to carry the chromaticityof the first illuminant, consistent with the highlights on
the other side of the object.Finally, a fourth scene, the Highlights Relocation
condition (bottom right, Figure 7), moved the locationsof the original, unperturbed specular highlights in theLow Wall condition. The location of each specularhighlight from the opposite-side illuminant was movedaway from its geometrically correct location while stillapproximately equally distant from the test andcomparison patches. This was done using a pixel-by-pixelswitch of each specular highlight. Note that whenhighlights were moved to different locations, they werenot coplanar with the background plane (see lower rightstereogram in Figure 7).
Results and Discussion
Figure 8 shows the asymmetric match settings in theMacLeod-Boynton diagram. The vertical and horizontalaxes indicate the two axes of the chromaticity diagram.Rows are observers and columns are the four stimulusconditions. Filled squares and circles indicate light from aneutral reflecting surface at the comparison-patchlocation for, respectively, the D65-D65 and D65-A conditions. Open squares and circles indicate observers’asymmetric matches for D65-D65 and D65-A scenes,respectively.
The finding in Experiment 1, that introducing the
second illuminant reduces color constancy, is replicated
Isolating wall Low wall
Highlight relocationHiglights perturbation
Figure 7. Stereograms for Experiment 3. The two top stereograms are the Isolating Wall and Low Wall scenes used in Experiment 1.
The other two stereograms are perturbed scenes. In the Highlights Perturbation scene (bottom left), specular highlights are perturbed in
chromaticity so that the specular highlights that reflected the second illuminant now reflect the chromaticity of the first illuminant. In the
Highlights Relocations scene (bottom right), the highlights are in geometrically incorrect locations. See text for details.
Figure 8. Results from Experiment 3 plotted in MacLeod-Boynton Chromaticity Diagram. The asymmetric matching data are shown. The
rows indicate different observers, whereas columns show different stimulus conditions as shown in Figure 7. The vertical and horizontal
axes in each plot indicate the two axes in the chromaticity diagram. Filled squares and circles are the physical illuminants reflected from a
neutral equal-reflecting surface. Dotted arrows show the illuminant change. Open squares and circles show, respectively, observers’
matches for the scenes with both illuminants at D65 or with the left illuminant at D65 and the right at A. Solid arrows indicate changes in
observers’ settings. SEs are indicated for each setting along both axes, though most are hidden by the symbols.
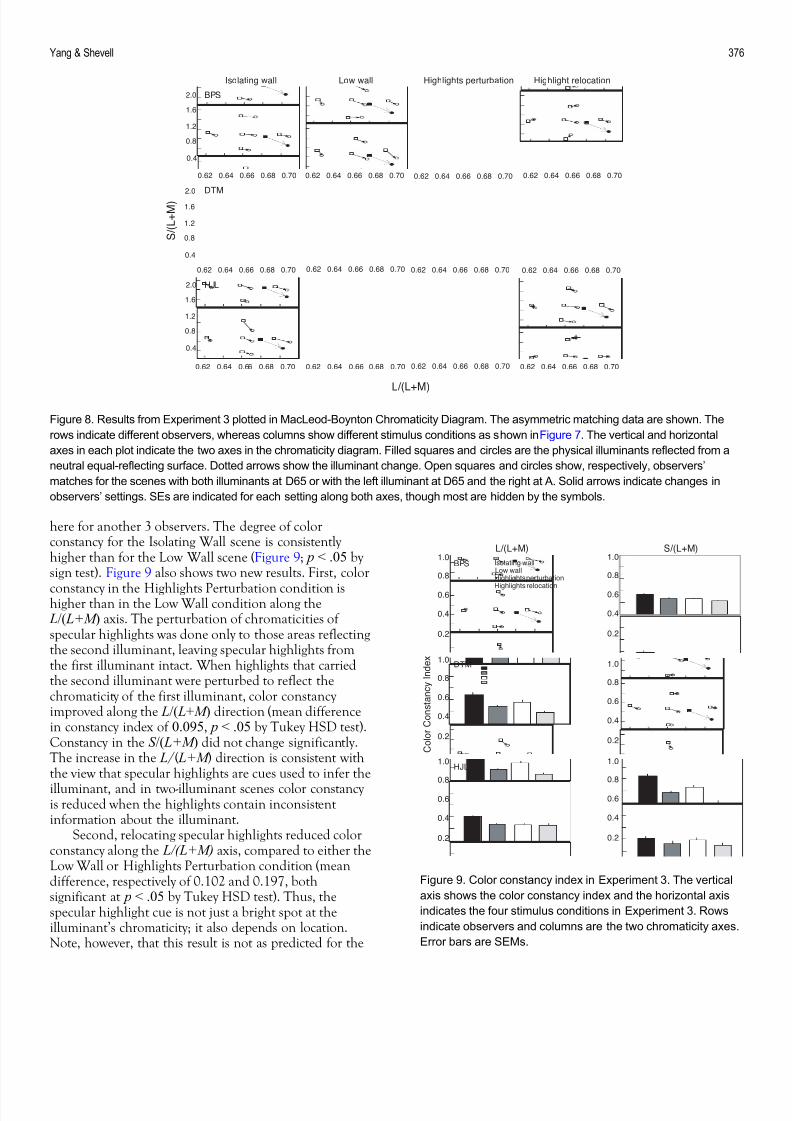
here for another 3 observers. The degree of colorconstancy for the Isolating Wall scene is consistently higher than for the Low Wall scene (Figure 9; p < .05 by sign test). Figure 9 also shows two new results. First, color
constancy in the Highlights Perturbation condition ishigher than in the Low Wall condition along the L/( L+M ) axis. The perturbation of chromaticities of specular highlights was done only to those areas reflectingthe second illuminant, leaving specular highlights fromthe first illuminant intact. When highlights that carriedthe second illuminant were perturbed to reflect thechromaticity of the first illuminant, color constancy improved along the L/( L+M ) direction (mean differencein constancy index of 0.095, p < .05 by Tukey HSD test).Constancy in the S /( L+M ) did not change significantly.The increase in the L /( L+M ) direction is consistent withthe view that specular highlights are cues used to infer the
illuminant, and in two-illuminant scenes color constancy is reduced when the highlights contain inconsistentinformation about the illuminant.
BPS
DTM
HJL1.0
0.8
0.6
0.4
0.2
1.0
0.8
0.6
0.4
0.2
1.0
0.8
0.6
0.4
0.2
1.0
0.8
0.6
0.4
0.2
1.0
0.8
0.6
0.4
0.2
1.0
0.8
0.6
0.4
0.2
Isolating wallLow wallHighlights perturbation
Highlights relocation
C o l o r C o n s t a n c y I n d e x
L/(L+M) S/(L+M)
Figure 9. Color constancy index in Experiment 3. The vertical
axis shows the color constancy index and the horizontal axis
indicates the four stimulus conditions in Experiment 3. Rows
indicate observers and columns are the two chromaticity axes.
Error bars are SEMs.
Second, relocating specular highlights reduced colorconstancy along the L/(L+M) axis, compared to either theLow Wall or Highlights Perturbation condition (meandifference, respectively of 0.102 and 0.197, bothsignificant at p < .05 by Tukey HSD test). Thus, thespecular highlight cue is not just a bright spot at theilluminant’s chromaticity; it also depends on location.Note, however, that this result is not as predicted for the
illuminant estimation hypothesis. The prediction was thatcolor constancy should improve in the HighlightsRelocation condition (compared to the Low Wall)because highlights in geometrically incorrect locationsshould weaken the influence of the second illuminant.The observed reduction in color constancy due torelocating highlights is in the opposite direction. This is
discussed below.
Discussion
Over all the observers and experiments (except theNo Wall condition), the color constancy index rangedfrom 0.10 to 0.68 along the L/( L+M ) axis and from 0.0 to0.56 along the S /( L+M ) axis. These results confirm thatconstancy is neither complete nor fixed in magnitude,across viewing conditions or observers (cf., Arend &Reeves, 1986; Arend et al., 1991; Brainard, 1998; Kraft &Brainard, 1999).
The degrees of color constancy in all Isolating Wall
conditions across the experiments ranged from 0.30 to0.68 (average 0.44) and from 0.17 to 0.56 (average 0.36)for the L/( L+M ) and S /( L+M ) directions, respectively.These are similar to the ranges and averages given inprevious studies, though for somewhat different colorconstancy indexes. For example, values ranged from 0.13to 0.46 (average 0.30) in the study by Arend et al. (1991).
We used two separate constancy indices for the twoaxes, L/( L+M ) and S /( L+M ). Calculating separate indicesrevealed how observers’ settings were influenced along eachdirection in color space. Recall that 3 different observersparticipated in each of the 3 experiments (9 observers inall), and that the Isolating Wall and Low Wall scenes were
included in each experiment. These data were used toassess differences in color constancy along the L/( L+M ) and S /( L+M ) axes. Overall, there was virtually nodifference between the two chromatic axes: the mean color-constancy-index values over the Isolating Wall and Low Wall conditions were 0.31 and 0.30 for L and S,respectively. Analysis of variance confirmed that colorconstancy was better with the Isolating Wall than the Low Wall scene (mean constancy index values of 0.40 and 0.22,respectively; F (1,8)=31, p < .01), as already reported abovefor each of the experiments. There was neither a significanteffect of chromatic axis nor a chromatic-axis by wall-condition interaction. A trend for the color constancy index to decrease more for L/( L+M ) than S /( L+M ) betweenthe Isolating and Low Wall conditions (drops of 0.18 and0.10, respectively) did not reach statistical significance( F (1,8)=4.77, 0.05 < p < .10).
Overall, adding a second illuminant to a scene withan existing illuminant was detrimental to color constancy.To understand why, we altered specular highlightscarrying the chromaticity of the second illuminant so thatthey carried the chromaticity of the first illuminant. Thisimproved color constancy along the L/( L+M ) direction in
Experiment 3, which is consistent with the hypothesisthat specular highlights from the second illuminantcontribute to the reduction in constancy.
Within-cue inconsistency arises when the twoilluminants provide incompatible cues to theillumination. There are many illuminant cues in the Low Wall scene (Figure 1), including specular highlights and
shadows, and each of these cues signals both IlluminantsD65 and A. For example, there are two sets of specularhighlights on most of the objects in this scene, one setreflecting Illuminant D65 and the other set Illuminant A.This is an example of within-cue inconsistency as definedhere. When the specular highlight cue that signaled theinconsistent illuminant was perturbed to achieve cueconsistency (Experiment 3), color constancy improved.Thus, inconsistent specular-highlight cues are proposed asa factor affecting color constancy in a multi-illuminantscene. Perturbation of other cues, a topic for futureresearch, may show similar trends.
The term “within-cue inconsistency” needs to be
interpreted with caution. Here, it means that twooccurrences of the same cue point to differentilluminants. For example, on the left side of a particularobject in the Low Wall condition, the specular highlightsignals Illuminant D65; on the right side, the highlight onthe same object signals Illuminant A. This is differentfrom a scene in which two different cues (e.g., depth cuesfrom perspective and binocular disparity) signalinconsistent depth percepts (Landy, Maloney, Johnston,& Young, 1995), which can be called “between-cueinconsistency.” The scenes with two illuminants usedhere created inconsistency within the same cue type.
In Experiment 3, the results showed that relocating
specular highlights affected color constancy, implying thatcolor constancy is influenced by both the geometry andthe chromaticity of highlights. As mentioned earlier,however, the illuminant estimation framework, whichprovided the rationale for this experiment, implied thatrelocation of the highlights should increase colorconstancy, because relocating the inconsistent cue shouldreduce its influence; instead, the measurements showedpoorer constancy with relocation. We can only speculate why this occurred. Note that in Experiment 3 there is animportant difference between the Highlights Perturbationand Highlights Relocation conditions. In the HighlightsPerturbation scene, only the highlights’ chromaticities were altered; everything else in the scene was unchanged.In the Highlights Relocation scene, however, relocatingthe highlights led to two changes in the scene: (1)disruption of the original geometrically correct locationsof cues to the second illuminant, and (2) a relocated set ofbright spots in nearby locations that still carried thesecond illuminant’s chromaticity. The hypothesis thatcolor constancy would increase due to the relocation of specular highlights takes into account only the firstchange (disruption of geometrically correct locations).The relocated highlights, which were often isolated points
Brainard, D. H., & Freeman, W. T. (1997). Bayesiancolor constancy. Journal of the Optical Society of
America A, 14, 1393-1411.[PubMed]
clearly perceived as closer than the background plane of the scene, may actually have increased the saliency of cues to the second illuminant (a kind of Gelb (1929) effect). Therefore, these measurements may not be inconflict with the illuminant estimation framework.
Brill, M. H. (1978). A device performing illuminant-invariant assessment of chromatic relations. Journal
of Theoretical Biology, 71, 473-478.[PubMed]Results in this study support the view that humancolor constancy is affected by illuminant cues available in
the scene, as assumed by most computational algorithmsin the linear models approach to color constancy.Experiment 2 shows that constancy is affected by thenumber of illuminant cues in a scene. This suggests thatilluminant estimation depends on combining multiplecues. The weights given to the cues may depend on theelements in the particular scene (Maloney & Yang, inpress).
Brill, M. H. (1990). Image segmentation by object color:
A unifying framework and connection to colorconstancy . Journal of the Optical Society of America A,
7, 2041-2047.[PubMed]
Buchsbaum, G. (1980). A spatial processor model forobject color perception. Journal of the Franklin
Institute, 310, 1-26.
Dannemiller, J. L. (1993). Rank orderings of photoreceptor photon catches from natural objectsare nearly illuminant-invariant. Vision Research, 33,131-40.[PubMed]
The scenes used here have identical objects against abackground. One may consider whether the same results would be obtained with scenes having more chromatic variation. Quantitative differences are expected becausecues to the illuminant will not be the same for different
scenes. How the various cues are weighted or combined isan important question for further research.
D’Zmura, M. (1992). Color constancy-surface color fromchanging illumination. Journal of the Optical Society of
America A, 9, 490-493.
D’Zmura, M., & Iverson, G. (1993). Color constancy. I.Basic theory of two-stage linear recovery of spectraldescriptions for lights and surfaces. Journal of the
Optical Society of America A, 10, 2148-2165[PubMed]
Acknowledgments
This work was supported by National Institutes of Health Grant EY-04802. Publication supported in part by an unrestricted grant to the Department of Ophthalmology and Visual Science from Research toPrevent Blindness. Commercial relationships: none.
D’Zmura, M., & Lennie, P. (1986). Mechanisms of colorconstancy . Journal of the Optical Society of America A,
3, 1662-1672.[PubMed]
Funt, B., Drew, M., & Ho, J. (1991). Color constancy from mutual reflection. International Journal of
Computer Vision, 6, 5-24.References
Gelb, A. (1929). Die “Farbenkonstanz” den Sehndinge.In A. Bethe (Ed.) Handbuch der normalen und
pathologischen Physiologie, 12. Berlin: Springer.
Arend, L. E., & Reeves, A. (1986). Simultaneous colorconstancy. Journal of the Optical Society of America A,3, 1743-1751.[PubMed]
Hurlbert, A. C. (1998). Computational models of colorconstancy. In V. Walsh & J. Kulikowski (Eds.),Perceptual constancies; why things look as they do
(pp.283-322). Cambridge: Cambridge University Press.
Arend, L., Reeves, A., Schirillo, J., & Goldstein, R.(1991). Simultaneous color constancy: Papers withdiverse Munsell values. Journal of the Optical Society of
America A, 8, 661-672. [PubMed]
Bloj, M., Kersten, D., & Hurlbert, A. C. (1999).Perception of three-dimensional shape influencescolor perception through mutual illumination.Nature, 402, 877-879.[PudMed]
Jin, E. W., & Shevell, S. K. (1996). Color memory andcolor constancy . Journal of the Optical Society of
America A, 13, 1981-1991.[PubMed]
Kelley, K. L., Gibson, K. S., & Nickerson, D. (1943).Tristimulus specification of the Munsell Book of Color from spectrophotometric measurements. Journal of the Optical Society of America, 33, 355-376.
Blake, A., & Bülthoff, H. (1990) Does the brain know thephysics of specular reflection? Nature, 343, 165-168.
Blake, A., & Bulthoff, H. (1991). Shape fromspecularities; Computation and psychophysics.Philosophical Transactions of the Royal Society of London
B, 331, 237-252.
Kraft, J. M., & Brainard, D. H. (1999). Mechanisms of color constancy under nearly natural viewing.Proceedings of the National Academy of Sciences, USA,
96, 307-312.[PubMed].Brainard, D. H. (1998). Color constancy in the nearly natural image. 2. Achromatic loci. Journal of the
Optical Society of America A, 15, 307-325.[PubMed] Land, E. H. (1986). Recent advances in retinex theory.
Land, E. H., & MaCann, J. J. (1971). Lightness andretinex theory. Journal of the Optical Society of America,
61, 1-11.[PubMed]
Landy, M. S., Maloney, L. T., Johnston, E. B., & Young,M. (1995). Measurement and modeling of depth cuecombination: In defense of weak fusion. Vision
Research, 35, 389-412.[PubMed]
Larson, G. W., & Shakespeare, R. (1997). Rendering withRadiance. San Francisco: Morgan Kaufmann.
Lee, H. C. (1986). Method for computing the scene-illuminant chromaticity from specular highlights. Journal of the Optical Society of America A, 3, 1694-1699.[PubMed]
MacLeod, D., & Boynton, R. (1979). Chromaticity diagram showing cone excitation by stimuli of equalluminance. Journal of the Optical Society of America A,
69, 1183-1186.[Pubmed]
MacLeod, D., & Golz, J. (in press). A computationalanalysis of colour constancy. In R. Mausfeld & D.Heyer (Eds.), Colour vision: From light to object.Oxford: Oxford University Press.
Maloney, L. T. (1986). Evaluation of linear models of surface spectral reflectance with small numbers of parameters. Journal of the Optical Society of America A,
3, 1673-1681.[PubMed]
Maloney, L. T. (1999). Physics-based models of surfacecolor perception. In K. R. Gegenfurtner & L. T.Sharpe (Eds), Color vision: From genes to perception (pp.387- 416). Cambridge: Cambridge University Press.
Maloney, L. T., & Landy, M. S. (1989). A statistical
framework for robust fusion of depth information.Visual Communications and Image Processing IV, 1199,1154-1163.
Maloney, L. T., & Wandell, B. A. (1986). Colorconstancy: A method for recovering surface spectralreflectance. Journal of the Optical Society of America A,
3, 29-33.[PubMed]
Maloney, L. T., & Yang, J. N. (in press). The illuminantestimation hypothesis. In R. Mausfeld & D. Heyer(Eds.), Colour vision: From light to object. Oxford:
Oxford University Press.Nascimento, S. M., & Foster, D. H. (2000). Relational
color constancy in achromatic and isoluminantimages. Journal of the Optical Society of America A, 17,225-231[PubMed]
Pokorny, J., Shevell, S. K., & Smith, V. C. (1991) Colourappearance and color constancy. In P. Gouras (Ed.),The Perception of Color (pp. 43-61). Boca Raton: CRCPress.
Schirillo, J. A., & Shevell, S. K. (2000). Role of perceptualorganization in chromatic induction. Journal of the
Optical Society of America A, 17, 244-254.[PubMed]
Tominaga, S., & Wandell, B. A. (1989). Standard surface-reflectance model and illuminant estimation. Journal
of the Optical Society of America A, 6, 576-584.
Ullman, S. (1976). On visual detection of light sources.Biological Cybernetics, 21, 205-212.[Pubmed]
Yang, J. N. (1999). Analysis of illuminant estimation insurface color perception. Doctoral disseration. New York: New York University.
Yang, J. N., & Maloney, L. T. (2001). Illuminant cues insurface color perception: Tests of three candidatecues. Vision Research, 41, 2581-2600.[PubMed]
Yang, J. N., & Shevell, S. K. (2002). Stereo disparity improves color constancy. Vision Research, 42, 1979-1989.[PubMed]
Zaidi, Q. (1998). Identification of illuminant and objectcolors: Heuristic-based algorithms. Journal of the
Optical Society of America A, 15, 1767-1776.[PubMed]