Surface mineral mapping at Steamboat Springs, Nevada, USA, with multi-wavelength thermal infrared images R. Greg Vaughan a, * , Simon J. Hook b , Wendy M. Calvin a , James V. Taranik a a Department of Geological Sciences, University of Nevada Reno, United States b Jet Propulsion Laboratory, California Institute of Technology, Pasadena, CA, United States Received 14 September 2004; received in revised form 13 April 2005; accepted 28 April 2005 Abstract The purpose of this study was to evaluate the use of airborne multispectral and hyperspectral thermal infrared (TIR) image data for mapping surface minerals characteristic of active geothermal systems. TIR image data from the MASTER multispectral spectrometer and the SEBASS hyperspectral spectrometer were acquired over Steamboat Springs, Nevada, USA, in September 1999. Spectral emissivity information was extracted from the data and used to generate mineral maps. Using the MASTER data it was possible to map the extent of the active geothermal area as well as silica-rich vs. clay-rich areas. Using the SEBASS data the same areas could be mapped and additionally the presence of several minerals, including opal, quartz, alunite, anorthite, albite, and kaolinite could be identified. The SEBASS data also detected previously unidentified hydrous sulfate minerals (tamarugite and alunogen) forming around active fumaroles. Laboratory spectral data and XRD analyses of field samples confirmed the dominant mineral phases identified remotely. The airborne, field and laboratory data together with temperature anomaly and fumarole location data from other studies were synthesized and linked to the surface geology to determine the diagnostic surface mineral expression that could be mapped with TIR remotely sensed data for future exploration for similar geothermal systems. Opaline sinter deposits are the most diagnostic surface expression of hot spring activity at Steamboat Springs because they represent areas of the recent geyser activity. The differentiation between opal and chalcedony deposits and the identification of hydrous sulfate minerals forming around active fumaroles are also important because chalcedony represents ancient sinter deposits and hydrous sulfate minerals indicate locations of fumaroles that may be venting diffusely with no geyser activity. The surface expression of the geothermal system at Steamboat Springs is small, which emphasizes the need for high spatial resolution airborne imagers. The 90-m pixels of ASTER TIR data over the same area were only capable of resolving the area of past and recent sinter deposits together. MASTER multispectral TIR data covered the entire area (¨12 km 2 ) at 5-m spatial resolution and were capable of defining the extent of the sinter deposits and zones of hydrothermally altered rocks. The SEBASS image swath was too narrow (256 m) to add significant spatial information to the overall map, but the high spectral content identified several important minerals related to the local geology and the mineralogic surface expression of the geothermal system. D 2005 Elsevier Inc. All rights reserved. Keywords: Thermal infrared; Multispectral; Hyperspectral; Emissivity; Mineral mapping; Geothermal exploration 1. Introduction Airborne imaging spectrometers fill an important niche for small- to intermediate-scale geologic remote sensing research that compliments the global-scale data sets of satellite sensors. This study evaluates the use of thermal infrared (TIR) remote sensing instruments for geothermal resource exploration in Nevada, USA. Nevada is considered to have the largest untapped geothermal resources in the United States (http://www.eere.energy.gov/geothermal) and Steamboat Springs is one of only nine active geothermal systems in Nevada that is currently producing geothermal power. Recent US Department of Energy initiatives com- mitted to developing geothermal resources in the western 0034-4257/$ - see front matter D 2005 Elsevier Inc. All rights reserved. doi:10.1016/j.rse.2005.04.030 * Corresponding author. E-mail address: [email protected] (R.G. Vaughan). Remote Sensing of Environment 99 (2005) 140 – 158 www.elsevier.com/locate/rse
Transcript
www.elsevier.com/locate/rse
Remote Sensing of Environm
Surface mineral mapping at Steamboat Springs, Nevada, USA,
with multi-wavelength thermal infrared images
R. Greg Vaughan a,*, Simon J. Hook b, Wendy M. Calvin a, James V. Taranik a
aDepartment of Geological Sciences, University of Nevada Reno, United StatesbJet Propulsion Laboratory, California Institute of Technology, Pasadena, CA, United States
Received 14 September 2004; received in revised form 13 April 2005; accepted 28 April 2005
Abstract
The purpose of this study was to evaluate the use of airborne multispectral and hyperspectral thermal infrared (TIR) image data for
mapping surface minerals characteristic of active geothermal systems. TIR image data from the MASTER multispectral spectrometer and the
SEBASS hyperspectral spectrometer were acquired over Steamboat Springs, Nevada, USA, in September 1999. Spectral emissivity
information was extracted from the data and used to generate mineral maps. Using the MASTER data it was possible to map the extent of the
active geothermal area as well as silica-rich vs. clay-rich areas. Using the SEBASS data the same areas could be mapped and additionally the
presence of several minerals, including opal, quartz, alunite, anorthite, albite, and kaolinite could be identified. The SEBASS data also
detected previously unidentified hydrous sulfate minerals (tamarugite and alunogen) forming around active fumaroles. Laboratory spectral
data and XRD analyses of field samples confirmed the dominant mineral phases identified remotely. The airborne, field and laboratory data
together with temperature anomaly and fumarole location data from other studies were synthesized and linked to the surface geology to
determine the diagnostic surface mineral expression that could be mapped with TIR remotely sensed data for future exploration for similar
geothermal systems. Opaline sinter deposits are the most diagnostic surface expression of hot spring activity at Steamboat Springs because
they represent areas of the recent geyser activity. The differentiation between opal and chalcedony deposits and the identification of hydrous
sulfate minerals forming around active fumaroles are also important because chalcedony represents ancient sinter deposits and hydrous
sulfate minerals indicate locations of fumaroles that may be venting diffusely with no geyser activity. The surface expression of the
geothermal system at Steamboat Springs is small, which emphasizes the need for high spatial resolution airborne imagers. The 90-m pixels of
ASTER TIR data over the same area were only capable of resolving the area of past and recent sinter deposits together. MASTER
multispectral TIR data covered the entire area (¨12 km2) at 5-m spatial resolution and were capable of defining the extent of the sinter
deposits and zones of hydrothermally altered rocks. The SEBASS image swath was too narrow (256 m) to add significant spatial information
to the overall map, but the high spectral content identified several important minerals related to the local geology and the mineralogic surface
expression of the geothermal system.
D 2005 Elsevier Inc. All rights reserved.
Keywords: Thermal infrared; Multispectral; Hyperspectral; Emissivity; Mineral mapping; Geothermal exploration
1. Introduction
Airborne imaging spectrometers fill an important niche
for small- to intermediate-scale geologic remote sensing
research that compliments the global-scale data sets of
0034-4257/$ - see front matter D 2005 Elsevier Inc. All rights reserved.
(Kruse et al., 1993) and Matched Filtering (MF) (Boardman
et al., 1995). SAM classifies pixels together based on their
spectral similarity by treating spectra as vectors in n-
dimensional space and calculating the angle between them.
The threshold angle used was 0.05 radians. MF generates
proportional spectral end member abundance maps based on
partial unmixing of image target spectra (Boardman et al.,
1995). It maps the abundances of pixels that most closely
match the target spectrum of known end members while
filtering out unmatched background pixels. For each end
member mapped, a region of interest (ROI) was defined by
selecting a range of threshold values from the abundance
maps that corresponded to the highest abundance. Each ROI
was assigned to a unique color and displayed over a gray-
scale image to produce a mineral classification map. Finally,
based on matching the spectra of classified pixels to the
spectra of pure minerals from reference libraries, mineralogy
was assigned to classified pixel regions to produce mineral
maps that will be discussed in Section 6.
Quartz
Albite
Kaolinite
Linear Mixture 1
Linear Mixture 2
0.7
0.6
0.8
0.9
1.0
Em
issi
vity
(of
fset
for
clar
ity)
8 9 10 11 12
Wavelength (µm)
0.5
Fig. 5. Example of linear mixing of pure mineral reference spectra in the
TIR wavelength region. Linear mixture 1 is 10% quartz, 45% albite, and
45% kaolinite; linear mixture 2 is 40% quartz, 30% albite, and 30%
kaolinite.
R.G. Vaughan et al. / Remote Sensing of Environment 99 (2005) 140–158148
5.4. Mineral mapping limitations and linear spectral mixing
Natural geologic surfaces are often partially covered with
non-geologic materials (e.g., vegetation) or composed of
mixtures of minerals with varying grain sizes and differing
degrees of compaction/solidification. These factors influ-
ence remote spectral measurements and limit the number of
pixels that can be classified and mapped. In the TIR spectral
range, decrease in particle size can increase volume
scattering and decrease the spectral contrast (overall depth)
of the reststrahlen features–unless the particles are com-
pacted sufficiently to scatter coherently, in which case the
spectral contrast remains relatively high (Salisbury & Wald,
1992). Reference spectra have been acquired for some
minerals with different grain sizes to study the effects of
grain size on spectral characteristics (e.g. Salisbury et al.,
1991). Not all minerals, however, have been subjected to
such systematic spectral characterization. Therefore, the
reference spectra used in this study are from measurements
of coarse grained (>250 Am) and solid samples, and no
attempt was made to model grain size variations based on
image spectra.
Mixing can exist at various scales and also affects the
measured infrared spectral properties of an area (Clark,
1999). Even high-spatial-resolution (2-m pixel) images can
have contributions from multiple sub-pixel-scale compo-
nents. Using TIR data, Ramsey and Christensen (1998)
showed that a linear unmixing technique that models the
percentage of each end member composition can be used to
identify individual surface minerals within a single pixel. A
similar approach was used in this study by calculating linear
mixtures of reference spectra from the ASTER and ASU
spectral libraries and plotting them with the remote and field
spectra for comparison (Vaughan et al., 2003). To begin
with, reference spectra for pure minerals were chosen based
on initial spectral analyses and knowledge of the geology
and alteration minerals expected in each study area. Then
linear combinations of these pure mineral spectra were
plotted and compared to SEBASS image spectra. Since the
broad spectral band pass of MASTER does not permit
unique mineral identification, only SEBASS emissivity
spectra were modeled by linear mixtures of reference
spectra. Fig. 5 shows examples of spectral plots for pure
minerals and the results of linear combinations. Through
visual inspection and trial and error, spectral mixtures were
matched to image spectra to identify the dominant mineral
phases present. It is important to note that the percentages of
mineral components used in the spectral mixtures do not
reflect the actual percentages of the minerals in the pixel. In
some cases, reference spectra from pure minerals and
mineral mixtures had to be scaled down to directly overlay
with the image spectra. This is a function of the generally
lower spectral contrast that appears in remotely acquired
spectra due to either grain size effects, mixing with either
non-geologic components or other minerals that have low
spectral contrast, or in the case of SEBASS, the lack of
correction for reflected down-welling radiance in the
atmospheric correction process. As a result of this semi-
quantitative treatment of linear mixtures, spectral feature
depth and absolute emissivity values were not perfectly
preserved, and no attempt was made to quantitatively model
mixtures of pure minerals to match the SEBASS spectra. As
will be shown in the next section, only spectral shapes and
feature locations were used for mineral identification and
these methods were sufficient to detect the presence of the
dominant mineralogy of mixed pixels and produce a mineral
map.
6. Results and interpretation
6.1. Decorrelation stretch
Fig. 6A shows a decorrelation stretch (DCS) image of the
90-m ASTER TIR channels 14, 13, and 12 (wavelengths
11.32, 10.66, and 9.08 Am) displayed as red, green, and blue
(RGB), respectively. With these channels, the silica-rich
sinter area around Steamboat Springs stands out as yellow in
the center of the image because silica has a low emissivity
around 9.0 Am (channel 12–blue) and higher emissivity at
10.66 and 11.32 Am (channel 13–green and channel 14–
red, respectively). For a comparison the accompanying Fig.
6B shows a false color composite of ASTERVNIR channels
golf course
sinter area
acid-sulfate area
irrigated fields
Steamboat Hills
MASTER
SEBASS
sinter area
irrigated fieldsgolf
course
Steamboat Hills
1 kmN
A
B
1 kmNFig. 6. A. ASTER TIR DCS image over Steamboat Springs. ASTER TIR
DCS channels 14, 13 and 12 are displayed as RGB, respectively. This set of
channels (different than those typically used for DCS images) more clearly
highlights differences between silica and clay. The sub-horizontal noisy
scan lines are due to the ASTER TIR scanner. The areas imaged by
MASTER and SEBASS are outlined by the rectangles. The spatial
resolution for the ASTER TIR image is 90 m. B. ASTER VNIR image
over Steamboat Springs. ASTERVNIR channels 2, 3N and 1 are displayed
as RGB, respectively. The areas imaged by MASTER and SEBASS are
outlined by the rectangles. The spatial resolution for the ASTER VNIR
image is 15 m.
R.G. Vaughan et al. / Remote Sensing of Environment 99 (2005) 140–158 149
2, 3N, and 1 (wavelengths 0.66, 0.81, and 0.55 Am,
respectively) displayed as RGB. In this image, healthy
vegetation (e.g. irrigated fields) appears bright green, and
dry desert vegetation appears various shades of purple. The
bright, white areas correspond to the siliceous sinter area
around Steamboat Springs and an area of acid-sulfate
alteration to the west. With the 15-m pixels of the VNIR
image more detail about the region can be seen, including
roads, fields, urban areas, the sinter area and acid-sulfate
alteration area, areas with recent construction activity, a golf
course, small lakes, and healthy vegetation along stream
drainages. At the 90-m spatial resolution of the TIR
channels (Fig. 6A), the siliceous sinter area (yellow) and
large vegetated areas (dark) are the only regional spatial
features that are clearly mappable. Outlines of the high-
spatial resolution airborne images acquired by the MASTER
and SEBASS instruments are indicated with black rectan-
gles in each image.
Fig. 7A shows the DCS of MASTER channels 48, 45,
and 44 (wavelengths 11.20, 9.68, and 9.05 Am, respectively)
displayed as RGB. This channel combination was chosen to
mimic the color scheme of the SEBASS DCS (described
next). Silica-dominated regions appear yellow because silica
has a low emissivity associated with the reststrahlen band
around 9.0 Am (channel 44–blue) and high emissivity at 9.6
and 11.2 Am (channel 45–green and channel 48–red,
respectively). For example, the large yellow region on the
right side of the image represents the siliceous sinter
deposits around Steamboat Springs. The Ormat (formerly
SB Geo, inc.) geothermal power plant is located just north
of most of the recent sinter deposition (brightest yellow).
Clay-dominated areas appear magenta to purple because
clay has a low emissivity value around 9.6 Am (channel 45–
green) and higher values at 9.0 and 11.2 Am (channel 44–
blue, and channel 48–red). The low emissivity values of
clays (phyllosilicate minerals) are also associated with a
reststrahlen band but the minimum is shifted to slightly
longer wavelengths (see Fig. 1A). For example, on the left
side of the image, west of Steamboat Springs, there are a
number of areas with active urban development and the
exposed soils and dirt roads are clay-rich. In contrast,
ASTER is not capable of separating clay-rich from silica-
rich areas due to the lack of a spectral channel between 9.1
and 10.6 Am, where clay minerals have their strongest
spectral features. Healthy vegetation (trees, lawns and
fields) is dark green; for example, the sports fields around
Galena High School left center of image. Areas that appear
cyan to dark purple are generally covered by dry desert
vegetation (sagebrush and cheat grass) and are thus
spectrally featureless and indistinguishable in the TIR.
However, because differences in albedo also affect colors
in the DCS image, some geologic information can be
interpreted from the differences between cyan areas (under-
lain by variably altered granodiorite) and the darker purple
areas (underlain by basaltic andesite), e.g., the area just
southwest of the main sinter terrace. Roads appear in
various shades of purple and orange due to differences in
composition: asphalt, cement or dirt/gravel, and roofs in
urban areas appear green, blue, or yellow.
The channel combination used for all the DCS images
here is not the same combination that has commonly been
used with other multispectral TIR data, such as TIMS,
which results in silica-rich areas displayed as red and clay-
rich areas as purple (Kahle, 1987; Ramsey et al., 1999;
Sabine et al., 1994). The channel combination used here
produces a more obvious visual distinction between the
silica- and clay-rich areas that dominate the geologic
variance in this scene. Furthermore, with the hyperspectral
SEBASS data, the wavelength channels used in the DCS
Fig. 7. A. MASTER decorrelation stretch (DCS) image over Steamboat Springs displaying channels 48, 45, and 44 as RGB. This set of channels (different than
those typically used for DCS images) more clearly highlights differences between silica and clay. Color variations are related to emissivity differences, and thus
surface compositional differences; temperature variations are displayed as intensity differences. The dashed outline indicates the extent of the SEBASS data
coverage. The spatial resolution for the MASTER image is 5 m. B. SEBASS DCS image over Steamboat Springs (modified from Vaughan et al., 2003)
displaying channels 66, 45, and 44 as RGB. The color scheme is the same as for Fig. 9, additionally. The spatial resolution for the SEBASS image is 2 m.
R.G. Vaughan et al. / Remote Sensing of Environment 99 (2005) 140–158150
here produce a color separation of other mineral groups. The
SEBASS DCS uses channels 66, 35, and 24 (wavelengths
11.0, 9.5, and 9.1 Am, respectively) as RGB (Fig. 9). The
resultant colors are similar to those of the MASTER DCS
with silica-rich areas in yellow and clay-rich areas in
magenta, e.g., the bright yellow siliceous sinter area on the
east side of the Steamboat Springs image, and some clay-
rich (magenta) areas in the acid-sulfate alteration region to
the west. Because of the higher spectral resolution of
SEBASS, the DCS separates more compositional end
members, for example pale green areas that contain sulfates
like alunite (also in the acid sulfate alteration region). In all
the DCS images temperature variations appear as intensity
differences that look like shadows on the north-facing
slopes.
6.2. Mineral maps and emissivity spectra
Using the spectral information measured by each
airborne instrument, mineral maps were created using the
methods described in Section 5.3. In general, surface cover
types included vegetation, rock outcrop, soil, or man-made
materials such as roofs or roads. Roofs and other man-made
materials sometimes have characteristic spectral features in
the TIR spectral region, but to focus on mapping minerals
related to local geology, pixels over roads and urban areas
were not mapped. In some cases pixels were mineralogi-
cally homogenous, containing only one mineral phase
across the entire pixel (e.g., on the sinter terrace). In other
cases pixels were mineralogically heterogeneous. A pixel
that contains a mixture of different materials produces a
spectrum that represents a linear combination of each
component. As described in Section 5.4, reference spectra
for pure minerals from TIR spectral libraries were mixed
together in a linear fashion to approximate the remotely
measured SEBASS spectra and identify the presence of the
dominant mixed components. In many pixels however,
even small (2-m) pixels, contribution from non-geologic
components (primarily vegetation) adversely affected the
mineralogic spectral signature. In general, pixels dominated
by (containing >50%) non-geologic materials were not
classified and mapped. In the TIR region vegetation
approximates a blackbody with a very high emissivity that
is invariant with wavelength (Salisbury & D’Aria, 1992).
As a result, mixture with vegetation reduces the overall
spectral contrast of mineralogic spectral features within a
mixed pixel, so the presence of vegetation was not modeled
using TIR data.
R.G. Vaughan et al. / Remote Sensing of Environment 99 (2005) 140–158 151
Fig. 8 (top) is the MASTER mineral map over Steamboat
Springs. There are two different mineralogical compositions
mapped: yellow areas are generally silica- or sulfate-rich
and represent either quartz, alunite, or opal; magenta areas
are generally clay-rich and represent either kaolinite or
montmorillonite. The silica-rich areas were classified based
on a common emissivity minimum centered around 9.1 Am,
Fig. 8. MASTER mineral map over Steamboat Springs (top). The two mapped reg
either silica-rich or clay-rich. MASTER spectra (lower plots) for selected sites (8, 1
to the map legend and compared to mineral reference spectra resampled to MASTE
The dashed outline represents the extent of the SEBASS data coverage shown in
and the clay-rich areas were classified based on an
emissivity minimum around 9.7 Am. In the spectral plots,
MASTER spectra in yellow (left) match the ASU library
reference spectra for either quartz, alunite, or opal; the
spectra in magenta (right) match the ASU library reference
spectrum for clay minerals such as kaolinite and montmor-
illonite. The spectral resolution of MASTER was not
ions are overlain onto a gray-scale temperature image, and distinguished as
1b, 12, 16, and 18–marked with triangles on the map), are color coordinated
R’s spectral resolution. Other field sites are marked with circles on the map.
Fig. 9. The spatial resolution for the MASTER image is ¨5 m.
R.G. Vaughan et al. / Remote Sensing of Environment 99 (2005) 140–158152
sufficient to resolve the subtle spectral differences between
the minerals within each class.
Fig. 9 shows the SEBASS mineral map of Steamboat
Springs (dashed outline in Fig. 8), which is improved over
the SEBASS mineral mapping shown in Vaughan et al.
(2003). Although it covers a very narrow swath, the spectral
resolution of SEBASS was capable of separating more
spectral end members and mapped more unique minerals
than the multispectral MASTER data. The SEBASS
spectrum in orange from the siliceous sinter area (site 8–
left spectral plot) matches the reference spectrum of opal. In
this case, due to limited samples in existing spectral libraries,
a new reference spectrum for opal was determined using
Map Color Legend
Alunite
Opal
Albite + Kaolinite + Alunite Kaolinite
Na-Al sulfate (Tamarugite/Alunogen)
Quartz
11b12
Albite + Andesine
9
21
Em
issi
vity
(of
fset
for
clar
ity)
8 10 11 12
0.7
0.8
0.9
1.0
9
Wavelength (µm)
Site 12
Site 11b
Site 8
opal
quartz
alunite
0.25 kmN
Fig. 9. SEBASS mineral map over Steamboat Springs (top) (modified from Vaug
emissivity image, and distinguished by their dominant mineralogy as noted in the
11b, 12, 19, and 21–marked with triangles on map) are color coordinated to the m
mixtures of mineral reference spectra. The spatial resolution for the SEBASS im
measurements at the JPL spectroscopy laboratory of samples
from the siliceous sinter terrace at Steamboat Springs. The
narrow emissivity minimum around 9.0 Am is characteristic
of opal and XRD analyses confirm the composition of
siliceous sinter as pure opal. The SEBASS spectrum in
yellow from the acid-sulfate alteration area (site 9–left
spectral plot) matches the ASU library reference spectrum of
quartz. The large doublet feature between 8.2 and 9.2 Amwith an emissivity peak at 8.62 Am is characteristic of
crystalline quartz. XRD analyses confirm that quartz is the
dominant mineral at this site. The SEBASS spectrum in blue
from the acid-sulfate alteration area (site 12–left spectral
plot) matches the JPL library reference spectrum of alunite.
19
8
7
Site 9
Site 7
Site 19
8 10 11 129Wavelength (µm)
Site 21
SEBASS spectra
Plot Color Legend
Reference spectra of pure minerals or linear mixtures
kaolinite
kaolinite + albite + alunite
anorthite + kaolinite
gypsum + mirabilite
han et al., 2003). The seven regions mapped are overlain onto a gray-scale
legend. SEBASS spectra (bottom, left and right) from the field sites (7, 8, 9,
ap legend and compared to reference spectra from pure minerals, or linear
age is ¨2 m.
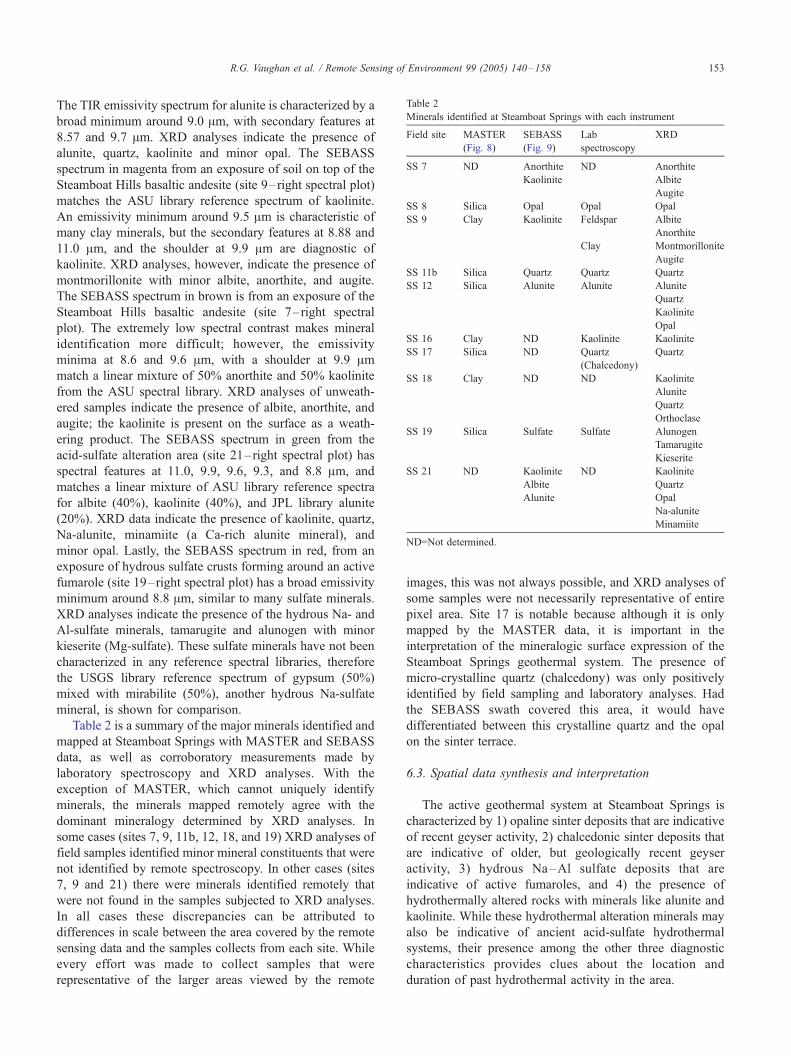
Table 2
Minerals identified at Steamboat Springs with each instrument
Field site MASTER
(Fig. 8)
SEBASS
(Fig. 9)
Lab
spectroscopy
XRD
SS 7 ND Anorthite
Kaolinite
ND Anorthite
Albite
Augite
SS 8 Silica Opal Opal Opal
SS 9 Clay Kaolinite Feldspar Albite
Anorthite
Clay Montmorillonite
Augite
SS 11b Silica Quartz Quartz Quartz
SS 12 Silica Alunite Alunite Alunite
Quartz
Kaolinite
Opal
SS 16 Clay ND Kaolinite Kaolinite
SS 17 Silica ND Quartz
(Chalcedony)
Quartz
SS 18 Clay ND ND Kaolinite
Alunite
Quartz
Orthoclase
SS 19 Silica Sulfate Sulfate Alunogen
Tamarugite
Kieserite
SS 21 ND Kaolinite
Albite
Alunite
ND Kaolinite
Quartz
Opal
Na-alunite
Minamiite
ND=Not determined.
R.G. Vaughan et al. / Remote Sensing of Environment 99 (2005) 140–158 153
The TIR emissivity spectrum for alunite is characterized by a
broad minimum around 9.0 Am, with secondary features at
8.57 and 9.7 Am. XRD analyses indicate the presence of
alunite, quartz, kaolinite and minor opal. The SEBASS
spectrum in magenta from an exposure of soil on top of the