Surfactant-Free Synthesis of Three-Dimensional PerovskiteTitania-Based Micron-Scale Motifs Used as Catalytic Supportsfor the Methanol Oxidation Reaction
Nathaniel Hurley 1, Luyao Li 1, Christopher Koenigsmann 2 and Stanislaus S. Wong 1,*
1 Department of Chemistry, State University of New York at Stony Brook, Stony Brook, NY 11794-3400, USA;[email protected] (N.H.); [email protected] (L.L.)
Abstract: We synthesized and subsequently rationalized the formation of a series of 3D hierarchicalmetal oxide spherical motifs. Specifically, we varied the chemical composition within a familyof ATiO3 (wherein “A” = Ca, Sr, and Ba) perovskites, using a two-step, surfactant-free synthesisprocedure to generate structures with average diameters of ~3 microns. In terms of demonstratingthe practicality of these perovskite materials, we have explored their use as supports for the methanoloxidation reaction (MOR) as a function of their size, morphology, and chemical composition. TheMOR activity of our target systems was found to increase with decreasing ionic radius of the “A”site cation, in order of Pt/CaTiO3 (CTO) > Pt/SrTiO3 (STO) > Pt/BaTiO3 (BTO). With respect tomorphology, we observed an MOR enhancement of our 3D spherical motifs, as compared with eitherultra-small or cubic control samples. Moreover, the Pt/CTO sample yielded not only improvedmass and specific activity values but also a greater stability and durability, as compared with bothcommercial TiO2 nanoparticle standards and precursor TiO2 templates.
Keywords: platinum nanoparticles; metal oxide; synthesis; electrocatalysis; interfacial chemistry
1. Introduction
Ferroelectric perovskite-type oxides, with a general formula of ABO3, are noteworthyfor their advantageous dielectric, piezoelectric, electrostrictive, and electro-optic proper-ties [1–7]. Understanding the behavior of and the preparation of this interesting family ofmetal oxide materials with structure-dependent physical properties, at the nanoscale, areof importance to developing viable applications. Specifically, titanate-based perovskites(i.e., B = Ti) have found practical utility within the context of medical applications [8], pho-tocatalysis [7,9,10], and energy storage [11,12]. In addition, they have been used as catalystsupports for electrochemical reactions [13]. Therefore, ensuring a systematic understandingof the growth and properties of the materials with respect to different morphologies andchemical compositions represents an important and achievable scientific goal.
Within these ABO3 systems, “A” represents a large cation, whereas “B” is a smallercation that coordinates onto oxygen. Specifically, we report herein on the synthesis of aseries of 3D alkaline earth-metal perovskites ATiO3 (A = Ca, Sr, and Ba) with uniformmicron-sized spherical morphology, using a TiO2-template directed method. From anelectrochemical and electrocatalytic perspective, we note that 3D nano-/micro-hierarchicalspheres combine the merits of nanometer-sized building blocks (i.e., shortened diffusiondistances and high electrode/electrolyte contact surface areas), with the benefits of eithermicrometer- or sub-micrometer-sized assemblies (i.e., thermodynamic stability and hightap density) [14,15].
The target materials were chosen, because many perovskite materials are electroni-cally conductive, possess reasonable proton transport properties, and maintain chemically
functionalizable outer surfaces, thereby rendering them as promising candidates for sup-port materials within highly acidic environments, typically utilized by conventional smallmolecule oxidation [16]. Previous work has centered on the use of ABO3 perovskites(wherein “A” = Sr, La, Ba, or Ca; “B” = Ti, Ni, Fe, or Ru) as potential metal oxide supportmaterials in the context of the methanol oxidation reaction (MOR). In particular, it has beensuggested that the use of a complex metal oxide material as a support for Pt may not onlylower the overpotential for MOR but also facilitate the complete oxidation of methanol toproducts, such as CO2 [17,18].
In relevant prior efforts from our group, we reported on the connection between syn-thesis control and MOR performance with SrRuO3 (SRO) [19]. In particular, we determineda correlation between morphology and the MOR performance of faceted SRO octahedrayielding improved performance metrics, as compared with rounded nanoparticles. Theseobserved enhancements were attributed to the increased surface area of the faceted octahe-dra (i.e., 11.43 m2/g) vs. that of their rounded particulate counterparts (i.e., 2.86 m2/g).This increase in surface area likely led to a corresponding increase in active sites availablefor reactions [19]. Hence, this study demonstrated that morphology and shape clearlymattered for electrocatalysis.
Nevertheless, chemical composition was also a leading indicator of performance. Inthis context, we had synthesized various metal oxides of different sizes (i.e., ~35 to 150 nm),including TiO2, RuO2, SrTiO3, and SrRuO3 as supports for Pt nanoparticles (NPs) [13]. Ourresults, incorporating supporting mechanistic studies, showed that the SrRuO3 substratewith immobilized Pt NPs at its surface evinced the best MOR performance, as comparedwith all of the other substrate materials tested. In effect, the presence of Ru within SrRuO3not only contributed to a significant increase in MOR activity (manifested as higher steadystate current densities) but also resulted in an overall shift to lower MOR onset potentials.Significantly, we concluded that chemical composition, as opposed to the size of thesupport, was the more significant determinant of the onset potential, corroborating theidea that our perovskite materials could adsorb hydroxyl groups at their external surfaces,to facilitate MOR.
Therefore, to build upon these prior efforts, based on the importance of morphol-ogy, shape, and chemical composition, we focused herein on generating titania-basedperovskites, characterized by different chemical compositions. Hence, the purpose andnovelty of this paper are to (i) detail the perovskite growth conditions/mechanism for 3DATiO3 materials; (ii) obtain data and report on the MOR activity of 3D ATiO3, when usedas supports for Pt; and (iii) rationalize the improvement in MOR activity, as compared withcommercial TiO2 standards.
Another significant consideration relates to the synthesis protocol used to generatethe perovskites themselves. Specifically, the synthetic route can determine not only size,shape, and morphology but also the achievable active surface area available to the per-ovskite catalysts [12,13,20,21]. A number of fabrication methods have been proposed overthe years, to ensure chemical purity and structural integrity, including but not limited tohydrothermal and solvothermal syntheses [20,21], solid state reactions [22,23], sonochem-ical protocols [24], and arc-melting methods [25]. However, some of these procedures,especially those related to solid state reactions, sonochemistry, and arc-melting, tend to belimited by reproducibility, yield little if any morphological control, and/or are more proneto cost and technical limitations. Therefore, in terms of additional novelty, we empha-size that the synthesis method implemented herein consists of a surfactant-free, two-stephydrothermal/sol–gel calcination process.
In the current report, this procedure was modified from a previously reported protocolthat had centered on the use of a Lutensol ON50 surfactant [26]. The spheres producedby this Lutensol ON50–based method measured about 1 micron in average size, but thesewere smaller than the 3–6 micron diameter particles routinely generated herein. Specifically,in the method described in this study, the first step involved the hydrothermal synthesisof micron-scale particles of TiO2, which subsequently served as the template building
Molecules 2021, 26, 909 3 of 23
blocks for further reactivity. These particles were then dispersed in ethanol and mixedwith the relevant hydroxide salt, containing either Ca2+, Sr2+, or Ba2+ ions, respectively.Given the porous nature of the as-prepared three-dimensional, hierarchical TiO2 motif, arelatively uniform distribution of the salts could be deposited onto and within the spheresafter physical sonication, thereby forming a “sol–gel” precursor. The TiO2 templates weresufficiently robust to withstand substantial sonication without any apparent degradation inmorphology. The desired ATO3 materials were then prepared by annealing the particles athigh temperature, a process which stimulated the mixing of the ions, which consequentlyresulted in the formation of the targeted perovskites. Fortunately, the isolated productparticles retained the morphology and size of the initial templates.
This surfactant-free procedure we have put forth is advantageous for several rea-sons. First, it is known that surfactants can bind strongly onto the surfaces of as-preparedparticles and are therefore very difficult to completely remove. Because the presence ofsurfactants can hinder MOR performance [27], any method that precludes their use is cat-alytically significant. Second, a surfactant-free synthetic protocol is important for renderingthe reaction more environmentally friendly. As mentioned, surfactants must be eliminated,because they interfere with optimal electrocatalytic behavior. However, procedures thatcan effectively remove surfactants are often energy intensive and/or use hazardous chemi-cals [28,29]. In addition, most surfactants are characterized by long-chain carbons, manyof which are relatively harmful to the environment. Even if non-toxic surfactants wereto be used, synthesizing these molecules risks creating toxic byproducts [30]. Therefore,the best option would be to do away with surfactants, completely. As such, our syntheticmethod herein represents an important step towards enabling green chemistry in termsof eliminating the need for surfactants altogether in the generation of ATiO3. Third, our3D motifs are stable in acidic environments and are less likely to aggregate than eithercarbon supports or clusters of smaller, individualized nanoparticles. In the latter case,the agglomeration of nanoparticles can only be overcome by the use of either surfactantsor stabilizing agents [31], which, as we have seen, are detrimental to the observed MORperformance. Fourth, our synthetic route can reliably and reproducibly produce gram-scalequantities of these perovskite supports. In effect, it is a scalable process with potentialimplications for its applicability in the context of possible commercialization.
To understand the effect of changing the identity of the A-site atom on MOR perfor-mance, we assessed a series of 3D ATO micron-scale spheres as supports for Pt nanopar-ticles. From these data, we noticed several interesting trends. First, with respect to themass activity, all of the 3D micron-scale spheres of Pt/CaTiO3 (CTO), Pt/SrTiO3 (STO), andPt/BaTiO3 (BTO) gave rise to enhanced performance, as compared with either a Pt/TiO2commercial particulate standard or Pt/TiO2 3D template controls. Second, for both specificactivity and mass activity values, the observed trend for the 3D spheres was in the order ofPt/CTO > Pt/STO > Pt/BTO, with the Pt/CTO system exhibiting the best performance.Third, we measured increased Pt mass activities for our 3D particles of BTO, CTO, andSTO supports, even though all of these materials possessed lower exposed surface areas, ascompared with the precursor 3D TiO2 templates. That is, the inverse correlation betweensurface area and performance suggests that chemical composition is the most significantparameter in dictating catalytic behavior for perovskites, an assertion consistent with ourprevious SRO data [19].
2. Results and Discussion2.1. General Observations
X-ray powder diffraction (XRD) patterns for all as-prepared micron-scale spheres wereobtained and are presented in Figure 1. Experimental data are matched up with relevantknown “Joint Committee on Powder Diffraction Standards” (JCPDS) reference databasepatterns. As-fabricated TiO2 intermediate samples consisted of the pure anatase phase. Theassociated XRD and SEM data are shown in Figures 1A and 2A–C, respectively. Indeed,micron-sized TiO2 spheres, with diameters ranging from 3 to 6 microns, were used as
Molecules 2021, 26, 909 4 of 23
templates, to further generate the corresponding ATiO3 micron-scale spheres. In particular,the titania template consisted of bulky but porous spherical motifs, characterized by arelatively “smooth” external surface.
These precursor TiO2 templates were subsequently converted into their perovskiteanalogues, in a high-temperature-mediated process. Specifically, our intended targetsincluded not only the desired orthorhombic phase of CTO but also the cubic phase ofBTO and STO. In the latter case of STO, we were also able to obtain a pure material withno apparent impurities, such as Sr2TiO4, by using the hydrothermal method. However,because we could not readily isolate a spherical morphology by using this protocol, wedeemed it to be a control sample. These products were isolated after the heating and acidpurification processes, as described in the Experimental Synthesis section.
With the BTO samples, the synthesis protocol incorporating a similar high-temperaturecalcination process ended up generating the anticipated cubic phase of BTO, but this wasaccompanied by small but detectable quantities of both BaTi5O11 and barite impurities. Inunpublished runs, we found that BaTi5O11 could be removed and the barite impuritiescould be minimized but not completely eliminated.
2.2. CaTiO3
SEM images for the as-synthesized 3D CTO spheres and related size distributions areprovided in Figure 2D–F, with isolated products possessing an average measured diameterof 3.7 ± 1.1 µm. The surface appears to be considerably more roughened as comparedwith the starting TiO2 templates. Nonetheless, the average diameters of the starting TiO2templates were 3.6 ± 1.0 µm, implying that there was no substantial change in particle sizeassociated with the chemical transformation from TiO2 to CTO.
Molecules 2021, 26, x 4 of 25
relevant known “Joint Committee on Powder Diffraction Standards” (JCPDS) refer-ence database patterns. As-fabricated TiO2 intermediate samples consisted of the pure anatase phase. The associated XRD and SEM data are shown in Figures 1A and 2A–C, respectively. Indeed, micron-sized TiO2 spheres, with diameters ranging from 3 to 6 mi-crons, were used as templates, to further generate the corresponding ATiO3 micron-scale spheres. In particular, the titania template consisted of bulky but porous spherical motifs, characterized by a relatively “smooth” external surface.
These precursor TiO2 templates were subsequently converted into their perovskite analogues, in a high-temperature-mediated process. Specifically, our intended targets in-cluded not only the desired orthorhombic phase of CTO but also the cubic phase of BTO and STO. In the latter case of STO, we were also able to obtain a pure material with no apparent impurities, such as Sr2TiO4, by using the hydrothermal method. However, be-cause we could not readily isolate a spherical morphology by using this protocol, we deemed it to be a control sample. These products were isolated after the heating and acid purification processes, as described in the Experimental Synthesis section.
Figure 1. Indexed XRD patterns of (A) TiO2 intermediate JCPDS #84-1286), (B) CaTiO3 (CTO) sample (JCPDS #86-1393), (C) SrTiO3 (STO) sample (JCPDS # 86-0179), and (D) BaTiO3 (BTO) sample (JCPDS #74-1968) with a small BaTi5O11 impu-rity.
Figure 1. Indexed XRD patterns of (A) TiO2 intermediate JCPDS #84-1286), (B) CaTiO3 (CTO) sample (JCPDS #86-1393),(C) SrTiO3 (STO) sample (JCPDS # 86-0179), and (D) BaTiO3 (BTO) sample (JCPDS #74-1968) with a small BaTi5O11 impurity.
Molecules 2021, 26, 909 5 of 23Molecules 2021, 26, x 5 of 25
Figure 2. SEM images of ATO samples with associated particle size histograms for (A–C) TiO2, (D–F) CTO, (G–I) STO, and (J–L) BTO micron-scale spheres, respectively.
With the BTO samples, the synthesis protocol incorporating a similar high-tempera-ture calcination process ended up generating the anticipated cubic phase of BTO, but this was accompanied by small but detectable quantities of both BaTi5O11 and barite impuri-ties. In unpublished runs, we found that BaTi5O11 could be removed and the barite impu-rities could be minimized but not completely eliminated.
2.2. CaTiO3 SEM images for the as-synthesized 3D CTO spheres and related size distributions are
provided in Figure 2D–F, with isolated products possessing an average measured diame-ter of 3.7 ± 1.1 μm. The surface appears to be considerably more roughened as compared with the starting TiO2 templates. Nonetheless, the average diameters of the starting TiO2
templates were 3.6 ± 1.0 μm, implying that there was no substantial change in particle size associated with the chemical transformation from TiO2 to CTO.
Figure 2. SEM images of ATO samples with associated particle size histograms for (A–C) TiO2, (D–F) CTO, (G–I) STO, and(J–L) BTO micron-scale spheres, respectively.
To further investigate the “phase-transition” process, the as-prepared CTO intermedi-ates were annealed at various temperatures, ranging from 600 to 1100 C. XRD patternswere collected on a series of purified samples, to observe the nature of the transition fromTiO2 to the resulting perovskite crystal, as shown in Figure 3. With respect to the growthof CTO, the intermediate gradually transformed into a mixture of TiO2 and orthorhombicCTO. The sharp peak located at ~25.46 in the XRD pattern could be ascribed to the anatasephase of TiO2. As the temperature increased, the corresponding intensity of the TiO2 peakdecreased, whereas the signal ascribed to CTO became stronger and more prevalent, afinding indicative of the presumably successful transformation of the TiO2 template intothe desired perovskite.
Molecules 2021, 26, 909 6 of 23
Molecules 2021, 26, x 6 of 25
To further investigate the “phase-transition” process, the as-prepared CTO interme-diates were annealed at various temperatures, ranging from 600° to 1100 °C. XRD patterns were collected on a series of purified samples, to observe the nature of the transition from TiO2 to the resulting perovskite crystal, as shown in Figure 3. With respect to the growth of CTO, the intermediate gradually transformed into a mixture of TiO2 and orthorhombic CTO. The sharp peak located at ~25.46° in the XRD pattern could be ascribed to the anatase phase of TiO2. As the temperature increased, the corresponding intensity of the TiO2 peak decreased, whereas the signal ascribed to CTO became stronger and more prevalent, a finding indicative of the presumably successful transformation of the TiO2 template into the desired perovskite.
Figure 3. XRD patterns of a CTO powder sample calcined from 600° to 1100 °C, in increments of 100 °C. The data on all samples were acquired after the acid wash, except for the pre-annealed sample. Samples are compared with standard anatase TiO2 and CTO patterns.
Figure 3. XRD patterns of a CTO powder sample calcined from 600 C to 1100 C, in incrementsof 100 C. The data on all samples were acquired after the acid wash, except for the pre-annealedsample. Samples are compared with standard anatase TiO2 and CTO patterns.
Both anatase TiO2 and CTO are present at 600, 700, and 800 C, respectively. Begin-ning at 900 C, a rutile impurity, situated at 27.52, appeared and remained until 1100 C,at which stage, a pure orthorhombic CTO pattern was observed. Supplementary MaterialsFigure S1 provides for complementary SEM images of the CTO spheres, synthesized atthese various different annealing temperatures. There is little change in the morphology asthe reaction temperature was increased. Nonetheless, it was observed that the morphol-ogy of the relatively smooth and porous TiO2 precursor template spheres evolved into aprogressively rougher motif, characterized by larger crystallite sizes with rising reactiontemperatures. These findings are in line with a corresponding increase in crystallinity, asnoted in the associated XRD patterns.
XRD patterns of the corresponding unpurified samples are given in SupplementaryMaterials Figure S2. The small peaks located at 29.36 and 31.38 could be assigned toCaCO3 impurities. The existence of a TiO2 peak is consistent with our assumption thatthe “sea-urchin” motifs are likely to be TiO2 crystals, which can be removed by means ofnitric acid purification. An SEM image of the as-described impurities is highlighted inFigure S3A.
Molecules 2021, 26, 909 7 of 23
2.3. BaTiO3
Similarly, the formation of BTO was observed at different temperatures, ranging from600 to 1100 C, with the matching XRD patterns, as shown in Figure 4. Specifically, thecubic phase of BTO initially formed at 600 C, and its crystallinity appeared to increaseas the synthesis temperature was correspondingly increased (Figure 4). No TiO2 wasobserved within any of the XRD patterns of BTO, thereby implying the perovskite mayhave formed at a lower reaction temperature than what we actually tested. However, theaforementioned BaTi5O11 and barite impurities emerged at the same time, and could notbe properly removed by using either higher temperatures or a nitric acid wash. Supple-mentary Materials Figure S4 presents XRD patterns of prewashed BTO samples. Becausethe impurity incorporated excess titanium, we correspondingly increased the amount ofBa(OH)2 precursor, to ensure the complete conversion of TiO2 to BTO. Though that processcould minimize the amount of impurity, it was not possible to fully eliminate all suchcontaminants in this manner.
Molecules 2021, 26, x 8 of 25
size of representative 1000 °C samples, associated with STO; average diameters were in range of 3.2 ± 1.0 μm. Supplementary Materials Figure S6 illustrates SEM images of STO samples, generated at different annealing temperatures. There is a notable degradation of the overall spherical morphology at 1100 °C, likely due to Sr2TiO4 formation. As with the CTO sample, as-formed TiO2 impurities appeared as rod-like morphologies, which could be successfully removed using a nitric acid wash. Supplementary Materials Figure S3B is an SEM image associated with the pre-nitric acid washed sample.
Figure 4. XRD patterns of a BTO powder sample calcined from 600° to 1100 °C, in increments of 100 °C. The data on all samples were acquired after the acid wash, except for the pre-annealed sample. Samples are compared with standard anatase TiO2 and BTO patterns.
Inte
nsity
(nor
mal
ized
)
Figure 4. XRD patterns of a BTO powder sample calcined from 600 C to 1100 C, in incrementsof 100 C. The data on all samples were acquired after the acid wash, except for the pre-annealedsample. Samples are compared with standard anatase TiO2 and BTO patterns.
Supplementary Materials Figure S5 highlights SEM images of BTO, prepared at differ-ent temperatures. As with CTO, the sizes of the individual constituent particles forming
Molecules 2021, 26, 909 8 of 23
the spheres increased with rising reaction temperatures, a finding consistent with the analo-gous growth in the crystallinity within the XRD patterns. For the BTO samples, the averagediameters of the isolated products were determined to be 3.2 ± 1.0 µm, i.e., comparable insize to that of CTO spheres (Figure 2J–L) and consistent with the dimensions of the startingprecursor TiO2 templates.
2.4. SrTiO3
STO spheres were synthesized, using three different procedures. The first involved ahydrothermal process described in Section 3.2.3, whereas the second was analogous to themulti-step protocol, using the TiO2 template, provided in Section 3.2.2. Finally, in a thirdseries of experiments, ultra-small sub-10 nm samples were generated by comparison, asdiscussed in Section 3.2.4, using a “water-free” solvothermal procedure. Multiple methodswere used to fabricate STO, since the annealing protocol consistently produced impuritieswithin the STO sample. Figure 5 highlights XRD patterns of STO, created at differentannealing temperatures. Anatase TiO2 can be observed at all such temperatures, includingvalues at and below 900 C. At 1000 C, the TiO2 is fully transformed to STO; however, aSr2TiO4 impurity remains. At 1100 C, Sr2TiO4 dominates.
These collective results clearly show that an annealing temperature of 1000 C isneeded to successfully form STO micron-scale spheres, incorporating the smallest amountof impurities. The data shown in SEM Figure 2G–I highlight the isolated morphology andsize of representative 1000 C samples, associated with STO; average diameters were inrange of 3.2 ± 1.0 µm. Supplementary Materials Figure S6 illustrates SEM images of STOsamples, generated at different annealing temperatures. There is a notable degradation ofthe overall spherical morphology at 1100 C, likely due to Sr2TiO4 formation. As with theCTO sample, as-formed TiO2 impurities appeared as rod-like morphologies, which couldbe successfully removed using a nitric acid wash. Supplementary Materials Figure S3B isan SEM image associated with the pre-nitric acid washed sample.
The panels in Figure 6D–F feature the size histograms and associated morphologyof as-prepared STO nanocubes, created with the hydrothermal method. The averagediameters of these STO nanocubes were determined to be 130 ± 28 nm. The SEM imagesof the hydrothermally derived sample suggested that the precursor spheres immediatelydegraded and broke apart under sonication into either aggregates or individual particles.Hence, even though this synthesis method was able to fabricate pure STO (i.e., XRD datain Supplementary Materials Figure S7), the isolated product did not retain the desired3D morphology, especially after washing and addition of Pt. In addition, the sub-10 nmparticles of STO were synthesized by using a “water-free” solvothermal reaction. TEM dataand the corresponding size histograms of the ultra-small sub-10 nm STO particles can beobserved in Figure 6G–I. The solvothermal method used herein generated monodispersenanoparticles, possessing an average diameter of 4.9 ± 1.0 nm. The associated XRD pattern(Supplementary Materials Figure S7) suggests that these sub-10 nm STO particles are pure;nevertheless, it was also characterized by the presence of very broad peaks, indicativeof not only their small size but also their poor crystallinity. Overall, as neither the STOcubes nor their ultra-small counterparts were optimal in terms of simultaneously achievingmonodisperse size and good crystallinity, both of these samples were used as comparativecontrols with their 3D counterparts in the ensuing MOR tests.
2.5. Mechanistic Insights into Structure
The proposed mechanism for the chemical transformation of TiO2 to BTO, CTO, andSTO, respectively, is illustrated in Figure 7. The first step of the synthesis involves theformation of porous TiO2 template spheres, without the use of surfactants. This is achievedby dissolving the titanium butoxide precursor in anhydrous ethanol and sulfuric acid. Ithas been shown that sulfuric acid is important for promoting the formation of the porousspheres, as it slows the hydrolysis of titanium butoxide to TiO2 [32]. This scenario allowsfor the controlled growth of large and robust spherical particles that are composed of many
Molecules 2021, 26, 909 9 of 23
smaller nanoparticles, in the high temperature and pressure of the autoclave. The secondstep involves the conversion of TiO2 to the desired perovskite spheres. It has been reportedthat the dried TiO2 spheres retain the favorable porous structure mentioned previously [26].The high degree of porosity implied that precursors of Ba(OH)2, Ca(OH)2, and Sr(OH)2could adequately and readily diffuse throughout the spherical motifs. The subsequentsonication procedure was used to evenly distribute the Ca2+, Ba2+, and Sr2+ ions throughoutthe entire motif, thereby allowing for a faster, more homogeneous, and more controlledtransformation into the desired perovskite spheres during the ensuing annealing step. Itis also worth highlighting the importance of the acid purification protocol, since this wasfound to remove extraneous, undesired sea-urchin-like, micron-scale flakes present withinthe sample. It is highly probable that these “sea-urchin” impurities could be ascribed toTiO2 precursors, an observation consistent with what has been reported previously [33].As a general comment, the acid purification procedure assisted in removing other chemicalimpurities, including not only calcium carbonate formed within the CTO sample but alsoTiO2 “sea-urchins” and rods.
Molecules 2021, 26, x 9 of 25
Figure 5. XRD patterns of a STO powder sample calcined from 600 °C to 1100 °C, in increments of 100 °C. The data on all samples were acquired after the acid wash, except for the pre-annealed sample. Samples are compared with standard anatase TiO2 and STO patterns. Triangles associated with the 800 °C to 1100 °C samples indicate the presence of Sr2TiO4 peaks.
The panels in Figure 6D–F feature the size histograms and associated morphology of as-prepared STO nanocubes, created with the hydrothermal method. The average diame-ters of these STO nanocubes were determined to be 130 ± 28 nm. The SEM images of the hydrothermally derived sample suggested that the precursor spheres immediately de-graded and broke apart under sonication into either aggregates or individual particles. Hence, even though this synthesis method was able to fabricate pure STO (i.e., XRD data in Supplementary Materials Figure S7), the isolated product did not retain the desired 3D morphology, especially after washing and addition of Pt. In addition, the sub-10 nm par-ticles of STO were synthesized by using a “water-free” solvothermal reaction. TEM data and the corresponding size histograms of the ultra-small sub-10 nm STO particles can be observed in Figure 6G–I. The solvothermal method used herein generated monodisperse nanoparticles, possessing an average diameter of 4.9 ± 1.0 nm. The associated XRD pattern
Figure 5. XRD patterns of a STO powder sample calcined from 600 C to 1100 C, in incrementsof 100 C. The data on all samples were acquired after the acid wash, except for the pre-annealedsample. Samples are compared with standard anatase TiO2 and STO patterns. Triangles associatedwith the 800 C to 1100 C samples indicate the presence of Sr2TiO4 peaks.
Molecules 2021, 26, 909 10 of 23
Molecules 2021, 26, x 10 of 25
(Supplementary Materials Figure S7) suggests that these sub-10 nm STO particles are pure; nevertheless, it was also characterized by the presence of very broad peaks, indica-tive of not only their small size but also their poor crystallinity. Overall, as neither the STO cubes nor their ultra-small counterparts were optimal in terms of simultaneously achiev-ing monodisperse size and good crystallinity, both of these samples were used as com-parative controls with their 3D counterparts in the ensuing MOR tests.
Figure 6. SEM images and associated particle size histograms of (A–C) commercial anatase TiO2 and (D–F) STO hydro-thermally derived nanocubes, along with TEM images and corresponding size histograms of (G–I) STO ultra-small nano-particles.
2.5. Mechanistic Insights into Structure The proposed mechanism for the chemical transformation of TiO2 to BTO, CTO, and
STO, respectively, is illustrated in Figure 7. The first step of the synthesis involves the formation of porous TiO2 template spheres, without the use of surfactants. This is achieved by dissolving the titanium butoxide precursor in anhydrous ethanol and sulfuric acid. It has been shown that sulfuric acid is important for promoting the formation of the porous spheres, as it slows the hydrolysis of titanium butoxide to TiO2 [32]. This scenario allows for the controlled growth of large and robust spherical particles that are composed of many smaller nanoparticles, in the high temperature and pressure of the autoclave. The second step involves the conversion of TiO2 to the desired perovskite spheres. It has been
Figure 6. SEM images and associated particle size histograms of (A–C) commercial anatase TiO2 and (D–F) STO hy-drothermally derived nanocubes, along with TEM images and corresponding size histograms of (G–I) STO ultra-smallnanoparticles.
Molecules 2021, 26, x 11 of 25
reported that the dried TiO2 spheres retain the favorable porous structure mentioned pre-viously [26]. The high degree of porosity implied that precursors of Ba(OH)2, Ca(OH)2, and Sr(OH)2 could adequately and readily diffuse throughout the spherical motifs. The subsequent sonication procedure was used to evenly distribute the Ca2+, Ba2+, and Sr2+ ions throughout the entire motif, thereby allowing for a faster, more homogeneous, and more controlled transformation into the desired perovskite spheres during the ensuing anneal-ing step. It is also worth highlighting the importance of the acid purification protocol, since this was found to remove extraneous, undesired sea-urchin-like, micron-scale flakes present within the sample. It is highly probable that these “sea-urchin” impurities could be ascribed to TiO2 precursors, an observation consistent with what has been reported previously [33]. As a general comment, the acid purification procedure assisted in remov-ing other chemical impurities, including not only calcium carbonate formed within the CTO sample but also TiO2 “sea-urchins” and rods.
Figure 7. Proposed mechanistic flowchart, associated with the multi-step, surfactant-free synthesis of the as-prepared 3D ATiO3 micron-scale spheres.
As a means of probing the intrinsic physical porosity of the resulting samples, Table 1 highlights the Brunauer–Emmett–Teller (BET) surface area measurements, collected on the various as-prepared samples. Though commercial TiO2 nanoparticles (accompanying XRD provided in Supplementary Materials Figure S8) were found to sustain a surface area of 9.93 m2/g, our 3D TiO2 templates possessed the highest surface area of any of the sam-ples tested at 179.22 m2/g. Interestingly, despite the consistency in isolated particle sizes, there is a notable decrease in surface area, when the TiO2 is subsequently converted into CTO, STO, and BTO, because the corresponding BET surface areas of 2.59, 5.74, and 36.07 m2/g, respectively, of these annealed perovskites are much lower than those of the 3D anatase precursor motif. This decrease in surface area can be potentially attributed to the incorporation of the larger Ca2+, Sr2+, and Ba2+ ions within the TiO2 lattice, which would have had the apparent effect of reducing pore volume.
Figure 7. Proposed mechanistic flowchart, associated with the multi-step, surfactant-free synthesis of the as-prepared 3DATiO3 micron-scale spheres.
Molecules 2021, 26, 909 11 of 23
As a means of probing the intrinsic physical porosity of the resulting samples, Table 1highlights the Brunauer–Emmett–Teller (BET) surface area measurements, collected onthe various as-prepared samples. Though commercial TiO2 nanoparticles (accompanyingXRD provided in Supplementary Materials Figure S8) were found to sustain a surfacearea of 9.93 m2/g, our 3D TiO2 templates possessed the highest surface area of any of thesamples tested at 179.22 m2/g. Interestingly, despite the consistency in isolated particlesizes, there is a notable decrease in surface area, when the TiO2 is subsequently convertedinto CTO, STO, and BTO, because the corresponding BET surface areas of 2.59, 5.74, and36.07 m2/g, respectively, of these annealed perovskites are much lower than those of the3D anatase precursor motif. This decrease in surface area can be potentially attributedto the incorporation of the larger Ca2+, Sr2+, and Ba2+ ions within the TiO2 lattice, whichwould have had the apparent effect of reducing pore volume.
Table 1. BET surface area measurements, microscopy-derived particle sizes, and calculated Debye–Scherrer crystallite sizes of ATO samples, TiO2 templates, and commercial TiO2.
Sample BET SurfaceArea (m2/g)
Particle Size(Derived from Either
SEM or TEMMeasurements)
Crystallite Size fromDebye–Scherrer
Equation (Calculatedfrom XRD)
TiO2templates 179.22 3.6 ± 1.0 µm 5.7 ± 0.7 nm
STO—ultra-small 81.53 4.9 ± 1.0 nm 4.3 ± 0.4 nm
STO—Hydro-thermal
74.36 130 ± 28 nm 31.1 ± 3.4 nm
BTO—annealed 36.07 3.2 ± 1.0 µm 34.4 ± 8.1 nm
TiO2—commercial 9.93 71.1 ± 21.2 nm 39.9 ± 6.3 nm
STO—annealed 5.74 3.2 ± 1.2 µm 32.1 ± 2.6 nm
CTO—annealed 2.59 3.7 ± 1.1 µm 36.0 ± 8.0 nm
Whereas the measured particle diameters derived from SEM data for 3D motifs ofTiO2, CTO, STO, and BTO were consistently in the range of 3.2 to 3.7 µm, the correspondingcrystallite sizes of these materials, computed from the XRD patterns using the Debye–Scherrer equation, yielded a strikingly different trend. Specifically, all of the perovskitesamples evinced a consistent increase in calculated crystallite size to >30 nm from the initial5.67 nm size, associated with the precursor TiO2 templates. Our data therefore suggeststhat this perceptible augmentation in crystallite size for the perovskites is correlated witha reduction in active, available surface area for their reactivity (Table 1). It is also worthnoting that our results are consistent with prior literature findings for ATO-type materials,which indicate that cationic incorporation can reduce the effective particle surface area,accessible to reaction [34].
By comparison, STO cubes generated with the hydrothermal method yielded a BETsurface area of 74.36 m2/g, whereas ultra-small STO samples possessed a surface areaof 81.53 m2/g. In both examples, the surface area values were higher than those of theanalogous 3D STO spheres. Ultra-small STO incorporates both the smallest particle size (~4to 5 nm, derived from both TEM and XRD data), coupled with the largest surface area ofthe STO samples synthesized herein. The STO cubes presented an intermediate case, in thatits SEM-derived size of ~130 nm was paired with a calculated Debye–Scherrer crystallitesize of ~31 nm. As such, the 3D STO spheres appeared to maintain the largest particle sizesand smallest BET surface areas, whereas ultra-small STO gave rise to the exact reversescenario, namely the smallest particle sizes along with the largest BET surface areas. This
Molecules 2021, 26, 909 12 of 23
apparent inverse correlation between particle size and surface area was consequential forsubsequent MOR measurements.
2.6. Probing the Effect of Chemical Composition on MOR
To understand the effect of changing the identity of the A site atom on MOR perfor-mance, we loaded not only all of the 3D ATO particles but also both standard referencesamples and commercial controls in an identical manner with 20 wt% of Pt nanoparticles,using the method described in Section 3.2.5. To confirm the successful deposition of Pt,representative TEM images were obtained and are shown in Supplementary MaterialsFigure S9. In addition to microscopy, we collected electrochemical data and analyzed theshape of the associated cyclic voltammogram (CV) curves, which evinced the expected Ptprofile. Finally, we also detected a clear color change from white to black of the as-dispersedsolution upon the addition of NaBH4 during the sample preparation process. All of theseobservations were collectively consistent with the reduction of the Pt precursor and thecorresponding formation of Pt nanoparticles in all samples, prior to MOR data acquisition.
The oxidation of methanol on nanoscale elemental Pt catalysts requires a significantoverpotential, due to the formation of partially oxidized intermediate species [35,36]. Atlow overpotentials, methanol is oxidized via an α-dehydrogenation pathway that leads tothe formation of adsorbed carbon monoxide. The buildup of carbon monoxide, commonlyreferred to as CO poisoning, blocks active sites and leads to poor oxidation kinetics near thethermodynamic potential for MOR. As the overpotential is increased, the surface of Pt isoxidized, and the adsorbed Pt-O* and Pt-OH* groups catalyze the conversion of CO to CO2,which reduces the CO coverage and increases MOR kinetics. Thus, the onset of methanoloxidation is typically coincident with the potential wherein surface oxidation occurs.
From a mechanistic perspective, metal oxides play both a passive role, by stabilizingthe Pt nanoparticles from aggregation, and a corresponding active role in catalysis, sincetheir surfaces provide oxygen species throughout the entire potential window for methanoloxidation. The presence of oxygen species at the metal–metal oxide interface can facilitatea process referred to as CO spillover, wherein CO species formed on Pt are oxidized byoxygen species present at the NP–support interface. This effect can lead to significantlybetter CO tolerance. Metal oxides can also influence the electronic properties of adsorbedmetal nanostructures through the strong metal–support interaction (SMSI) effect. Thiseffect has been previously shown to increase the activity of gold NPs on titanium dioxidetoward CO oxidation in the gas phase [37]. In the context of methanol oxidation, theinteraction between Pt NPs and an underlying crystalline RuO2 nanostructure resulted ina measurable shift in the oxidation of Pt to lower potentials, which facilitated CO oxidationand thereby lowered the overpotential for methanol oxidation [38].
The different types of perovskite nanoparticles synthesized in this manuscript there-fore have enabled us to effectively evaluate the influence of two key parameters, namelysupport size and composition, upon the activity of immobilized Pt NP catalysts. First,we employed cyclic voltammetry, to investigate the electrochemical properties of the Ptcatalysts on the underlying perovskite supports. CV curves for the Pt/CTO, Pt/STO, andPt/BTO samples are provided in Figure 8. By comparison, Supplementary Materials FigureS10 contains the corresponding CV curves for the Pt/TiO2 commercial, Pt/TiO2 templates,Pt/STO hydrothermal, and Pt/STO ultra-small samples. All of these data were collectedin an Ar-saturated solution of 0.1 M perchloric acid, using a scan rate of 20 mV/s. Wenote that neither Ti nor the A-site atoms are electrochemically active within this potentialwindow, and therefore are not expected to contribute any faradaic features to the observedCV profile [39,40].
Molecules 2021, 26, 909 13 of 23Molecules 2021, 26, x 14 of 25
Figure 8. Cyclic voltammogram (CV) curves for 3D spheres of (A) Pt/CTO, (B) Pt/STO, and (C) Pt/BTO, respectively.
With respect to the structure of the CVs, signals attributable to the reversible hydro-gen adsorption (Hads) and surface oxidation of the Pt catalyst can be observed in all of the
Figure 8. Cyclic voltammogram (CV) curves for 3D spheres of (A) Pt/CTO, (B) Pt/STO, and(C) Pt/BTO, respectively.
With respect to the structure of the CVs, signals attributable to the reversible hydrogenadsorption (Hads) and surface oxidation of the Pt catalyst can be observed in all of the
Molecules 2021, 26, 909 14 of 23
Pt/ATO3 samples. The structure of the hydrogen adsorption region (0–0.3 V) is consistentwith supported Pt nanoparticles [41]. The oxidation of Pt at potentials above 0.6 V leads tothe characteristic oxide region that is observed on the CVs. The onset of surface oxidationis a key parameter for methanol oxidation, since adsorbed oxygen species are necessaryto oxidize CO intermediates formed at low overpotentials. A careful analysis of theonset region for the surface oxidation of the Pt NPs reveals that the Pt NPs supported onCTO behave dissimilarly relative to that of the corresponding Pt on analogous STO andBTO supports.
Specifically, the Pt/CTO CV displays three distinctive oxidation waves, beginningat ~0.6, ~0.8, and at 1.0 V. By contrast, the onset for the surface oxidation of Pt within thePt/BTO and Pt/STO samples does not occur until 0.9–1.0 V. The Pt oxidation features at 0.6and 0.8 V in the Pt/CTO suggest that there is a unique interaction between the catalyst andthe support in CTO, which leads to Pt sites that are more easily oxidized than with eitherBTO or STO supports. The position of the oxide reduction peak in the cathodic sweepalso provides evidence that there is a systematic effect of the A-site cation on the oxygenbinding strength. Fits of the reduction peak reveal that there is a shift in the oxide peakposition from 0.783 to 0.792 V with increasing cation size. This suggests that there is aninverse correlation between the cation size and the overall binding strength of oxygen onthe platinum catalyst’s surface.
In prior reports, these features have been attributed to the presence of active Pt siteslocated at or near the interface between the Pt NP and the oxide support. These Pt atomsat the interface display unique properties, due either to the SMSI effect and/or to partialcoverage of the platinum with an oxide layer at the interface [38]. This unique property ofthe CTO support is expected to significantly improve CO tolerance, and we believe thatthis arises because of the trend in composition, which is discussed in detail in the nextfew paragraphs.
The electrochemically accessible Pt specific surface area (SSA) was calculated fromthe integration of the hydrogen absorption and desorption peaks in the CV curves. Thedata related to this analysis are provided in Supplementary Materials Table S1. TheSSA values for Pt supported on CTO, STO, and BTO are calculated to be 5.80, 3.85, and5.70 m2/g, respectively. These are all significantly higher readings than that of either theTiO2 template controls (0.28 m2/g) or commercial TiO2 nanoparticles (0.60 m2/g), whichare likely indicative of improved Pt dispersal and immobilization on the perovskite surface.This finding may be due in part to the HNO3 washing step. Specifically, pre-treatmentwith HNO3 has been shown to increase both the number and stability of acidic sites onperovskites by exposing Ti on the surface [42,43]. Moreover, these acidic surface siteslikely improved the dispersion of the Pt particles during the deposition step and led tohigher overall measured SSA values[16]. In addition, the TiO2 supports are significantlymore porous than the analogous perovskite supports. As such, it is possible that the Pt isdeposited more deeply within the porous structure of the TiO2 supports and, hence, is notas electrochemically accessible.
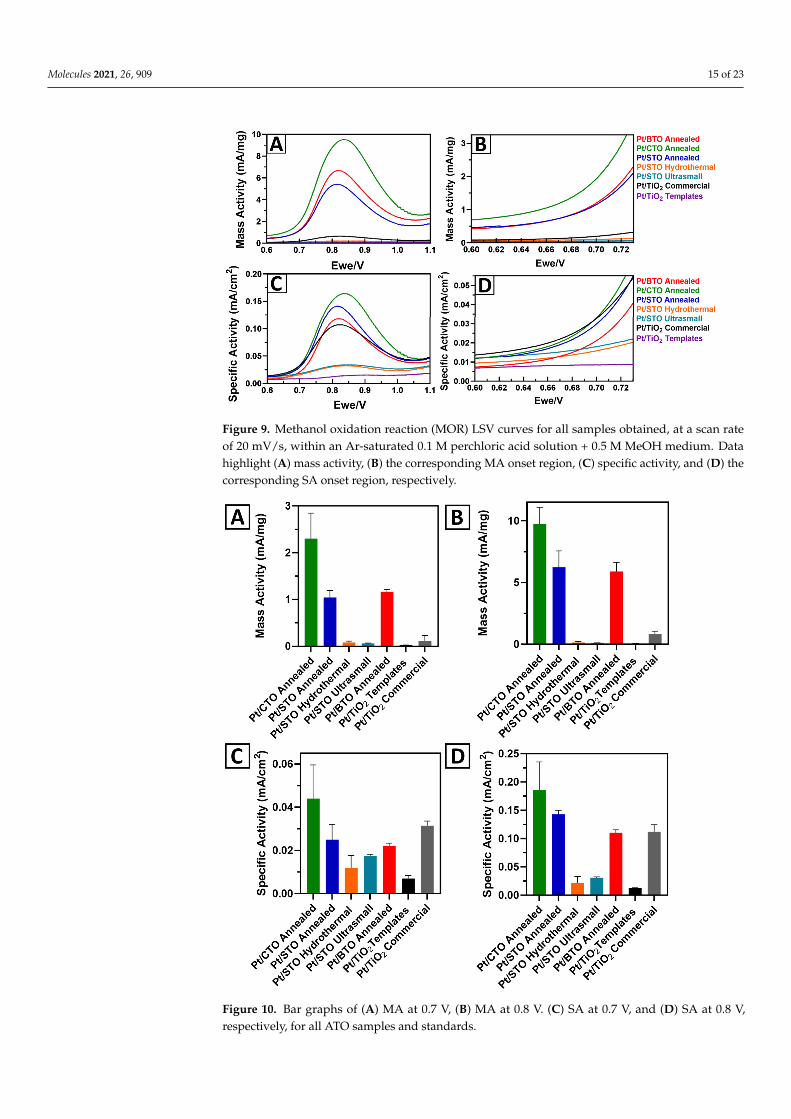
Figure 9 highlights the MOR linear sweep voltammetry (LSV) curves and shows theexpanded onset regions, with respect to Pt mass activity (Figure 9A,B) and specific activity(Figure 9C,D), for the Pt/CTO, Pt/STO, and Pt/BTO samples. Figure 10 presents bargraphs, showing the comparative MOR performance for the mass and specific activity at0.7 and 0.8 V. Supplementary Materials Table S1 includes a summary of results, derivedfrom MOR measurements obtained at both 0.7 and 0.8 V. From these data, we noticedseveral interesting trends within the measurements. First, with respect to the mass activity,all of the 3D micron-scale spheres of Pt/CTO, Pt/STO, and Pt/BTO evinced enhancedperformance, as compared with either a Pt/TiO2 commercial particulate standard orPt/TiO2 3D templates. Second, for both SA and MA values, the activity trend for the3D spheres was in the order of Pt/CTO > Pt/STO > Pt/BTO, with CTO exhibiting thebest performance. This was consistent with our observations of an early onset of Pt oxideformation in the Pt/CTO sample from the CV data.
Molecules 2021, 26, 909 15 of 23Molecules 2021, 26, x 16 of 25
Figure 9. Methanol oxidation reaction (MOR) LSV curves for all samples obtained, at a scan rate of 20 mV/s, within an Ar-saturated 0.1 M perchloric acid solution + 0.5 M MeOH medium. Data highlight (A) mass activity, (B) the corresponding MA onset region, (C) specific activity, and (D) the corresponding SA onset region, respectively.
In order to rationalize the trend in performance, we considered several plausible ex-planations that could lead to an increase in activity in the CTO and STO samples relative to that of BTO. For example, we correlated these behaviors with parameters such as (i) BET surface area; (ii) the measured particle size obtained from SEM and TEM; and (iii) the crystallite size, which is calculated by using the Debye–Scherrer equation from the XRD patterns, all of which are provided in Table 1. Interestingly and somewhat counter-intui-tively, we measured increased mass activities for our 3D particles of BTO, CTO, and STO, even though all of these materials possessed lower BET surface areas as compared with the precursor 3D TiO2 templates. Though it would have been expected that a higher sur-face area of the supports would yield a correspondingly greater catalytic performance, due to the increase in the number of exposed active sites [19], we observed the exact op-posite herein. That is, the inverse correlation between surface area and performance sug-gests that chemical composition is a more significant parameter as opposed to the support surface area and particle size in dictating catalytic behavior for perovskites, an assertion consistent with our previous findings with SRO [19].
As an additional contributing factor to activity enhancement for ATO systems, we point out that all of the perovskite samples, in addition to the commercial TiO2 nanopar-ticles, maintained calculated Debye–Scherrer crystallite sizes of over 30 nm. This result represents a significant increase as compared with the 5.7 nm associated with the TiO2 precursor template, implying a greater degree of crystallinity for the perovskite products. The exact effects of crystallinity on catalytic performance are complex, with some reports showing that the use of amorphous materials resulted in higher performance metrics [44,45]. By contrast, other studies implied that an increase in crystallinity of the support correlated with improved MOR performance [46]. In a prior report, well-defined crystal-line octahedral SrRuO3 NPs were found to yield higher MOR activity than spherical na-noparticles with disordered surfaces [13,19]. In this case, the higher degree of crystallinity may also contribute to the overall higher activity of the perovskite particles relative to that
Figure 9. Methanol oxidation reaction (MOR) LSV curves for all samples obtained, at a scan rateof 20 mV/s, within an Ar-saturated 0.1 M perchloric acid solution + 0.5 M MeOH medium. Datahighlight (A) mass activity, (B) the corresponding MA onset region, (C) specific activity, and (D) thecorresponding SA onset region, respectively.
Molecules 2021, 26, x 17 of 25
of TiO2. However, the crystallinity of all of the perovskite supports we synthesized is sim-ilar, and thus, this factor alone does not fully explain the observed trend in performance within the set of perovskite supports tested.
Figure 10. Bar graphs of (A) MA at 0.7 V, (B) MA at 0.8 V. (C) SA at 0.7 V, and (D) SA at 0.8 V, respectively, for all ATO samples and standards.
Within the series of titanate-based perovskites themselves, CTO yielded the best per-formance, even though all of the ATO spheres possessed similar particle sizes and crys-tallite sizes, as deduced from electron microscopy and diffraction data. Moreover, all sam-ples were identically processed in terms of not only annealing temperatures used but also the relevant acid washing steps. Hence, to gain insights into this behavior, we postulate that this activity trend correlates with the ionic radius of the “A” site cation and the surface energy of the corresponding perovskite crystal lattice. Specifically, because Ca2+ < Sr2+ < Ba2+ in terms of ionic radius, CTO possesses the lowest surface energy, the weakest water
Figure 10. Bar graphs of (A) MA at 0.7 V, (B) MA at 0.8 V. (C) SA at 0.7 V, and (D) SA at 0.8 V,respectively, for all ATO samples and standards.
Molecules 2021, 26, 909 16 of 23
In order to rationalize the trend in performance, we considered several plausibleexplanations that could lead to an increase in activity in the CTO and STO samples relativeto that of BTO. For example, we correlated these behaviors with parameters such as(i) BET surface area; (ii) the measured particle size obtained from SEM and TEM; and(iii) the crystallite size, which is calculated by using the Debye–Scherrer equation from theXRD patterns, all of which are provided in Table 1. Interestingly and somewhat counter-intuitively, we measured increased mass activities for our 3D particles of BTO, CTO, andSTO, even though all of these materials possessed lower BET surface areas as comparedwith the precursor 3D TiO2 templates. Though it would have been expected that a highersurface area of the supports would yield a correspondingly greater catalytic performance,due to the increase in the number of exposed active sites [19], we observed the exactopposite herein. That is, the inverse correlation between surface area and performancesuggests that chemical composition is a more significant parameter as opposed to thesupport surface area and particle size in dictating catalytic behavior for perovskites, anassertion consistent with our previous findings with SRO [19].
As an additional contributing factor to activity enhancement for ATO systems, wepoint out that all of the perovskite samples, in addition to the commercial TiO2 nanopar-ticles, maintained calculated Debye–Scherrer crystallite sizes of over 30 nm. This resultrepresents a significant increase as compared with the 5.7 nm associated with the TiO2 pre-cursor template, implying a greater degree of crystallinity for the perovskite products. Theexact effects of crystallinity on catalytic performance are complex, with some reports show-ing that the use of amorphous materials resulted in higher performance metrics [44,45]. Bycontrast, other studies implied that an increase in crystallinity of the support correlatedwith improved MOR performance [46]. In a prior report, well-defined crystalline octahe-dral SrRuO3 NPs were found to yield higher MOR activity than spherical nanoparticleswith disordered surfaces [13,19]. In this case, the higher degree of crystallinity may alsocontribute to the overall higher activity of the perovskite particles relative to that of TiO2.However, the crystallinity of all of the perovskite supports we synthesized is similar, andthus, this factor alone does not fully explain the observed trend in performance within theset of perovskite supports tested.
Within the series of titanate-based perovskites themselves, CTO yielded the bestperformance, even though all of the ATO spheres possessed similar particle sizes andcrystallite sizes, as deduced from electron microscopy and diffraction data. Moreover,all samples were identically processed in terms of not only annealing temperatures usedbut also the relevant acid washing steps. Hence, to gain insights into this behavior, wepostulate that this activity trend correlates with the ionic radius of the “A” site cation andthe surface energy of the corresponding perovskite crystal lattice. Specifically, because Ca2+
< Sr2+ < Ba2+ in terms of ionic radius, CTO possesses the lowest surface energy, the weakestwater binding, and the least exothermic enthalpy of formation as compared with thesealkaline-earth perovskite analogues [47]. Such factors correlate with the observed trend inMOR performance of Pt/CTO > Pt/STO > Pt/BTO, highlighting the collective importanceof ionic radius, surface energy, and formation enthalpy in accounting for CTO’s highercatalytic activity as compared with STO and BTO [47,48].
Although it is difficult to ascribe a single explanation for the influence of the A-sitecation upon performance, there are several plausible scenarios, based on prior literature,that are related to the structure and electronic properties of CTO, BTO, and STO. Forexample, it is evident from the CV data that CTO leads to the oxidation of Pt surfacesites at significantly lower potentials. One plausible rationale for this observation is thelow hydration energy of CTO in relation to the larger cations. A lower hydration energymay reduce the coverage of water on the surface of CTO, thereby leading to a strongerinteraction of Pt sites at the interface between the Pt NP and the metal oxide substrate.Alternatively, prior literature has shown that CTO favors the exposure of the 001 surfacefacets due to a subsurface reconstruction, which is not favored in either STO and BTO [49].Variations in the surface structure of perovskites can lead to significant impacts upon
Molecules 2021, 26, 909 17 of 23
surface energy, oxygen coverage, and also the degree of surface rumpling, all of whichcan contribute to a unique interaction between the CTO surface and Pt in addition to thepredicted trend in oxygen binding strength on the Pt catalysts.
To further understand the performance of our 3D ATO microspheres, we collectedchronoamperometry results, which are shown in Figure 11. These tests were run for aperiod of 3600 s, at a constant voltage of 0.8 V vs. RHE, a typical value within the rangeof methanol oxidation. Chronoamperometry data for the standards and templates areprovided in Supplementary Materials Figure S11. There is an initial activity drop observedfor all samples that may be due not only to the buildup of poisoning intermediate species(such as CO) but also to the small degree of surface oxidation that occurs at this potential.These species would poison the active sites, thereby resulting in a perceptibly diminishedsignal upon the initiation of methanol oxidation [50]. After the rapid initial drop, a steadystate was achieved and maintained for all samples.
Molecules 2021, 26, x 19 of 25
Figure 11. Chronoamperometry measurements at 0.8 V of 3D ATO microspheres obtained within an Ar-saturated 0.1 M perchloric acid solution + 0.5 M MeOH medium for 3600 s.
2.7. Probing the Effect of Size and Morphology on MOR: STO Series As mentioned earlier, we generated a series of STO samples, in the form of spheres,
nanocubes, and ultra-small particles possessing distinctive sizes and morphologies, cre-ated with different surfactant-free synthesis procedures. The annealed 3D STO sample gave rise to the highest relative specific and mass activity values, as compared with those derived from either hydrothermal or solvothermal methods. As we observed previously, these performance data inversely correlated with BET surface area trends, in that the read-ings associated with STO ultra-small, STO cubes, and 3D STO spheres were 81.52, 74.36, and 5.74 m2/g, respectively, implying, in general, that surface area was not an important factor.
With regards to ultra-small STO nanoparticles, their poor performance may be ex-plained by a combination of their amorphous nature coupled with their small crystallite size, 4.3 ± 0.4 nm, as determined by XRD [46]. Because the size of the ultra-small STO particles is very close to that of the associated Pt nanoparticles (i.e., ~2 nm), the deposition step likely resulted in a physical mixture of both STO nanoparticles and Pt nanoparticles (Supplementary Materials Figure S8E), as opposed to a more clearly differentiable cata-lyst/support architecture that would have been predicted to form in the case of larger STO particles. Interestingly, 3D STO displays higher catalytic activity relative to that of analo-gous STO cubes, despite both samples possessing comparable crystallite sizes. Although it is difficult to precisely identify the origin of this trend, the 3D STO particles were sub-jected to an acid treatment, whereas STO cubes were prepared under basic conditions. As discussed earlier, in acid, the surfaces of the 3D STO particles would be expected to pref-erentially expose Ti surface sites. As such, with 3D STO, the presence of such surface sites may lead to not only a higher overall stability during electrocatalysis in acidic media but also a desirable decrease in potentially deleterious Pt aggregation [16].
3. Materials and Methods 3.1. Materials
All chemicals were used as received, without further purification. Specifically, the metal precursors of strontium chloride (SrCl2 99–100.4%), barium hydroxide hexahydrate
MA
(mA
/mg)
Figure 11. Chronoamperometry measurements at 0.8 V of 3D ATO microspheres obtained within anAr-saturated 0.1 M perchloric acid solution + 0.5 M MeOH medium for 3600 s.
Pt/CTO evinced the best performance, with Pt/BTO and Pt/STO possessing verysimilar steady-state activities. This finding suggests that the CTO substrate aids in theoxidation of CO to CO2 and reduces Pt poisoning, as compared with the other samplesanalyzed. Moreover, the reference standards tested, including the TiO2 commercial, TiO2templates, STO ultra-small, and STO hydrothermal specimens, exhibited substantiallylower steady-state activities, as compared with their 3D ATO micron-sphere analogues.Hence, these data are consistent with what we have identified previously, namely that thesmall ionic radius of Ca2+ results in CTO yielding the highest steady-state current densities.Not surprisingly, our 3D ATO micron-scale spheres significantly outperform both TiO2 andSTO samples characterized by different morphologies.
2.7. Probing the Effect of Size and Morphology on MOR: STO Series
As mentioned earlier, we generated a series of STO samples, in the form of spheres,nanocubes, and ultra-small particles possessing distinctive sizes and morphologies, createdwith different surfactant-free synthesis procedures. The annealed 3D STO sample gave riseto the highest relative specific and mass activity values, as compared with those derivedfrom either hydrothermal or solvothermal methods. As we observed previously, theseperformance data inversely correlated with BET surface area trends, in that the readings
Molecules 2021, 26, 909 18 of 23
associated with STO ultra-small, STO cubes, and 3D STO spheres were 81.52, 74.36, and5.74 m2/g, respectively, implying, in general, that surface area was not an important factor.
With regards to ultra-small STO nanoparticles, their poor performance may be ex-plained by a combination of their amorphous nature coupled with their small crystallitesize, 4.3 ± 0.4 nm, as determined by XRD [46]. Because the size of the ultra-small STOparticles is very close to that of the associated Pt nanoparticles (i.e., ~2 nm), the depositionstep likely resulted in a physical mixture of both STO nanoparticles and Pt nanoparticles(Supplementary Materials Figure S8E), as opposed to a more clearly differentiable cata-lyst/support architecture that would have been predicted to form in the case of largerSTO particles. Interestingly, 3D STO displays higher catalytic activity relative to that ofanalogous STO cubes, despite both samples possessing comparable crystallite sizes. Al-though it is difficult to precisely identify the origin of this trend, the 3D STO particles weresubjected to an acid treatment, whereas STO cubes were prepared under basic conditions.As discussed earlier, in acid, the surfaces of the 3D STO particles would be expected topreferentially expose Ti surface sites. As such, with 3D STO, the presence of such surfacesites may lead to not only a higher overall stability during electrocatalysis in acidic mediabut also a desirable decrease in potentially deleterious Pt aggregation [16].
3. Materials and Methods3.1. Materials
All chemicals were used as received, without further purification. Specifically, themetal precursors of strontium chloride (SrCl2 99–100.4%), barium hydroxide hexahydrate(Ba(OH)2 6H2O, 98.0%), and calcium hydroxide (Ca(OH)2, 98%) were purchased fromeither J.T. Baker or Baker & Adamson Chemical. Sodium hydroxide pellets (NaOH, 98.5%),sulfuric acid (H2SO4, 95–98%), strontium metal (99%), and anhydrous benzyl alcohol(99.8%) were acquired from Millipore Sigma. Titanium (IV) n-butoxide (Ti(OBu)4, 99%) andtitanium (IV) isopropoxide (Ti(C3H7O)4, 98%) were procured from Acros Organics, whiledihydrogen hexachloroplatinate (IV) hydrate (H2PtCl6·x H2O, 99.9%), strontium hydroxideoctahydrate (Sr(OH)2·8 H2O, 99%), and an aluminum oxide polishing compound (Al2O3)were obtained from Alfa Aesar. Anhydrous ethanol (90%) solvent was bought fromBeanTown Chemical.
3.2. Synthesis3.2.1. Synthesis of TiO2 Templates
The TiO2 micron-scale spheres were fabricated by a hydrothermal procedure, modifiedfrom a previously reported alcohol-based method [26]. Specifically, 5.1 g titanium butoxide(Ti(OBu)4) was placed in a 250 mL round-bottom flask to which 75 mL anhydrous ethanolwas added dropwise into the container, with gentle magnetic stirring. It was observed that,after about 20 mL of ethanol had been added, the solution became cloudy white in hue. Themixture was then allowed to stir for 30 min, before 0.33 mL of concentrated sulfuric acidwas injected into the beaker. The solution turned clear after several minutes. The wholesolution was then kept stirring, at room temperature, for another 2 h. The reagents weresubsequently transferred into a 100 mL Teflon autoclave, which was heated to 180 C for8 h. The resulting white product produced from the hydrothermal reaction was collectedby means of centrifugation and washed with both de-ionized (DI) water and ethanol.
3.2.2. Synthesis of CaTiO3, BaTiO3, and SrTiO3
The desired CTO, BTO, and STO micron-scale spheres were generated by a modifiedsol–gel calcination process [26]. Specifically, as-prepared TiO2 powder templates weredispersed into anhydrous ethanol, followed by adding in either Ca(OH)2, Ba(OH)2·6 H2O,or Sr(OH)2·8 H2O precursors, respectively, depending on the targeted product. The molarratio of TiO2 to metal hydroxide was fixed at 1:1. In typical runs, we added in 100 mg ofTiO2 with either 0.092, 0.395, or 0.321 g of Ca(OH)2, Ba(OH)2·6 H2O, or Sr(OH)2·8 H2O,respectively. The amount of anhydrous ethanol put into the mixture ranged between 15
Molecules 2021, 26, 909 19 of 23
and 20 mL; however, the exact amount did not appear to make a perceptible difference.The whole mixture was sonicated for 2 h at room temperature.
The resulting solid intermediate species was collected by centrifugation and thendried at 60 C, in the drying oven, for 1 h. The as-prepared intermediate was calcinedimmediately after drying, at 1000 C for 3 h, using a ramp rate of 8 C/min. Samples weresubsequently purified by a combination of centrifugation/sonication (9000 rpm for 5 min)steps in the presence of dilute nitric acid (0.05 M), to remove impurities, as well as residualTiO2. The washing procedure involved rinsing 3× with nitric acid, 2× with water, and 1×with an ethanol, in that precise, sequential order, so as to avoid contact between ethanoland nitric acid.
3.2.3. Hydrothermal Synthesis of SrTiO3
STO nanocubes were obtained by reacting and converting the precursor TiO2 micron-scale spheres, prepared in the first step, by using NaOH as a “catalyst” [51]. In a typicalexperiment, 0.5 g TiO2 spheres in the form of dry powder coupled with 1.67 g strontiumchloride hexahydrate powder were weighed and dissolved in 50 mL DI water, undersonication, for 10 min; 2 g of NaOH was then added into the mixture, with magneticstirring. Once the NaOH had completely dissolved, the mixture was transferred to a100 mL Teflon-lined autoclave and heated to 140 C for 4 h. The final product was collectedby centrifugation and washed with both DI water and ethanol multiple times.
3.2.4. Ultra-Small SrTiO3
Ultra-small, sub-10 nm STO particles were synthesized, using a previously publishedmethod [21]. In short, 2 mmol (175.2 mg) Sr metal and 2 mmol (0.591 mL) titanium (IV)isopropoxide were added to 25 mL of anhydrous benzyl alcohol, under an Ar atmosphere,within a glove box, to prevent H2O and O2 contamination. The mixture was stirred forseveral minutes and then transferred to a 50 mL Teflon lined autoclave. The autoclave wassubsequently sealed and removed from the glove box, prior to heating at 200 C, for 48 h.The formation of a milky white suspension was observed, and the precipitated sampleswere washed several times with ethanol, coupled with centrifugation for 10 min at a rate of9000 rpm.
Pt nanoparticles (20% weight loading) were supported onto ATiO3 micron-scalespheres via an in situ growth method [52]. Specifically, ATO spheres were dispersedin 100 mL DI water, to yield a final concentration of 1 mg/mL. In a typical procedure,42 mg of chloroplatinic acid hexahydrate was introduced to this solution, to give riseto a 20 wt% Pt loading. The solution was then sonicated for 30 min. Next, 50 mL ofsodium borohydride solution, incorporating a NaBH4 concentration of 2 mg/mL, was thenquickly added to the mixture, as a reducing agent, under magnetic stirring. The reactionwas further stirred for 2 h. After that last step, the resulting final product, comprising aPt-loaded metal oxide support sample, was subsequently washed with deionized waterand ethanol, and ultimately dried overnight, at 60 C, in a drying oven. The samples werethen re-dispersed in ethanol, with a final concentration of 10 mg/mL.
3.3. Structural and Morphological Characterization3.3.1. X-ray Diffraction (XRD)
Diffraction experiments were conducted, using a Scintag diffractometer, operatingin the Bragg–Brentano configuration with Cu Kα1 irradiation (λ = 1.54 Å). All diffractionpatterns of ATO samples were collected with a scanning rate of 10 degrees per minute.Powder samples were dispersed in ethanol and drop-cast onto a zero-background holder(MTI Corporation, zero diffraction plate for XRD, B-doped, p-type Si, 23.6 mm in diameterand 2 mm in thickness), followed by drying in air.
Molecules 2021, 26, 909 20 of 23
3.3.2. Electron Microscopy
As-prepared ethanolic sample solutions for scanning electron microscopy (SEM) weredeposited onto silicon wafers, individually, and then evaporated in air. Initial characteriza-tion experiments to deduce morphology were performed on a JEOL 7600 microscope, withthe resulting images collected under an accelerating voltage of 5 kV.
For higher-resolution, complementary transmission electron microscopy (TEM), as-prepared ethanolic sample solutions were drop cast onto 3 mm lacey carbon-coated coppergrids, prior to analysis. A JEOL 1400 TEM instrument was used to image all of the samples,at an accelerating voltage of 120 kV.
3.3.3. BET Surface Area
Surface area measurements were obtained, using a Nova 2200e surface area analyzer.All samples were degassed at 250 C, for 2 h, under vacuum, before measurements weretaken. A Quantachrome Instruments–derived surface area reference material (Cat. No.2001), possessing a surface area of 14.26 ± 1.22 m2/g (95% reproducibility), was used tocalibrate the instrument.
3.3.4. Electrochemical Measurements
Prior to electrochemical characterization, samples of Pt NPs supported onto ATiO3micron-scale spheres were rendered into catalyst inks by dispersing the dry powders intoethanol, so as to create an ~10 mg/mL solution. A glassy carbon rotating disk electrode(GC-RDE, Pine Instruments, 5 mm) was polished, using an aluminum oxide powder(average particle size of 0.3 µm). Two 5 µL drops of the as-prepared catalyst ink werethen loaded onto the glassy carbon electrode and air-dried. One 5 µL drop of an ethanolic0.025% Nafion solution was sealed in the catalyst.
A three-electrode electrochemical cell was assembled with a Pt counter electrodecoupled with an Ag/AgCl/3M Cl−(aq) electrode, serving as the reference electrode. Elec-trochemical measurements of Pt NP/ATiO3 spherical composites were subsequently per-formed within a 0.1 M perchloric acid (Optima grade) solution electrolyte, generatedfrom high-purity type 1 water (18.2 MΩ•cm). Cyclic voltammogram (CV) curves werecollected within an Ar-saturated electrolyte solution, at a scan rate of 20 mV/s. The MORmeasurements themselves of the various samples were conducted by obtaining linearsweep voltammograms at a scan rate of 20 mV/s within a de-oxygenated 0.5 M methanol(Optima grade) solution, supported within a 0.1 M perchloric acid electrolytic environment.Chronoamperometry measurements were obtained within the same 0.1 M perchloric acidelectrolyte in the presence of 0.5 M methanol. Tests were run at a constant voltage of 0.8 Vvs. RHE for 3600 s.
4. Conclusions
In this study, we successfully synthesized and characterized 3D spherical motifs ofperovskite metal oxides, such as CTO, STO, and BTO. The synthesis method we havedeveloped herein involves a two-step, surfactant-free protocol in which porous 3D anataseTiO2 templates are initially synthesized hydrothermally and subsequently reacted withA(OH)2 precursors under high-temperature annealing conditions. Based on XRD datacollection as a function of temperature, the conversion of TiO2 to ATO at elevated tem-peratures required 1000 C for most of the samples to fully convert them into the desiredperovskite spherical motifs. This conversion process was aided by the porous nature of theTiO2 template spheres, allowing for a reasonable distribution of the “A” site ions throughsonication, prior to annealing. This protocol yielded spheres that were robust enough tomaintain their shape, even under sonication, unlike hydrothermally generated STO, forinstance. In addition, this procedure could produce gram-scale quantities of the desiredperovskites with relatively clean outer surfaces; the absence of any potentially deactivatingsurfactants was conducive to favorable electrochemical performance.
Molecules 2021, 26, 909 21 of 23
In terms of MOR behavior, the CTO sample yielded the highest performance for anumber of reasons. Among the perovskites we tested, CTO possessed the lowest surfaceenergy, the weakest water binding, and the least exothermic enthalpy of formation ascompared with its alkaline-earth perovskite analogues. The trend in ionic radius of Ca2+ <Sr2+ < Ba2+ correlated very well with the observed trend in MOR performance of Pt/CTO> Pt/STO > Pt/BTO. Moreover, the greater stability and crystallinity of this sample wereconsistent with our findings that chemical composition, as opposed to either size, mor-phology, or BET surface area alone, was the most important determinant of MOR activity,corroborating our prior results on SRO.
Supplementary Materials: The following are available online, SEM images of CTO, annealed at vari-ous temperatures, Figure S2: XRD patterns of a CTO powder sample calcined at various temperaturesas well as of the CTO intermediate. Figure S3: SEM images of impurities within isolated CTO andSTO samples. Figure S4: XRD patterns of a BTO powder sample calcined at various temperaturesas well as of the BTO intermediate. Figure S5: SEM images of BTO, annealed at various tempera-tures. Figure S6: SEM images of STO annealed at various temperatures. Figure S7: XRD patternsof annealed, hydrothermal-derived, and ultra-small STO samples. Figure S8: XRD patterns of theTiO2 3D precursor templates along with the commercial TiO2. Figure S9: TEM images of Pt particlesdeposited onto the various different perovskite and standard samples that were analyzed. Figure S10:CV curves for reference standards. Figure S11. Chronoamperometry measurements collected at 0.8 Vof reference standard systems. Table S1: MOR data obtained for all samples, including specific andmass activity readings, in addition to specific surface area values.
Author Contributions: Conceptualization, S.S.W.; Data curation, N.H. and L.L. Formal analysisand interpretation, N.H. and C.K. Investigation, N.H., L.L. and C.K. Project administration andsupervision, S.S.W. All authors have read and agreed to the published version of the manuscript.
Funding: This material is based on work supported by the US National Science Foundation, underGrant No. CHE-1807640. Structural characterization experiments (TEM, SEM, and XPS) for thismanuscript were performed in part at the Center for Functional Nanomaterials, located at BrookhavenNational Laboratory, which is supported by the US Department of Energy, under Contract No. DE-SC-00112704. N. H. acknowledges financial support from a Joint Photon Sciences Institute (JPSI)graduate student fellowship for experiments performed at Brookhaven National Laboratory. TheAPC was funded by MDPI.
Data Availability Statement: The data presented in this study are available within the current articleand accompanying Supplementary Information section.
Acknowledgments: This material is based on work supported by the US National Science Foun-dation, under Grant No. CHE-1807640. Structural characterization experiments (TEM, SEM, andXPS) for this manuscript were performed in part at the Center for Functional Nanomaterials, locatedat Brookhaven National Laboratory, which is supported by the US Department of Energy, underContract No. DE-SC-00112704. Nathaniel Hurley acknowledges financial support from a Joint Pho-ton Sciences Institute (JPSI) graduate student fellowship for experiments performed at BrookhavenNational Laboratory.
Conflicts of Interest: The authors declare no conflict of interest.
Sample Availability: Samples of the compounds produced are available from the authors.
References1. Cohen, R.E. Origin of Ferroelectricity in Perovskite Oxides. Nat. Cell Biol. 1992, 358, 136–138. [CrossRef]2. Phelan, D.; Stock, C.; Rodriguez-Rivera, J.A.; Chi, S.; Leão, J.; Long, X.; Xie, Y.; Bokov, A.A.; Ye, Z.-G.; Ganesh, P.; et al. Role of
Random Electric Fields in Relaxors. Proc. Natl. Acad. Sci. USA 2014, 111, 1754–1759. [CrossRef]3. Jankowska-Sumara, I.; Szot, K.; Majchrowski, A.; Roleder, K. Thermal Hysteresis of Local Instabilities in Paraelectric Phase of
PbZr0.96Sn0.04 O3 Single Crystals. J. Appl. Phys. 2013, 113, 187209. [CrossRef]4. Talanov, M.V.; Bokov, A.A.; Marakhovsky, M.A. Effects of Crystal Chemistry and Local Random Fields on Relaxor and Piezoelectric
Behavior of Lead-Oxide Perovskites. Acta Mater. 2020, 193, 40–50. [CrossRef]5. Fan, Z.; Sun, K.; Wang, J. Perovskites for Photovoltaics: A Combined Review of Organic–Inorganic Halide Perovskites and
Ferroelectric Oxide Perovskites. J. Mater. Chem. A 2015, 3, 18809–18828. [CrossRef]
8. Dubey, A.K.; Ravikumar, K.; Basu, B. Perovskite Ceramics as New-Generation Materials for Orthopedic Applications. Trans.Indian Inst. Met. 2019, 72, 1999–2010. [CrossRef]
9. Wang, R.; Ni, S.; Liu, G.; Xu, X. Hollow CaTiO3 Cubes Modified by La/Cr Co-doping for Efficient Photocatalytic HydrogenProduction. Appl. Catal. B Environ. 2018, 225, 139–147. [CrossRef]
10. Lu, L.; Ni, S.; Liu, G.; Xu, X. Structural Dependence of Photocatalytic Hydrogen Production over La/Cr Co-doped PerovskiteCompound ATiO 3 (A = Ca, Sr and Ba). Int. J. Hydrogen Energy 2017, 42, 23539–23547. [CrossRef]
11. Luo, B.; Wang, X.; Tian, E.; Song, H.; Wang, H.; Li, L. Enhanced Energy-Storage Density and High Efficiency of Lead-FreeCaTiO3–BiScO3 Linear Dielectric Ceramics. ACS Appl. Mater. Interfaces 2017, 9, 19963–19972. [CrossRef] [PubMed]
12. Wang, Y.; Chen, X.; Wang, Q.; Zeng, Y.; Liao, K.; Zhang, S.; Zhong, Q. Novel 3D Hierarchical Bifunctional NiTiO3 Nanoflower forSuperior Visible Light Photoreduction Performance of CO2 to CH4 and High Lithium Storage Performance. Energy 2019, 169,580–586. [CrossRef]
13. Scofield, M.E.; Koenigsmann, C.; Bobb-Semple, D.; Tao, J.; Tong, X.; Wang, L.; Lewis, C.S.; Vukmirovic, M.B.; Zhu, Y.; Adzic, R.R.;et al. Correlating the Chemical Composition and Size of Various Metal Oxide Substrates with the Catalytic Activity and Stabilityof as-Deposited PT Nanoparticles for the Methanol Oxidation Reaction. Catal. Sci. Technol. 2015, 6, 2435–2450. [CrossRef]
14. Chen, J.; Yang, L.; Fang, S.; Tang, Y. Synthesis of Sawtooth-like Li4Ti5O12 Nanosheets as Anode Materials for Li-Ion Batteries.Electrochim. Acta 2010, 55, 6596–6600. [CrossRef]
15. Xia, H.; Luo, Z.; Xie, J. Nanostructured Lithium Titanate and Lithium Titanate/Carbon Nanocomposite as Anode Materials forAdvanced Lithium-Ion Bat-Teries. Nanotechnol. Rev. 2014, 3, 161–175. [CrossRef]
16. Lan, A.; Mukasyan, A.S. Perovskite-Based Catalysts for Direct Methanol Fuel Cells. J. Phys. Chem. C 2007, 111, 9573–9582.[CrossRef]
17. Lan, A.; Mukasyan, A.S. Complex SrRuO3−Pt and LaRuO3−Pt Catalysts for Direct Alcohol Fuel Cells. Ind. Eng. Chem. Res. 2008,47, 8989–8994. [CrossRef]
18. White, J.H.; Sammells, A.F.; Shiratsuchi, R.; Aikoh, Y.; Nogami, G. Perovskite Anode Electrocatalysis for Direct Methanol FuelCells. J. Electrochem. Soc. 1993, 140, 2167–2177. [CrossRef]
19. Tiano, A.L.; Santulli, A.C.; Koenigsmann, C.; Feygenson, M.; Aronson, M.; Harrington, R.; Parise, J.B.; Wong, S.S. Toward aReliable Synthesis of Strontium Ruthenate: Parameter Control and Property Investigation of Submicrometer-Sized Structures.Chem. Mater. 2011, 23, 3277–3288. [CrossRef]
20. Abdullah, M.; Nelson, R.J.; Kittilstved, K.R. On the Formation of Superoxide Radicals on Colloidal ATiO3 (A = Sr and Ba)Nanocrystal Surfaces. Nanoscale Adv. 2020, 2, 1949–1955. [CrossRef]
21. Niederberger, M.; Garnweitner, G.; Pinna, N.; Antonietti, M. Nonaqueous and Halide-Free Route to Crystalline BaTiO3, SrTiO3,and (Ba,Sr)TiO3Nanoparticles via a Mechanism Involving C−C Bond Formation. J. Am. Chem. Soc. 2004, 126, 9120–9126.[CrossRef]
24. Moghtada, A.; Ashiri, R. Enhancing the Formation of Tetragonal Phase in Perovskite Nanocrystals Using an Ultrasound AssistedWet Chemical Method. Ultrason. Sonochem. 2016, 33, 141–149. [CrossRef] [PubMed]
25. Sunstrom, J.E.; Kauzlarich, S.M.; Antonio, M.R. Synthesis, Structure and Characterization of Ce1-xAxTiO3 (0.0. ltoreq. x. ltoreq.0.8; A = strontium, barium). Chem. Mater. 1993, 5, 182–191. [CrossRef]
26. Demirörs, A.F.; Imhof, A. BaTiO3, SrTiO3, CaTiO3, and BaxSr1−xTiO3Particles: A General Approach for Monodisperse ColloidalPerovskites. Chem. Mater. 2009, 21, 3002–3007. [CrossRef]
27. Xu, L.; Cui, Q.; Zhang, H.; Jiao, A.; Tian, Y.; Li, S.; Li, H.; Chen, M.; Chen, F. Ultra-Clean PtPd Nanoflowers Loaded on GoSupports with Enhanced Low-Temperature Electrocatalytic Activity for Fuel Cells in Harsh Environ-Ment. Appl. Surf. Sci. 2020,511, 145603. [CrossRef]
28. Cargnello, M.; Chen, C.; Diroll, B.T.; Doan-Nguyen, V.V.; Gorte, R.J.; Murray, C.B. Efficient removal of organic ligands fromsupported nanocrystals by fast thermal annealing enables catalytic studies on well-defined active phases. J. Am. Chem. Soc. 2015,137, 6906–6911. [CrossRef]
Supported on Reduced Graphene Oxide: One-Pot Green Synthesis and Efficient Electrocatalytic Performances for GlycerolOxidation and Hydrogen Evolution. J. Alloy. Compd. 2018, 735, 2123–2132. [CrossRef]
33. Zheng, Z.; Huang, B.; Qin, X.; Zhang, X.; Dai, Y. Strategic synthesis of hierarchical TiO2 microspheres with enhanced photocatalyticactivity. Chemistry 2010, 16, 11266–11270. [CrossRef]
34. Cai, S.; Yu, S.; Wan, W.; Wen, W.; Zhou, Y. Self-Template Synthesis of ATiO3 (A = Ba, Pb and Sr) Perovskites for PhotocatalyticRemoval of NO. RSC Adv. 2017, 7, 27397–27404. [CrossRef]
35. Hamnett, A. Mechanism of Methanol Oxidation. In Interfacial Electrochemistry: Theory, Experiment and Applications; Wieckowski,A., Ed.; Marcel Dekker: New York, NY, USA, 1999; pp. 843–879.
36. Hartnig, C.; Jorissen, L.; Lehnert, W.; Scholta, J. Direct Methanol Fuel Cells. In Materials for Fuel Cells; Gasik, M., Ed.; WoodheadPublishing: Oxford, UK, 2008; pp. 185–208.
37. Tang, H.; Su, Y.; Zhang, B.; Lee, A.F.; Isaacs, M.A.; Wilson, K.; Hailian, T.; Karen, W.; Huang, J.; Haruta, M.; et al. Classical StrongMetal–Support Interactions between Gold Nanoparticles and Titanium Dioxide. Sci. Adv. 2017, 3, e1700231. [CrossRef] [PubMed]
39. Wang, H.; Lu, J.; Marshall, C.L.; Elam, J.W.; Miller, J.T.; Liu, H.; Enterkin, J.A.; Kennedy, R.M.; Stair, P.C.; Poeppelmeier, K.R.;et al. In situ XANES Study of Methanol Decomposition and Partial Oxidation to Syn-Gas over Supported Pt Catalyst on SrTiO3Nanocubes. Catal. Today 2014, 237, 71–79. [CrossRef]
40. Hasa, B.; Kalamaras, E.; Papaioannou, E.; Sygellou, L.; Katsaounis, A. Electrochemical Oxidation of Alcohols on Pt–TiO2 BinaryElectrodes. Int. J. Hydrogen Energy 2013, 38, 15395–15404. [CrossRef]
41. Koenigsmann, C.; Scofield, M.E.; Liu, H.; Wong, S.S. Designing Enhanced One-Dimensional Electrocatalysts for the OxygenReduction Reaction: Probing Size-and Composition-Dependent Electrocatalytic Behavior in Noble Metal Nanowires. J. Phys.Chem. Lett. 2012, 3, 3385–3398. [CrossRef]
42. Polo-Garzon, F.; Wu, Z. Acid–Base Catalysis over Perovskites: A Review. J. Mater. Chem. A 2018, 6, 2877–2894. [CrossRef]43. Polo-Garzon, F.; Yang, S.-Z.; Fung, V.; Foo, G.S.; Bickel, E.E.; Chisholm, M.F.; Jiang, D.-E.; Wu, Z. Controlling Reaction Selectivity
through the Surface Termination of Perovskite Catalysts. Angew. Chem. Int. Ed. 2017, 56, 9820–9824. [CrossRef] [PubMed]44. Ma, Y.; Wang, R.; Wang, H.; Linkov, V.; Ji, S. Evolution of Nanoscale Amorphous, Crystalline and Phase-Segregated Ptnip
Nanoparticles and Their Electrocatalytic Effect on Methanol Oxidation Reaction. Phys. Chem. Chem. Phys. 2014, 16, 3593.[CrossRef] [PubMed]
45. Ma, Y.; Wang, H.; Li, H.; Key, J.; Ji, S.; Wang, R. Synthesis of Ultrafine Amorphous PtP Nanoparticles and the Effect of PtPCrystallinity on Methanol Oxidation. RSC Adv. 2014, 4, 20722–20728. [CrossRef]
46. Ma, Y.; Wang, R.; Wang, H.; Liao, S.; Key, J.V.L.; Ji, S. The Effect of PtRuIr Nanoparticle Crystallinity in Electrocatalytic MethanolOxidation. Materials 2013, 6, 1621–1631. [CrossRef] [PubMed]
47. Sahu, S.K.; Maram, P.S.; Navrotsky, A. Thermodynamics of Nanoscale Calcium and Strontium Titanate Perovskites. J. Am. Ceram.Soc. 2013, 96, 3670–3676. [CrossRef]
48. Eglitis, R.I. Comparative First-Principles Calculations of SrTiO3, BaTiO3, PbTiO3 and CaTiO3 (001), (011) and (111) Surfaces.Ferroelectrics 2015, 483, 53–67. [CrossRef]
49. Wang, Y.X.; Arai, M.; Sasaki, T.; Wang, C.L. First-Principles Study of the (001) Surface of CubicCaTiO3. Phys. Rev. B 2006, 73,035411. [CrossRef]
50. Guo, J.; Zhao, T.; Prabhuram, J.; Chen, R.; Wong, C. Preparation and Characterization of a PtRu/C Nanocatalyst for DirectMethanol Fuel Cells. Electrochim. Acta 2005, 51, 754–763. [CrossRef]
51. Zheng, Z.; Huang, B.; Qin, X.; Zhang, X.; Dai, Y. Facile Synthesis of SrTiO3 Hollow Microspheres Built as Assembly of Nanocubesand Their Associated Photocatalytic Activity. J. Colloid Interface Sci. 2011, 358, 68–72. [CrossRef] [PubMed]
52. Qiu, J.-D.; Wang, G.-C.; Liang, R.-P.; Xia, X.-H.; Yu, H.-W. Controllable Deposition of Platinum Nanoparticles on Graphene As anElectrocatalyst for Direct Methanol Fuel Cells. J. Phys. Chem. C 2011, 115, 15639–15645. [CrossRef]