UPDATE: USDA Influenza A Virus Surveillance Program in Swine Barb Porter-Spalding, DVM MVPH Swine Health Epidemiologist U.S. Department of Agriculture Animal and Plant Health Inspection Service Veterinary Services Monday, October 26 Veterinary Services
Transcript
UPDATE: USDA Influenza A Virus Surveillance Program in Swine
Barb Porter-Spalding, DVM MVPHSwine Health Epidemiologist
U.S. Department of AgricultureAnimal and Plant Health Inspection Service
Veterinary ServicesMonday, October 26
Veterinary Services
Data Disclaimers:1. Surveillance is voluntary, passive,
and for the most part anonymous2. No measure of disease prevalence by
• time • location• subtype
3. State-level data summaries are not disclosed externally beyond internal state stakeholders
2
Update:1. Regional reports 2. Program analysis/review3. Budget4. Program efficiencies 5. Data
• National/Regional• Phylogenetic analysis
3
Regional IAV-S reports for Industry:
1. Report development and content:• 2014 USAHA with NPB, NPPC, and AASV• 2015 AASV meeting with AASV Influenza committee• Mock-up review
sample selection and submission process, sampled populations, representativeness of data
• Recommendations for process improvement and system efficiencies
5. With stakeholder collaboration will consider program revisions based on analyses results / budget
7
Budget:1. Initial funding through Health and Human
Services (HHS) during pH1N1 outbreak• No year funding (use until money is spent)
2. Funds expected to expire in FY 2016• Once funds expended, absorbed under APHIS
appropriated funding at some level• FY 2015 spending above expectations, working on
adjustments to conserve funding (more later)
8
Program efficiencies:•Efficiencies implemented in June 2014
• Goal - increase # of virus isolates from samples tested• Evaluation:
• CEAH-NSU analysis of samples submitted and resulting isolates• Presented and approved by the NAHLN technical working group,
implemented June 2014• Efficiency:
• CT cutoff values established for further program testing • CT < 35 for Nasal swabs and Lung; CT < 30 for OF
• Limit the number of Oral Fluid samples to 5 per accession ( total of 10 samples allowed per accession)
• Reminder of ways for novel findings to be included in the program
9
0
50
100
150
200
250
300
350
40
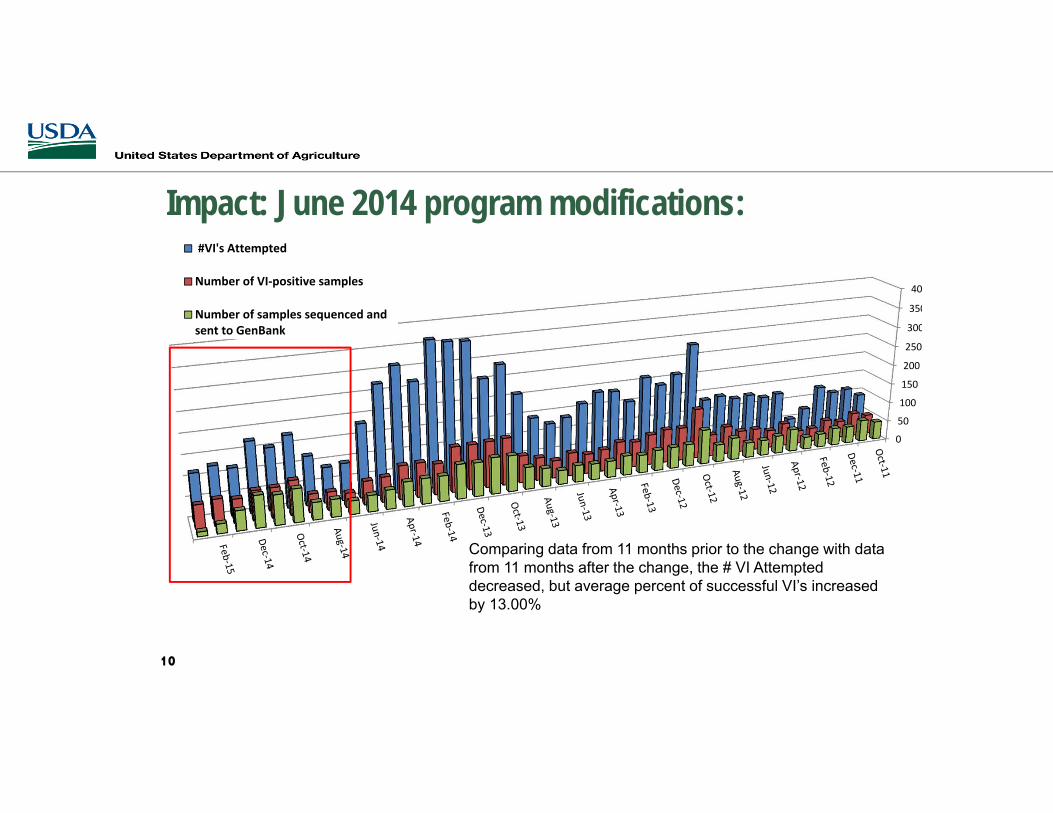
#VI's Attempted
Number of VI‐positive samples
Number of samples sequenced andsent to GenBank
Impact: June 2014 program modifications:
Comparing data from 11 months prior to the change with data from 11 months after the change, the # VI Attempted decreased, but average percent of successful VI’s increased by 13.00%
10
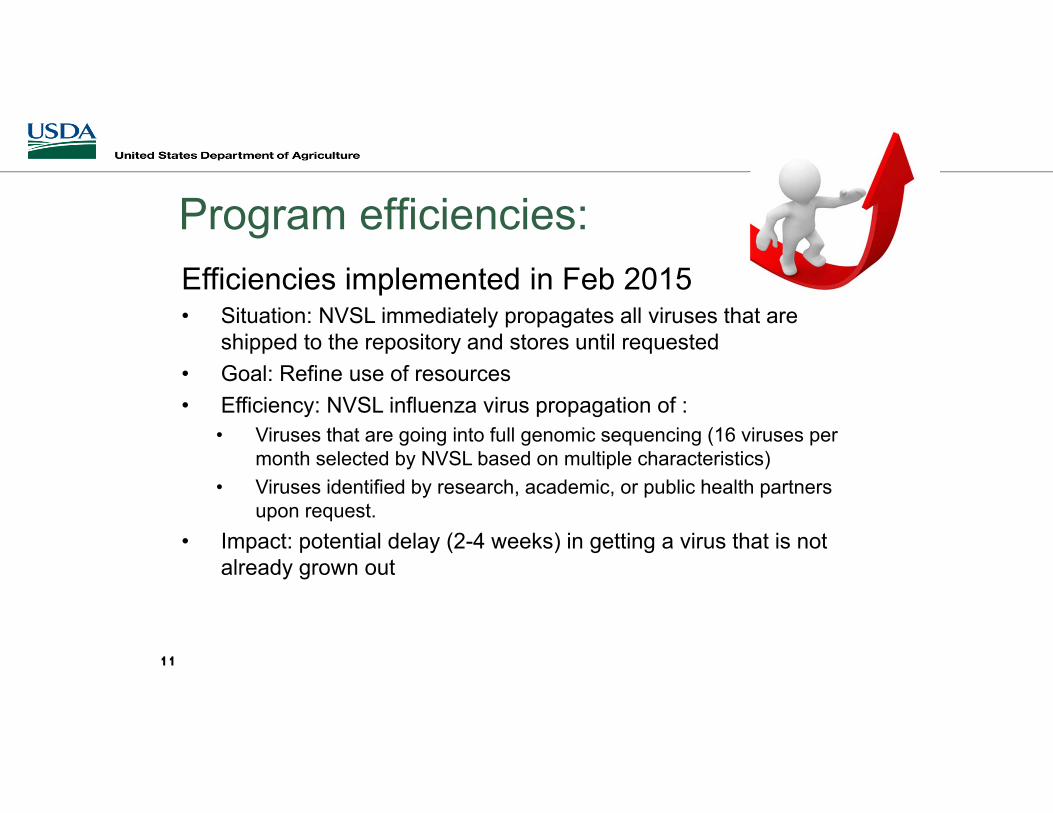
Program efficiencies:Efficiencies implemented in Feb 2015• Situation: NVSL immediately propagates all viruses that are
shipped to the repository and stores until requested• Goal: Refine use of resources• Efficiency: NVSL influenza virus propagation of :
• Viruses that are going into full genomic sequencing (16 viruses per month selected by NVSL based on multiple characteristics)
• Viruses identified by research, academic, or public health partners upon request.
• Impact: potential delay (2-4 weeks) in getting a virus that is not already grown out
11
Program efficiencies:Efficiencies under discussion:• Situation: Increase in NAHLN testing in 2015
• Goal: • Judicious use of funds while continuing to meet program
objectives and stakeholder needs
• Evaluation:• Input received from diagnostic laboratories• CEAH-SDA analysis of impact from reduction in CT cutoff
values • Presented to the NAHLN Technical Working Group in early July
- No concerns voiced
12
Program efficiencies:Proposed efficiencies:• Reminder:
• Only accessions meeting program case definition of pigs exhibiting ILI • Limit 10 samples/accession, no more than 5 OF samples / accession
• Suggestions proposed by diagnostic laboratories:• Implement a more targeted approach to sample selection• Adjustments in testing algorithm
• New CT cutoff values for further testing• Lung/Nasal CT < 30; OF CT <25
• For future consideration: discontinuation of the Matrix gene sequencing• The pandemic Matrix gene is the only Matrix gene found since Jan, 2015• NVSL can continue to monitor the Matrix gene through monthly WGS
13
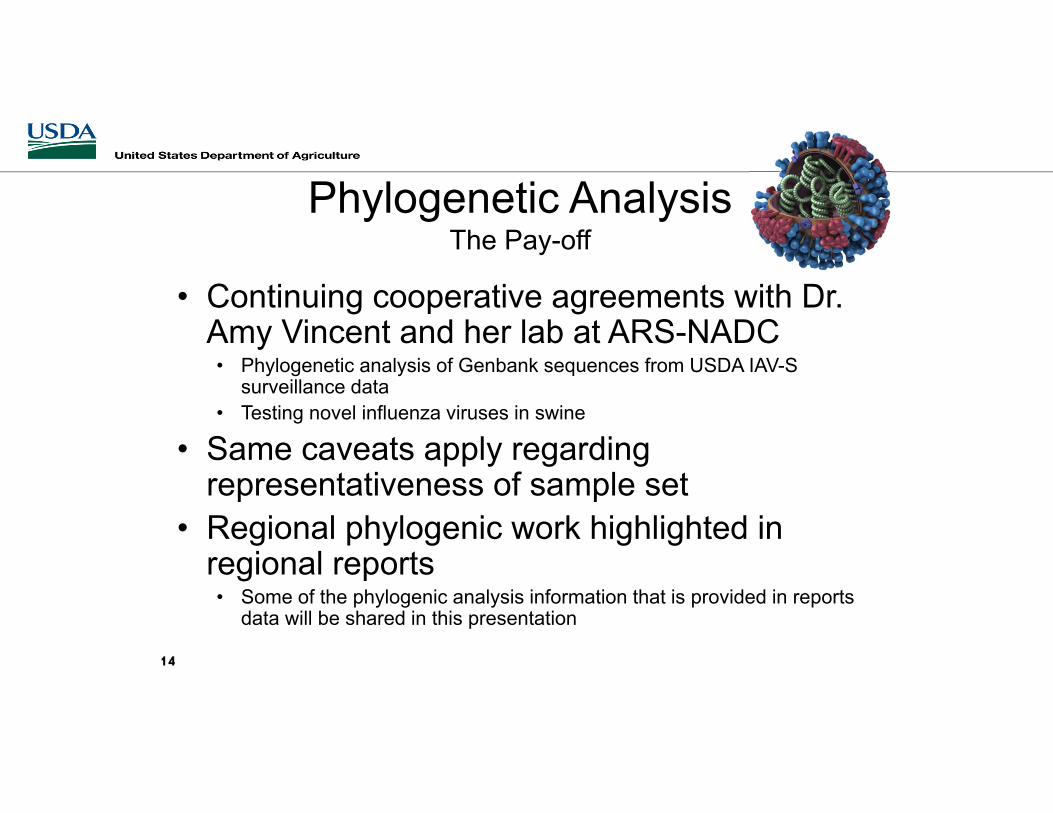
Phylogenetic AnalysisThe Pay-off
• Continuing cooperative agreements with Dr. Amy Vincent and her lab at ARS-NADC• Phylogenetic analysis of Genbank sequences from USDA IAV-S
surveillance data • Testing novel influenza viruses in swine
• Same caveats apply regarding representativeness of sample set
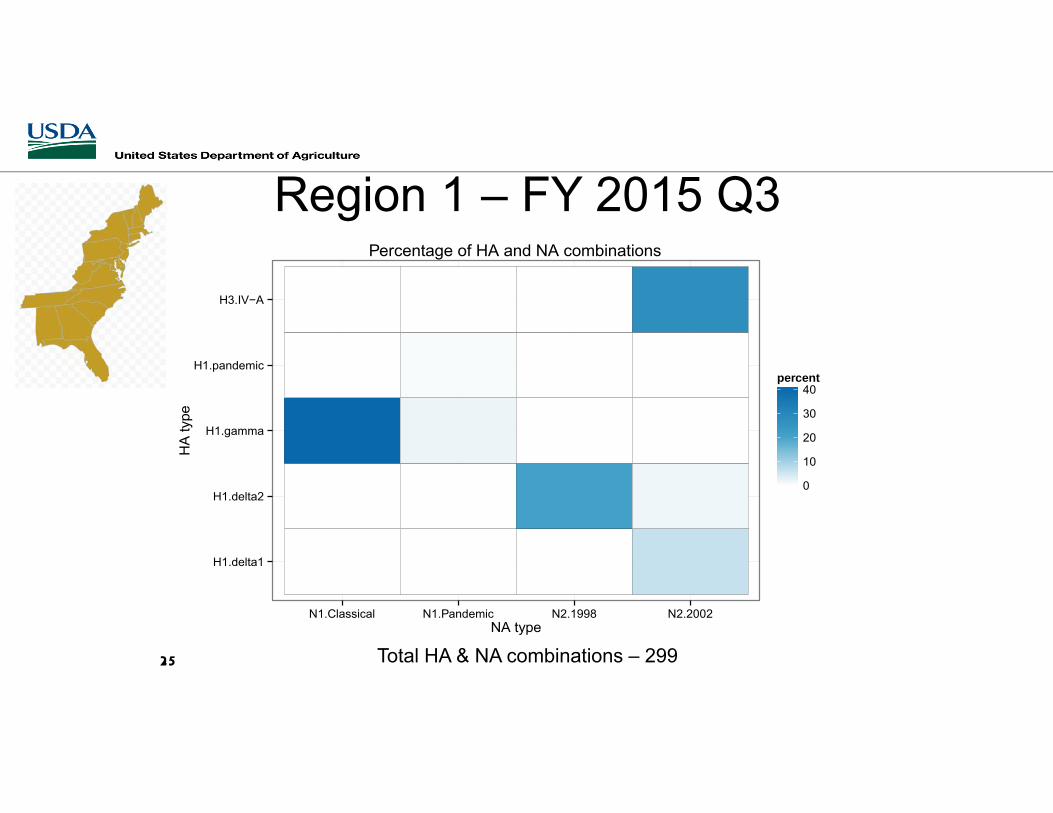
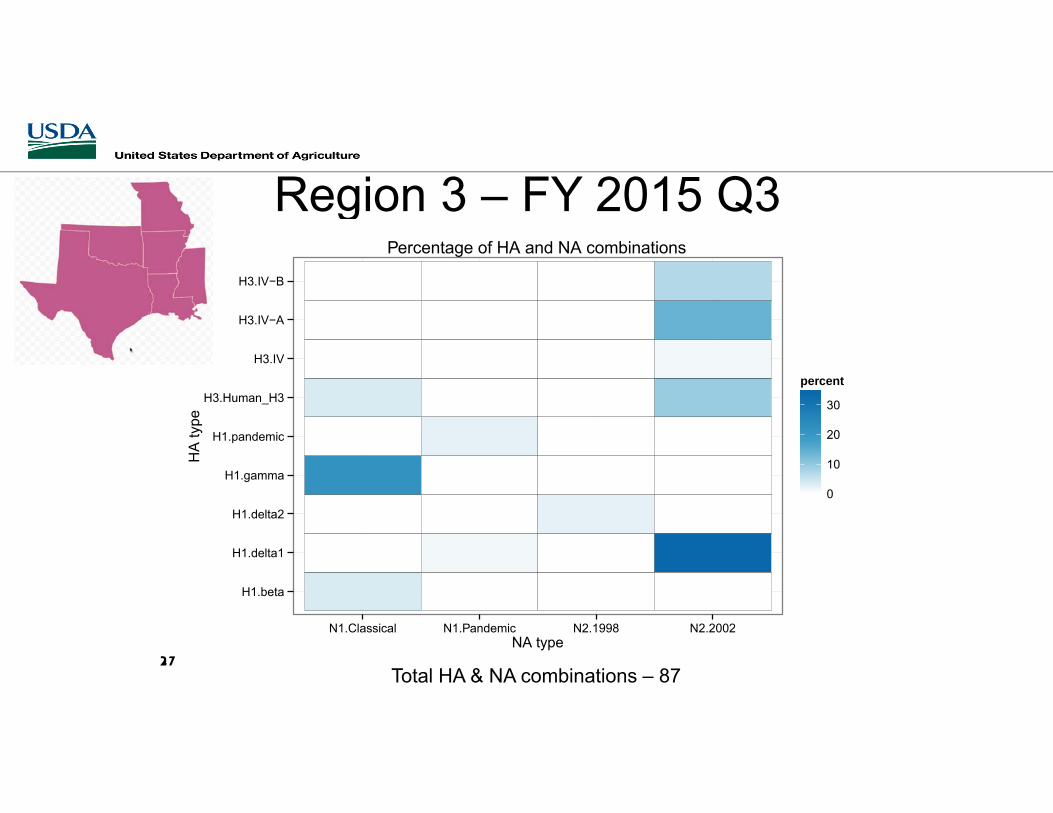
• Regional phylogenic work highlighted in regional reports• Some of the phylogenic analysis information that is provided in reports
data will be shared in this presentation
14
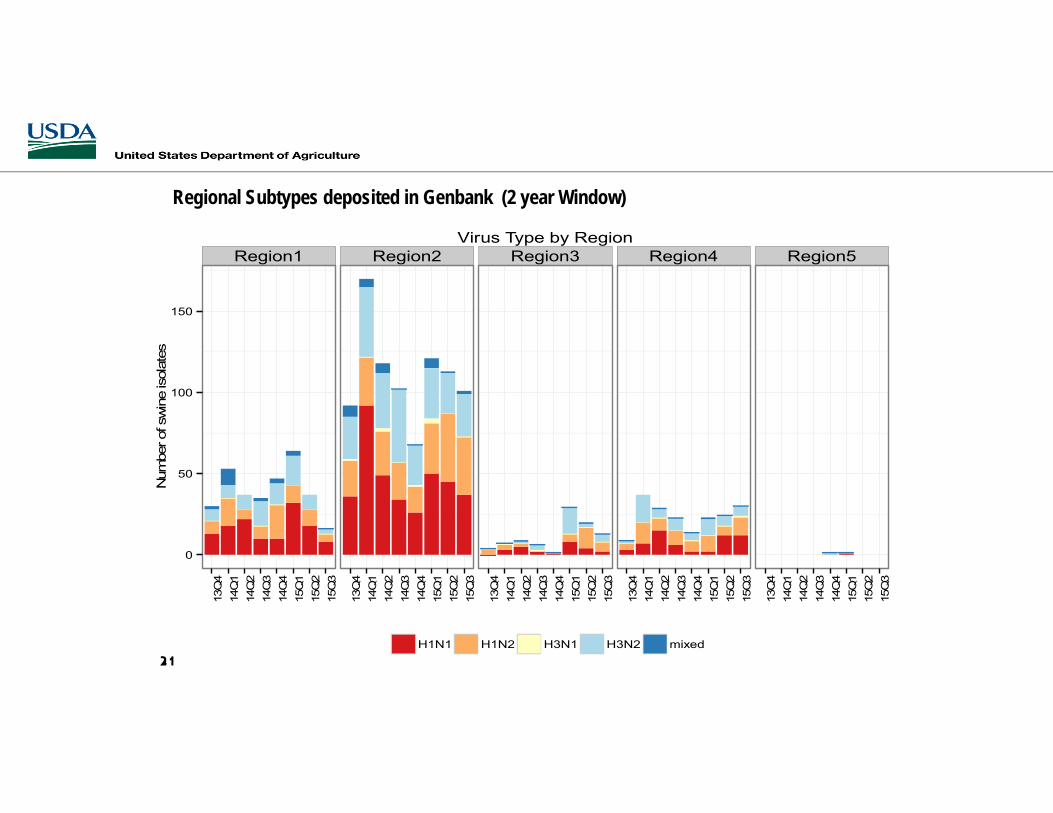
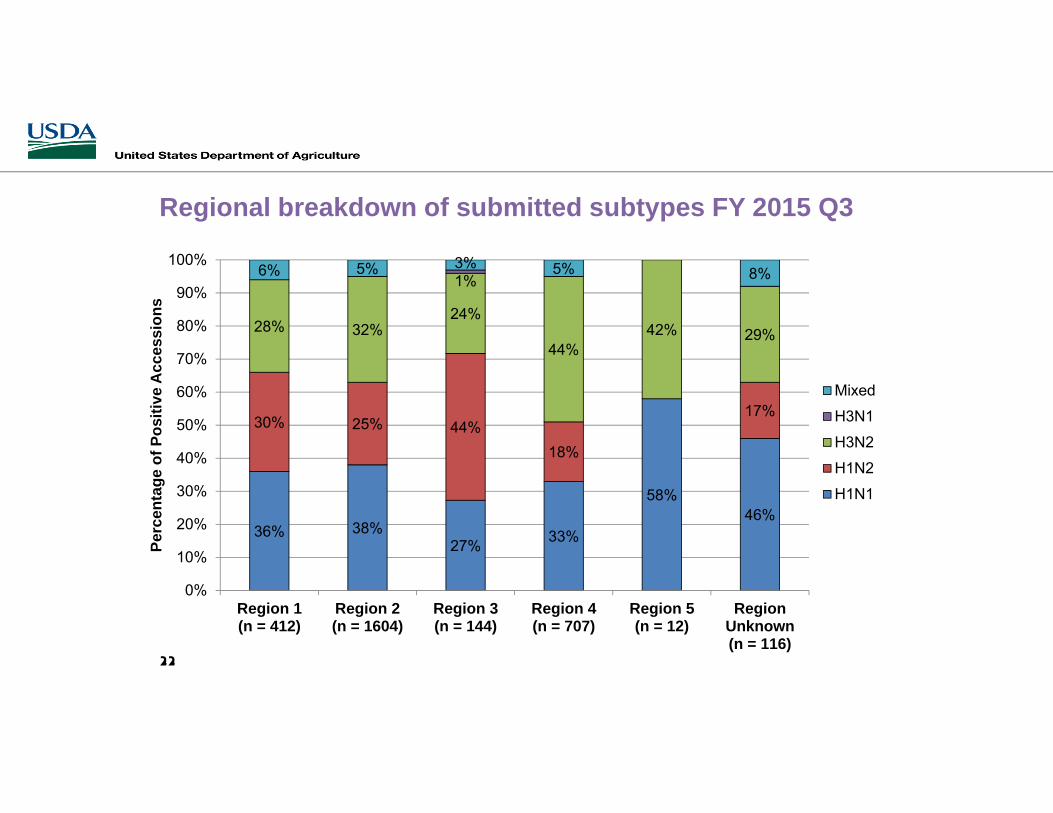
Regional breakdown
DATA15
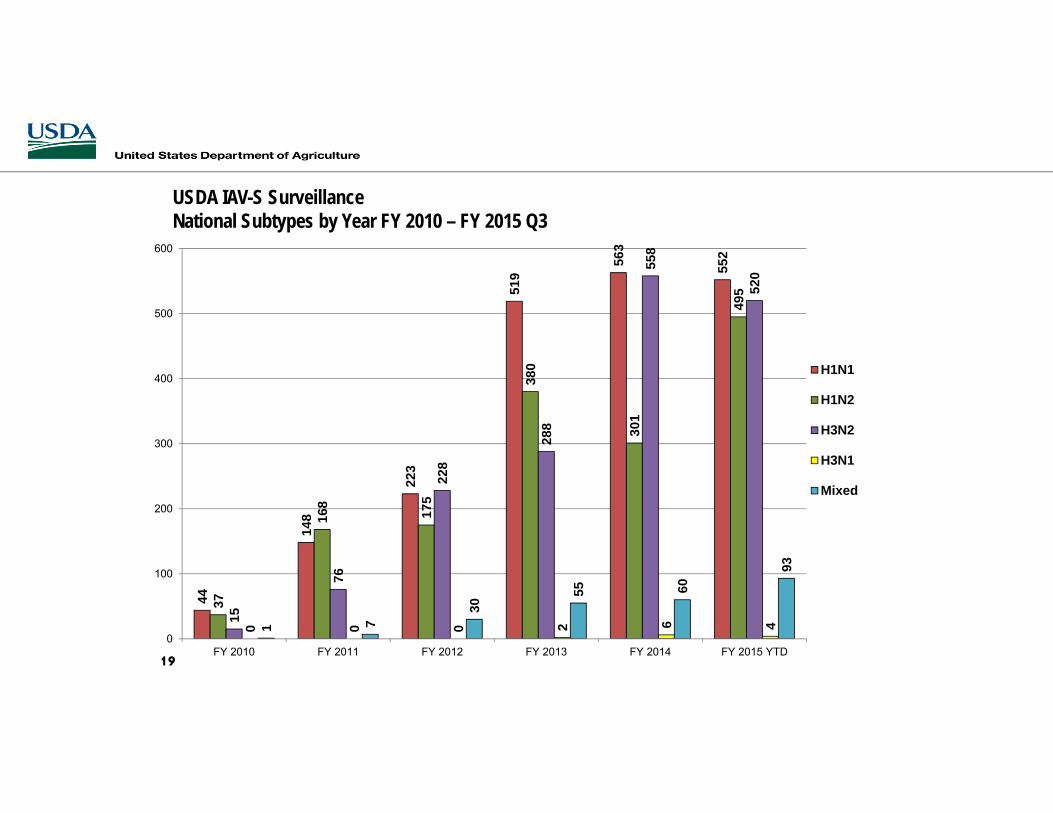
USDA IAV-S Surveillance National Program Isolation and Characterization Activities Oct. 2011 – July 2015
16
0
200
400
600
800
1000
1200Accessions Positive Accessions
Subtyped Accessions VI Positive Accessions
Linear (Accessions)85,559 Samples (not Graphed)24,040 Accessions8,748 Positive Accessions2,898 Accessions with viral isolates5,537 Accessions subtyped
USDA IAV-S Surveillance Regional Program Isolation and Characterization Activities Oct. 2011 – July 2015