2020 Kentucky Elk Hunter Survey 1 Image provided by 2020 Kentucky elk hunter Paul Zaretzke. Survey of 2020 Kentucky Elk Hunters Final Report Prepared by: Joe McDermott, Dan Crank, and John Hast, Kentucky Elk Program
Transcript
2020 Kentucky Elk Hunter Survey 1
Imag
e p
rovid
ed b
y 2
02
0 K
entu
cky e
lk h
un
ter
Pau
l Z
aret
zke.
Survey of 2020 Kentucky Elk Hunters
Final Report
Prepared by: Joe McDermott, Dan Crank, and John Hast, Kentucky Elk Program
2020 Kentucky Elk Hunter Survey 2
Purpose
The Kentucky Department of Fish and Wildlife Resources (KDFWR) surveyed all 2020 Kentucky elk
permit holders to better understand the opinions and experiences of Kentucky elk hunters. Beginning in
2018, permit holders (applicants selected for permits through the Kentucky elk hunt drawing and holders
of other elk permits such as landowner-cooperator elk permits, collectively called “elk hunters” or
“hunters” hereafter) have been required by law (301 KAR 2:132 Section 7 18(a)) to comply with the
postseason survey requirement. Elk hunters who fail to comply with this requirement are prohibited from
applying for KDFWR-administered quota hunts (i.e., elk, deer, waterfowl, sandhill crane, and upland
game) the following year.
Methods
The survey was provided to hunters in their MyProfile account. Elk hunters were reminded of this
requirement via mail and email correspondence from the Department before, during, and after the 2020
Kentucky elk season. Many of the 2020 survey questions are similar to those asked in previous surveys to
assess potential trends. The survey was administered through SurveyMonkey® and available for hunters
to take from September 15, 2020 – February 28, 2021 at midnight. The survey contained 35 questions
(included below in results) and took hunters an average of 16 minutes and 22 seconds to complete.
KDFWR received 410 responses from the 650 elk hunters, which meets the minimum sample size
threshold for statistical significance at a 95% confidence level.
Results: Responses to Survey Questions
Question 1. Please enter your 11-digit customer ID number to continue (found at the top of your
hunting license).
Answered: 407 Skipped: 3
The hunters’ customer ID numbers are not provided in this report to protect the privacy of each hunter.
Question 2. What is your last name?
Answered: 408 Skipped: 2
The hunters’ last names are not provided in this report to protect the privacy of each hunter.
Question 3. What year were you born?
Answered: 392 Skipped: 18
The average birth year of 2020 Kentucky elk hunters was 1979, so the average hunter age was 42.
2020 Kentucky Elk Hunter Survey 3
Question 4. What type of permit were you selected for?
Answered: 408 Skipped: 2
Table 1. Number of survey respondents by permit type and availability.
Permit Type Number of Respondents Available Permits
Bull Firearms Week 1 59 (79%) 75
Bull Firearms Week 2 43 (57%) 75
Cow Firearms Week 1 79 (65%) 122
Cow Firearms Week 2 80 (66%) 122
Either-sex Archery/ Crossbow 112 (64%) 175
Youth 16 (64%) 25
Other Permit* 15 (27%) 56
*Includes landowner-cooperator, voucher-cooperator, Commission, and elk restoration permits.
Scouting
Question 5. Did you make any trips to the elk zone to scout for elk before your hunt?
Answered: 408 Skipped: 2
The majority of respondents (57%) made at least one scouting trip prior to their elk hunt. Please see
Appendix A for a more thorough analysis of this question.
Question 6. How many days did you spend scouting?
Answered: 222 Skipped: 188
Of the 222 respondents, the average hunter made 3.5 trips to scout prior to their elk hunt (reported range
of 0 – 6+ trips). Sixteen percent (36) of respondents claimed to have made a single scouting trip prior to
their hunt, while 26% (58) of hunters claimed to have scouted for elk at least 6 times. Please see
Appendix A for a more thorough analysis of this question.
Question 7. Did you see any elk while scouting?
Answered: 222 Skipped: 188
Sixty percent (134) of respondents saw no elk while scouting prior to their hunt. Hunters that went
scouting and saw elk (88) were asked to provide the number of elk they observed by sex. Hunters
reported seeing more cows (841) than bulls (280) on their scouting trips, and the average hunter (that
made ≥1 scouting trip) reported 1.5 bulls and 4.8 cows seen while scouting. Please see Appendix A for a
more thorough analysis of this question.
2020 Kentucky Elk Hunter Survey 4
Question 8. About how much money for the following expenses did you or your group spend while
scouting for elk? (Please enter whole numbers with no dollar sign.)
Answered: 226 Skipped: 188
Table 2. Scouting trip expenses.
Expense Average Amount Spent Total Reported Spent
Gas $166 $35,249
Meals $111 $21,978
Lodging $137 $23,655
Equipment $343 $56,556
Other $89 $7,792
Of those that responded to the survey, the average 2020 Kentucky elk hunter and their helpers spent $846
scouting before their hunt. Total amount of money spent by survey respondents scouting before their elk
hunt was $145,230.
Hunting
Question 9. Did you go elk hunting in Kentucky during the 2020 season?
Answered: 408 Skipped: 2
The majority of survey respondents (91%) reported that they went elk hunting in 2020.
Question 10. How did you prepare for your elk hunt?
Figure 1. Elk hunt preparation method.
25
136
170
173
200
213
262
300
311
330
333
None of the above
Elk hunting books/ magazines
Called KDFWR employees
Online hunting forums
Elk hunting videos
Studied non-KDFWR website
Physically scouted for elk
Digital and/ or online papers maps
Talked with elk zone locals
Studied KDFWR website
Talked to prior elk hunters
# of Hunters
Pre
par
atio
n M
eth
od
2020 Kentucky Elk Hunter Survey 5
Question 11. Which of the following best explains why you didn’t elk hunt after being drawn?
The 38 hunters who did not go elk hunting (see question 9 above) were asked to provide a reason for why
they didn’t go. Hunters provided the following reasons for not hunting:
34% reported “other” and were asked to specify. The majority of these responses involved
COVID-19, but also included loss/lack of hunting property, lack of affordable guides/ outfitters,
death of family members, and selected for an undesirable area.
24% claimed work conflicts and/or obligations.
18% cited personal illness or illness of a family member.
13% reported family conflicts and/or obligations.
8% reported cost and/or financial obligations.
3% reported no reason for why they did not hunt.
Question 12. What area did you hunt?
Answered: 371 Skipped: 39
Table 3. Elk hunter distribution and response rate.
Unit Number of Respondents Available Quota Permits
2 61 94
3 88 140
4 88 134
5 38 74
6 60 94
7 36 58
Question 13. About how much money for the following expenses did you and your helpers spend
during or after your elk hunt? (Please enter whole numbers with no dollar sign.)
Answered: 346 Skipped: 64
Table 4. Kentucky elk hunt expenses.
Expense Average Amount Spent* Total Reported
Gas $183 $62,221
Meals $168 $52,965
Lodging $469 $92,837
Equipment $616 $184,202
Guide/ Outfitter $3,081 $437,590
Meat Processing $278 $38,590
Taxidermy $893 $100,490
Other $188 $16,340
2020 Kentucky Elk Hunter Survey 6
*Average money calculated from hunters who reported a value. For example, an “average amount spent”
on guiding fees or taxidermy would be misleading if hunters that did not utilize these services were
included.
Of those that responded to the survey, the average 2020 Kentucky elk hunter and their helpers spent
$5,876 during their hunt. Guide/ outfitter fees were the largest single expenditure, and when removed
from the sample, the average elk hunter and helpers spent $2,795. Total amount of money spent by all
survey respondents during their elk hunt was $985,235.
Question 14. Did you apply for a unit and/ or regulated area? (if no, why not)
Answered: 368 Skipped: 42
KDFWR conducts a secondary drawing for elk hunting units (EHU) and/or regulated areas (RA). During
this drawing, hunters were given the option of selecting up to 5 preferences for their EHU and/or RA. 344
(93%) hunters selected at least one preference, while 24 (7%) made no selections. Of those 24 hunters, 15
provided a reason for why they did not make any preferences. Their reasons for not applying in the
secondary drawing include: 53% didn’t have the option (i.e., purchased landowner permit), 27% said they
missed the deadline, and the remaining 23% indicated they had no preference, or that they wanted to hunt
public property.
Question 15. What helped you make your choice?
Answered: 322 Skipped: 64
Figure 2. Elk hunting unit and regulated area selection.
The majority of respondents that made an EHU and/or RA selection indicated that their guide/ outfitter
was the leading source of information to help select their preferences (30%), followed closely by local
30%
20%15%
9%
9%
7%
6%5%
Guide recommendation
Local knowledge or advice
Previous harvest statistics
Prior knowledge of hunting area
KDFWR personnel
Available public areas
Proximity to home
Other
2020 Kentucky Elk Hunter Survey 7
knowledge (20%), and previous harvest statistics (15%). Previous hunters’ or personal experience (9%),
advice from a KDFWR biologist (9%), and available public hunting areas (7%) were relatively equal in
value.
Question 16. Did you hire a guide/outfitter for your elk hunt?
Answered: 371 Skipped: 39
The majority (60%; n =222) of survey respondents reported they did not use a guide for their 2020 elk
hunt.
Question 17. How would you rate your guide experience?
Figure 3. Guide/outfitter satisfaction. Data from hunters who indicated they did not hire a guide/ outfitter
in Question 16 were excluded from this analysis.
The majority of hunters that hired a guide/outfitter (75%) expressed some level of satisfaction with the
service they received.
Question 18. How many different days did you spend elk hunting?
Answered: 370 Skipped: 40
Of the respondents who hunted after being drawn, the average 2020 Kentucky elk hunter spent 4.75 days
hunting elk (range: 1 - 21). Hunters that used a guide spent less time afield (4.4 days; range: 1–20) than
hunters who didn’t use a guide (5.0 days; range: 1–21). Total number of days spent afield hunting elk
amongst survey respondents in 2020 was 1,759 days. Please see Appendices A and B for a more thorough
analysis of this question.
60%15%
3%
5%
12%
5%
Very satisfied
Somewhat satisfied
Neither satisfied ordissatisfied
Somewhat dissatisfied
Very dissatisfied
Other
2020 Kentucky Elk Hunter Survey 8
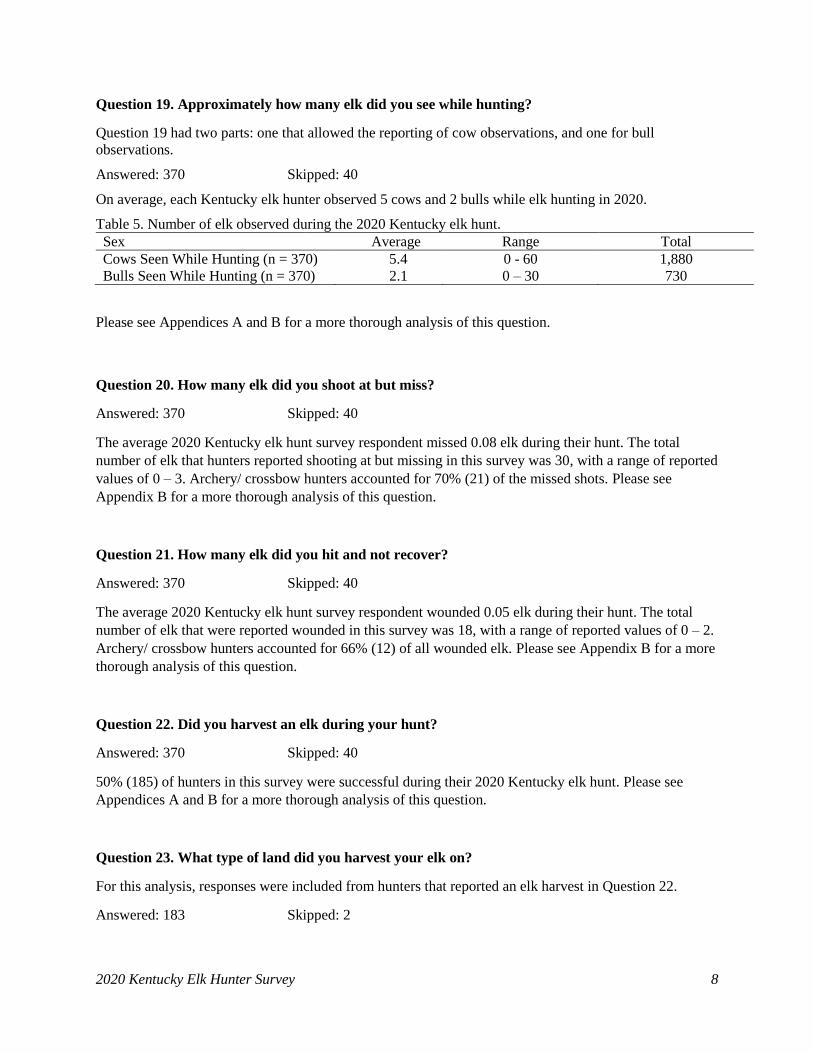
Question 19. Approximately how many elk did you see while hunting?
Question 19 had two parts: one that allowed the reporting of cow observations, and one for bull
observations.
Answered: 370 Skipped: 40
On average, each Kentucky elk hunter observed 5 cows and 2 bulls while elk hunting in 2020.
Table 5. Number of elk observed during the 2020 Kentucky elk hunt.
Sex Average Range Total
Cows Seen While Hunting (n = 370) 5.4 0 - 60 1,880
Bulls Seen While Hunting (n = 370) 2.1 0 – 30 730
Please see Appendices A and B for a more thorough analysis of this question.
Question 20. How many elk did you shoot at but miss?
Answered: 370 Skipped: 40
The average 2020 Kentucky elk hunt survey respondent missed 0.08 elk during their hunt. The total
number of elk that hunters reported shooting at but missing in this survey was 30, with a range of reported
values of 0 – 3. Archery/ crossbow hunters accounted for 70% (21) of the missed shots. Please see
Appendix B for a more thorough analysis of this question.
Question 21. How many elk did you hit and not recover?
Answered: 370 Skipped: 40
The average 2020 Kentucky elk hunt survey respondent wounded 0.05 elk during their hunt. The total
number of elk that were reported wounded in this survey was 18, with a range of reported values of 0 – 2.
Archery/ crossbow hunters accounted for 66% (12) of all wounded elk. Please see Appendix B for a more
thorough analysis of this question.
Question 22. Did you harvest an elk during your hunt?
Answered: 370 Skipped: 40
50% (185) of hunters in this survey were successful during their 2020 Kentucky elk hunt. Please see
Appendices A and B for a more thorough analysis of this question.
Question 23. What type of land did you harvest your elk on?
For this analysis, responses were included from hunters that reported an elk harvest in Question 22.
Answered: 183 Skipped: 2
2020 Kentucky Elk Hunter Survey 9
Figure 4. Elk Harvest by Property Type.
Slightly more than half of all successful hunters in this survey (57%; n=104) harvested their elk on private
property. More guided hunters (n=57) harvested their elk on private property than unguided hunters
(n=47), but Regulated Areas and open access Wildlife Management Areas and/or Hunting Access Areas
appear to be more important to unguided hunters. This is an important distinction, as private individuals
or entities own the majority of the elk management zone.
Question 24. What habitat type was your elk in when you harvested it?
For this analysis, responses were only considered from hunters that reported an elk harvest in Question
22.
Answered: 184 Skipped: 1
Figure 5. Elk Harvest by Habitat Type.
57
18
12
47
22
27
0
10
20
30
40
50
60
Private Land Regulated Area Open WMA/ HAA
# o
f H
un
ters
Guided Unguided
2020 Kentucky Elk Hunter Survey 10
Question 25. How did you get your elk out of the field?
For this analysis, responses were only considered from hunters that reported an elk harvest in Question
22.
Answered: 186 Skipped: 0
Table 6. Game Retrieval Method.
Game Retrieval Method Percent of Hunters
Whole directly into truck 36%
Whole directly into ATV/ UTV 36%
In parts packed out with backpacks 12%
In parts by ATV/ UTV 10%
Other* 7% *The responses within this category included in parts by truck, hunters who recovered their elk multiple days after
shooting it (i.e., found the elk they shot decomposing, removed head), whole onto a trailer, and using tractors.
The majority of survey respondents who harvested an elk (72%) indicated they were able to get their elk
out of the field whole with either a truck or ATV/UTV.
Question 26. Thinking back over your entire elk hunt, how satisfied were you with your elk hunt
overall?
Answered: 370 Skipped: 40
Figure 6. 2020 Kentucky Elk Hunter Satisfaction.
34%
15%
28%
23%
Edge of 2 or more habitattypes
Forest interior
Thicket/ shrubby cover
Open mineland/ grassland
2020 Kentucky Elk Hunter Survey 11
Slightly more survey respondents (49%; n=181) expressed some level of satisfaction with their 2020 elk
hunt than those who expressed some level of dissatisfaction (45%; n=165). As seen in the figure above,
there is a positive correlation between a hunter’s level of satisfaction and whether or not they harvested an
elk. Please see Appendix C for an expanded analysis of this question.
Question 27. If you were selected for a regulated area, did you hunt on the regulated area you had
access to?
Answered: 196 Skipped: 214
Sixty seven percent of hunters that gained access to an RA, either in the initial or “leftover draw”,
indicated they hunted the property.
Hunters that answered “no” to Question 27 (n=64) were asked to provide the reason they chose not to
hunt the RA they were selected for.
Answered: 36 Skipped: 28
Of the 43 hunters that did not hunt the RA they were selected for:
31% said they had access to private property.
25% reported little-to-no elk sign on the property or elk at lower densities.
16% were classified as “other” (i.e., did not fit into an established/ common category).
16% claimed their guide/ outfitter did not want to go there or had other areas for them to hunt.
13% preferred to hunt public property.
9% said online maps provided by KDFWR were insufficient, that properties were difficult to
locate.
30
15
2
28
110
64
56
22
34
9
0 20 40 60 80 100 120
Very dissatisfied
Somewhat dissatisfied
Neither dissatisfied or satisfied
Somewhat satisfied
Very Satisfied
# of Hunters
Stai
sfac
tio
n L
evel
No Harvest Harvest
2020 Kentucky Elk Hunter Survey 12
Question 28. How many days did you hunt and scout on the regulated area?
Only data from hunters that responded to Question 27 were used in this analysis. Two responses from
hunters that answered “No” and one “Yes” to Question 27 were omitted due to conflicting information.
Answered: 193 Skipped: 217
Table 7. Hunter Effort on Regulated Areas.
Number of Days Scouting and
Hunting
Did not Hunt the RA (n = 62) Did Hunt the RA (n = 131)
1 18 23
2 – 5 5 66
6 – 10 2 33
11+ 1 8
Blank* 36 1
50% of respondents who hunted an RA spent between 2–5 days scouting and hunting the property. Of
those who answered the question, it appears that the majority (69%) of hunters that did not hunt their
drawn RA only spent 1 day scouting the property.
Question 29. Approximately how many total elk did you see on the regulated area while hunting
and scouting?
Only data from hunters that responded to Question 27 were used in this analysis. Two responses from
hunters that answered “No” and one “Yes” to Question 27 were omitted due to conflicting information.
Answered: 193 Skipped: 217
Table 8. Number of Elk Observed while Scouting and Hunting on Regulated Areas.
Number of Elk Seen Hunting
and/or Scouting
Did not Hunt the RA (n = 62) Did Hunt the RA (n = 131)
0 35 46
1 – 10 3 70
11 – 20 0 0
21 – 30 2 11
31 - 40 0 0
41 – 50 0 3
50+ 0 1
Blank* 22 0
53% of respondents that hunted an RA observed between 1–10 elk on the property in 2020.
Question 30. Did you harvest an elk on the selected regulated area?
Only data from hunters that responded “Yes” to Question 27 were used in this analysis. One response was
omitted for conflicting information.
2020 Kentucky Elk Hunter Survey 13
Answered: 129 Skipped: 2
42% of respondents that hunted an RA reported they were successful on their 2020 elk hunt.
Question 31. How can KDFWR improve the regulated area program?
This was an open response question where respondents were given the opportunity to comment on the RA
program. Although not every hunter had the opportunity to physically hunt and/or scout an RA, answers
from all survey respondents were examined to get a better understanding of consumer satisfaction and
understanding of the RA program.
Answered: 367 Skipped: 43
When asked how KDFWR can improve the RA program, survey respondents shared the following
answers:
27% had no comments or suggestions for ways to improve the RA program.
14% asked for properties with more elk on them.
13% provided a response unrelated to the RA program.
12% wanted more hunting areas (including more hunters allowed on individual properties and for
KDFWR to acquire more property to hunt).
11% requested better maps, marked boundaries, or access point information.
6% asked for more information and/or data, including communication between KDFWR and
hunters.
5% wanted to reduce other uses on the property (i.e., ATVs, other hunting, landowner conflicts,
better enforcement of non-RA hunters, etc.).
4% wanted to prohibit guiding on RAs and/or public property.
3% indicated they like the RA program “as is.”
3% asked for better habitat management on RAs.
2% suggested better field observations or abundance estimates for elk on the property.
1% requested an earlier date for the secondary drawing to allow for more scouting time.
Question 32. Which of the following types of lands did you elk hunt on?
Answered: 366 Skipped: 43
Figure 7. Elk Hunting by Land Ownership.
2020 Kentucky Elk Hunter Survey 14
Survey respondents reported using all available land ownership types at about the same rate in 2020.
Question 33. Have you ever hunted elk before your Kentucky elk hunt?
Answered: 408 Skipped: 2
75% of survey respondents indicated they had never hunted elk prior to the 2020 Kentucky elk season.
Figure 8. Elk Harvest by Prior Elk Hunting Experience.
Only hunters that responded “Yes” to Question 9 were included in the analysis for the above figure.
Slightly more hunters that had been on at least one elk hunt (n=50) killed an elk than those who did not
(n=43). There were at least 136 hunters who harvested their first elk during the 2020 Kentucky elk hunt.
Question 34. Have you ever hunted, or been a part of an elk hunt in Kentucky before?
36%
34%
30%
Both private and public lands
Private land only (includingRAs)
Public land only
50
43
136
141
0 20 40 60 80 100 120 140 160
Harvested an Elk
Did not Harvest an Elk
# of Hunters
Res
ult
of
the
Hu
nt
No Elk Hunting Experience At least 1 Elk Hunt
2020 Kentucky Elk Hunter Survey 15
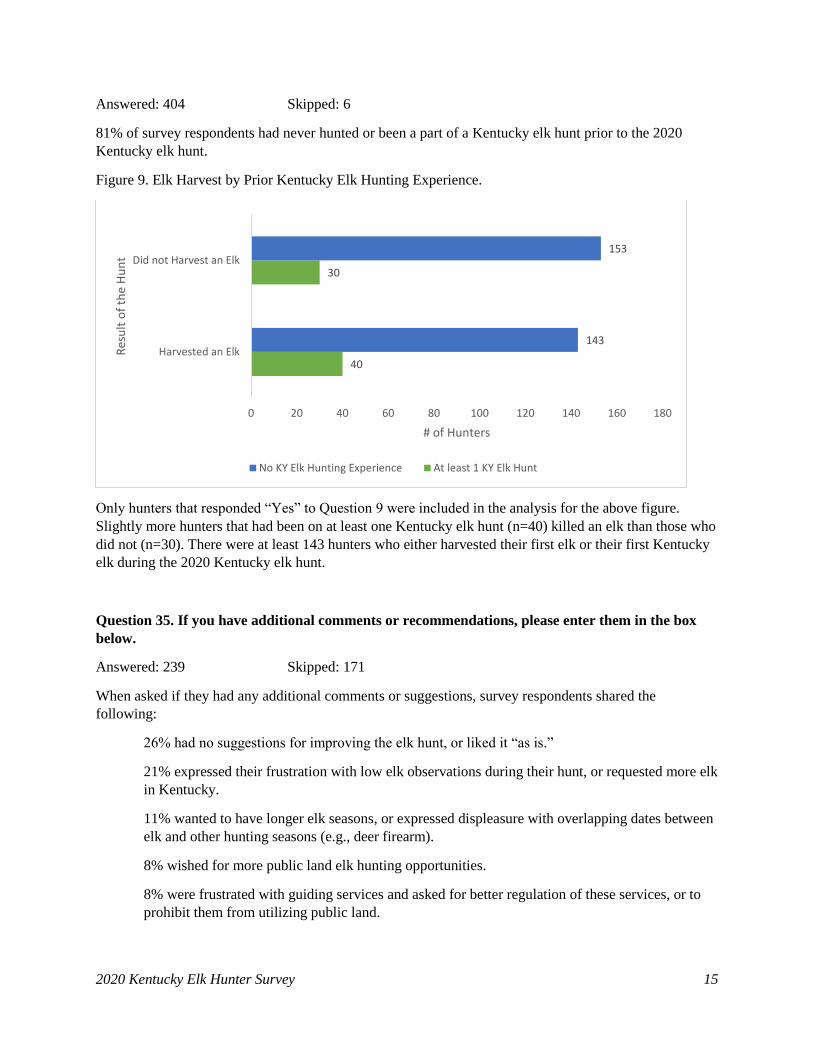
Answered: 404 Skipped: 6
81% of survey respondents had never hunted or been a part of a Kentucky elk hunt prior to the 2020
Kentucky elk hunt.
Figure 9. Elk Harvest by Prior Kentucky Elk Hunting Experience.
Only hunters that responded “Yes” to Question 9 were included in the analysis for the above figure.
Slightly more hunters that had been on at least one Kentucky elk hunt (n=40) killed an elk than those who
did not (n=30). There were at least 143 hunters who either harvested their first elk or their first Kentucky
elk during the 2020 Kentucky elk hunt.
Question 35. If you have additional comments or recommendations, please enter them in the box
below.
Answered: 239 Skipped: 171
When asked if they had any additional comments or suggestions, survey respondents shared the
following:
26% had no suggestions for improving the elk hunt, or liked it “as is.”
21% expressed their frustration with low elk observations during their hunt, or requested more elk
in Kentucky.
11% wanted to have longer elk seasons, or expressed displeasure with overlapping dates between
elk and other hunting seasons (e.g., deer firearm).
8% wished for more public land elk hunting opportunities.
8% were frustrated with guiding services and asked for better regulation of these services, or to
prohibit them from utilizing public land.
40
30
143
153
0 20 40 60 80 100 120 140 160 180
Harvested an Elk
Did not Harvest an Elk
# of Hunters
Res
ult
of
the
Hu
nt
No KY Elk Hunting Experience At least 1 KY Elk Hunt
2020 Kentucky Elk Hunter Survey 16
8% expressed the desire to close elk season for several years in one way or another (mainly
including cow hunting, but some advocated for the closure of all elk hunting in Kentucky).
7% wanted more law enforcement to stop poaching and prevent illegal uses of properties.
6% requested better communication between elk hunters and KDFWR personnel, including
general correspondence, updated information regarding elk movements, and also in-person or
virtual courses on Kentucky elk hunting.
5% suggested KDFWR do away with the EHU system, and/or provide a better avenue for locals
to hunt in the unit they live in.
5% asked for the ability to defer their permits, or be drawn again without a waiting period
(particularly if the hunt was unsuccessful). The novel coronavirus pandemic affected numerous
hunters in 2020.
5% of responses were classified as “other” as there was no common theme with other responses.
5% requested better mapping of properties or access points.
4% want KDFWR to stop trapping and translocating elk.
4% suggested the need for better habitat including removal of feral livestock.
2020 Kentucky Elk Hunter Survey 17
Appendix A. Summary results for 2020 Kentucky elk hunt “do it yourself” survey respondents.
Permit Scout? Days
Scouted
Elk Observed Scouting Days
Hunted
Elk Observed Hunting Harvest %
Cows Bulls Cows Bulls
Bull Week 1 No (n=3) 3.3 1.7 5.0 33%
Yes (n=21) 3.6 2.4 1.1 3.5 3.3 1.7 57%
Bull Week 2 No (n=3) 2.3 10.5 2.7 100%
Yes (n=20) 3.8 3.4 2.1 3.5 2.0 0.8 40%
Archery No (n=7) 8.4 5.7 1.4 43%
Yes (n=49) 4.0 3.6 1.4 8.9 6.3 2.5 39%
Cow Week 1 No (n=16) 3.4 3.5 0.9 38%
Yes (n=35) 3.1 2.0 0.7 3.9 2.5 1.5 29%
Cow Week 2 No (n=9) 2.8 6.4 0.7 44%
Yes (n=39) 2.9 5.1 1.7 3.5 6.3 2.5 44%
Youth No (n=1) 4.0 5.0 5.0 100%
Yes (n=9) 3.4 13.3 0.9 6.8 4.2 1.3 66%
Other Permit No (n=2) 3.5 9.5 3.0 50%
Yes (n=7) 5.1 10.7 3.3 3.7 7.6 2.0 86%
Data used in these analyses were derived from survey questions 5 – 7, 9, 16, 18 – 19, and 22. Only respondents that answered questions 5, 9, and
16 were included in this dataset to narrow the dataset to hunters who went “do it yourself.” Data are provided for reference only. Elk Program staff
receive numerous requests regarding the necessity for a guide and/or the ability to be successful as a “do it yourself” hunter. Although
confounding variables (e.g., did hunters that failed to scout have local or prior knowledge of an area, etc.) and low sample sizes likely effect the
above results, it is clear that “do it yourself” hunters are successful at a relatively even rate regardless of whether or not they scouted prior to their
hunt. It is also generally true that hunters who made one or more scouting trips prior to hunting saw more elk when hunting than scouting.
2020 Kentucky Elk Hunter Survey 18
Appendix B. Summary results for 2020 Kentucky elk hunt survey respondents.
Data used in these analyses were derived from survey questions 9, 16, and 18 – 22. Only respondents that answered questions 9 and 16 were
included in this dataset to allow for comparisons between guided and unguided hunters that went afield. Data are provided for reference only. Elk
Program staff receive numerous requests regarding the necessity for a guide and/or the ability to be successful as a “do it yourself” hunter.
Permit Type Guide? Days Hunted Elk Observed Elk Missed Elk Wounded Harvest


![UNDERSTANDING THE NEEDS AND EXPERIENCES OF HUNTERS [DIAMOND CREEK … · 2019-05-28 · ELK HUNTING IN IDAHO: UNDERSTANDING THE NEEDS AND EXPERIENCES OF HUNTERS [DIAMOND CREEK ZONE]](https://static.documents.pub/doc/80x56/5f12950f46d0d6205e16912e/understanding-the-needs-and-experiences-of-hunters-diamond-creek-2019-05-28-elk.jpg)


