Page 1
Survey of the 2018-2019 Season Elk Hunters
Survey Purpose and Methods
KDFWR staff provided a survey to 2018-19 season elk hunters to better understand the opinions
and experiences of the hunters. The 2018-19 survey replicated many of the survey questions
administered to elk hunters from years prior to provide insights into potential trends in hunter
experiences. In 2018, a requirement was made for all elk hunters to complete a post season hunt
survey (301 KAR 2:132 Section 7 18(a)). Previously, the post season survey was voluntary. Hunters
were notified of this regulation change via email and within the permit letter they received in the
mail. A link to the survey was emailed to each permit holder and provided in their MyProfile. The
survey was designed using SurveyMonkey®. Elk hunters that did not complete the survey will be
blacklisted from applying to all KDFWR administered quota hunts (waterfowl, deer, Sandhill crane,
and upland game) for one year.
There were 781 hunter allocated elk permits and 490 (63%) responded to the required survey.
The survey contained 32 questions, and it took an average of 14 minutes for each hunter to
complete. All of the questions are listed in this summary report. The number of hunters who
answered each question is listed immediately following each question. Summary statistics were
derived for each question where appropriate. The number of respondents (i.e., sample size) to this
survey exceeds the minimum threshold for statistical significance at a 95% confidence level.
Responses to Survey Questions
Q1: Please enter your 11 digit customer ID number to continue (found at the top of your
hunting license).
Answered: 490 Skipped: 0
The hunters’ customer identification numbers are not provided in this report to protect the privacy
of each hunter.
Q2: What type of permit were you selected for?
Answered: 490 Skipped: 0
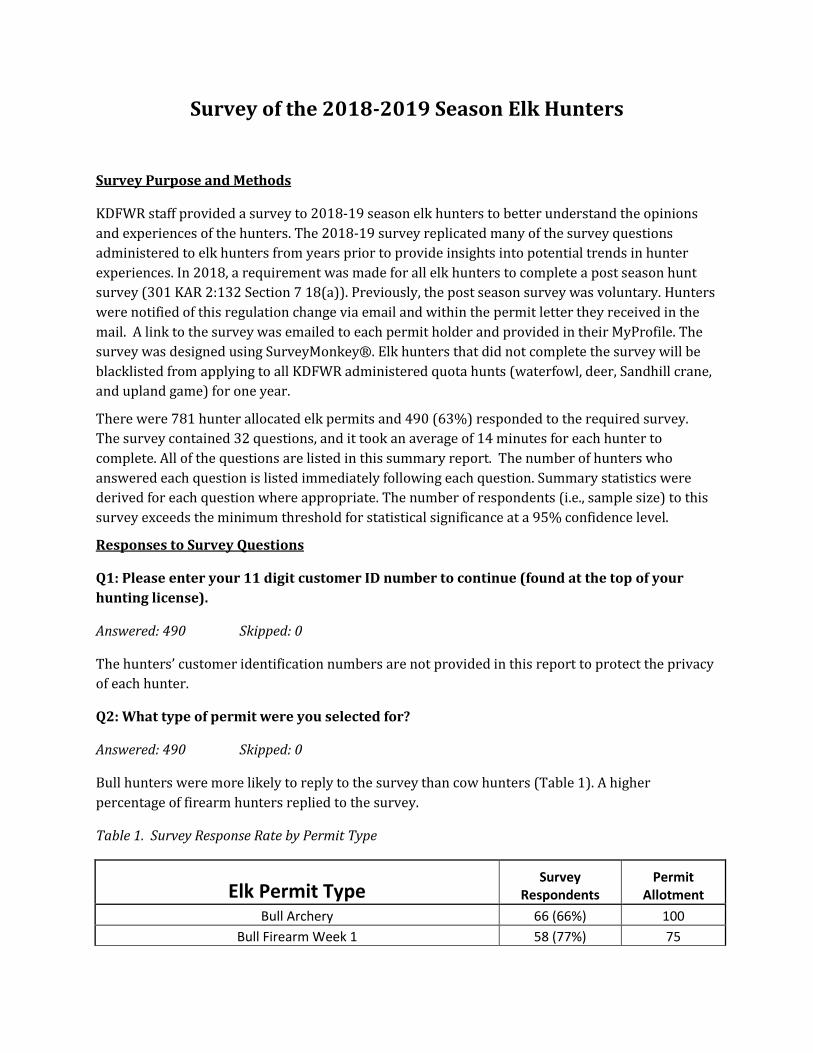
Bull hunters were more likely to reply to the survey than cow hunters (Table 1). A higher
percentage of firearm hunters replied to the survey.
Table 1. Survey Response Rate by Permit Type
Elk Permit Type Survey
Respondents Permit
Allotment
Bull Archery 66 (66%) 100
Bull Firearm Week 1 58 (77%) 75
Page 2
Bull Firearm Week 2 51 (68%) 75
Cow Archery 88 (55%) 160
Cow Firearm Week 1 96 (66%) 145
Cow Firearm Week 2 87 (60%) 145
Youth Only Permit 5 (50%) 10
Late Season Antlerless Permit 1 (25%) 4
Landowner Permit (included landowner, voucher and elk restoration permit holders) 33 (58%) 57
Commission Permit 5 (50%) 10
Total 490 781
Scouting Results
Q3: Did you make any trips to the elk zone to scout for elk before your hunt?
Answered: 490 Skipped: 0
Q4: How many days did you spend scouting?
Answered: 256 Skipped: 17
Q5: Did you see any elk while scouting?
Answered: 270 Skipped: 3
Q6: About how much money for the following expenses did you or your group spend while
scouting for elk?
Answered: 265 Skipped: 8
Scouting Summary
Approximately half (56%) of all hunters spent a total of 846 days scouting prior to the hunt. Each
hunter spent an average of 3.1 days scouting prior to their hunt. Of the hunters that scouted, 44%
did not see elk and 56% did see elk. Sixty four percent of hunters that did not scout hired a
guide/outfitter. Of the hunters that saw elk while scouting, 122 (80%) did not hire a
guide/outfitter and 31 (20%) did hire a guide/outfitter. By comparison, of the hunters that did not
see elk while scouting, 76 (64%) did not hire a guide/outfitter and 42 (36%) did hire a guide. It is
commonly understood that scouting prior to a hunt will increase a hunters odds of harvesting their
quarry. However, scouting had no statistically significant effect on whether a hunter harvested an
elk or not. Hunters that hired a guide were removed from this analysis.
Hunters (n=273) and their group members spent a total of $190,785 for scouting expenses. The
average amount of money spent per hunter and their group members was $701 (minimum $0 and
maximum $18,450). The majority of the money ($84,337) was spent on buying equipment with the
Table 1 (continued)
Page 3
average of $310 spent per hunter and their group members. Table 2 displays the total amount of
money spent and average money spent per hunter for gasoline, meals, lodging, equipment, and
other expenses.
Table 2. Expenditure Summary for Scouting
Expense Type Total
Average per hunter
Gas $45,136 $166
Meals $25,836 $95
Lodging $26,023 $96
Equipment $84,337 $310
Other $9,453 $35
Total $190,785 $701
Participation Results
Q7: Did you go elk hunting in Kentucky during the 2018 season?
Answered: 490 Skipped: 0
Q8: Which of the following best explains why you didn’t elk hunt after being drawn?
Answered: 33 Skipped: 0
Participation Summary
The majority (93%) of permit holders that responded to this survey went elk hunting. Only 33 of
the 490 respondents did not hunt. Seven permit holders said they did not hunt due to a work
conflict/obligation. Fifteen identified their reason for not hunting was a family conflict/obligation
or an illness (self or family). One permit holder did not hunt due to weather. Five permit holders did
not hunt due to lack of elk sign found while scouting and/or they did not draw the Limited Entry
Area or Voucher area they wanted. Five permit holders did not hunt elk because their
guide/outfitter did not show up, or the guide took their down payment and disappeared, or a guide
told the hunter not to bother spending the money, or guides were too expensive/not available.
Hunt Area Results
Q9: What area did you hunt?
Answered: 453 Skipped: 0
Q10: Why did you not apply for a Limited Entry Area (LEA)?
Answered: 201 Skipped: 8
Page 4
Q10: Why did you apply for a Limited Entry Area (LEA)?
Answered: 104 Skipped: 8
Hunt Area Summary
Table 3 displays the number of respondents that hunted in each area with the majority of people
(n=313) hunting in the At-Large area followed by the Hazard (n=51) and Straight Creek (n=45)
Limited Entry Areas (here after LEA). Four hunters were drawn in 2018 for the late season hunt.
The late season hunt was designed to remove elk in two Elk Management Units (here after EMU;
Knott County and Mayking) where elk damage has been a concern over a number of years. One
hunter who was allocated a late season hunt permit responded to the survey; however, the hunter
did not report the name of the EMU where they hunted.
Table 3. Hunters per Hunt Area
Hunt Area
Survey Respondent
Hunters
Area Permit
Allotment
At-Large 313 540
Hazard LEA 51 72
Prestonsburg LEA 12 12
Tug Fork LEA 15 17
Middlesboro LEA 8 10
Straight Creek LEA 45 59
Below is a list of responses submitted by hunters that answered “Why did you not apply for an
LEA?” Comments were compiled as best as possible into categories/themes. Only
categories/themes that were listed in five or more comments are reported below, though all
comments were reviewed and considered by KDFWR elk biologists. Also, only comments related to
the question were reported. The total number of comments for this section using the above criteria
was 283.
76 (27%) respondents said they did apply for a LEA permit and 22 (8%) hunters put
“not applicable” as their answer, which we assumed most of those responses mean
the hunter did apply for a LEA and thought the question did not apply to them
59 (21%) respondents replied that they had a place to hunt outside of the LEA areas
including private and public lands; in addition, hunters tended to hunt areas where
they already knew the lay of the land
42 (15%) responses came in from hunters that did not understand how to apply for
a LEA permit, know much about LEA areas, or know the LEA option existed
Page 5
21 (7%) comments were made saying guides recommended the hunter not apply for
a LEA
20 (7%) hunters said they did not want to be restricted to one area and liked the
flexibility the At-large permit allowed
16 (6%) hunters forgot to apply for a LEA permit and an additional 7 (2%) hunters
said they were too busy to scout and/or apply
14 (5%) respondents said they simply had no desire to apply for a LEA and provided
not specific reason why not
6 (2%) hunters did not apply because they thought the odds of getting a LEA were
too low
Below is a list of responses by hunters that answered “Why did you apply for an LEA?” Comments
were compiled as best as possible into categories/themes. Only categories/themes that were listed
in five or more comments are reported below, though all comments were review and considered by
KDFWR elk biologists. Also, only comments related to the question were reported. The total
number of comments for this section using the above criteria was 280.
32 (11%) respondents said they did not apply for a LEA permit and 41 (15%)
hunters put “not applicable” as their answer, which we assumed most of those
responses mean the hunter did not apply for a LEA and thought the question did not
apply to them
44 (16%) hunters said a guide/outfitter suggested they apply for a LEA
41 (15%) respondents said they applied to a LEA because there were more elk in
the LEA than At-Large areas and success rates would be higher
31 (11%) comments were submitted saying LEAs were just generally better all
around
24 (9%) specifically mentioned that LEAs would have less hunting pressure from
other hunters
21 (8%) hunters said they applied to a LEA because they had prior knowledge of the
area and 8 (3%) said the LEA they applied for was close to home
13 (5%) of the comments that were submitted explained that the hunter thought
the LEA gave them a specific place to go and good access to lands with elk
12 (4%) hunters said they chose to apply to a LEA because someone suggested they
do so
7 (3%) hunters applied to the LEA because of the public land access and 6 (2%)
hunters applied because of access on private lands they owned or someone they
knew owned land where the hunter was allowed to access
Expenditure Results
Q12: About how much money for the following expenses did you and your helpers spend
during or after your elk hunt?
Answered: 440 Skipped: 13
Page 6
Expenditure Summary
Of the 440 respondents, 433 reported spending some money for their hunt. The total amount of
money spent was $1,076,857 with an average of $2,356 per hunter and their helpers. The estimated
minimum economic impact to Kentucky would be approximately $2,196,788. The leading expense
was for a guide/outfitter ($459,025) followed by equipment purchases ($146,755) and then
taxidermy costs ($101,345). There were 186 (42%) hunters that reported paying for a
guide/outfitter service. The type of service was not provided. Guides/outfitters provide anything
from paid for advice and drop off hunts to full service lodging, guided hunts, and meat processing.
The average price paid for a guide/outfitter service was $2,468. The minimum and maximum
amount spent for a guide/outfitter service was $100 and $12,000, respectively. Not including the
guide/outfitter service fees, the guided hunters spent on average $1834 (minimum $90 and
maximum $17150). Do-it-yourself (i.e., did not pay a guide/outfitter service) hunters spent an
average $1,047 for their hunt. The minimum reported expenditure for a do-it-yourself hunt was
$40 and the maximum was $4,850. Table 4 shows the total, average, minimum, and the maximum
amount of money spent for all expenditure types and the count of how many hunters reported
spending money on each expenditure type.
Table 4. Hunt Expenditure Summary
Expenditure Types
Gas Meals Lodging Equipment Guide/Outfitter
Service
Meat Processing
* Taxidermy
** Other Grand Total
Total $92,036 $67,594 $98,543 $146,690 $459,025 $59,716 $101,345 $51,843 $1,076,792
Ave. $207 $164 $418 $524 $2,468 $269 $729 $943 $5,721
Max. $1,500 $1,500 $2,500 $5,000 $12,000 $1,500 $2,500 $10,000 $36,500
Min. $10 $5 $50 $15 $100 $20 $15 $15 $230
Count 444 413 236 280 186 222 139 55 N/A
* Including skinning, butchering, packing, etc. ** And/or hide tanning
Guide/Outfitter Results and Summary
Q13: Did you hire a guide/outfitter for your 2018 elk hunt?
Answered: 453 Skipped: 0
Less than half (42%) of the respondents reported hiring a guide/outfitter to assist them during
their hunt. Bull and cow firearm hunters comprised 34% and 32% of the guided hunters,
respectively. Archery bull and cow hunters comprised 21% and 13% of the guided hunters,
respectively. Sixty-five percent of the guided hunters had At-Large permits. Of the guided LEA
permit holders, 60% had the Hazard LEA area and 23% had the Straight Creek LEA area. Seventy-
Page 7
two percent of all the guided hunters harvested an elk. The percent of successful hunters are listed
in Table 5 by permit type and by guided versus non-guided hunters. Though overall harvest success
for non-guided hunters is high (52.4%); guided hunters had 19.5% higher success in harvesting an
elk. Hunters that were guided with a week two bull firearm tag had the highest success harvesting
an elk after youth permit holders with 100% success.
Table 5. Percent of Successful Harvests by Permit Type for Guided Hunters versus Non-guided Hunters
Permit Type Guided Non-guided
Bull Archery 55.6% 60.0%
Bull Firearm Week 1 71.0% 65.5%
Bull Firearm Week 2 86.2% 42.9%
Cow Archery 73.9% 27.1%
Cow Firearm Week 1 80.0% 67.7%
Cow Firearm Week 2 65.4% 48.3%
Youth Only Permit 100.0% 100.0%
Overall Percentage 71.9% 52.4%
Hunt Description Results
Q14: Which of the following techniques did you use while elk hunting?
Answered: 453 Skipped: 0
Q15: How many hours per day (on average) did you spend elk hunting?
Answered: 453 Skipped: 0
Q16: How many different days did you spend elk hunting?
Answered: 453 Skipped: 0
Q17: Approximately how many elk did you see while hunting?
Answered: 453 Skipped: 0
Hunt Description Summary
The type of harvest techniques used by hunters were spot and stalk mostly on foot, spot and stalk
mostly with a vehicle, using a blind or tree stand over a water source, using a blind or stand over a
food source, and using a blind or stand over a trail or travel corridor. The majority (69%) of hunters
used the spot and stalk method while mostly on foot. Two hunters reported using all of the hunt
types, 10 reported using four types, 24 reported using three types, 93 reported using two types, and
the majority (n=324) reported using a single type of hunt method.
Page 8
On average, hunters spent a little over eight hours per day hunting for a total of 3,819 hours spent
in the field, hunting. There was no statistically significant difference in the amount of hours spent
hunting in the field relative to the type of permit a hunter held; however, guided hunters tended to
spend an average of one extra day in the field. The average amount of days spent hunting for each
permit type is reported in Table 6 based on harvest success and whether a hunter was guided or
not. As expected, unsuccessful hunters spent more days in the field on average than successful
hunters likely as a result of spending more time trying to harvest an elk.
Table 6. Average Number of Days Spent Hunting by Permit Type and Guided vs Not Guided Hunters
Average # of Days Spent Hunting
Permit Type All Hunters Harvested No Harvest Guided Not Guided
Bull Archery 10.1 8.0 13.0 7.3 13.6
Bull Firearm Week 1 3.5 2.7 5.3 3.4 3.6
Bull Firearm Week 2 3.9 3.3 5.1 3.1 4.9
Cow Archery 6.5 5.6 7.2 6.0 6.8
Cow Firearm Week 1 2.9 2.3 4.3 2.8 2.9
Cow Firearm Week 2 3.6 3.0 4.2 3.6 3.5
Youth Only Permit 12.8 12.8 N/A 9.0 18.5
Commission Permit 6.4 5.5 10.0 7.3 3.0
Landowner Permit 9.7 10.0 8.9 13.4 6.7
Overall Average 6.6 5.9 6.7 6.2 5.5
There were a total of 6,948 elk sightings by 453 hunters, 5,118 cow elk and 1,830 bull elk. We do
not know how many of the same elk were seen by multiple hunters. The average number of
sightings was 11 cows and 4 bulls per hunter. The maximum number of bulls and cows seen by one
hunter during their entire hunt was 40 and 300, respectively. Archery hunters saw more elk than
gun hunters and week one hunters saw more elk than week two hunters (Table 7).
Table 7. Average Number of Elk Sightings by Permit Type
Average # of Sightings
Permit Type Cows Bulls
Bull Archery 14.0 6.6
Bull Firearm Week 1 5.0 2.8
Bull Firearm Week 2 2.9 1.8
Cow Archery 16.1 4.7
Cow Firearm Week 1 13.5 3.2
Cow Firearm Week 2 8.8 3.5
Youth Only Permit 23.6 13.0
Page 9
Harvest Results
Q18: How many elk did you shoot at but miss?
Answered: 448 Skipped: 5
Q19: How many elk did you hit and not recover?
Answered: 453 Skipped: 0
Q20: Did you harvest an elk during your hunt?
Answered: 453 Skipped: 0
Q21: How far from a maintained (paved or gravel) road was your animal when it was
harvested?
Answered: 274 Skipped: 179
Q22: What habitat type was your elk in when you harvested it?
Answered: 273 Skipped: 180
Harvest Summary
There were 369 harvest attempts reported by 359 hunters. A harvest attempt included missed
shots, hit and not recovered, and harvesting an elk. There were 40 hunters that reported shooting
at and missing one elk while 10 reported missing two and one reported missing three. There were
13 hunters that reported hitting one elk and not recovering it while two reported not recovering
two elk and one reported not recovering three elk (Table 8). Ten of the elk hit and not recovered
were by bull archery hunters followed by three, week one bull firearm hunters. The majority
(n=32) of missed shots at elk occurred during cow archery and firearm seasons. None of the youth
only permit holders reported missing or hitting and not recovering an elk. Harvest success is
displayed in Table 9 based on permit type. Refer to the “2018-2019 Elk Report” for the completed
harvest success statistics summarized via data from the Telecheck system.
Table 8. Total Number of Hunters that Shot at and Missed Elk and those that Shot an elk but did not
Recover it.
# of Elk
1 2 3 Total
Missed Elk 40 10 1 51
Not Recovered 13 2 1 16
Page 10
1 Stedman, R., D. R. Diefenbach, C. B. Swope, J. C. Finley, A. E. Luloff, H. C. Zinn, G. J. San Julian, G. A. Wang. 2004. Integrating
wildlife and human-dimesions research methods to study hunters. The Journal of Wildlife Management, 68(4) 762-773.
Table 9. Harvest Summary by Permit Type
Survey Reported Harvest Telecheck Reported
Permit Type Yes
Harvest No
Harvest Total
Reported Permits Allotted
Permits Sold
Yes Harvest
No Harvest
Bull Archery 35 (56%) 28 (44%) 66 100 95 48 (51%) 47 (49%)
Bull Firearm Week 1 36 (65%) 19 (35%) 60 75 71 38 (54%) 33 (46%)
Bull Firearm Week 2 33 (69%) 15 (31%) 50 75 72 45 (63%) 27 (37%)
Cow Archery 29 (41%) 41 (59%) 71 160 113 35 (31%) 78 (69%)
Cow Firearm Week 1 65 (71%) 26 (29%) 92 145 135 81 (60%) 54 (40%)
Cow Firearm Week 2 44 (53%) 39 (47%) 84 145 124 59 (48%) 65 (52%)
Youth Only Permit 5 (100%) 0 (0%) 5 10 9 9 (100%) 0 (0%)
Total 275 (61%) 178 (39%) 453 710 619 315 (51%) 304 (49%)
Over half (61%) of the hunters that responded to the survey reported harvesting an elk. Roughly
half (51%) of the hunters that successfully harvested an elk did so without the assistance of a guide.
A higher percentage (36%) of hunters had success harvesting their elk over a mile from a
maintained road (paved or gravel). Twenty percent of hunters harvested their elk a half mile to one
mile from a maintained road, 21% were one quarter mile to a half mile from a maintained road, and
23% were less than a quarter mile from a maintained road. Harvest success and distance from a
maintained road was not significantly different for any of the permit types; however, youth hunters
tended to harvest their elk less than a half mile from a maintained road. It is important to keep in
mind, however, that a study written by Stedman et al. 20101 discovered deer hunters carrying
global positioning system (GPS) units over estimated the distance they were from roads by <2.5
times. The majority of hunters harvested their elk in open mine land/grassland (33%) or the edge
of two or more habitat types (32%). Twenty-one percent of hunters harvested their elk in
thicket/shrubby cover and 13% harvested their elk in the interior of a forest. The majority of bulls
were harvested in a thicket/shrubby cover or the edge of two or more habitat types.
Proportionately, more bulls than cows were harvested in the forest interior. Cows were typically
harvested in open mine land/grassland habitats or the edge of two or more habitat types.
Satisfaction Results and Summary
Q23: Thinking back over your entire 2018 elk hunt, how satisfied were you with your elk
hunt overall
Answered: 453 Skipped: 0
Page 11
The majority (64%) of hunters had some degree of satisfaction with their 2018 elk hunt (Figure 1).
As you can see in Figure 2, those hunters that harvested an elk were more likely to say they were
satisfied with their hunt overall. Furthermore, hunters that were at least somewhat satisfied with
their hunt tended to see double the number of cows and bulls (n=17.4 elk) compared to hunters
that were somewhat to very dissatisfied with their hunt experience (n=7.3 elk). Hunters that were
neither dissatisfied nor satisfied with their hunt on average saw 14.1 elk. There was no statistically
significant difference in overall satisfaction (p=0.28) of the hunt experience relative to whether a
hunter hired a guide/outfitter or not. Week one bull and week one cow hunters tended to be the
most satisfied with their hunts. Satisfaction declined the most for week two bull and week two cow
hunters. Cow archery hunters tended to have a more dissatisfying hunt compared to bull archery
hunters. See Figure 3 for satisfaction results relative to permit type. Regardless of which area a
hunter hunted in, their satisfaction was generally high overall (Figure 4). However, more hunters
tended to be dissatisfied with their hunt experience when hunting in the At-large and Hazard LEA
areas.
Figure 1. 2018 Elk Hunter Satisfaction
Figure 2. Satisfaction vs. Harvest Success
42%
22% 4%
15%
17%
Very satisfied
Somewhat satisfied
Neither dissatisfiednor satisfied
Somewhatdissatisfied
Very dissatisfied
0
50
100
150
200
Verydissatisfied
Somewhatdissatisfied
Neitherdissatisfied
norsatisfied
Somewhatsatisfied
Verysatisfied
# o
f H
un
ters
Harvested
No Harvest
Page 12
Figure 3. Hunter Satisfaction vs. Permit Type
Figure 4. Hunter Satisfaction vs. Hunt Area
Voucher-Cooperator Program Results
Q24: KDFWR and cooperating landowners have partnered on a program (Voucher-
Cooperator Program) that provided elk hunting access on private property. Did you sign up
to elk hunt on a Voucher-Cooperator Program property?
Answered: 453 Skipped: 0
Q25: Did you hunt on the voucher property you had access too?
0%
50%
100%
Permit Type
Very satisfied
Somewhat satisfied
Neither dissatisfied norsatisfied
Somewhat dissatisfied
Very dissatisfied
0%10%20%30%40%50%60%70%80%90%
100%
Hunt Area
Very satisfied
Somewhat satisfied
Neither dissatisfied nor satisfied
Somewhat dissatisfied
Very dissatisfied
Page 13
Answered: 103 Skipped: 0
Q26: What voucher property did you hunt?
Answered: 103 Skipped: 0
Q27: How many days did you hunt and scout on the voucher area?
Answered: 103 Skipped: 0
Q28: Approximately how many total elk did you see on the property while hunting and
scouting?
Answered: 103 Skipped: 0
Q29: How can KDFWR improve the Voucher-Cooperator Program?
Answered: 453 Skipped: 37
Voucher-Cooperator Program Summary
Please note, as reflected in the amount of people that answered the questions in this section, that
some hunters misunderstood that voucher properties were different types of areas than Wildlife
Management Areas, Limited Entry Areas, and Hunter Access areas. The hunters that misunderstood
the meaning of a voucher property were removed from analyses in this section. Voucher-
cooperator properties were assigned on a first come, first serve basis. The majority of the
respondents (n=311; 67%) did not sign up/were not successful in signing up for a voucher-
cooperator property to hunt elk. Of those hunters that did get a voucher property (n=103) and
reported it accurately on this survey, 84% did hunt on the property. Table 10 displays the number
of hunters that signed up for each voucher property based on permit type. Just below 50% of the
hunters hunted and scouted two to five days on their voucher property. Twenty-seven percent
hunted/scouted one day, 17% hunted/scouted five to ten days, and 8% hunted/scouted 11+ days.
Table 11 reports the number of elk people saw on average in each voucher property.
Table 10. The Number of Hunters that Reported Signing up for each Voucher Property
Voucher Property
Name Bull
Archery
Bull Firearm Week 1
Bull Firearm Week 2
Cow Archery
Cow Firearm Week 1
Cow Firearm Week 2
Grand Total
Beech fork 2 0 0 0 2 0 4
Blue Diamond North 4 1 4 3 5 3 20
Blue Diamond South 0 0 0 3 5 0 8
Buffalo Branch 0 0 1 0 0 0 1
Cambrian 2 0 0 2 6 0 10
Corrigan 0 0 0 1 0 2 3
Page 14
Corum 1 0 0 0 1 0 2
Decoy Tract 0 1 0 0 1 1 3
Elkhorn Coal Tracts 0 2 3 3 4 0 12
Gilbert Wagers 1 1 1 0 0 0 3
Hardburley 1 1 0 0 0 2 4
Highway 476 Tract 1 0 0 1 1 1 4
Hoskins Tracts 0 0 1 1 1 1 4
Johnson Tract 0 1 0 0 0 1 2
Lost Mountain 2 0 0 1 0 1 4
Meta tract 0 0 0 1 0 0 1
Patti Mattie Tracts 3 1 0 0 0 0 4
Revelation Energy 0 1 0 0 0 1 2
RH Group Tracts 1 1 0 2 1 0 5
Thunder Ridge 0 0 2 1 3 1 7
Total 18 10 12 19 30 14 103
Table 11. Elk Seen in Each Voucher Property by Hunters
Number of Elk Seen Scouting and Hunting
Voucher Property Name 0 1-10 11-30 31+
Beech fork 2 2 0 0
Blue Diamond North 3 15 3 0
Blue Diamond South 1 3 4 0
Buffalo Branch 1 0 0 0
Cambrian 3 3 4 0
Corrigan 1 2 0 0
Corum 2 0 0 0
Decoy Tract 3 0 0 0
Elkhorn Coal Tracts 8 2 2 0
Gilbert Wagers 3 0 0 0
Hardburley 4 0 0 0
Highway 476 Tract 3 1 0 0
Hoskins Tracts 2 2 0 0
Johnson Tract 0 0 1 1
Lost Mountain 2 1 1 0
Patti Mattie Tracts 3 0 0 0
Revelation Energy 0 1 0 1
(Table 10 Continued)
Page 15
RH Group Tracts 4 0 1 0
Thunder Ridge 1 0 6 0 * Numbers in each white and blue row represent the number of hunters that saw the associated
number of elk listed in the second row
Below is a summary of the results from the question “How can the KDFWR improve the Voucher-
Cooperator Program?” Comments were compiled as best as possible into categories/themes. Only
categories/themes that were listed in five or more comments are reported below, though all
comments were reviewed and considered by KDFWR elk biologists. Also, only comments related to
the Voucher-Cooperator Program were reported.
164 (32%) people replied that they had no comment, no idea how to improve the
program, or they did not look into the program
56 (11%) comments were submitted asking for adding additional properties to the
program and/or allowing more hunters on certain properties
41 (8%) hunters claimed they knew little to no information about the program and
27 (5%) comments were made explaining that signing up for the program and the
program in general was hard to understand
38 (7%) comments were reported asking for more information on the use of the
property by elk, how many elk use the property, and the benefits and drawbacks of
the property to help the hunter decide which property to choose
35 (7%) comments were reported saying the hunter had issues with determining
boundaries of the properties and asked for better maps of the properties and more
signage. Some hunters also mentioned having trouble using the ArcGIS mapping
application provided by the KDFWR
24 (5%) comments were submitted asking for better road access, improved road
conditions, and all gates to be open
21 (4%) hunters replied that the program needed no changes and 6 (1%) hunters
wanted the program removed entirely
21 (4%) comments suggested the KDFWR provide reminders and additional
notifications to hunters about signing up for the program
15 (3%) comments were made saying it was too difficult to get signed up for a
voucher property using the first come, first serve process and 9(2%) hunters
suggested switching to a random draw process instead
15 (3%) comments were made by hunters suggesting guides/outfitters be removed
from being able to access the voucher properties; while 7 (1%) hunters reported
wanting guides to have full access to all voucher properties.
14 (3%) comments were submitted asking that other users (e.g., ATV riders, non-
elk hunters, horseback riders, houndsmen) be prohibited from accessing voucher
properties during the elk hunts
10 (2%) comments were included asking for better enforcement of the laws on
voucher properties and poaching was thought to be occurring on the
voucher/nearby lands
6 (1%) hunter reported the voucher properties needed habitat improvement for elk
(Table 11 Continued)
Page 16
5 (1%) hunters wanted other hunters to release their voucher access for other
hunters to sign up for if the original hunter decided not to hunt the voucher or as
soon as they decided not to return to the property
Additional Results
Q30: Which of the following types of lands did you elk hunt on?
Answered: 449 Skipped: 4
Q31: Have you ever hunted big game (deer/elk/moose/caribou) before your 2018 Kentucky
elk hunt?
Answered: 487 Skipped: 3
Q32: If you have additional comments or recommendations, please enter them in the box
below.
Answered: 291 Skipped: 199
Summary of Additional Questions
Roughly the same percentage of hunters hunted on private (38%), public (27%), and both private
and public lands (35%). Private land included Voucher-Cooperator Program properties due to their
restrictions of use and the limited number of hunters allowed on the lands. There was no significant
difference in the type of permit a hunter held and the type of land they hunted on. Guided/outfitted
hunters tended to hunt more on private lands or both private and public lands, not just public
lands.
Only 8% of hunters who hunted for elk during the 2018 season and responded to this survey have
not hunted other big game species. Of those hunters that have not hunted big game in the past,
52% did harvest an elk during the 2018 Kentucky elk hunting season.
Below is a summary of the results from question 32. Comments were compiled as best as possible
into categories/themes. Only categories/themes that were listed in five or more comments are
reported below, though all comments were review and considered by KDFWR elk biologists.
the most common comment (n=90; 18%) was that the elk program was doing well
overall followed by hunters saying they thought the elk population was lower than
in the past and/or below the desired level (n=76; 16%)
38 (8%) comments were posted wanting the elk program to stop moving elk out of
the state or to other areas within the elk zone
34 (7%) comments were received expressing dissatisfaction with the elk program
overall
34 (7%) comments were reported asking the elk program to provide more
information on the area where elk occurred and how the elk used the landscape; 5
(1%) hunters suggested the elk program conduct a voluntary orientation class to
teach hunters about the areas and elk hunting before their hunt
Page 17
27 (6%) comments were entered saying they had an issue with a guide/outfitter
and 5 (1%) hunters wanted guides prohibited from accessing public land ; 10 (2%)
comments were submitted that said they had a good guide experience
24 (5%) comments were submitted asking for a reduction in the number of cow elk
permits issued and three hunters wanted bull permits reduced as well
23 (5%) hunters had no additional comments to add
23 (5%) hunters claimed they had an issue with other users in the field while they
were hunting and wanted restricted use or all other users to cease activity during
the elk hunts; specifically hunters wanted other hunting seasons shut down during
the elk hunts
21 (4%) comments were posted by hunters saying they could not or it was
understood that many other hunters could not afford a guide/outfitter service,
which they said makes hunts more challenging
18 (4%) hunters wanted more enforcement of laws in the elk zone and 10 (2%)
reported seeing or hearing of poaching elk in the area they hunted
13 (3%) hunters want the regulation removed that prohibits elk permit holders
from applying to another elk hunt for three years
11 (2%) comments were made asking the elk program and landowners to do more
habitat work to improve the land for elk
11 (2%) hunters claimed there were too few trophy quality bulls in the area they
hunted
7(1%) hunters asked for more areas to hunt elk in the elk zone
7 (1%) hunters want better signage to help determine boundaries to elk hunting
areas