67
Slovakia 2013 National Report SURVEY OF ADULT SKILLS (PIAAC) MINISTERSTVO ŠKOLSTVA, VEDY, VÝSKUMU A ŠPORTU SLOVENSKEJ REPUBLIKY
Slovakia 2013
National Report
SURVEY OF ADULT SKILLS (PIAAC)
MINISTERSTVO ŠKOLSTVA,VEDY, VÝSKUMU A ŠPORTU SLOVENSKEJ REPUBLIKY

SURVEY OF ADULT SKILLS
PIAAC 2013 1
Preface
WHAT IS PIAAC (Programme for the International Assessment of Adult Competencies)?
- international survey of use of adult skills at work and in profession - instrument for assessment of adult proficiency - programme mapping cognitive competencies - instrument for identification of reasons and consequences of competence obtaining and
losing
WHAT IS CHARACTERISTIC FOR PIAAC?
- it is the first step and breakthrough event in the field of survey of adult skills - it has the features of the largest and most complex international survey - it is a survey of adult population aged 15 – 65 with the minimum of 4500 respondents in every
country - it was created based on cooperation of many countries, institutions, organizations and OECD - its core includes the main assessment in 2011 with results published in 2013 - it maps skills and competencies of individuals required for their participation in society and for
economic prosperity of countries - it measures how the mapped skills and competencies are used in working process - it helps governments of participating countries to understand better how education may have
positive impact on development of those skills International survey of this type examines, first of all, how the citizens of particular countries are ready to respond to new challenges of knowledge society. Direct measuring of skills of adult respondents brings incomparably more advantages compared to the former attempts of measuring the proficiency of adults based on their qualification. Diploma or certificate of educational attainment does not sufficiently prove the real potential of the respondent, not to mention the documents and certificates achieved many years ago. PIAAC will help to better understand effectiveness of educational systems in development of basic cognitive and work skills. PIAAC is an ambitious programme that maps the competencies, and it even tries to evaluate how
the skills relate to social and economic success of individuals or particular countries. Survey also brings information about the level of success of the educational systems in mediating of necessary competencies, and how to increase effectiveness of educational policies and measures.

SURVEY OF ADULT SKILLS
PIAAC 2013 2
Table of content
Introduction .......................................................................................................................................... 3 Introduction .......................................................................................................................................... 3 1. Need for new skills ....................................................................................................................... 6 2. Results of assessment of adult skills ............................................................................................. 8
2.1 Literacy ................................................................................................................................ 12
2.2 Numeracy ............................................................................................................................ 19 2.3 Proficiency in problem solving in technology-rich environment ........................................ 24 2.4 Correlations between literacy, numeracy and proficiency in problem solving in
technology-rich environment ......................................................................................................... 31 3. Significance of demographic and socio-economic factors in differentiation of skills proficiency
of adults .............................................................................................................................................. 33 4. Regional differentiation of skills proficiency of adults in Slovakia .............................................. 45 5. Survey results by nationality of respondents ................................................................................. 48
5.1 Participation of various nationalities in the survey ............................................................. 48 5.2 Selection of testing language and questionnaire language .................................................. 50 5.3 Proficiency of the respondents in problem solving in the technology-rich environments by
means of ICT, and their age, education and current participation in learning ............................... 51 5.4 Scoring by nationalities ....................................................................................................... 54 5.5 Influence of selected factors on scoring of the respondents of surveyed nationalities ....... 58
Conclusion ....................................................................................................................................... 60
List of Tables and Figures ............................................................................................................. 62
References ....................................................................................................................................... 64
SURVEY OF ADULT SKILLS
PIAAC 2013 3
Introduction The Ministry of Education has been ensuring participation in the OECD Programme of International Assessment of Adult Competencies – PIAAC since 2008. Upon the decision of the Minister of Education the Declaration on participation was signed on 1 February 2008. Its purpose is to create instruments for systematic monitoring of skills, prognosing of educational needs and ensuring of conditions for statistical evaluation of participation of selected population groups in life-long education. PIAAC is linked to results of PISA programme – it examines results of education from the point of view of labour market requirements, i.e. functional proficiency of pupils from the point of view of life-long education, and focuses on pupils in final grades of compulsory school attendance. It allows mapping of particular components of functional proficiency of adult population aged 15 – 65. PIAAC as a wide-spectrum project brings international comparison and exchange of good experience among participating countries. The PIAAC programme (often identified as „PISA for adults“) is of high importance for OECD and most of the member countries. It was supported also based on the fact that participation of adult population in life-long education is one of the 16 key indicators for monitoring of fulfillment of Lisbon goals in the field of education.
PIAAC is the first international survey focused on use of skills of respondents in profession and at
work.
Ten years after publishing the results of the first round of the Programme of International Student Assessment (PISA), OECD made the first survey of adult skills. The survey is focused on skills – literacy and numeracy and problem solving in technology-rich environment – similar to those assessed in PISA survey. PISA surveys try to find methods how the students can study better, how the teachers can teach better, and how the schools can work more effectively. The Survey of adult skills is oriented on how people develop their skills, how they use the skills, and what advantages they win from their application. For that purpose, the Survey collected information about how the skills are used at home, at work and in society; how the skills are developed, maintained and used during the whole life, how the skills influence participation in labour market, income, health, social and political commitment. Based on collected information the Survey may help the policy makers to examine impact of reading, writing, computing and problem solving in technology-rich environment on the whole range of economic and social phenomena. It allows evaluation of effectiveness of educational systems and professional training and setting of political instruments for development of key competencies allowing participation in labour market and in society in general. What is assessed? The Survey of adult skills (PIAAC) evaluates knowledge of adults aged 16 years and more and their literacy and numeracy and problem-solving skills in technology-rich environment. These are considered to be “key information-processing skills” relevant for adults in many social contexts and working situations and necessary for fully integration and participation in the labour market, education and training, and social and civic life. In addition, the Survey collets high volume of information about reading and computing, related activities, use of information and communication technologies at work and in everyday life, and examines the whole range of general skills, such as ability to cooperate with others. The respondents responded also the

SURVEY OF ADULT SKILLS
PIAAC 2013 4
question whether their skills and qualification correspond to their work requirements, and whether they are autonomous in implementation of key activities of their job.
Who participated in the Survey? 157 000 adults aged 16 to 65 participated in the Survey. 24 countries worldwide and national regions were involved in the Survey: 22 OECD member countries - Australia, Austria, Belgium (Flanders), Canada, the Czech Republic, Denmark, Estonia, Finland, France, Germany, Ireland, Italy, Japan, South Korea, the Netherlands, Norway, Poland, the Slovak Republic, Spain, Sweden, the United Kingdom (England and Northern Ireland), and the United States (USA) and two partner countries – Cyprus and the Russian Federation. The target population for the Survey included adults aged 16 – 65 residing in the country at the time of data collection, regardless of their nationality, citizenship or language usage. Data collection was performed between 1 August 2011 and 31 March 2012 in most of the participating countries. Survey was performed in households of respondents and processed using a laptop computer or by completing a print-based version using printed test brochures, depending on their computer skills. Official state language was used for assessment and questionnaire survey. In some countries assessment was done also in language of minority or in regional languages of the respondents. Sample size depended especially on number of assessed cognitive domains and number of languages, in which the Survey was performed in the particular country. Sample size was determined from the minimum of 4 500 up to almost 27 300 respondents. Respondents with very low literacy level skipped the whole literacy and numeracy part and problem solving in technology-rich environment and went directly to assessment of basic literacy “components” of the skills. The second round of the Survey of adult skills started in 2012 and it involved nine more countries: Chile, Greece, Indonesia, Israel, Lithuania, New Zealand, Singapore, Slovenia and Turkey. Data will be collected in 2014 and the results will be published in 2016. The third round for new countries will start in May 2014. How did we proceed in Slovakia?
� Adults aged 16 to 65 were tested. Sample of respondents was selected from the Population Register of the Slovak Republic according to the rules set by the OECD document „Technical standards and regulations to PIAAC study“. The size of selection database was 9 280 persons.
� Pilot testing was held in January and February 2011, and its purpose was to test all
processes, technical and personal background, logistics of collection, as well as methodics of assessment and justification of test items for the main survey. After its successful mastering OECD recommended including the country into the main survey.
� The main survey started in October 2011. Data collection was performed by TNS Slovakia,
s. r. o. The Contract on provision of services and Licence contract were concluded with the company on 13 December 2010 based on public tender. Training of interviewers, supervisors and coders was performed between 1 October 2011 and 27 October 2011. In total, 107 interviewers were trained for the main survey (101 interviewers worked directly in field).
� Data collection (interviews with respondents) was held between 27 October 2011 and 13
April 2012. The Slovak Republic succeeded in exceeding the required minimum number
SURVEY OF ADULT SKILLS
PIAAC 2013 5
of successful interviews (5 568 respondents according to the original plan in total), and it reached the total number of 5 680 of successful interviews (delivered questionnaires and tests). There were 56 interviews per one interviewer, in average.
� The main survey was performed in two language mutations, namely in Slovak or
Hungarian language. It can be inferred from the data that almost a half of the respondents of Hungarian nationality opted for Slovak language in assessment, which indicates that they considered the language used in work relations or language of education more important than their native language.
� Assessment was done primarily using computers, it is so called CAPI method (computer
assisted personal interviewing), however, respondents could choose also options of print-based assessment depending on their level of computer knowledge. Percentage proportion of items completed in paper form and computer items was 40:60.
� Work of interviewers was carefully monitored during their field work pursuant to
technical standards for data collection. One case was identified as a false one from all delivered cases. During the inspection the responses to verification questions were not equal to those of the particular respondent. That case was removed from data. In general, we can state that no more significant deviations were identified and identified mistakes were eliminated.
� In case of questionnaires completed in paper form some questions needed coding in
electronic form during the primary data processing (especially data, such as educational attainment abroad, jobs, sectors, used languages, country of origin and country in which respondent attained education, place of residence, etc.). Coding was methodically managed by the OECD instructions. Employment stated by the respondent and sector in which the respondent works were coded according to the code list of the Statistical Office of the Slovak Republic. Coding was performed by 3 „scorers“ who were properly professionally trained for such activity, and their mutual harmony in coding was in line with technical standards.
� Deadline for delivery of data in the OECD international center was 31 May 2012. The
Slovak Republic fulfilled this duty on 29 May 2012. We managed to achieve the response rate of 67.5 % (i.e. how many respondents of the selection database of 9 280 persons participated in the Survey, in percent). The Slovak Republic ranked among the first ten participating countries according to the preliminary results in this parameter.
More information on technical aspect of the Survey realization is given in the Technical report. The purpose of the technical report is to provide international comparison focused on position of Slovakia across the participating countries. Comparisons and stated results are just an input in further process of processing of obtained data. Deeper analyses will be published in next future. We believe that we will contribute to reflection of possibilities of life-long education and setting of processes for its further improvement.
SURVEY OF ADULT SKILLS
PIAAC 2013 6
Chapter 1
1. Need for new skills
Computers, information and communication technologies (ICT) are instruments for general use, and similar as bookprint, electric and steam machine they have principal influence on all areas of economy, and also on many aspects of social life. Use of computers in households and at work is getting more widespread very fast. Between 1999 and 2009 the number of internet connections in the OECD countries was doubled and the number of mobile phones was more than doubled. More than 70% of households in 23 OECD countries have got a computer with internet connection. Internet is common also at work, even in small and middle-sized enterprises. In most of the OECD countries, using of internet is a common part of working duties for 95% of employees of large and 95% middle-sized enterprises. 65% of employees use internet at work in small enterprises. 1(1) In Slovakia 67.5% households had internet connection and 72.2% access to computer in 2010. Thus, in 2010 Slovakia was close under the average of the 27 OECD countries in number of internet connections (similar to Slovenia, Estonia, and even Japan) and same close under the OECD average in number of home computers (similar to Slovenia, Estonia, and even Israel). There is a real prospect resulting for Slovakia from international comparison that in the course of next few years it will reach the level of 95% households with own computer with internet connection (similar to Korea or Iceland today). It is the level when almost every household has its own access to internet (2).
This prospect is supported also by development in the field of computers, information and communication technologies, where the difference between a computer and a mobile phone is being erased in form of a tablet. It is also indicated by differences in understanding the term “computer” in reporting the number of computers in different OECD countries, depending on the fact whether desk computers are distinguished from those laptop ones, or not. In 2012 71% of all data in the European Union was intended for smart phones and tablets, and the data is transferred via wi-fi. The share of data transferred via small wi-fi transmitters will increase to 78% till 2016, and the annual increase of requirements on wireless data transfer is expected on the level of 66%. Therefore, the EU Commission has decided to support building of publicly accessible wi-fi transmitters and to ensure free access to internet for everybody in Europe.
Computers and ICT create a new public space for exercise of civic rights and fulfillment of civic obligations. Until recently, a man missing the knowledge of reading and writing could not be a full-value citizen, today the man cannot exercise his/her civic right and fulfill his/her civic obligations in full scope without computer proficiency. Still higher number of countries is using this new public space for modernization, for example in provision of social and medical services and for tax payments. In several countries a statutory obligation of keeping all medical documentation for patients in digitalized form is being introduced. 40% of population and 80% of enterprises is currently using internet for communication with public authorities in the OECD countries.2 Similar fast growth was registered in case of internet shopping, especially in sale of knowledge products (computer software, new media, electronic databases, books and libraries).
Entrance of ICT in working activities changed not just the type and level of required education of employees, but it often changes the whole structure of organization and work performance. Fundamental change of work in publishing houses and polygraphic industry is the
1 OECD (2013), OECD Skills Outlook 2013: First Results from the Survey of Adult Skills, OECD Publishing, page 46
2 OECD (2013), OECD Skills Outlook 2013: First Results from the Survey of Adult Skills, OECD Publishing, page 47

SURVEY OF ADULT SKILLS
PIAAC 2013 7
best- known example. Entrance of ICT often incurs need for higher qualification, but there are also contradictory consequences when qualification requirements on some routine manual activities are being reduced. It leads to increasing differences between high-qualified and low-qualified work which needs to be regulated by suitable national and regional policies, depending on the fact whether new technologies are being introduced in order to replace employees or to increase their skills. During the past four decades the employment in manufacturing sectors was decreasing and it was being replaced by higher employment in sector of services, especially in finance, real estate business, insurance industry and trade services. Work in those industries is directly linked to collection, storing, processing, analyzing and distribution of information, it means to activities requiring use of computers and ICT. In spite of relative drop of employment in manufacturing industries, the employment in high demanding productions is growing. At least one third of economic activity in seventeen OECD countries is concentrated in technically high-demanding production, communication, finance, real estate business and insurance industry. The share of those industries exceeds the level of 40% in some countries, however, it cannot fully prevail in economics. However, impact of new technologies on economics cannot be underestimated, as the industries traditionally using low-qualified labour force are changing too due to the impact of advanced technologies. Agriculture may serve as an example. It is being transformed due to introduction of biotechnologies and computerization (e.g. GPS technologies and use of information technologies for sale control or market monitoring)3. In most of the OECD countries professionals with tertiary and secondary school education and qualified engineers make more than one quarter of all employees. Between 1988 and 2008 the number of those three categories of employees was growing faster than the overall number of employees which is confirmed by transition to higher-qualified work.4 The first of the critical reasons of this transition is the growth of technically high-demanding production, the second one is information and data processing, analyzing and interpreting that grow due to computerization.
The Survey of adult skills being the core of the PIAAC project (Programme for the International Assessment of Adult Competencies) responds also to changes in nature of working activities. It examines development of employment in particular occupations in connection to level of competencies for information processing. Number of employees who state that big changes occurred at their workplaces in the field of working technologies and processes is the same as the number of employees who indicate changes in organization and structure of working activities.5 Both types of changes require adaptation and learning from individuals. They have impact not only on the level of information-processing skills, but also on the whole range of abilities conditioning such skills, such as ability of planning, cooperating and having influence on others. The Survey of adult skills collects data allowing to identify in which occupations such conditioning abilities are required and used. Note:
(1) (2) Every numerical data stated in this report comes from the database of the Survey of adult skills (PIAAC, 2012) in form and scope in which it was made available for processing on national level.
3 OECD (2013), OECD Skills Outlook 2013: First Results from the Survey of Adult Skills, OECD Publishing, page 48
4 OECD (2013), OECD Skills Outlook 2013: First Results from the Survey of Adult Skills, OECD Publishing, page 49
5 OECD (2013), OECD Skills Outlook 2013: First Results from the Survey of Adult Skills, OECD Publishing, page 51
SURVEY OF ADULT SKILLS
PIAAC 2013 8
Chapter 2
2. Results of assessment of adult skills
The Survey of adult skills, the core of the PIAAC programme, measures the level of adult skills in literacy, numeracy and problem solving in technology-rich environment. Such skills in work with information are:
• necessary for fully integrating and participating in the labour market, education and training, and social and civic life;
• highly transferable, in that they are relevant to many common social contexts and work situations; and
• “learnable” and, therefore, subject to the influence of national educational strategies. 6
At the most fundamental level, literacy and numeracy skills facilitate developing higher-order cognitive skills, such as analytic reasoning, and are essential for understanding most of the domains of human knowledge. In addition, these skills are of high practical relevance across the range of everyday life contexts, from education through work to home and social life and interaction with public and self-governing authorities. The capacity to manage information and solve problems in technology-rich environments, it means to access, evaluate, analyze and communicate information through the use of digital devices and applications, is becoming a necessity as information and communication technology (ICT) applications permeate the workplace, the classroom and lecture hall, the home, and social interaction in general. High proficiency in problem-solving in technology-rich environment allows making the most of the opportunities created by the technological and structural changes on workplaces and in everyday life.
People who struggle with use of new technologies currently face serious risk of social marginalization. Little known fact indicated by the Survey of adult skills is the significant correlation between the level of information skills and quality of life. People who ranked on the lowest levels in tested skills more often state medical problems, they have less confidence to others and stronger feeling of inability to have any influence on political life in their surrounding.
The Survey results are also a warning for the Government of the Slovak Republic. According to the results of the Survey in Slovakia, similar as in most of the countries, there is a remarkable share of adults on low level of literacy and numeracy. In Slovakia even 11.8% of adults score only on the lowest level in literacy, and 13.8% only on the lowest level in numeracy. (4.9% to 27.7 of adults score on the lowest level in literacy and 8.1% to 31.7% in numeracy in countries participating in the Survey). People on this level can solve just items with very low number of steps, and they understand just low volume of information that need to be presented in fairly simple context7.
In many countries a large part of population has no experience in ICT, or it is missing basic computer proficiency required for ICT use in everyday life. Slovakia belongs to the countries with one of the highest proportion of such population on the level of 21.7%. The lowest level of such people, less than 7% aged 16 – 65, is in the Netherlands, Norway and Sweden. Even 45.5% of adult
6 Definitions of literacy, numeracy and problem solving in technology-rich environment are taken over from the Chapter 2
Proficiency in Key Information-processing Skills Among Working-age Adults. Examples of test items and information about what
adults can do at particular levels of proficiency are taken over from this chapter too. OECD (2013), OECD Skills Outlook 2013: First Results from the Survey of Adult Skills, OECD Publishing, pages 55 - 100 7 OECD (2013), OECD Skills Outlook 2013: First Results from the Survey of Adult Skills, OECD Publishing, page 56
SURVEY OF ADULT SKILLS
PIAAC 2013 9
population in Slovakia from among the computer-literate population ranks on the lowest level on the scale measuring the skills in problem solving in technology-rich environments. People on that level are able to use only the most easiest accessible computer applications and to use them for fully simple purposes according to the clearly set instructions and with low number of steps. Only 4.5% of adults in Slovakia score at the highest level of proficiency on this scale, are able to complete tasks requiring ability to use higher number of applications in less user-comfort environment, and to solve problems requiring more complex approach and overcoming of barriers in access to information. The share of adults on the highest level of computer proficiency in participating countries fluctuates between 2.9 and 8.8%8.
Definition of skills (literacy, numeracy, and problem solving in technology-rich environment)
The skills assessed in the Survey of adult skills are each defined in terms of three aspects:
• Content, it means the texts, artefacts, tools, knowledge and cognitive challenges that constitute the corpus to which adults must respond or that they have to use when they read, act in a numerate way or solve problems in technology-rich environments.
• Cognitive strategy, process or correct use of a certain connection to search for the correct response.
• Different situation contexts in which adults have to complete items in the field of reading, computing or finding of mathematical results, and in the field of problem-solving of computer communication9.
8 OECD (2013), OECD Skills Outlook 2013: First Results from the Survey of Adult Skills, OECD Publishing, page 56
9 OECD (2013), OECD Skills Outlook 2013: First Results from the Survey of Adult Skills, OECD Publishing, page 59
SURVEY OF ADULT SKILLS
PIAAC 2013 10
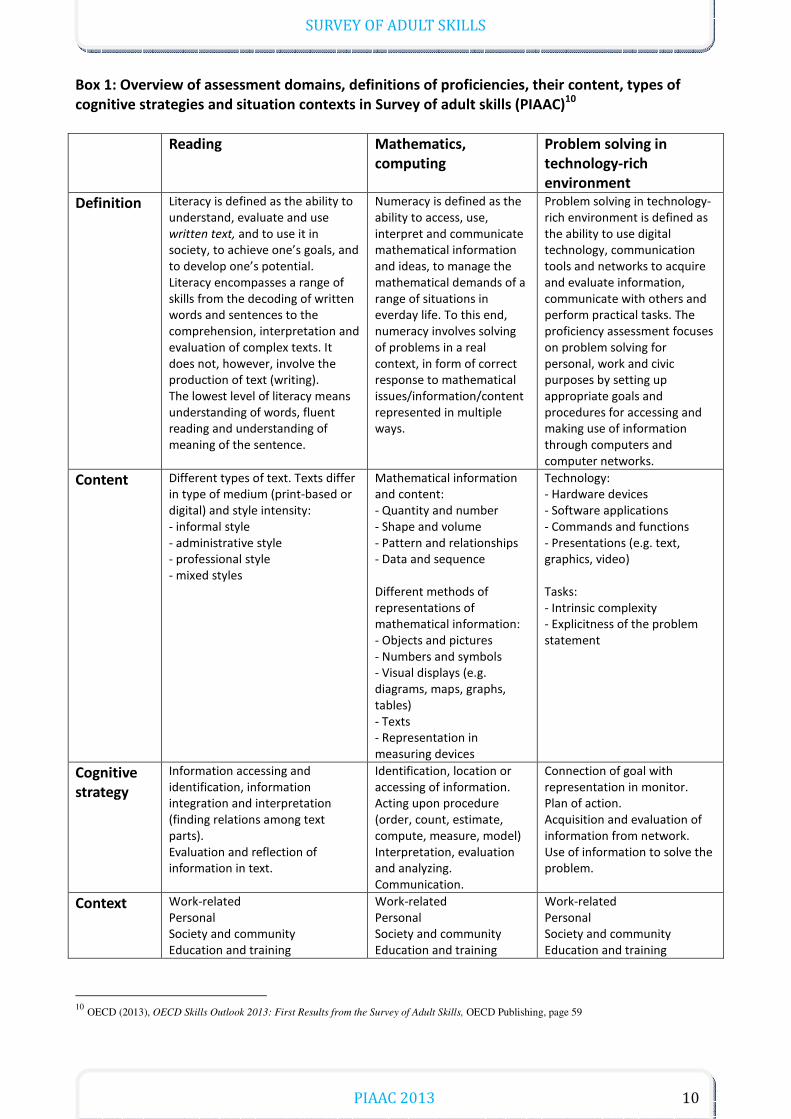
Box 1: Overview of assessment domains, definitions of proficiencies, their content, types of
cognitive strategies and situation contexts in Survey of adult skills (PIAAC)10
Reading Mathematics,
computing
Problem solving in
technology-rich
environment
Definition Literacy is defined as the ability to understand, evaluate and use written text, and to use it in society, to achieve one’s goals, and to develop one’s potential. Literacy encompasses a range of skills from the decoding of written words and sentences to the comprehension, interpretation and evaluation of complex texts. It does not, however, involve the production of text (writing). The lowest level of literacy means understanding of words, fluent reading and understanding of meaning of the sentence.
Numeracy is defined as the ability to access, use, interpret and communicate mathematical information and ideas, to manage the mathematical demands of a range of situations in everday life. To this end, numeracy involves solving of problems in a real context, in form of correct response to mathematical issues/information/content represented in multiple ways.
Problem solving in technology-rich environment is defined as the ability to use digital technology, communication tools and networks to acquire and evaluate information, communicate with others and perform practical tasks. The proficiency assessment focuses on problem solving for personal, work and civic purposes by setting up appropriate goals and procedures for accessing and making use of information through computers and computer networks.
Content Different types of text. Texts differ in type of medium (print-based or digital) and style intensity: - informal style - administrative style - professional style - mixed styles
Mathematical information and content: - Quantity and number - Shape and volume - Pattern and relationships - Data and sequence Different methods of representations of mathematical information: - Objects and pictures - Numbers and symbols - Visual displays (e.g. diagrams, maps, graphs, tables) - Texts - Representation in measuring devices
Technology: - Hardware devices - Software applications - Commands and functions - Presentations (e.g. text, graphics, video) Tasks: - Intrinsic complexity - Explicitness of the problem statement
Cognitive
strategy
Information accessing and identification, information integration and interpretation (finding relations among text parts). Evaluation and reflection of information in text.
Identification, location or accessing of information. Acting upon procedure (order, count, estimate, compute, measure, model) Interpretation, evaluation and analyzing. Communication.
Connection of goal with representation in monitor. Plan of action. Acquisition and evaluation of information from network. Use of information to solve the problem.
Context Work-related Personal Society and community Education and training
Work-related Personal Society and community Education and training
Work-related Personal Society and community Education and training
10
OECD (2013), OECD Skills Outlook 2013: First Results from the Survey of Adult Skills, OECD Publishing, page 59

SURVEY OF ADULT SKILLS
PIAAC 2013 11
Method of data collection
5702 persons (2697 men and 3005 women) participated in the Survey in Slovakia. More
than 157 000 adults aged 16 – 65 in 24 countries participated in the whole international survey. People living in the particular country regardless of their citizenship were addressed. Survey in the Slovak Republic was performed according to personal decision in Slovak or Hungarian as the language of the most numerous minority living on its territory. Sample size, number of people addressed in each country depended on number of languages in which the Survey was done and on number of surveyed fields of literacy (three OECD member countries, France, Spain and Italy and the associated Cyprus have not surveyed skills in problem solving in technology-rich environment). Sample size was not less than 4500 people speaking national language and it grew according to the number of surveyed language minorities. In Slovakia it included Hungarian minority, therefore the sample was increased so that it is fully representative for Hungarian minority too.
Survey was done by trained interviewers in households of respondents or in another place according to agreement between respondent and interviewer. The interviewer asked basic and personal questions using laptop computer. Responding to basic questions took ca. 30 – 45 minutes. After responding to basic and personal questions the respondents could have decided, depending on their computer skills, whether they use computer-based assessment for the second part, or responding in paper-based test. Respondents have no time limit for responding to particular questions and to completing of tasks. Completing of tasks and responding in the second, so called cognitive part of the Survey took 50 minutes in average.
In case of respondents with very low literacy level the measuring of full literacy, numeracy and computer literacy was not continued, and such persons passed just the core literacy test. It assessed knowledge of words in Slovak or Hungarian language, ability to understand meaning of sentence and to read the text fluently. In such case the time required by the respondent to complete the test items was recorded too. The respondents who opted for print-based assessment in the second part of the Survey because they did not pass the core computer skills test, participated in assessment of core literacy skills too. Method of result presentation
In each of the three domains assessed, proficiency is considered as a continuum of ability involving
the mastery of information-processing tasks of increasing complexity. The results are presented on the scale on which 5 reference points are defined. The scale in case of numeracy and literacy is divided in the following score intervals: 376 points and more, between 326 and 375 points, between 276 and 325 points, between 226 and 275 points, between 176 and 225 points and less than 176 points. There are 4 scale intervals defined for skills in problem solving in technology-rich environment: 341 points and more, between 291 and 340 points, between 241 and 290 points, less than 241 points. In each interval on the scale, an individual with a proficiency score of that particular value has a 67% chance of successfully completing test items located at that point. Such individual is also able, but with lower level of chance, to successfully respond to more difficult items and with adequate
greater chance to successfully respond to easier items.11. Test items were divided in six difficulty levels depending on their difficulty level in literacy and numeracy assessment and in four levels in problem solving in technology-rich environment. It is necessary to highlight that the levels are intended for processing of the Survey results only, and they do not have any normative meaning. It means that they represent neither any grade, nor any
11
OECD (2013), OECD Skills Outlook 2013: First Results from the Survey of Adult Skills, OECD Publishing, page 60
SURVEY OF ADULT SKILLS
PIAAC 2013 12
proof about completed qualification requirements for classification to a certain level of education or a job. In order to interpret results correctly, it is useful to understand differences between persons with high, medium and low level on literacy, numeracy and computer proficiency scale, e.g.:
• Adult A with high proficiency in literacy and numeracy successfully completes two of three items on the difficulty levels 5 and 6. He or she will almost always successfully complete all items on the difficulty levels 1 and 2 and items on the difficulty levels 3 and 4 most of the time.
• Adult B with moderate level of proficiency will successfully complete two of three items on difficulty levels 3 and 4. He or she will successfully complete the more difficult items on levels 5 and 6 some of the time, and he or she will complete the easier items on difficulty levels 1 and 2 most of the time.
• Adult C with low proficiency will successfully complete two of three items on the difficulty levels 1 and 2. He or she will rarely successfully complete some of the items of the levels 5 and 6, and he or she will successfully complete some of the items of the levels 3 and 4 some of the time.12
2.1 Literacy
Literacy is defined as the ability to understand and use the written text, to assess its
meaning and to participate in society, achieve one´s goals, and develop one´s knowledge and potential via written text. Assessment in this Survey relates just to reading of written text, it does not involve either the comprehension of spoken language or the ability of speaking or writing. In addition, given the growing importance of digital devices and applications as a tool of generating, accessing and storing written text, the reading of digital texts on monitor is an integral part of literacy. Digital texts are texts that are stored as digital information and accessed in the form of screen-based displays on devices such as computers, e-book readers or smart phones. Digital texts have a range of features that distinguish them from print-based texts: in addition to being displayed on screens, these include hypertext links to other documents, specific navigation features (e.g. scroll bars, use of menus) and interactivity. The Survey of Adult Skills (PIAAC) is the first international assessment to cover this dimension of literacy 13. What adults can do at different levels on literacy scale
Graph 2.1 presents the percentage of adults aged 16 to 65 in each participating country
who score at each of the five levels of proficiency on the literacy scale14. (Examples of literacy items are in Box 2.) Literacy at level 5 (scores equal to or higher than 376 points))
15.
Level 5 is the highest proficiency level on the literacy scale. Adults scoring on this level can perform tasks that involve searching for and integrating information across extensive texts written in professional and mixed style; constructing syntheses of similar and contrasting ideas or aspects, or evaluating evidence and arguments. They can apply and evaluate logical and conceptual
12
OECD (2013), OECD Skills Outlook 2013: First Results from the Survey of Adult Skills, OECD Publishing, page 60 13
OECD (2013), OECD Skills Outlook 2013: First Results from the Survey of Adult Skills, OECD Publishing, page 61 14
OECD (2013), OECD Skills Outlook 2013: First Results from the Survey of Adult Skills, OECD Publishing, page 63 15
OECD (2013), OECD Skills Outlook 2013: First Results from the Survey of Adult Skills, OECD Publishing, page 66
SURVEY OF ADULT SKILLS
PIAAC 2013 13
models, and evaluate the reliability of sources and select key information. They are aware of subtle, rhetorical cues and are able to use specialized knowledge.
International report gives the above percentage for levels 4 and 5 in common. In Slovakia, very few people, just 0.2%, score at the level 5 in literacy, and less than 1% of adults do in the OECD countries, in average. Finland has the highest proportion of adults at this level (2.2%), followed by Australia and the Netherlands (1.3%), Sweden and Japan (1.2%).
Literacy at level 4 (between 326 points and 375 points) At level 4, adults can perform multiple-step operations to integrate or synthetise
information from texts written in different styles containing competing information. They can make complex inferences and correctly apply background knowledge as well as interpret or evaluate subtle truth claims of arguments.
In Slovakia 7.3% people score on level 4 in literacy, and 11.3% of adults do across the OECD countries, in average. Japan (21.4%) and Finland (20.0%) have the largest proportion of adults scoring at this level. They have also the largest proportion of adults scoring at the first two levels in literacy. At the other end of the scale, Italy (3.3%) and Spain (4.6%) have less than half the average OECD level; they have also the smallest proportion of adults scoring at levels 4 and 5. Literacy at level 3 (between 276 and 326 points)
Adults performing at level 3 can understand and respond appropriately to dense or lengthy texts written in different styles. They understand the text structures and rhetorical devices and can identify, interpret, or evaluate one or more pieces of information and make appropriate inferences. They can also perform multi-step operations and select relevant data from competing information in order to formulate appropriate interferences.
In Slovakia 44.4% of people score at level 3 in literacy, and 38.4 % of adults do across the OECD countries, in average. In most countries, more adults perform at level 3 in proficiency than at any other level. This is true for all of the participating countries except Ireland, Poland, Italy and Spain, where larger proportions of adults score at level 2 in proficiency. Japan (48.6%) and Korea (41.7%) have the largest proportions of adults at this level too. In the OECD countries, more than half of adults score at the first three levels across the OECD countries. More than 60% of adults in Japan (71.1%) and Finland (62.9%) score at the first three levels. Literacy at level 2 (between 226 points and 276 points)).
At level 2, adults can integrate two or more pieces of information based on common criterion, compare and contrast them and make low-level inferences. They can navigate within digital texts to access and identify information from various parts of a document.
In Slovakia 36.2% of people score at level 2 in literacy, and, 33.2 % of adults do across the OECD countries, in average. Japan (22.8%), the Netherlands (26.4%) and Finland (26.5%) have the smallest proportions of adults scoring at this level.
Across the OECD countries, 83.3% of adults score at least at the level 2 in literacy. Countries with the largest proportion of adults scoring at the level 2 or higher include Japan (93.9%), Finland (89.4%), the Slovak Republic (88.1%) and the Czech Republic (87.6%). Literacy at level 1 (between 176 and 226 points)
At level 1, adults can read shorter digital or print texts in informal and administrative style and to locate a single piece of information, which is identical to or synonymous with the information given in the instruction or question. These texts contain little competing information. Adults scoring at this level can complete simple form, understand basic vocabulary, determine the meaning of sentence, and read simple text fluently.
SURVEY OF ADULT SKILLS
PIAAC 2013 14
In Slovakia 9.7% of people score at level 1 in literacy, and 12.2 % of adults do across the OECD countries, in average. Japan (4.3%) and Finland (8.0%) have the smallest proportion of adults scoring at this level, followed by the Netherlands (9.1%), Norway (9.3%), Australia (9.4%), and Sweden (9.6%). Countries with the largest proportions of adults scoring at level 1 include Italy (27.7%) and Spain (27.5%). Literacy below level 1 (scores lower than 176 points)
People at this level can read brief texts on familiar topics and locate a single piece of specific information identical to information in the question or instruction. They are not required to understand the structure of sentence, and only basic vocabulary knowledge is required. Tasks below level 1 do not make use of any instruments used in digital texts.
In Slovakia 1.9% of people score below level 1 in literacy, and 3.3 % of adults do across the OECD countries, in average. Spain has the largest proportion of adults scoring below level 1 (7.2%), followed by Italy (5.5%), and Ireland (4.3%). Again, Japan has the smallest proportion of adults scoring below level 1 (0.6%), followed by the Czech Republic (1.5%), Slovakia (1.9%) and Estonia (2.0%). Literacy-related non-response
In all of the participating countries, some adults were unable to complete the basic questions for language or other reasons. In case of these respondents, only their age, sex and, in some cases, educational attainment is known. In most countries, non-respondents represented less than 5% of respondents. This category is identified in results separately as a grey bar in graphs. In most cases, these persons are likely to have one of the lowest levels of literacy proficiency.
SURVEY OF ADULT SKILLS
PIAAC 2013 15
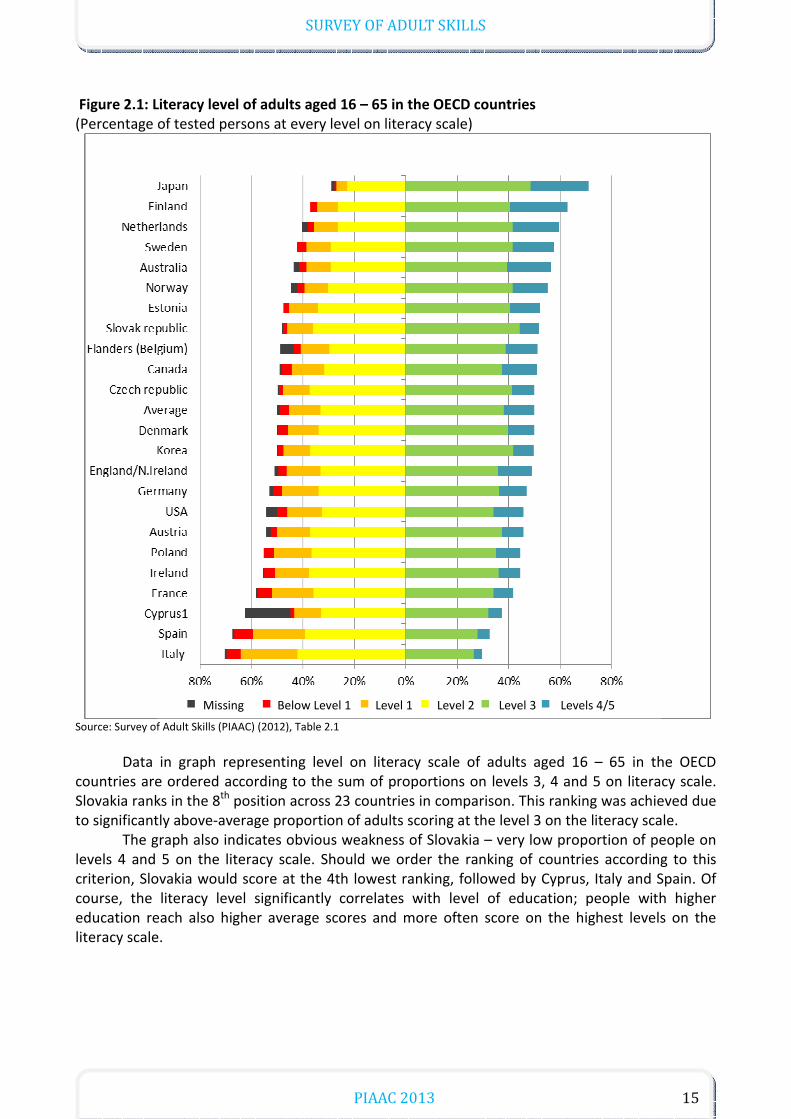
Figure 2.1: Literacy level of adults aged 16 – 65 in the OECD countries
(Percentage of tested persons at every level on literacy scale)
Source: Survey of Adult Skills (PIAAC) (2012), Table 2.1
Data in graph representing level on literacy scale of adults aged 16 – 65 in the OECD countries are ordered according to the sum of proportions on levels 3, 4 and 5 on literacy scale. Slovakia ranks in the 8th position across 23 countries in comparison. This ranking was achieved due to significantly above-average proportion of adults scoring at the level 3 on the literacy scale.
The graph also indicates obvious weakness of Slovakia – very low proportion of people on levels 4 and 5 on the literacy scale. Should we order the ranking of countries according to this criterion, Slovakia would score at the 4th lowest ranking, followed by Cyprus, Italy and Spain. Of course, the literacy level significantly correlates with level of education; people with higher education reach also higher average scores and more often score on the highest levels on the literacy scale.
Missing Below Level 1 Level 1 Level 2 Level 3 Levels 4/5
SURVEY OF ADULT SKILLS
PIAAC 2013 16
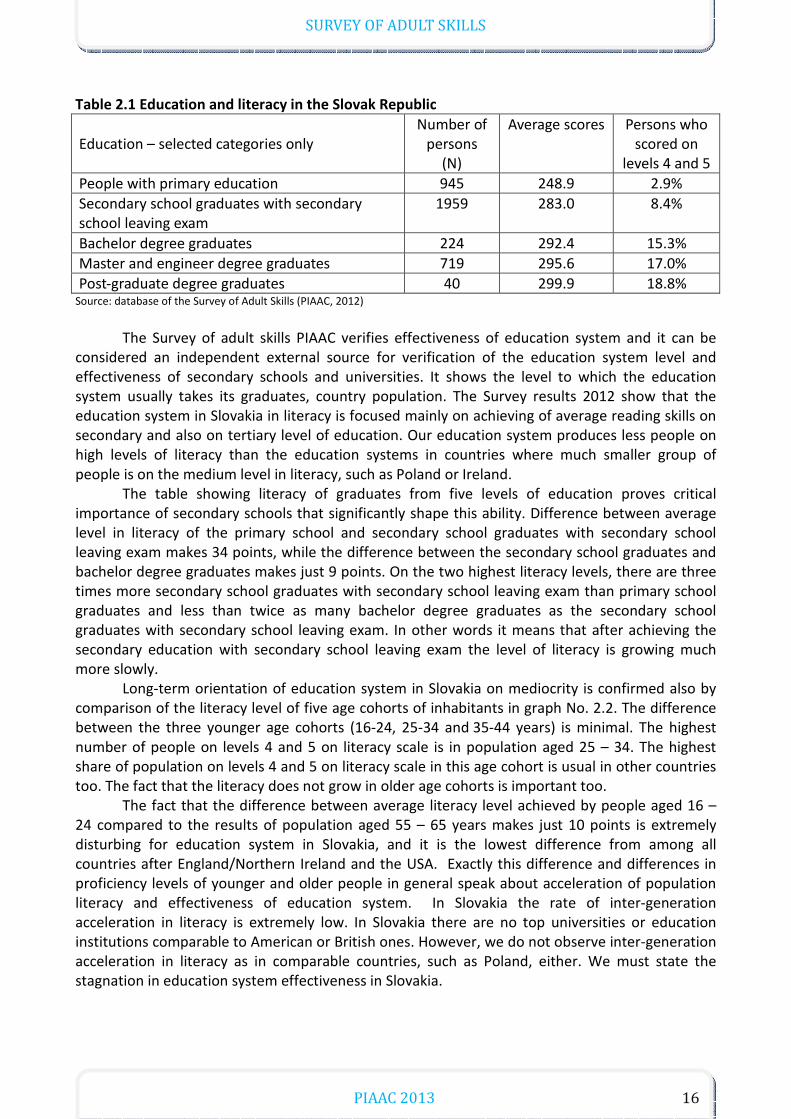
Table 2.1 Education and literacy in the Slovak Republic
Education – selected categories only Number of
persons (N)
Average scores Persons who scored on
levels 4 and 5
People with primary education 945 248.9 2.9%
Secondary school graduates with secondary school leaving exam
1959 283.0 8.4%
Bachelor degree graduates 224 292.4 15.3%
Master and engineer degree graduates 719 295.6 17.0%
Post-graduate degree graduates 40 299.9 18.8% Source: database of the Survey of Adult Skills (PIAAC, 2012)
The Survey of adult skills PIAAC verifies effectiveness of education system and it can be
considered an independent external source for verification of the education system level and effectiveness of secondary schools and universities. It shows the level to which the education system usually takes its graduates, country population. The Survey results 2012 show that the education system in Slovakia in literacy is focused mainly on achieving of average reading skills on secondary and also on tertiary level of education. Our education system produces less people on high levels of literacy than the education systems in countries where much smaller group of people is on the medium level in literacy, such as Poland or Ireland.
The table showing literacy of graduates from five levels of education proves critical importance of secondary schools that significantly shape this ability. Difference between average level in literacy of the primary school and secondary school graduates with secondary school leaving exam makes 34 points, while the difference between the secondary school graduates and bachelor degree graduates makes just 9 points. On the two highest literacy levels, there are three times more secondary school graduates with secondary school leaving exam than primary school graduates and less than twice as many bachelor degree graduates as the secondary school graduates with secondary school leaving exam. In other words it means that after achieving the secondary education with secondary school leaving exam the level of literacy is growing much more slowly.
Long-term orientation of education system in Slovakia on mediocrity is confirmed also by comparison of the literacy level of five age cohorts of inhabitants in graph No. 2.2. The difference between the three younger age cohorts (16-24, 25-34 and 35-44 years) is minimal. The highest number of people on levels 4 and 5 on literacy scale is in population aged 25 – 34. The highest share of population on levels 4 and 5 on literacy scale in this age cohort is usual in other countries too. The fact that the literacy does not grow in older age cohorts is important too.
The fact that the difference between average literacy level achieved by people aged 16 – 24 compared to the results of population aged 55 – 65 years makes just 10 points is extremely disturbing for education system in Slovakia, and it is the lowest difference from among all countries after England/Northern Ireland and the USA. Exactly this difference and differences in proficiency levels of younger and older people in general speak about acceleration of population literacy and effectiveness of education system. In Slovakia the rate of inter-generation acceleration in literacy is extremely low. In Slovakia there are no top universities or education institutions comparable to American or British ones. However, we do not observe inter-generation acceleration in literacy as in comparable countries, such as Poland, either. We must state the stagnation in education system effectiveness in Slovakia.
SURVEY OF ADULT SKILLS
PIAAC 2013 17
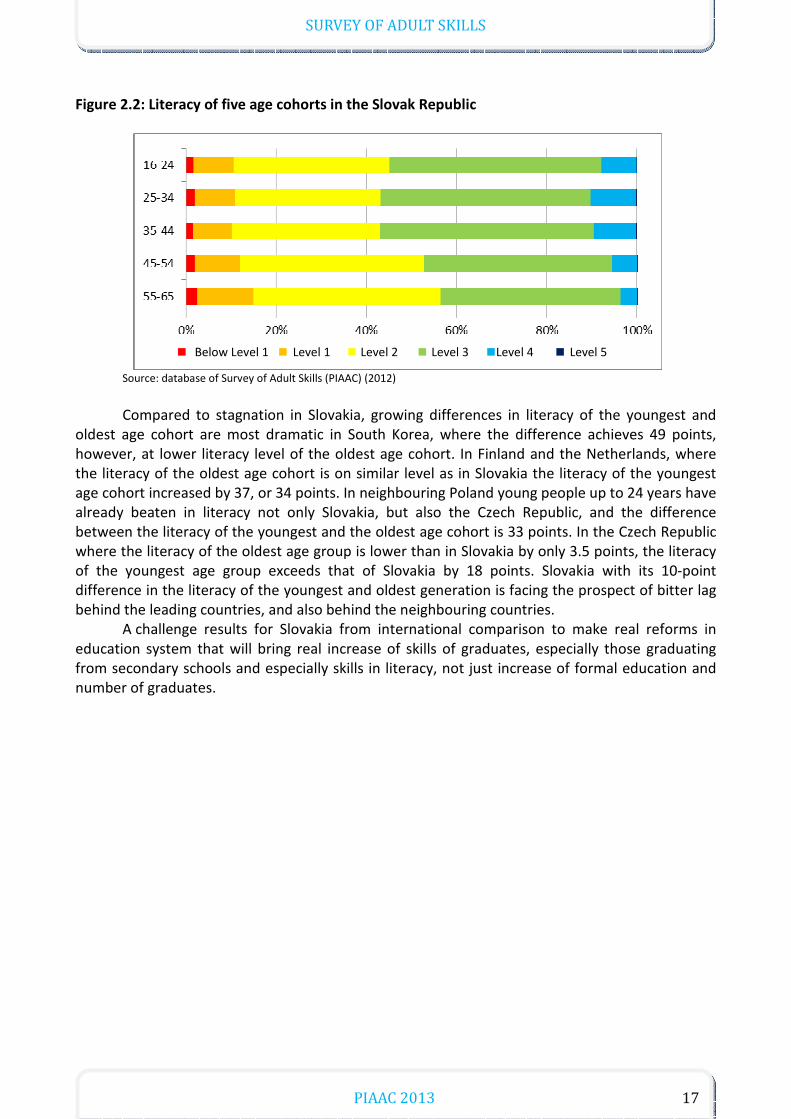
Figure 2.2: Literacy of five age cohorts in the Slovak Republic
Source: database of Survey of Adult Skills (PIAAC) (2012)
Compared to stagnation in Slovakia, growing differences in literacy of the youngest and
oldest age cohort are most dramatic in South Korea, where the difference achieves 49 points, however, at lower literacy level of the oldest age cohort. In Finland and the Netherlands, where the literacy of the oldest age cohort is on similar level as in Slovakia the literacy of the youngest age cohort increased by 37, or 34 points. In neighbouring Poland young people up to 24 years have already beaten in literacy not only Slovakia, but also the Czech Republic, and the difference between the literacy of the youngest and the oldest age cohort is 33 points. In the Czech Republic where the literacy of the oldest age group is lower than in Slovakia by only 3.5 points, the literacy of the youngest age group exceeds that of Slovakia by 18 points. Slovakia with its 10-point difference in the literacy of the youngest and oldest generation is facing the prospect of bitter lag behind the leading countries, and also behind the neighbouring countries.
A challenge results for Slovakia from international comparison to make real reforms in education system that will bring real increase of skills of graduates, especially those graduating from secondary schools and especially skills in literacy, not just increase of formal education and number of graduates.
Below Level 1 Level 1 Level 2 Level 3 Level 4 Level 5
SURVEY OF ADULT SKILLS
PIAAC 2013 18
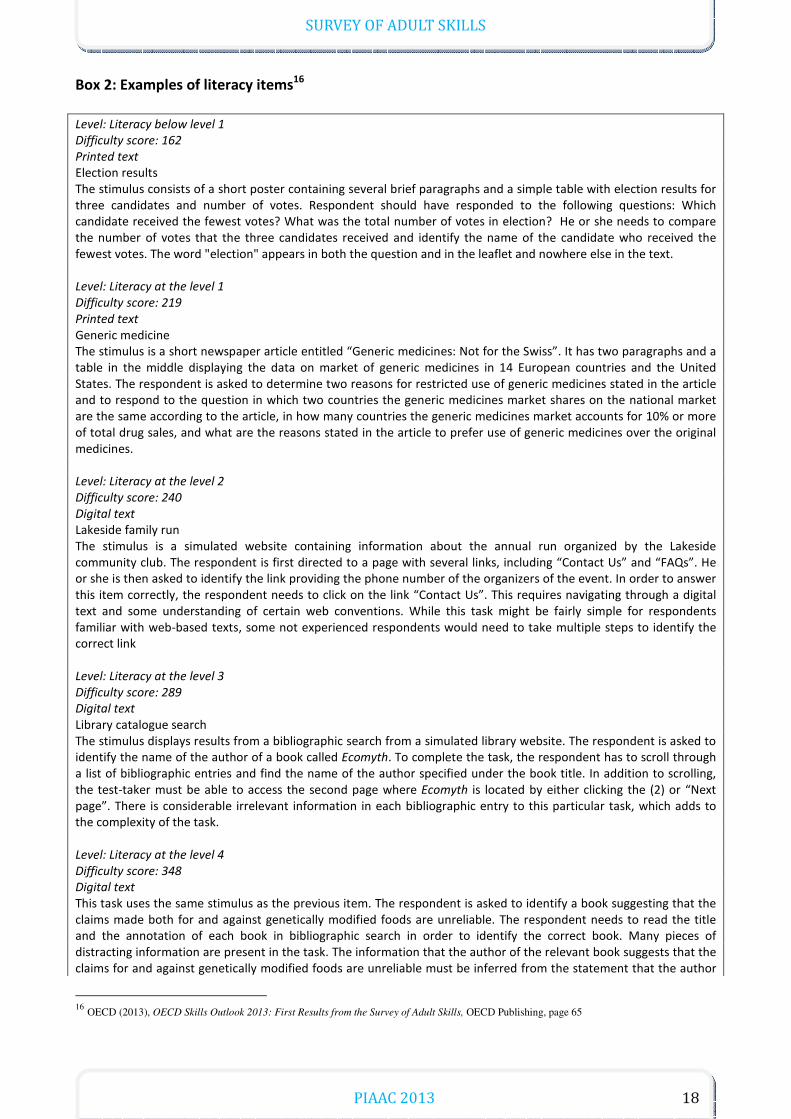
Box 2: Examples of literacy items16
Level: Literacy below level 1
Difficulty score: 162
Printed text
Election results The stimulus consists of a short poster containing several brief paragraphs and a simple table with election results for three candidates and number of votes. Respondent should have responded to the following questions: Which candidate received the fewest votes? What was the total number of votes in election? He or she needs to compare the number of votes that the three candidates received and identify the name of the candidate who received the fewest votes. The word "election" appears in both the question and in the leaflet and nowhere else in the text.
Level: Literacy at the level 1
Difficulty score: 219
Printed text
Generic medicine
The stimulus is a short newspaper article entitled “Generic medicines: Not for the Swiss”. It has two paragraphs and a table in the middle displaying the data on market of generic medicines in 14 European countries and the United States. The respondent is asked to determine two reasons for restricted use of generic medicines stated in the article and to respond to the question in which two countries the generic medicines market shares on the national market are the same according to the article, in how many countries the generic medicines market accounts for 10% or more of total drug sales, and what are the reasons stated in the article to prefer use of generic medicines over the original medicines. Level: Literacy at the level 2
Difficulty score: 240
Digital text
Lakeside family run
The stimulus is a simulated website containing information about the annual run organized by the Lakeside community club. The respondent is first directed to a page with several links, including “Contact Us” and “FAQs”. He or she is then asked to identify the link providing the phone number of the organizers of the event. In order to answer this item correctly, the respondent needs to click on the link “Contact Us”. This requires navigating through a digital text and some understanding of certain web conventions. While this task might be fairly simple for respondents familiar with web-based texts, some not experienced respondents would need to take multiple steps to identify the correct link
Level: Literacy at the level 3
Difficulty score: 289
Digital text
Library catalogue search
The stimulus displays results from a bibliographic search from a simulated library website. The respondent is asked to identify the name of the author of a book called Ecomyth. To complete the task, the respondent has to scroll through a list of bibliographic entries and find the name of the author specified under the book title. In addition to scrolling, the test-taker must be able to access the second page where Ecomyth is located by either clicking the (2) or “Next page”. There is considerable irrelevant information in each bibliographic entry to this particular task, which adds to the complexity of the task.
Level: Literacy at the level 4
Difficulty score: 348
Digital text
This task uses the same stimulus as the previous item. The respondent is asked to identify a book suggesting that the claims made both for and against genetically modified foods are unreliable. The respondent needs to read the title and the annotation of each book in bibliographic search in order to identify the correct book. Many pieces of distracting information are present in the task. The information that the author of the relevant book suggests that the claims for and against genetically modified foods are unreliable must be inferred from the statement that the author
16
OECD (2013), OECD Skills Outlook 2013: First Results from the Survey of Adult Skills, OECD Publishing, page 65

SURVEY OF ADULT SKILLS
PIAAC 2013 19
“describes how both sides in this hotly contested debate have manufactured propaganda, tried to dupe the public and…”
2.2 Numeracy
Numeracy is defined as the ability to access, use, interpret and communicate mathematical information and ideas in order to solve mathematical items of a range of situations in everyday life. A numerate individual is one who responds appropriately to mathematical content, information, and ideas represented in various contexts of everyday life. While performance in mathematic task is, in part, dependent on the ability to read and understand text, numeracy involves more than applying arithmetical skills, it needs to apply numeracy in connection to information being part of a more extensive text.17 What adults can do at different levels of numeracy proficiency
Graph 2.3 presents the percentage of adults aged 16 to 65 who scored at each of the five
levels on the numeracy scale in each participating country. (Examples of numeracy items are in Box 2.3.)
Numeracy at level 5 (scores equal to or higher than 376 points 18
)
Adults at level 5 on the numeracy scale can understand complex representations, and abstract and formal mathematical and statistical ideas, sometimes formulated explicitly or embedded in complex texts. They can integrate several types of mathematical information where interpretation or explanation in mathematical ideas is required; draw inferences; develop or work with mathematical models; and justify, evaluate and critically reflect upon process and results.
In Slovakia only 0.8% people score on level 5 on the numeracy scale which is less than the average across the OECD countries on the level of 1.1% of adults. Finland has the highest proportion of adults at this level (2.2%), followed by Sweden (1.9%), Norway (1.7%), Denmark (1.7%) and Flanders (Belgium) (1.6%). Numeracy at level 4 (between 326 points and 375 points)
At this level, adults understand a broad range of mathematical information that may be complex, abstract or embedded in less intelligible context. They can perform tasks involving multiple steps and select appropriate problem-solving strategies and processes. They can analyze and engage in more complex reasoning about quantities and data, statistics and series, spatial relationships, change, proportions and formulae. They can also understand arguments and communicate well-reasoned answers or choices.
In Slovakia 11.8% people score at level 4 on the numeracy scale, and 11.4% of adults do across the OECD countries, in average. Japan (17.3%) and Finland (17.2%) have the largest proportion of population scoring at this level, while Spain (4.0%) and Italy (4.3%) have the smallest proportion. Numeracy at level 3 (between 276 points and 325 points)
Adults at level 3 can successfully complete tasks that require an understanding of mathematical information that may be less explicit, embedded in contexts that are not always simple, and represented in more complex ways. They can perform tasks requiring several steps 17
OECD (2013), OECD Skills Outlook 2013: First Results from the Survey of Adult Skills, OECD Publishing, page 75 18
OECD (2013), OECD Skills Outlook 2013: First Results from the Survey of Adult Skills, OECD Publishing, page 78

SURVEY OF ADULT SKILLS
PIAAC 2013 20
and that may involve a choice of problem-solving strategy. They have a good sense of number and space; can recognize and work with mathematical relationships, patterns, and proportions expressed in verbal or numerical form. They can understand and perform basic analyses of data and statistics in texts, tables and graphs. In Slovakia 41.1% people score at level 3 on the numeracy scale, and 34.4% of adults do across the OECD countries, in average. Japan has the highest proportion of adults at this level (43.7%), followed closely by the Slovak Republic (41.1%), the Czech Republic (40.4%), and the Netherlands (39.4%). Italy has the smallest proportion of adults scoring at this level (24.4%), followed by Spain (24.5%) and the USA (25.9%). Numeracy at level 2 (between 226 points and 275 points
19)
Adults at the level 2 can successfully perform tasks that require identifying of mathematical information and ideas from text, embedded in common context where the mathematical content is fairly explicit or visual and the text has relatively few distractors. The tasks may require applying two or more steps, for example, calculations with whole numbers, common decimals, percents and fractions; simple measurement and spatial representations; understanding of simple data and statistics in texts, reading of tables and graphs.
In Slovakia 32.2% of people score at level 2 on the numeracy scale, and 33% of adults do across the OECD countries, in average. Some 79.8% of adults score at the level 2 or higher in numeracy in the OECD countries; most of them in Japan (90.6%), Finland (87.2%), the Czech Republic (86.5%) and the Slovak Republic (86%).
Numeracy at level 1 (between 176 points and 225 points)
Adults at level 1 can complete tasks involving basic mathematical operations in common, concrete contexts where the mathematical content is explicit with little text and minimal distractors. They can perform one-step or simple mathematical operations, such as counting, sorting, basic arithmetical operations, understanding simple percents, and locating or identifying elements of simple or common graphical or spatial representations.
In Slovakia 10.3% of people score at the level 1 on the numeracy scale, and 14% of adults do across the OECD countries, in average. Japan has the smallest proportion of adults scoring at this level (7.0%), while Italy has the largest proportion (23.7%), followed by Spain (21.1%) and the USA (19.6%).
Numeracy below level 1 (scores lower than 176 points) Adults at this level can only cope with very simple tasks set in concrete, familiar contexts
where the mathematical content is explicit and that require knowledge of only basic operations, such as counting or sorting. They can perform basic arithmetical operations with whole numbers or money, and recognizing common spatial representations. This level is not classified further, it means adults who score less than 176 points are considered to be at this level on the numeracy scale.
In Slovakia 3.5% of people score below the level 1 on the numeracy scale, and 5% of adults do across the OECD countries, in average. Japan has the smallest proportion of adults scoring at this level (1.2%), followed by the Czech Republic (1.7%), while Spain (9.5%) and the USA (9.1%) have the highest one. Numeracy-related non-response
19
OECD (2013), OECD Skills Outlook 2013: First Results from the Survey of Adult Skills, OECD Publishing, page 79
SURVEY OF ADULT SKILLS
PIAAC 2013 21
Similar as in case of literacy, not all respondents answered the items assessing the numeracy. This category is identified in results separately as a black bar in graphs. It can be assumed that, in most cases, these persons are likely to have low levels of proficiency in numeracy.
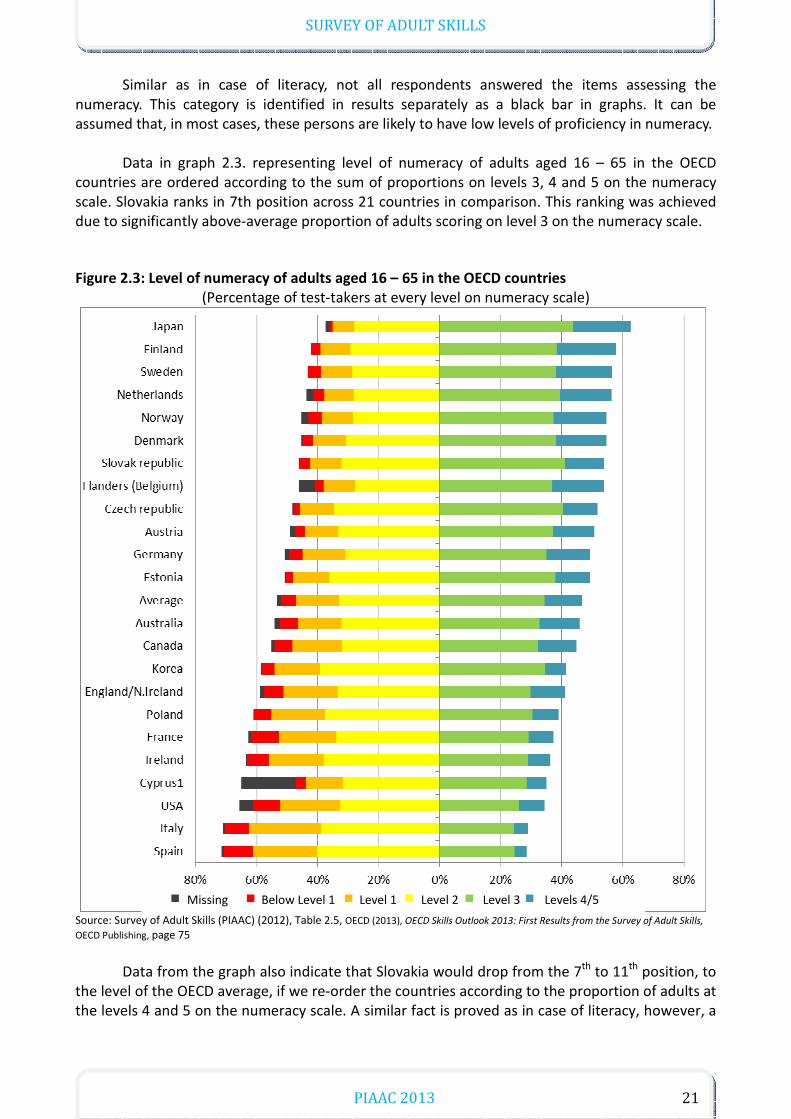
Data in graph 2.3. representing level of numeracy of adults aged 16 – 65 in the OECD
countries are ordered according to the sum of proportions on levels 3, 4 and 5 on the numeracy scale. Slovakia ranks in 7th position across 21 countries in comparison. This ranking was achieved due to significantly above-average proportion of adults scoring on level 3 on the numeracy scale.
Figure 2.3: Level of numeracy of adults aged 16 – 65 in the OECD countries (Percentage of test-takers at every level on numeracy scale)
Source: Survey of Adult Skills (PIAAC) (2012), Table 2.5, OECD (2013), OECD Skills Outlook 2013: First Results from the Survey of Adult Skills,
OECD Publishing, page 75
Data from the graph also indicate that Slovakia would drop from the 7th to 11th position, to
the level of the OECD average, if we re-order the countries according to the proportion of adults at the levels 4 and 5 on the numeracy scale. A similar fact is proved as in case of literacy, however, a
Missing Below Level 1 Level 1 Level 2 Level 3 Levels 4/5
SURVEY OF ADULT SKILLS
PIAAC 2013 22
bit less significant. High ranking of Slovakia results from high proportion of people on the average level, while it has smaller percentage of adults at the top level compared to, for example, Germany or Austria.
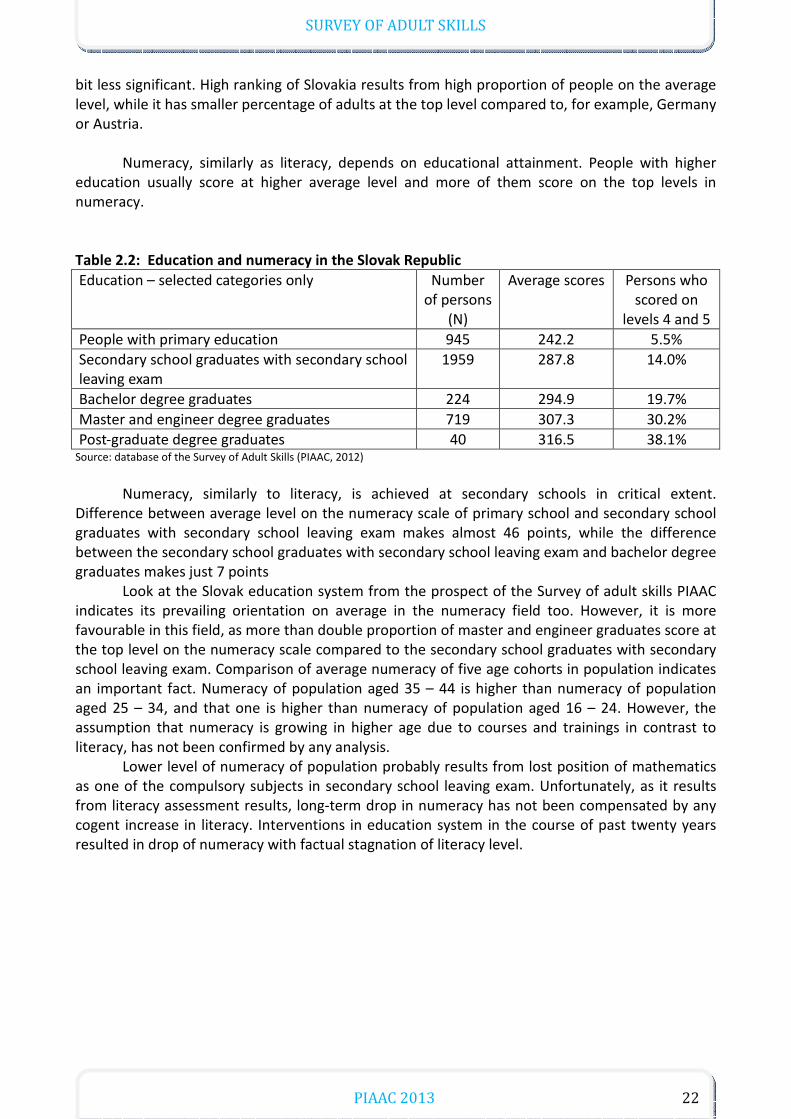
Numeracy, similarly as literacy, depends on educational attainment. People with higher
education usually score at higher average level and more of them score on the top levels in numeracy.
Table 2.2: Education and numeracy in the Slovak Republic
Education – selected categories only Number of persons
(N)
Average scores Persons who scored on
levels 4 and 5
People with primary education 945 242.2 5.5%
Secondary school graduates with secondary school leaving exam
1959 287.8 14.0%
Bachelor degree graduates 224 294.9 19.7%
Master and engineer degree graduates 719 307.3 30.2%
Post-graduate degree graduates 40 316.5 38.1% Source: database of the Survey of Adult Skills (PIAAC, 2012)
Numeracy, similarly to literacy, is achieved at secondary schools in critical extent.
Difference between average level on the numeracy scale of primary school and secondary school graduates with secondary school leaving exam makes almost 46 points, while the difference between the secondary school graduates with secondary school leaving exam and bachelor degree graduates makes just 7 points
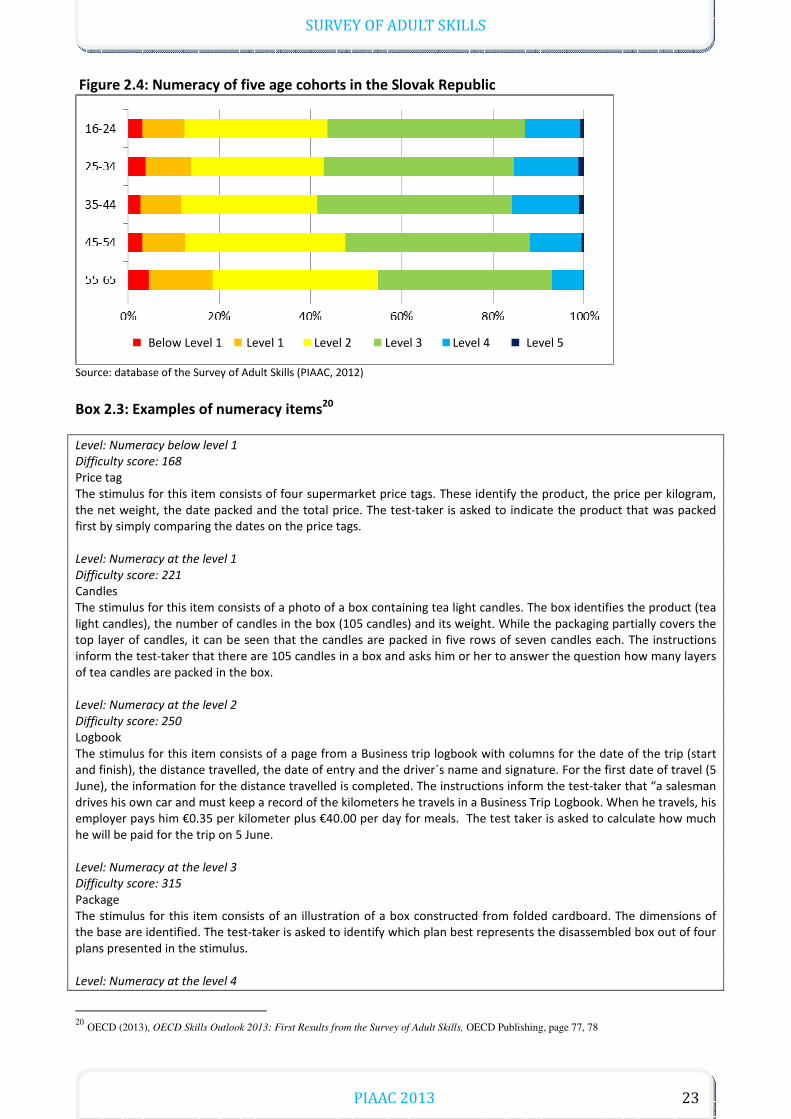
Look at the Slovak education system from the prospect of the Survey of adult skills PIAAC indicates its prevailing orientation on average in the numeracy field too. However, it is more favourable in this field, as more than double proportion of master and engineer graduates score at the top level on the numeracy scale compared to the secondary school graduates with secondary school leaving exam. Comparison of average numeracy of five age cohorts in population indicates an important fact. Numeracy of population aged 35 – 44 is higher than numeracy of population aged 25 – 34, and that one is higher than numeracy of population aged 16 – 24. However, the assumption that numeracy is growing in higher age due to courses and trainings in contrast to literacy, has not been confirmed by any analysis.
Lower level of numeracy of population probably results from lost position of mathematics as one of the compulsory subjects in secondary school leaving exam. Unfortunately, as it results from literacy assessment results, long-term drop in numeracy has not been compensated by any cogent increase in literacy. Interventions in education system in the course of past twenty years resulted in drop of numeracy with factual stagnation of literacy level.
SURVEY OF ADULT SKILLS
PIAAC 2013 23
Figure 2.4: Numeracy of five age cohorts in the Slovak Republic
Source: database of the Survey of Adult Skills (PIAAC, 2012)
Box 2.3: Examples of numeracy items20
Level: Numeracy below level 1
Difficulty score: 168
Price tag The stimulus for this item consists of four supermarket price tags. These identify the product, the price per kilogram, the net weight, the date packed and the total price. The test-taker is asked to indicate the product that was packed first by simply comparing the dates on the price tags. Level: Numeracy at the level 1
Difficulty score: 221
Candles
The stimulus for this item consists of a photo of a box containing tea light candles. The box identifies the product (tea light candles), the number of candles in the box (105 candles) and its weight. While the packaging partially covers the top layer of candles, it can be seen that the candles are packed in five rows of seven candles each. The instructions inform the test-taker that there are 105 candles in a box and asks him or her to answer the question how many layers of tea candles are packed in the box.
Level: Numeracy at the level 2
Difficulty score: 250
Logbook
The stimulus for this item consists of a page from a Business trip logbook with columns for the date of the trip (start and finish), the distance travelled, the date of entry and the driver´s name and signature. For the first date of travel (5 June), the information for the distance travelled is completed. The instructions inform the test-taker that “a salesman drives his own car and must keep a record of the kilometers he travels in a Business Trip Logbook. When he travels, his employer pays him €0.35 per kilometer plus €40.00 per day for meals. The test taker is asked to calculate how much he will be paid for the trip on 5 June. Level: Numeracy at the level 3
Difficulty score: 315
Package
The stimulus for this item consists of an illustration of a box constructed from folded cardboard. The dimensions of the base are identified. The test-taker is asked to identify which plan best represents the disassembled box out of four plans presented in the stimulus.
Level: Numeracy at the level 4
20
OECD (2013), OECD Skills Outlook 2013: First Results from the Survey of Adult Skills, OECD Publishing, page 77, 78
Below Level 1 Level 1 Level 2 Level 3 Level 4 Level 5

SURVEY OF ADULT SKILLS
PIAAC 2013 24
Difficulty score: 354
Education level The stimulus for this item consists of two stacked-column bar graphs presenting the distribution of the Mexican population by years of schooling for men and women separately. The y axis of each of the graphs is labeled “percentage” with 6 grid lines labeled “0%”, “20%”, “40%”, “60%”, “80%” and “100%”. The x axis is labeled “year” and data is presented for 1960, 1970, 1990, 2000 and 2005. A legend identifies three categories of schooling: “more than 6 years of schooling”, “up to 6 years of schooling” and “no schooling”. The test-taker is asked to approximate what percentage of men in Mexico had more than 6 years of schooling in 1970, choosing from a pull-down menu that has 10 response categories: “0-10%”, “10-20%”, and so on.
2.3 Proficiency in problem solving in technology-rich environment
The Survey of Adult Skills defines proficiency in problem solving in technology-rich
environments as ability to use digital technology, communication tools and networks to acquire and evaluate information, communicate with others and perform practical tasks. It focuses on the abilities to solve problems for personal, work and civic purposes by setting up appropriate goals and plans for accessing and making use of information through computers and computer networks. 21
Problem solving in technology-rich environments represents the intersection of what are sometimes described as “computer literacy” skills (i.e. the capacity to use ICT tools) and the cognitive skills required to solve problems. Some basic knowledge regarding the use of ICT input devices, such as a keyboard and mouse and display screen, file-management tools, applications (Internet browsers, data editors, e-mail), and graphic interfaces is essential for performing assessment tasks. However, the objective is not to test proficiency in the use of ICT tools and applications in isolation, but rather to assess the capacity of adults to use these tools to access, process, evaluate and analyze information effectively in a goal-oriented way. The difficultly of the problem-solving tasks is related to both the cognitive demands and complexity of the tasks, and the range and nature of the tools and applications that the test-taker is required to use to arrive at a solution. For example, the more difficult problem solving task tends to involve transferring information from one application to another, and then transforming that information to the procedure leading to solution, and taking several steps and overcoming various barriers. Proportion of computer-literate adults
Some respondents were unable to use a computer. This group includes adults who had no
prior computer experience prior to being addressed in this Survey, and adults who did not pass the core test in computer literacy – they were not able to use a mouse, scroll through text on monitor, or highlight text parts. Those people were not able to participate in computer-based test version. In addition, there was a relatively large group of people in every country who opted to take the paper-based version of the assessment and refused to take the computer test for personal reasons.
In Slovakia 22% of respondents had no prior computer experience, 2.2% of respondents did not pass the core test in computer literacy, and 12.5% people opted for paper-based test version for personal reasons. It means that 63.6% of computer-literate respondents have passed the assessment of skills in problem solving in technology-rich environment in Slovakia. Two thirds of those 36.4% who did not pass the computer-based test were even not able to take such test at all. Slovakia is together with Italy, Poland, Korea and Spain a country, in which one quarter of adult population is fully computer-illiterate. Just to notify that such people are seriously endangered by
21
OECD (2013), OECD Skills Outlook 2013: First Results from the Survey of Adult Skills, OECD Publishing, page 86
SURVEY OF ADULT SKILLS
PIAAC 2013 25
social marginalization in today´s world, and they are in similar position as people who were not able to read and write in the middle of the past century. What adults can do at different levels of proficiency in problem solving in technology-rich
environments
Graph 2.5 represents the percentage of all adults aged 16 to 65, across all participating countries, depending on scores on three levels of skills in problem solving in technology-rich environments. (Examples of problem-solving items to measure such proficiency are described in Box 2.4.)
Proficiency in problem solving in technology-rich environment at level 3 (scores equal to or higher
than 341) 22
) Adults at level 3 can complete tasks involving multiple applications, a large number of
steps, overcoming of barriers during the process, and the discovery and use of suitable commands in a novel environment. They can establish an independent plan to arrive at a solution and apply it even in unexpected and complicated situations.
In Slovakia only 4.2% of people scored at the level 3 in proficiency in problem solving in technology-rich environment, which is the lowest result from among all participating countries. In average, 5.8% adults across the OECD countries score at this level. Sweden (8.8%) and Finland (8.4%) have the largest proportions of population scoring at this level. Proficiency in problem solving in technology-rich environment at level 2 (between 291 points and
340 points) At level 2, adults can complete problems that have explicit criteria, a small number of
applications, and several steps and operations. They can decide on suitability of process and handle unexpected barriers.
In Slovakia 22.8% of test-takers score at the level 2, while 28.2% of adults do across the participating OECD countries, in average. Only Poland (15.4%) and Ireland (22.1%) have less people scoring at this level. The highest proportion of people at the level 2 in this proficiency is in Sweden (44%) and Finland (41.6%).
Proficiency in problem solving in technology-rich environment at level 1 (between 241 and 290
points) At level 1, adults can complete tasks in which the goal is explicitly stated and for which the
necessary operations are performed in user-friendly environment. They can solve tasks with small number of steps and a limited number of operations.
In Slovakia 38% of test-takers score at the level 1, while some 29.4% of adults do across the participating OECD countries, in average. Proficiency in problem solving in technology-rich environment below level 1 (scores below 241 points)
Below level 1, adults can complete tasks in which the goal is explicitly stated and for which a single operation is performed in user-friendly environment. They can solve tasks with small number of steps and a limited number of operations.
22
OECD (2013), OECD Skills Outlook 2013: First Results from the Survey of Adult Skills, OECD Publishing, page 89-90
SURVEY OF ADULT SKILLS
PIAAC 2013 26
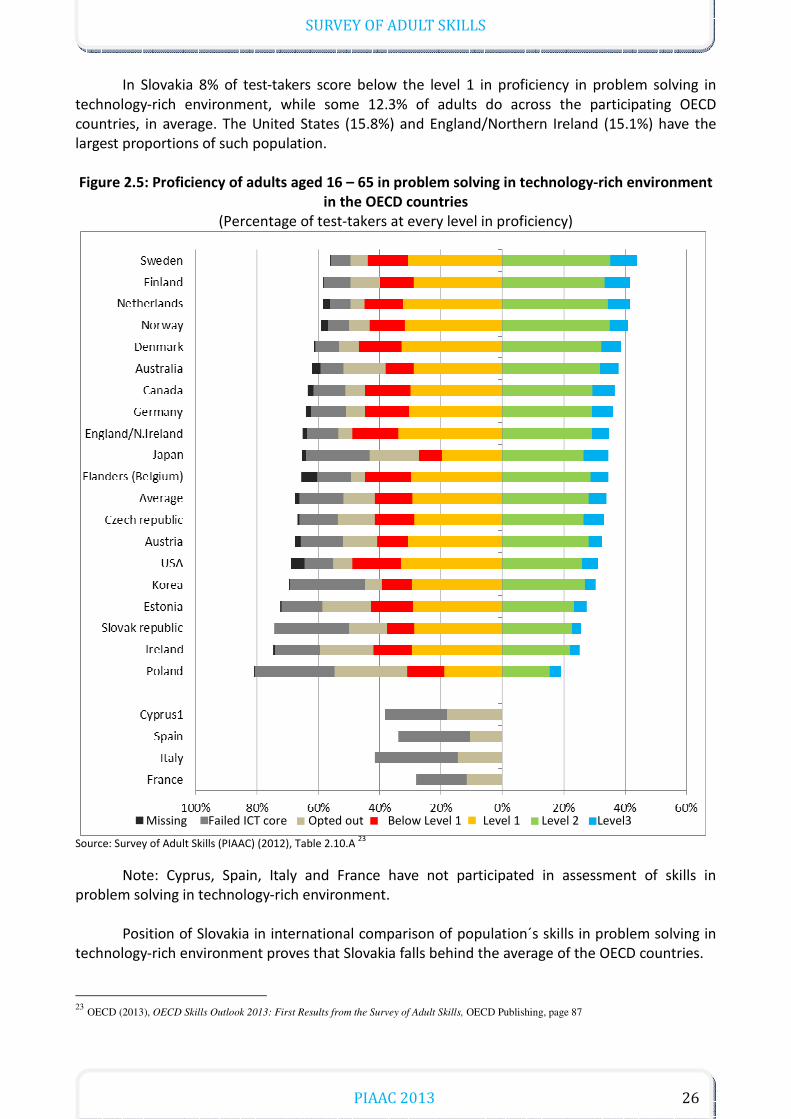
In Slovakia 8% of test-takers score below the level 1 in proficiency in problem solving in technology-rich environment, while some 12.3% of adults do across the participating OECD countries, in average. The United States (15.8%) and England/Northern Ireland (15.1%) have the largest proportions of such population. Figure 2.5: Proficiency of adults aged 16 – 65 in problem solving in technology-rich environment
in the OECD countries
(Percentage of test-takers at every level in proficiency)
Source: Survey of Adult Skills (PIAAC) (2012), Table 2.10.A
23
Note: Cyprus, Spain, Italy and France have not participated in assessment of skills in problem solving in technology-rich environment.
Position of Slovakia in international comparison of population´s skills in problem solving in technology-rich environment proves that Slovakia falls behind the average of the OECD countries.
23
OECD (2013), OECD Skills Outlook 2013: First Results from the Survey of Adult Skills, OECD Publishing, page 87
Missing Failed ICT core Opted out Below Level 1 Level 1 Level 2 Level3
SURVEY OF ADULT SKILLS
PIAAC 2013 27
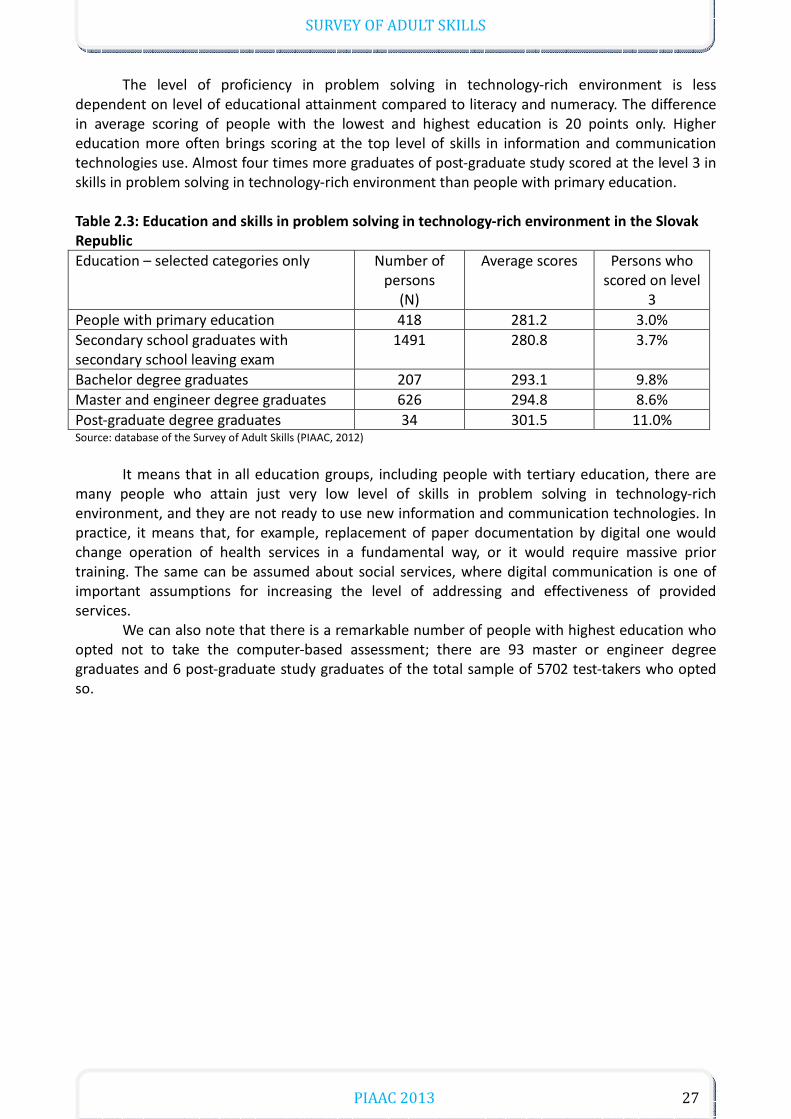
The level of proficiency in problem solving in technology-rich environment is less dependent on level of educational attainment compared to literacy and numeracy. The difference in average scoring of people with the lowest and highest education is 20 points only. Higher education more often brings scoring at the top level of skills in information and communication technologies use. Almost four times more graduates of post-graduate study scored at the level 3 in skills in problem solving in technology-rich environment than people with primary education.
Table 2.3: Education and skills in problem solving in technology-rich environment in the Slovak
Republic
Education – selected categories only Number of persons
(N)
Average scores Persons who scored on level
3
People with primary education 418 281.2 3.0%
Secondary school graduates with secondary school leaving exam
1491 280.8 3.7%
Bachelor degree graduates 207 293.1 9.8%
Master and engineer degree graduates 626 294.8 8.6%
Post-graduate degree graduates 34 301.5 11.0% Source: database of the Survey of Adult Skills (PIAAC, 2012)
It means that in all education groups, including people with tertiary education, there are
many people who attain just very low level of skills in problem solving in technology-rich environment, and they are not ready to use new information and communication technologies. In practice, it means that, for example, replacement of paper documentation by digital one would change operation of health services in a fundamental way, or it would require massive prior training. The same can be assumed about social services, where digital communication is one of important assumptions for increasing the level of addressing and effectiveness of provided services.
We can also note that there is a remarkable number of people with highest education who opted not to take the computer-based assessment; there are 93 master or engineer degree graduates and 6 post-graduate study graduates of the total sample of 5702 test-takers who opted so.
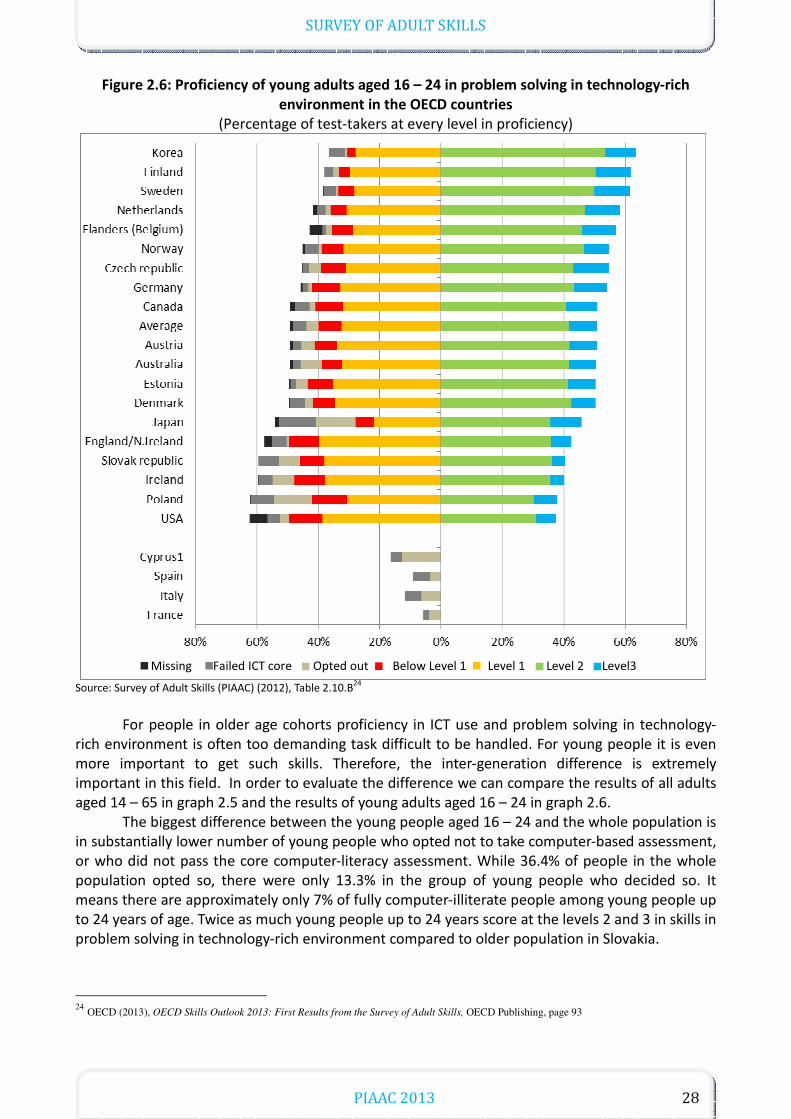
SURVEY OF ADULT SKILLS
PIAAC 2013 28
Figure 2.6: Proficiency of young adults aged 16 – 24 in problem solving in technology-rich
environment in the OECD countries
(Percentage of test-takers at every level in proficiency)
Source: Survey of Adult Skills (PIAAC) (2012), Table 2.10.B
24
For people in older age cohorts proficiency in ICT use and problem solving in technology-
rich environment is often too demanding task difficult to be handled. For young people it is even more important to get such skills. Therefore, the inter-generation difference is extremely important in this field. In order to evaluate the difference we can compare the results of all adults aged 14 – 65 in graph 2.5 and the results of young adults aged 16 – 24 in graph 2.6.
The biggest difference between the young people aged 16 – 24 and the whole population is in substantially lower number of young people who opted not to take computer-based assessment, or who did not pass the core computer-literacy assessment. While 36.4% of people in the whole population opted so, there were only 13.3% in the group of young people who decided so. It means there are approximately only 7% of fully computer-illiterate people among young people up to 24 years of age. Twice as much young people up to 24 years score at the levels 2 and 3 in skills in problem solving in technology-rich environment compared to older population in Slovakia.
24
OECD (2013), OECD Skills Outlook 2013: First Results from the Survey of Adult Skills, OECD Publishing, page 93
Missing Failed ICT core Opted out Below Level 1 Level 1 Level 2 Level3
SURVEY OF ADULT SKILLS
PIAAC 2013 29
Even if increasing skills in ICT use for problem solving among young people in Slovakia are fairly obvious it is necessary to draw the attention to the issue of relatively low level of such skills. If we compare difference between the average proficiency of population across the OECD countries and the whole population in Slovakia, Slovakia falls behind by 7 percentage25 points behind the average, but in case of young adults aged 16 – 24 the lag behind is remarkably higher, and it makes even 9 percentage points.
This fact explicitly shows that there is currently the process of international differentiation in information-processing skills going on. All countries accelerate the speed of increasing the skills in form of improving education. Change can be attained in approximately ten-year cycles. Countries differ in abilities or possibilities of increasing the quality of education. In Europe especially the Northern countries and the Netherlands succeeded in improving the education, where even older people score on basic levels in skills in problem solving in technology-rich environment. In global OECD prospect there is a remarkable success of South Korea and Australia in this field.
The problem of Slovakia in international contest for increase of proficiency in ICT use is the low level of proficiency of most of the population and significantly under-average level of proficiency of young people that will be unavoidably showed as increased lag behind in the next ten-year cycle.
25
OECD (2013), OECD Skills Outlook 2013: First Results from the Survey of Adult Skills, OECD Publishing, page 93
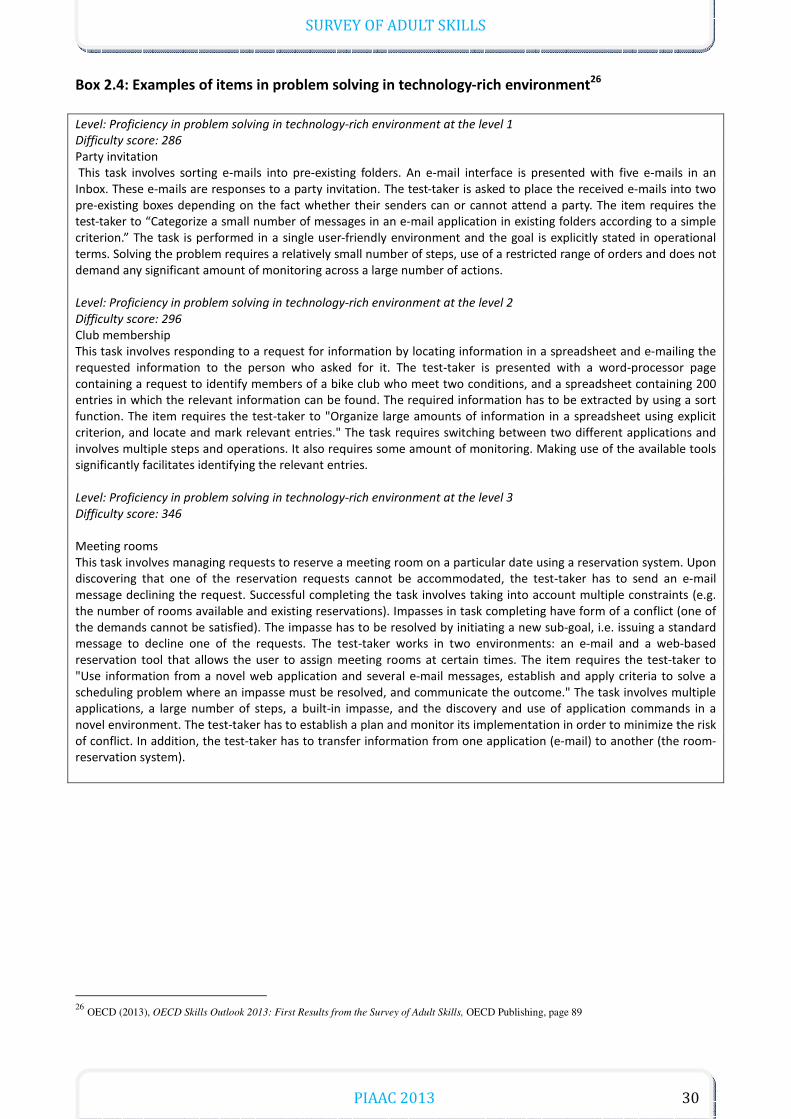
SURVEY OF ADULT SKILLS
PIAAC 2013 30
Box 2.4: Examples of items in problem solving in technology-rich environment26
Level: Proficiency in problem solving in technology-rich environment at the level 1
Difficulty score: 286
Party invitation This task involves sorting e-mails into pre-existing folders. An e-mail interface is presented with five e-mails in an Inbox. These e-mails are responses to a party invitation. The test-taker is asked to place the received e-mails into two pre-existing boxes depending on the fact whether their senders can or cannot attend a party. The item requires the test-taker to “Categorize a small number of messages in an e-mail application in existing folders according to a simple criterion.” The task is performed in a single user-friendly environment and the goal is explicitly stated in operational terms. Solving the problem requires a relatively small number of steps, use of a restricted range of orders and does not demand any significant amount of monitoring across a large number of actions. Level: Proficiency in problem solving in technology-rich environment at the level 2
Difficulty score: 296
Club membership This task involves responding to a request for information by locating information in a spreadsheet and e-mailing the requested information to the person who asked for it. The test-taker is presented with a word-processor page containing a request to identify members of a bike club who meet two conditions, and a spreadsheet containing 200 entries in which the relevant information can be found. The required information has to be extracted by using a sort function. The item requires the test-taker to "Organize large amounts of information in a spreadsheet using explicit criterion, and locate and mark relevant entries." The task requires switching between two different applications and involves multiple steps and operations. It also requires some amount of monitoring. Making use of the available tools significantly facilitates identifying the relevant entries. Level: Proficiency in problem solving in technology-rich environment at the level 3
Difficulty score: 346
Meeting rooms This task involves managing requests to reserve a meeting room on a particular date using a reservation system. Upon discovering that one of the reservation requests cannot be accommodated, the test-taker has to send an e-mail message declining the request. Successful completing the task involves taking into account multiple constraints (e.g. the number of rooms available and existing reservations). Impasses in task completing have form of a conflict (one of the demands cannot be satisfied). The impasse has to be resolved by initiating a new sub-goal, i.e. issuing a standard message to decline one of the requests. The test-taker works in two environments: an e-mail and a web-based reservation tool that allows the user to assign meeting rooms at certain times. The item requires the test-taker to "Use information from a novel web application and several e-mail messages, establish and apply criteria to solve a scheduling problem where an impasse must be resolved, and communicate the outcome." The task involves multiple applications, a large number of steps, a built-in impasse, and the discovery and use of application commands in a novel environment. The test-taker has to establish a plan and monitor its implementation in order to minimize the risk of conflict. In addition, the test-taker has to transfer information from one application (e-mail) to another (the room-reservation system).
26
OECD (2013), OECD Skills Outlook 2013: First Results from the Survey of Adult Skills, OECD Publishing, page 89
SURVEY OF ADULT SKILLS
PIAAC 2013 31
2.4 Correlations between literacy, numeracy and proficiency in
problem solving in technology-rich environment
There is a strong correlation between literacy and numeracy of population; higher proficiency in one of the fields is correlated with higher level in another. Such strong correlation appears in all countries, in which the PIAAC project was performed, including Slovakia. This fact needs to be highlighted, as both literacy and numeracy are based on two different types of skills. Correlation coefficient expressing strong relation between both proficiencies is at the level of 0.867 for the whole international database of test-takers, and at the level of 0.855 in Slovakia.27 In contrast to relation between literacy and numeracy, there is no such strong relation between literacy and numeracy on one hand and the proficiency in problem solving in technology-rich environment on the other hand. It seems to be natural, as there are still many people who score at higher level on literacy or numeracy scale, but they are computer-illiterate. Literacy and numeracy are traditionally supported skills, while the skills in problem solving using ICT tools are fully new from the point of view of older generation. Due to differences in nature of all three fields of skills there are significant differences across the OECD countries in the level of proficiency achieved by their population in each of the skills. (tab. 2.4) Slovakia scores at the average level in literacy of population, above-average level in numeracy and under-average level in problem solving in technology-rich environment in international comparison with the OECD countries. Some conclusions for consideration of strong and weak points of the education system in Slovakia can be inferred from this comparison from the point of view of creating three assessed skills of its population.
Slovakia´s strong points include ability to ensure average level on literacy and numeracy scale for the population that graduated from secondary level of education, on long-term basis.
Weak points are:
• Long-term stagnation of education focused on literacy and long-term drop of ability of education system to ensure increasing numeracy of population.
• Overall insufficient provision of at least average level of skills in problem solving in technology-rich environment (using ICT) for the population.
• Low ability of education system in taking the graduates from secondary schools and universities to the top levels on literacy and numeracy scale and in problem solving in technology-rich environment.
27
OECD (2013), OECD Skills Outlook 2013: First Results from the Survey of Adult Skills, OECD Publishing, page 85
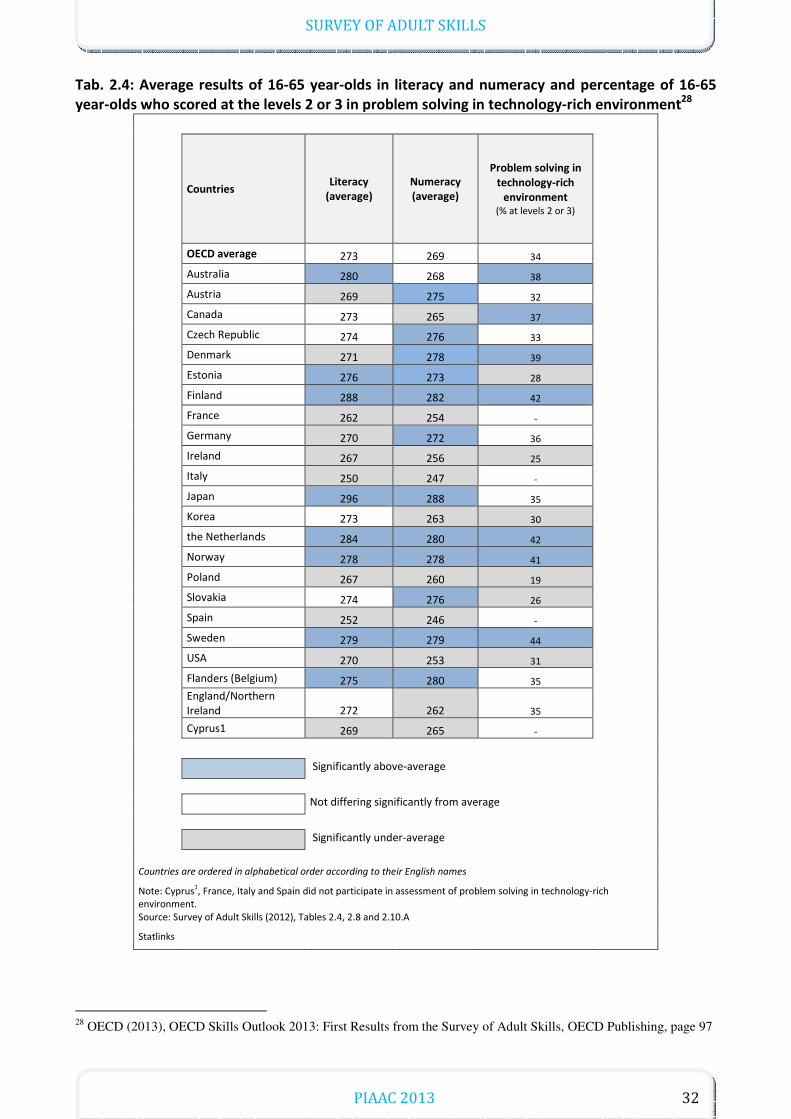
SURVEY OF ADULT SKILLS
PIAAC 2013 32
Tab. 2.4: Average results of 16-65 year-olds in literacy and numeracy and percentage of 16-65
year-olds who scored at the levels 2 or 3 in problem solving in technology-rich environment28
Countries Literacy
(average)
Numeracy
(average)
Problem solving in
technology-rich
environment
(% at levels 2 or 3)
OECD average 273 269 34
Australia 280 268 38
Austria 269 275 32
Canada 273 265 37
Czech Republic 274 276 33
Denmark 271 278 39
Estonia 276 273 28
Finland 288 282 42
France 262 254 -
Germany 270 272 36
Ireland 267 256 25
Italy 250 247 -
Japan 296 288 35
Korea 273 263 30
the Netherlands 284 280 42
Norway 278 278 41
Poland 267 260 19
Slovakia 274 276 26
Spain 252 246 -
Sweden 279 279 44
USA 270 253 31
Flanders (Belgium) 275 280 35
England/Northern Ireland 272 262 35
Cyprus1 269 265 -
Significantly above-average
Not differing significantly from average
Significantly under-average
Countries are ordered in alphabetical order according to their English names Note: Cyprus1, France, Italy and Spain did not participate in assessment of problem solving in technology-rich environment. Source: Survey of Adult Skills (2012), Tables 2.4, 2.8 and 2.10.A Statlinks
28
OECD (2013), OECD Skills Outlook 2013: First Results from the Survey of Adult Skills, OECD Publishing, page 97

SURVEY OF ADULT SKILLS
PIAAC 2013 33
Chapter 3
3. Significance of demographic and socio-economic factors in
differentiation of skills proficiency of adults
Differences in skills proficiency between men and women
Slovakia is a country where differences in skills proficiency between men and women (Figure 3.1) are minimum. The difference between men and women found for the level of numeracy is also small, and is the second smallest in the countries that participated in the survey. A smaller difference in numeracy between men and women, though in general small, is found only for Poland (Figure 3.3)29. Slovakia thus considerably differs from a major part of OECD countries by the similar levels of skills proficiency of men and women.
Figure 3.1: Literacy, numeracy and proficiency in problem solving in technology-rich
environments, by gender in the Slovak Republic (average values of score points)
Source: Database of the Survey of Adult Skills (PIAAC) (2012)
29
OECD (2013), OECD Skills Outlook 2013: First Results from the Survey of Adult Skills, OECD Publishing, p. 110
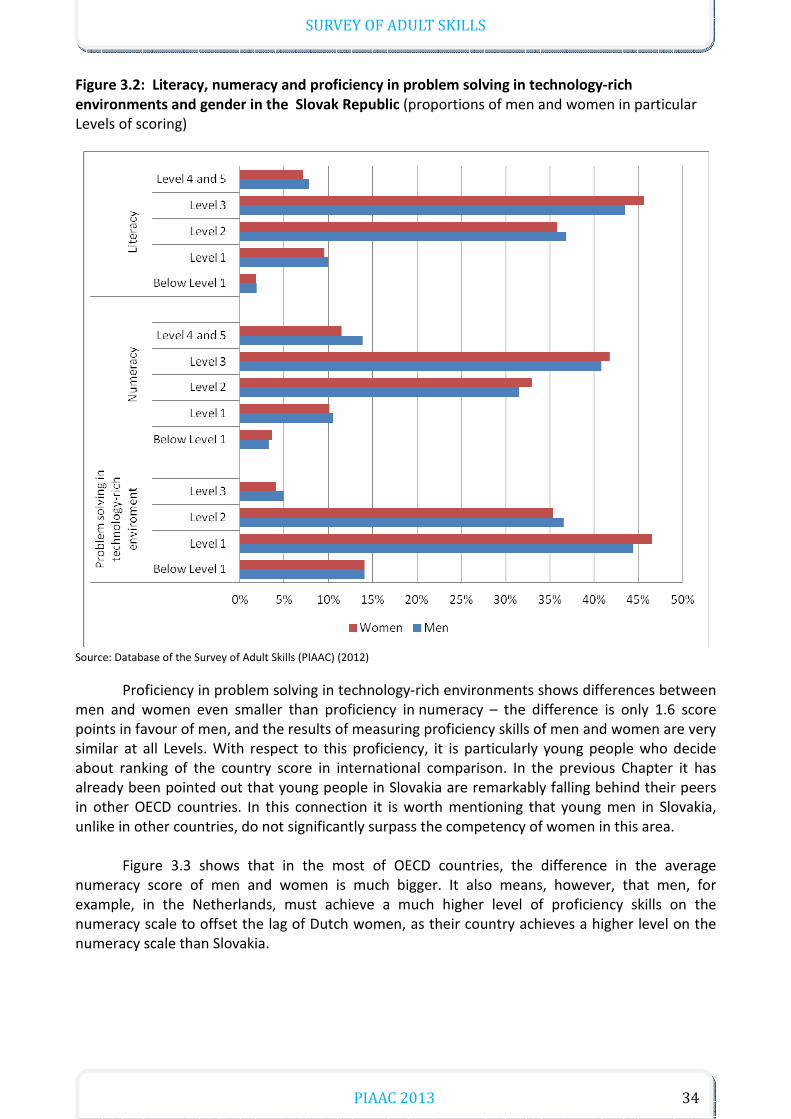
SURVEY OF ADULT SKILLS
PIAAC 2013 34
Figure 3.2: Literacy, numeracy and proficiency in problem solving in technology-rich
environments and gender in the Slovak Republic (proportions of men and women in particular Levels of scoring)
Source: Database of the Survey of Adult Skills (PIAAC) (2012)
Proficiency in problem solving in technology-rich environments shows differences between men and women even smaller than proficiency in numeracy – the difference is only 1.6 score points in favour of men, and the results of measuring proficiency skills of men and women are very similar at all Levels. With respect to this proficiency, it is particularly young people who decide about ranking of the country score in international comparison. In the previous Chapter it has already been pointed out that young people in Slovakia are remarkably falling behind their peers in other OECD countries. In this connection it is worth mentioning that young men in Slovakia, unlike in other countries, do not significantly surpass the competency of women in this area.
Figure 3.3 shows that in the most of OECD countries, the difference in the average numeracy score of men and women is much bigger. It also means, however, that men, for example, in the Netherlands, must achieve a much higher level of proficiency skills on the numeracy scale to offset the lag of Dutch women, as their country achieves a higher level on the numeracy scale than Slovakia.
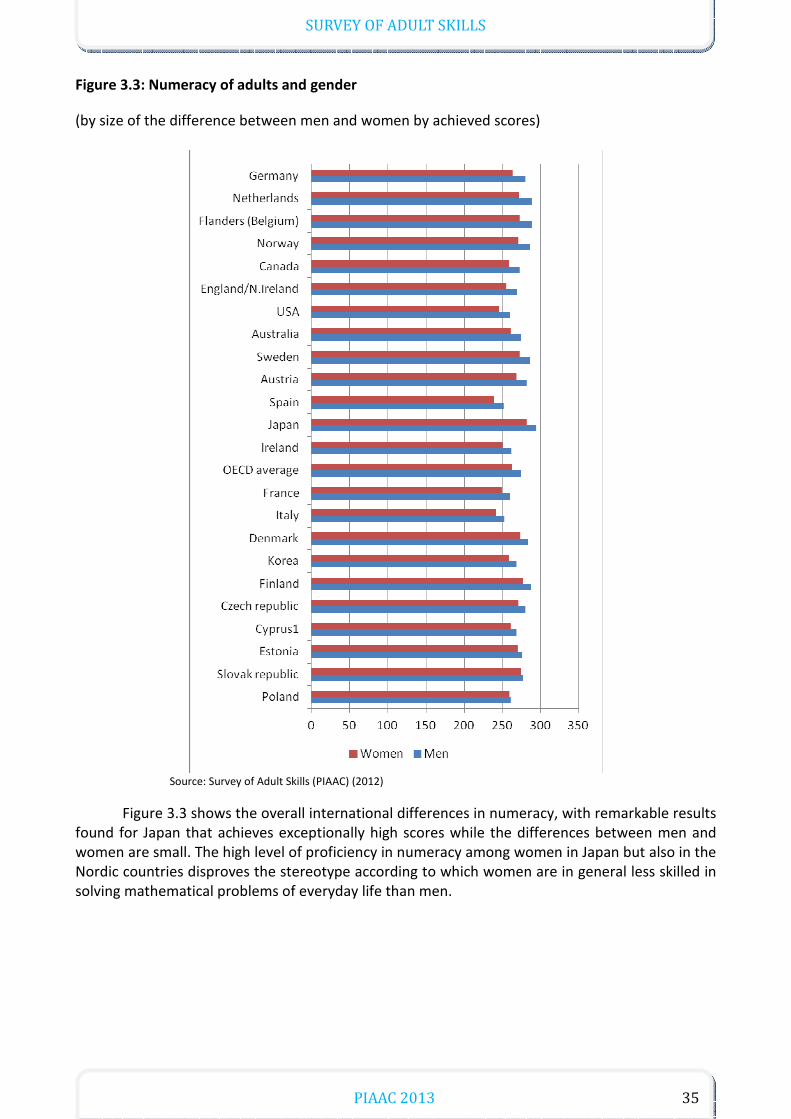
SURVEY OF ADULT SKILLS
PIAAC 2013 35
Figure 3.3: Numeracy of adults and gender
(by size of the difference between men and women by achieved scores)
Source: Survey of Adult Skills (PIAAC) (2012)
Figure 3.3 shows the overall international differences in numeracy, with remarkable results found for Japan that achieves exceptionally high scores while the differences between men and women are small. The high level of proficiency in numeracy among women in Japan but also in the Nordic countries disproves the stereotype according to which women are in general less skilled in solving mathematical problems of everyday life than men.
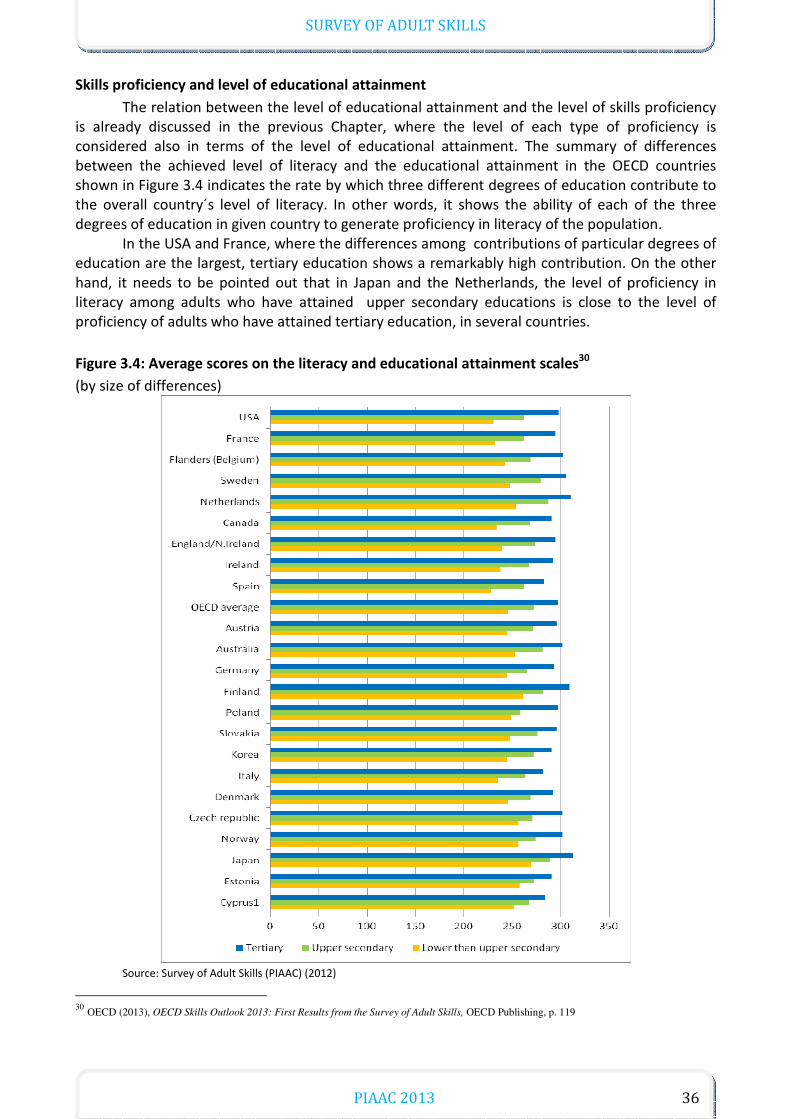
SURVEY OF ADULT SKILLS
PIAAC 2013 36
Skills proficiency and level of educational attainment
The relation between the level of educational attainment and the level of skills proficiency is already discussed in the previous Chapter, where the level of each type of proficiency is considered also in terms of the level of educational attainment. The summary of differences between the achieved level of literacy and the educational attainment in the OECD countries shown in Figure 3.4 indicates the rate by which three different degrees of education contribute to the overall country´s level of literacy. In other words, it shows the ability of each of the three degrees of education in given country to generate proficiency in literacy of the population.
In the USA and France, where the differences among contributions of particular degrees of education are the largest, tertiary education shows a remarkably high contribution. On the other hand, it needs to be pointed out that in Japan and the Netherlands, the level of proficiency in literacy among adults who have attained upper secondary educations is close to the level of proficiency of adults who have attained tertiary education, in several countries.
Figure 3.4: Average scores on the literacy and educational attainment scales30
(by size of differences)
Source: Survey of Adult Skills (PIAAC) (2012)
30
OECD (2013), OECD Skills Outlook 2013: First Results from the Survey of Adult Skills, OECD Publishing, p. 119
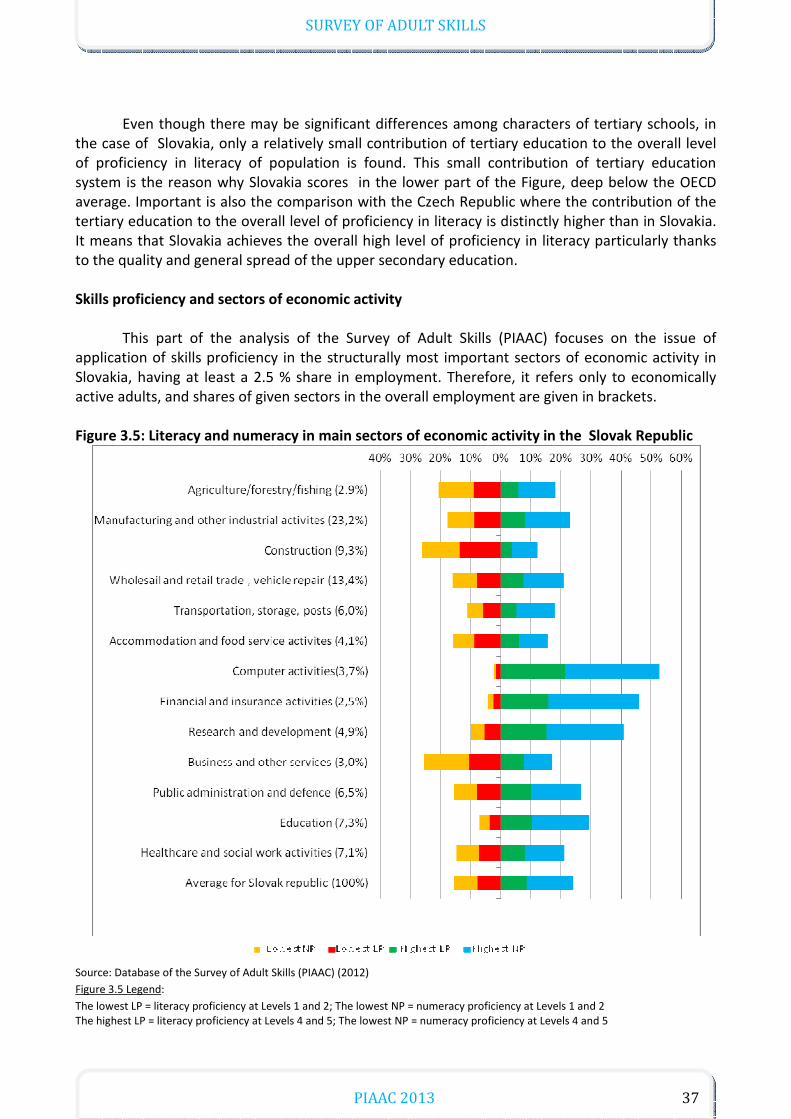
SURVEY OF ADULT SKILLS
PIAAC 2013 37
Even though there may be significant differences among characters of tertiary schools, in
the case of Slovakia, only a relatively small contribution of tertiary education to the overall level of proficiency in literacy of population is found. This small contribution of tertiary education system is the reason why Slovakia scores in the lower part of the Figure, deep below the OECD average. Important is also the comparison with the Czech Republic where the contribution of the tertiary education to the overall level of proficiency in literacy is distinctly higher than in Slovakia. It means that Slovakia achieves the overall high level of proficiency in literacy particularly thanks to the quality and general spread of the upper secondary education. Skills proficiency and sectors of economic activity
This part of the analysis of the Survey of Adult Skills (PIAAC) focuses on the issue of application of skills proficiency in the structurally most important sectors of economic activity in Slovakia, having at least a 2.5 % share in employment. Therefore, it refers only to economically active adults, and shares of given sectors in the overall employment are given in brackets.
Figure 3.5: Literacy and numeracy in main sectors of economic activity in the Slovak Republic
Source: Database of the Survey of Adult Skills (PIAAC) (2012)
Figure 3.5 Legend:
The lowest LP = literacy proficiency at Levels 1 and 2; The lowest NP = numeracy proficiency at Levels 1 and 2 The highest LP = literacy proficiency at Levels 4 and 5; The lowest NP = numeracy proficiency at Levels 4 and 5
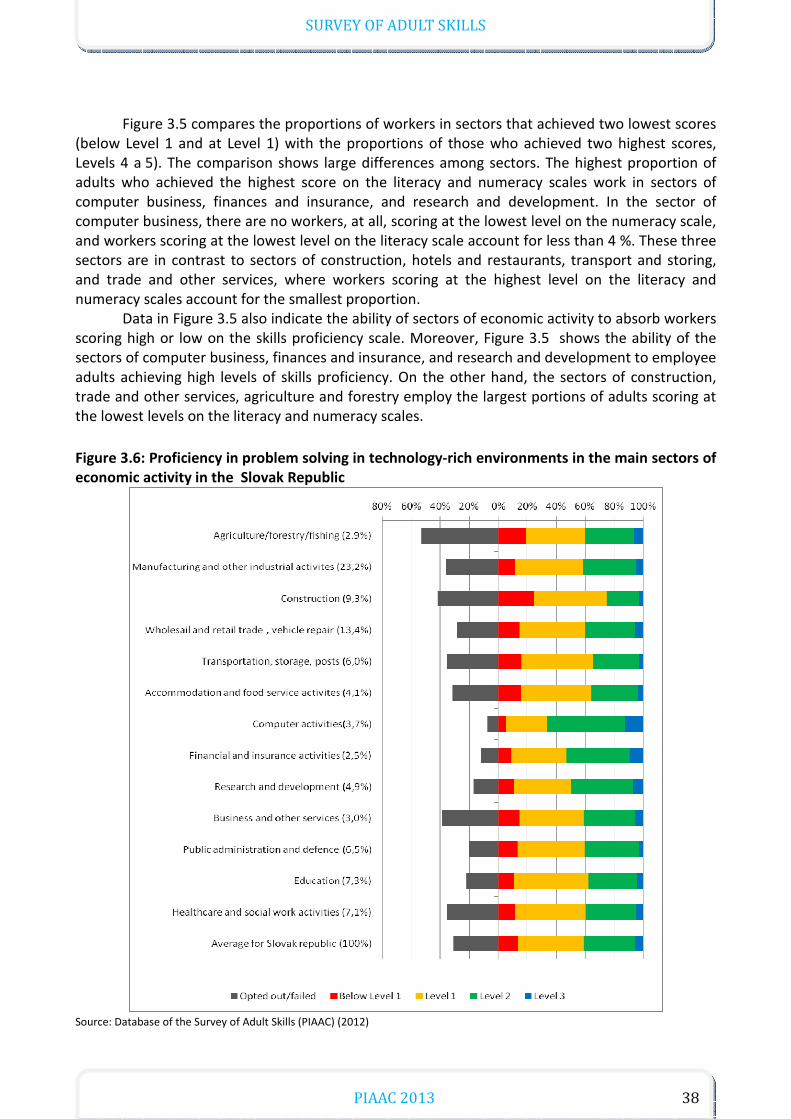
SURVEY OF ADULT SKILLS
PIAAC 2013 38
Figure 3.5 compares the proportions of workers in sectors that achieved two lowest scores
(below Level 1 and at Level 1) with the proportions of those who achieved two highest scores, Levels 4 a 5). The comparison shows large differences among sectors. The highest proportion of adults who achieved the highest score on the literacy and numeracy scales work in sectors of computer business, finances and insurance, and research and development. In the sector of computer business, there are no workers, at all, scoring at the lowest level on the numeracy scale, and workers scoring at the lowest level on the literacy scale account for less than 4 %. These three sectors are in contrast to sectors of construction, hotels and restaurants, transport and storing, and trade and other services, where workers scoring at the highest level on the literacy and numeracy scales account for the smallest proportion.
Data in Figure 3.5 also indicate the ability of sectors of economic activity to absorb workers scoring high or low on the skills proficiency scale. Moreover, Figure 3.5 shows the ability of the sectors of computer business, finances and insurance, and research and development to employee adults achieving high levels of skills proficiency. On the other hand, the sectors of construction, trade and other services, agriculture and forestry employ the largest portions of adults scoring at the lowest levels on the literacy and numeracy scales.
Figure 3.6: Proficiency in problem solving in technology-rich environments in the main sectors of
economic activity in the Slovak Republic
Source: Database of the Survey of Adult Skills (PIAAC) (2012)
SURVEY OF ADULT SKILLS
PIAAC 2013 39
In assessing the results, attention needs to be drawn to the large extent of specific activities that fall within the sectors specified only roughly. For example, in the business sectors and sectors of other services, marketing agencies and tax consultants ended up in the same group of activities as hairdressers and dry cleaners. Sectors of strongly differentiated activities, such as health care and social services, naturally absorb not only a large portion of people achieving the highest levels on proficiency scale but also people achieving the lowest levels on proficiency scale. Figure 3.6 shows a review of proficiency levels of workers working in sectors requiring proficiency in problem solving in technology-rich environments. The data indicate how people achieving different levels of proficiency succeed in using ICT. It is only natural that the first place is taken by the sector of computer activities, followed by the sectors of finances, insurance, and research and development. Except for these three sectors, there are no other sectors where the rate of computerization would be so high that it would require above-average portion of workers achieving two highest levels of proficiency. On the contrary, jobs in the sectors of construction and agriculture etc. have the lowest requirements for these competencies, when the portion of those who “gave up/failed“ is considered. In assessing individual sectors, the size of portion of people who gave up – opted out of the computer based assessment, or had no computer experience needs to be considered. Most of these people work in agriculture, business and other services, transport and warehousing, but also in the health care and social services. These four sectors show the highest number of jobs that do not require any ICT experience. Low levels of competencies related to using ICT may be a handicap for people working in health care and social services due to generally expected computerization of these areas, leading to intensified personalization and specifically targeted services provided to patients and clients in the areas of health care as well as social services.
Skills and occupations
Available outputs of the survey allow to consider also the relation between the average level of each of the tested skills, and occupations. Because of the large number of existing occupations, the data from the survey are reduced into nine major groups of jobs in accordance with the International Standard Classification of Occupations (ISCO-88), or the National Classification of Occupations (KZAM). Under this classification, occupations are classified into nine major groups, as listed in the Figure 3.7 Legend.
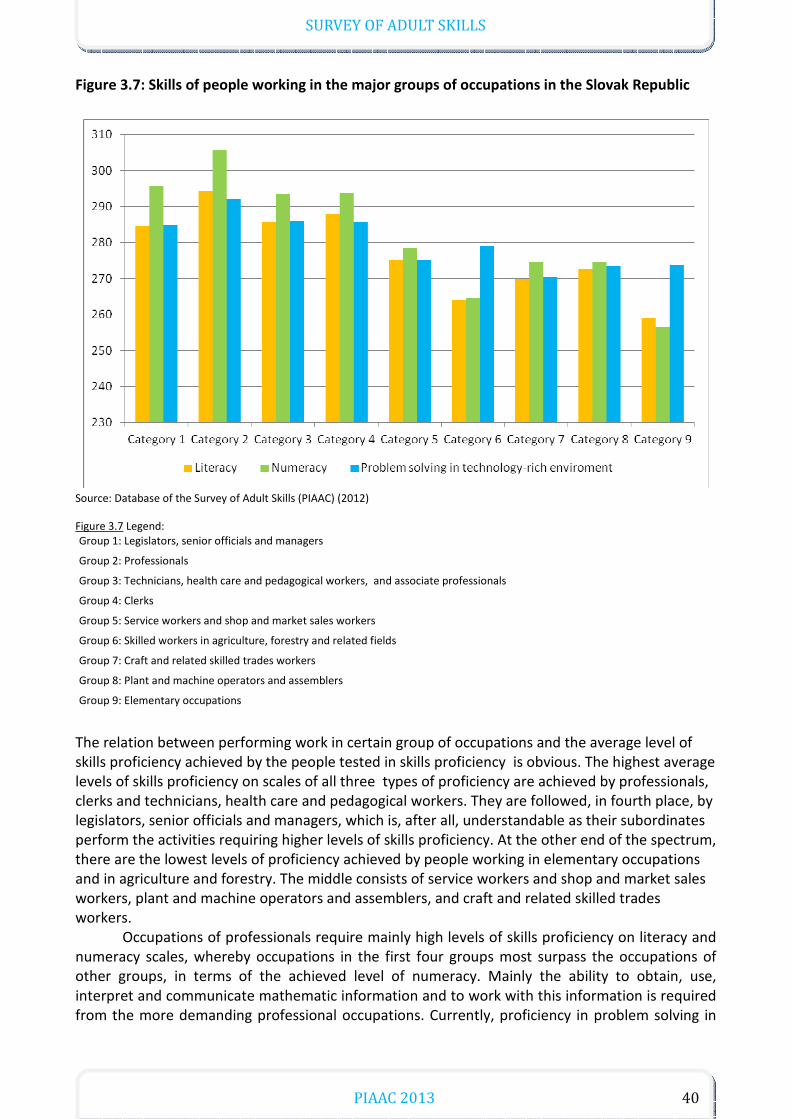
SURVEY OF ADULT SKILLS
PIAAC 2013 40
Figure 3.7: Skills of people working in the major groups of occupations in the Slovak Republic
Source: Database of the Survey of Adult Skills (PIAAC) (2012)
Figure 3.7 Legend: Group 1: Legislators, senior officials and managers
Group 2: Professionals
Group 3: Technicians, health care and pedagogical workers, and associate professionals
Group 4: Clerks
Group 5: Service workers and shop and market sales workers
Group 6: Skilled workers in agriculture, forestry and related fields
Group 7: Craft and related skilled trades workers
Group 8: Plant and machine operators and assemblers
Group 9: Elementary occupations
The relation between performing work in certain group of occupations and the average level of skills proficiency achieved by the people tested in skills proficiency is obvious. The highest average levels of skills proficiency on scales of all three types of proficiency are achieved by professionals, clerks and technicians, health care and pedagogical workers. They are followed, in fourth place, by legislators, senior officials and managers, which is, after all, understandable as their subordinates perform the activities requiring higher levels of skills proficiency. At the other end of the spectrum, there are the lowest levels of proficiency achieved by people working in elementary occupations and in agriculture and forestry. The middle consists of service workers and shop and market sales workers, plant and machine operators and assemblers, and craft and related skilled trades workers.
Occupations of professionals require mainly high levels of skills proficiency on literacy and numeracy scales, whereby occupations in the first four groups most surpass the occupations of other groups, in terms of the achieved level of numeracy. Mainly the ability to obtain, use, interpret and communicate mathematic information and to work with this information is required from the more demanding professional occupations. Currently, proficiency in problem solving in
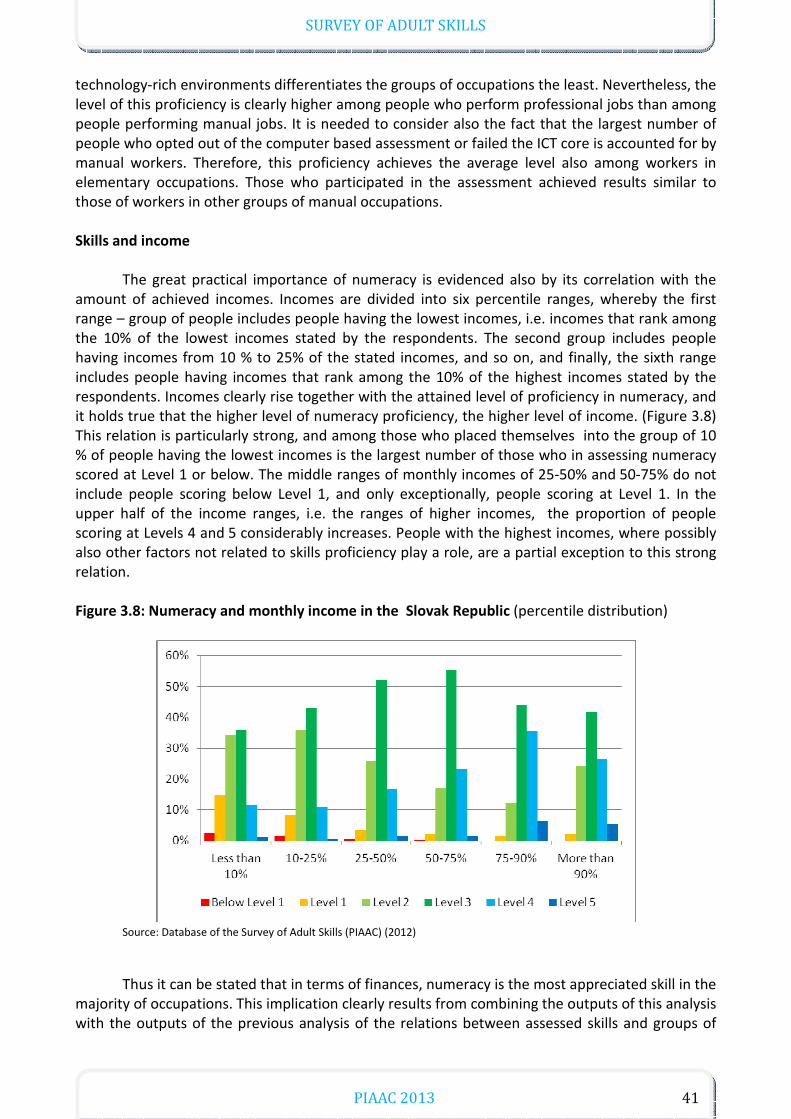
SURVEY OF ADULT SKILLS
PIAAC 2013 41
technology-rich environments differentiates the groups of occupations the least. Nevertheless, the level of this proficiency is clearly higher among people who perform professional jobs than among people performing manual jobs. It is needed to consider also the fact that the largest number of people who opted out of the computer based assessment or failed the ICT core is accounted for by manual workers. Therefore, this proficiency achieves the average level also among workers in elementary occupations. Those who participated in the assessment achieved results similar to those of workers in other groups of manual occupations.
Skills and income
The great practical importance of numeracy is evidenced also by its correlation with the amount of achieved incomes. Incomes are divided into six percentile ranges, whereby the first range – group of people includes people having the lowest incomes, i.e. incomes that rank among the 10% of the lowest incomes stated by the respondents. The second group includes people having incomes from 10 % to 25% of the stated incomes, and so on, and finally, the sixth range includes people having incomes that rank among the 10% of the highest incomes stated by the respondents. Incomes clearly rise together with the attained level of proficiency in numeracy, and it holds true that the higher level of numeracy proficiency, the higher level of income. (Figure 3.8) This relation is particularly strong, and among those who placed themselves into the group of 10 % of people having the lowest incomes is the largest number of those who in assessing numeracy scored at Level 1 or below. The middle ranges of monthly incomes of 25-50% and 50-75% do not include people scoring below Level 1, and only exceptionally, people scoring at Level 1. In the upper half of the income ranges, i.e. the ranges of higher incomes, the proportion of people scoring at Levels 4 and 5 considerably increases. People with the highest incomes, where possibly also other factors not related to skills proficiency play a role, are a partial exception to this strong relation. Figure 3.8: Numeracy and monthly income in the Slovak Republic (percentile distribution)
Source: Database of the Survey of Adult Skills (PIAAC) (2012)
Thus it can be stated that in terms of finances, numeracy is the most appreciated skill in the majority of occupations. This implication clearly results from combining the outputs of this analysis with the outputs of the previous analysis of the relations between assessed skills and groups of

SURVEY OF ADULT SKILLS
PIAAC 2013 42
occupations. The strong relation between the level of numeracy and achieved level of income may be a strong argument in discussing importance of teaching mathematics at secondary schools. Reducing the importance of fostering numeracy at secondary schools and shifting numeracy skills to other subjects actually reduces possibilities of the young generation to get better-paid jobs in the future. The relation between the skills proficiency in numeracy and the level of income is relatively well known. However, the Survey of Adult Skills allows to verify how successful is the ability to use ICT means to solve problems, in relation with the amount of incomes. In Slovakia, this relation is already existing, and it is reasonable to expect this relation to be further enforced (Figure 3.9).
Figure 3.9: Proficiency in problem solving in technology-rich environments and monthly incomes
in the Slovak Republic
(percentile distribution)
Source: Database of the Survey of Adult Skills (PIAAC) (2012)
Figure 3.9 shows that the correlation between the skills proficiency in using ICT and the amount of incomes is equally strong as the correlation between the amount of incomes and the proficiency in numeracy. For the purpose of verifying this relation we used six equally divided percentile ranges. In groups of higher incomes, the proportion of people that in assessing the proficiency in using ICT scored at Levels 2 and 3 clearly grows. Unlike numeracy, this proficiency is apparently higher also among people whose incomes rank among the 10 % of highest incomes. Preparation of young people to command ICT, and the use of ICT to solve practical problems is thus, together with developing their proficiency in numeracy, one of the main preconditions of getting higher incomes in the future. Skills proficiency and social background
The last part of this chapter presents the results of the Survey of Adult Skills (PIAAC) that evaluate the extent of influence of social status of parents by their attained education, on the level of skills proficiency of their children. The survey examined the attained education of respondents´ parents, which allows to correlate it with the results achieved by the respondents in assessing their skills. Based on the size of the relation between social status (education) of parents and social status (education) of their children, one of the main measures of social justice in the society is derived. It indicates the proportion of inherited social backgrounds (when judges´ children
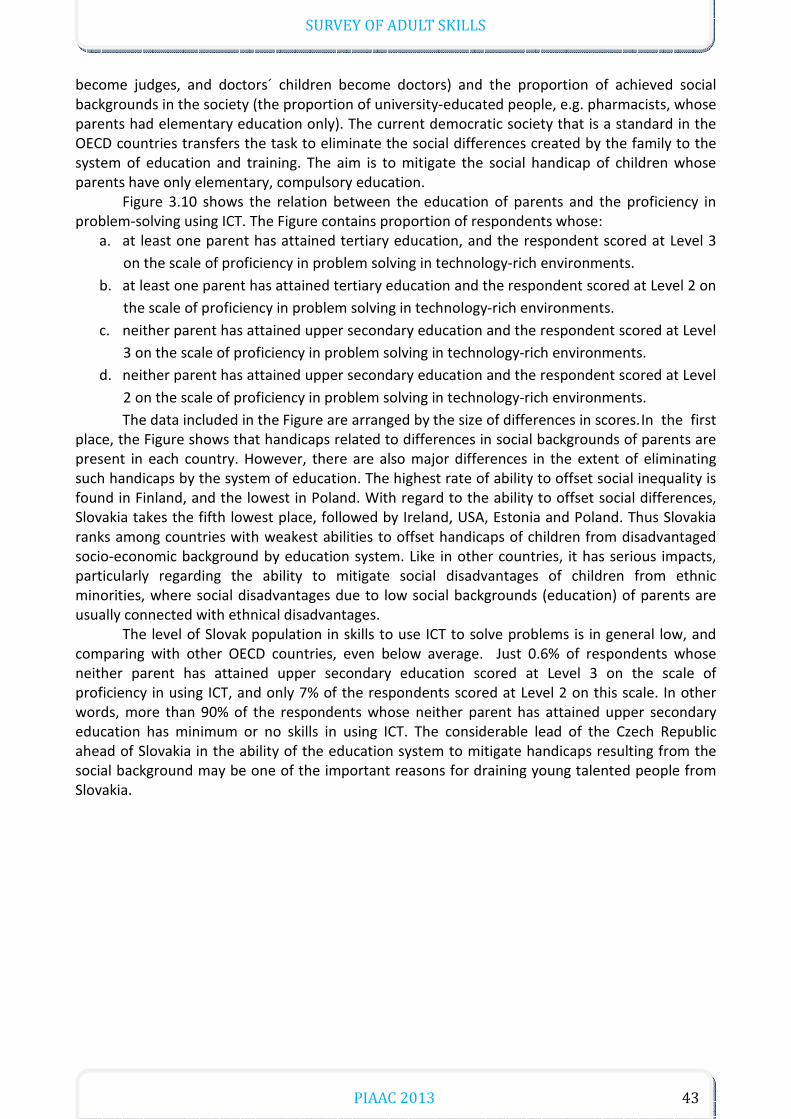
SURVEY OF ADULT SKILLS
PIAAC 2013 43
become judges, and doctors´ children become doctors) and the proportion of achieved social backgrounds in the society (the proportion of university-educated people, e.g. pharmacists, whose parents had elementary education only). The current democratic society that is a standard in the OECD countries transfers the task to eliminate the social differences created by the family to the system of education and training. The aim is to mitigate the social handicap of children whose parents have only elementary, compulsory education. Figure 3.10 shows the relation between the education of parents and the proficiency in problem-solving using ICT. The Figure contains proportion of respondents whose:
a. at least one parent has attained tertiary education, and the respondent scored at Level 3
on the scale of proficiency in problem solving in technology-rich environments.
b. at least one parent has attained tertiary education and the respondent scored at Level 2 on
the scale of proficiency in problem solving in technology-rich environments.
c. neither parent has attained upper secondary education and the respondent scored at Level
3 on the scale of proficiency in problem solving in technology-rich environments.
d. neither parent has attained upper secondary education and the respondent scored at Level
2 on the scale of proficiency in problem solving in technology-rich environments.
The data included in the Figure are arranged by the size of differences in scores. In the first place, the Figure shows that handicaps related to differences in social backgrounds of parents are present in each country. However, there are also major differences in the extent of eliminating such handicaps by the system of education. The highest rate of ability to offset social inequality is found in Finland, and the lowest in Poland. With regard to the ability to offset social differences, Slovakia takes the fifth lowest place, followed by Ireland, USA, Estonia and Poland. Thus Slovakia ranks among countries with weakest abilities to offset handicaps of children from disadvantaged socio-economic background by education system. Like in other countries, it has serious impacts, particularly regarding the ability to mitigate social disadvantages of children from ethnic minorities, where social disadvantages due to low social backgrounds (education) of parents are usually connected with ethnical disadvantages. The level of Slovak population in skills to use ICT to solve problems is in general low, and comparing with other OECD countries, even below average. Just 0.6% of respondents whose neither parent has attained upper secondary education scored at Level 3 on the scale of proficiency in using ICT, and only 7% of the respondents scored at Level 2 on this scale. In other words, more than 90% of the respondents whose neither parent has attained upper secondary education has minimum or no skills in using ICT. The considerable lead of the Czech Republic ahead of Slovakia in the ability of the education system to mitigate handicaps resulting from the social background may be one of the important reasons for draining young talented people from Slovakia.
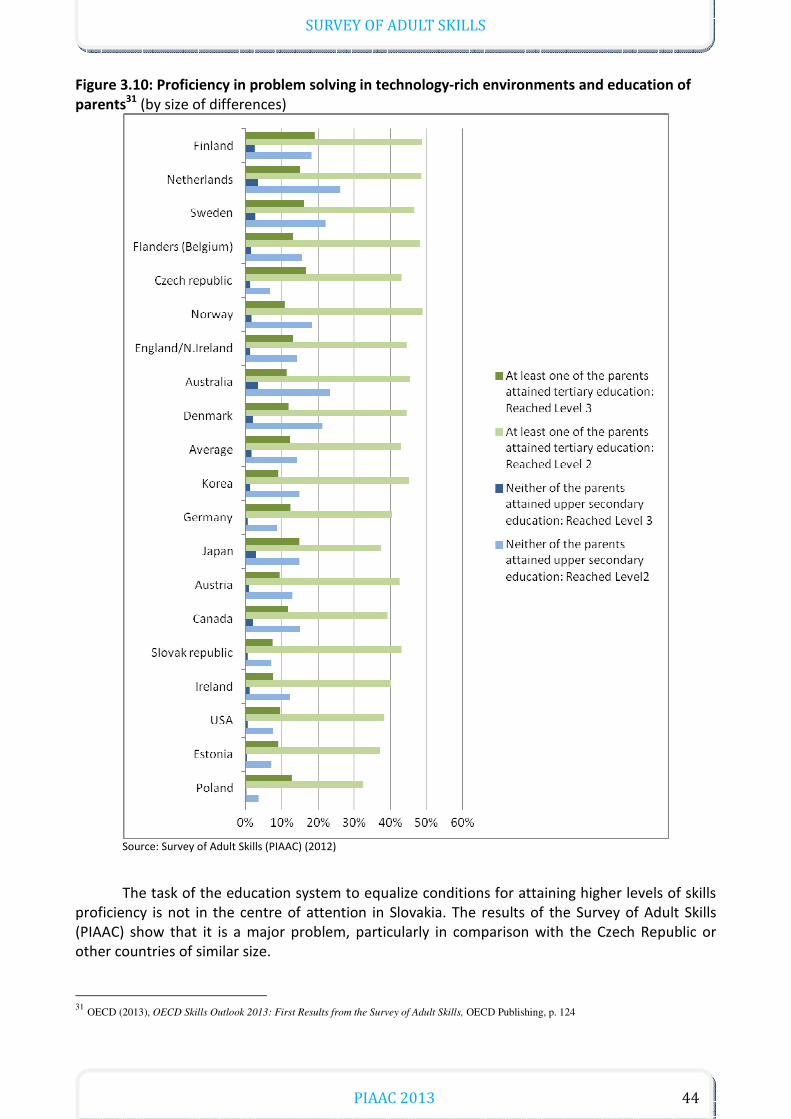
SURVEY OF ADULT SKILLS
PIAAC 2013 44
Figure 3.10: Proficiency in problem solving in technology-rich environments and education of
parents31
(by size of differences)
Source: Survey of Adult Skills (PIAAC) (2012)
The task of the education system to equalize conditions for attaining higher levels of skills proficiency is not in the centre of attention in Slovakia. The results of the Survey of Adult Skills (PIAAC) show that it is a major problem, particularly in comparison with the Czech Republic or other countries of similar size.
31
OECD (2013), OECD Skills Outlook 2013: First Results from the Survey of Adult Skills, OECD Publishing, p. 124

SURVEY OF ADULT SKILLS
PIAAC 2013 45
Chapter 4
4. Regional differentiation of skills proficiency of adults in Slovakia
Skills proficiency and regions of Slovakia
Thanks to the large number of people included in the Survey of Adult Skills (PIAAC) it is possible to examine also basic differences in scoring by population of particular regions and districts of Slovakia. Comparison can be made for the level of average scoring, but it is impossible to compare the regions in the same manner as the results for individual countries are compared. The comparison of average results is given in Table 4.1 that shows that the best scoring on all three scales of skills proficiency are achieved by the population of the Trenčín Region, while the worst are achieved by the population of the Prešov Region, and the differences are rather significant. For example, in the case of literacy, it is 35 score points, while for numeracy it is 26 score points, and proficiency in problem solving in technology-rich environments (by ICT) as much as 40 score points. It is to be noted that all three scales of proficiency in literacy and numeracy as well as proficiency in problem solving in technology-rich environments by ICT are graded by 50 score points. The differences between the Trenčín Region and the Prešov Region are thus getting closer, certainly for ICT, to the difference of one score point, which is a major difference. From another point of view, the difference of 35 score points is as much as the difference in literacy among adults having elementary education and upper secondary education. Table 4.1: Skills proficiency of adults, by regions
Region Literacy Numeracy Problem solving by
ICT
Bratislava 285 289 289
Trnava 267 266 280
Trenčín 291 297 292
Nitra 269 267 279
Žilina 279 286 282
Banská Bystrica 273 273 280
Prešov 256 257 266
Košice 276 276 281
The score achieved by the population of the Trenčín Region is followed by the score achieved by the population of the Bratislava, Žilina and Košice Regions. The second lowest score, after the score of the Prešov Region, is achieved by the population Trnava Region. The reasons for these differences among regions can be explained by the degree of their industrialization and urbanization.
The differences among districts are given in form of Maps 4.1 and 4.2 on the following
pages.
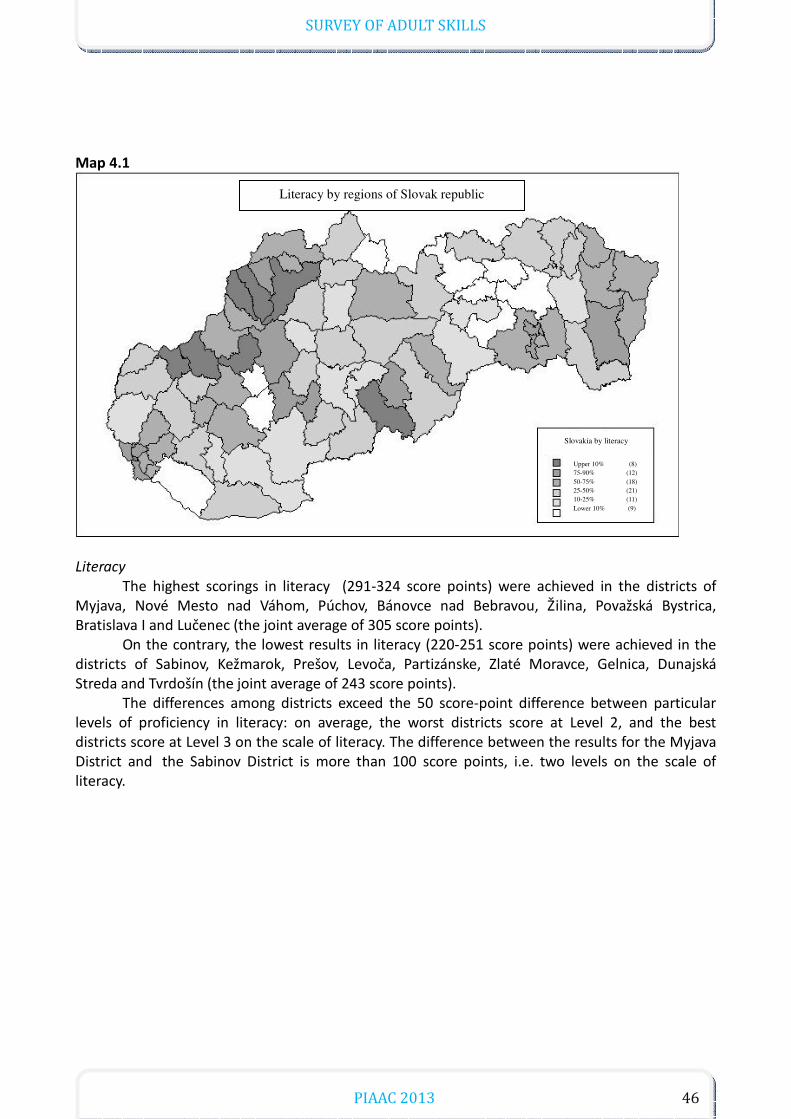
SURVEY OF ADULT SKILLS
PIAAC 2013 46
Map 4.1
Literacy
The highest scorings in literacy (291-324 score points) were achieved in the districts of Myjava, Nové Mesto nad Váhom, Púchov, Bánovce nad Bebravou, Žilina, Považská Bystrica, Bratislava I and Lučenec (the joint average of 305 score points).
On the contrary, the lowest results in literacy (220-251 score points) were achieved in the districts of Sabinov, Kežmarok, Prešov, Levoča, Partizánske, Zlaté Moravce, Gelnica, Dunajská Streda and Tvrdošín (the joint average of 243 score points).
The differences among districts exceed the 50 score-point difference between particular levels of proficiency in literacy: on average, the worst districts score at Level 2, and the best districts score at Level 3 on the scale of literacy. The difference between the results for the Myjava District and the Sabinov District is more than 100 score points, i.e. two levels on the scale of literacy.
Literacy by regions of Slovak republic
Slovakia by literacy
Upper 10% (8)
75-90% (12)
50-75% (18)
25-50% (21) 10-25% (11)
Lower 10% (9)
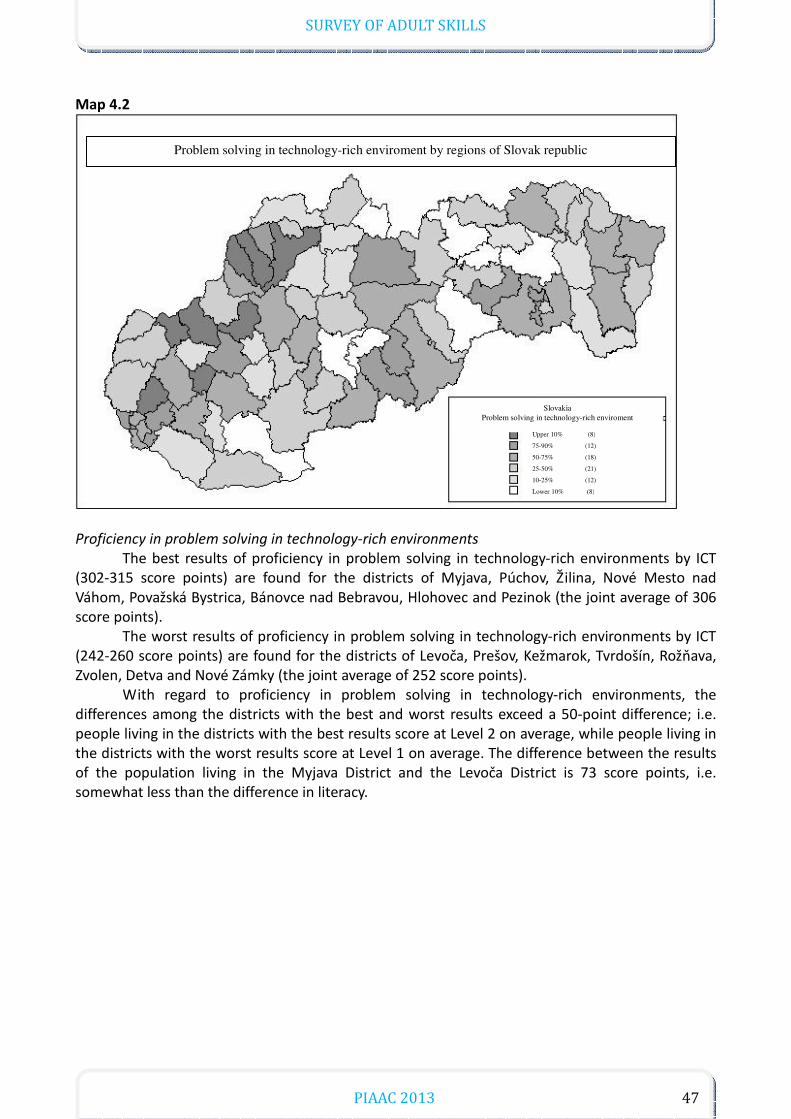
SURVEY OF ADULT SKILLS
PIAAC 2013 47
Map 4.2
Proficiency in problem solving in technology-rich environments
The best results of proficiency in problem solving in technology-rich environments by ICT (302-315 score points) are found for the districts of Myjava, Púchov, Žilina, Nové Mesto nad Váhom, Považská Bystrica, Bánovce nad Bebravou, Hlohovec and Pezinok (the joint average of 306 score points).
The worst results of proficiency in problem solving in technology-rich environments by ICT (242-260 score points) are found for the districts of Levoča, Prešov, Kežmarok, Tvrdošín, Rožňava, Zvolen, Detva and Nové Zámky (the joint average of 252 score points).
With regard to proficiency in problem solving in technology-rich environments, the differences among the districts with the best and worst results exceed a 50-point difference; i.e. people living in the districts with the best results score at Level 2 on average, while people living in the districts with the worst results score at Level 1 on average. The difference between the results of the population living in the Myjava District and the Levoča District is 73 score points, i.e. somewhat less than the difference in literacy.
Problem solving in technology-rich enviroment by regions of Slovak republic
Slovakia
Problem solving in technology-rich enviroment
Upper 10% (8)
75-90% (12)
50-75% (18)
25-50% (21) 10-25% (12)
Lower 10% (8)

SURVEY OF ADULT SKILLS
PIAAC 2013 48
Chapter 5
5. Survey results by nationality of respondents
The target population of the PIAAC survey comprised adults of 16-65 year-olds, living in the
country at the time of collecting data. The adults were included in the survey regardless of their citizenships, nationalities or languages. The recommended minimum size of the sample in the case of country using one language only was 4 500 to 5 000 respondents depending on the number of the tested domains (literacy, numeracy and problem solving). Where a country participating in the survey used also another language, the sample was adequately increased by the size of the population using the other language32.
In the case of Slovakia, several nationalities living within the territory of Slovakia participated in the international survey of PIAAC. The respondents were given an option to participate in the survey in the Slovak or Hungarian language. Therefore, the sample size was increased so that it would be possible to interpret the survey results with regard to the nationality and/or the language of testing33. The sample size in the Slovak Republic was thus 9 280 persons, and the achieved sample of respondents with interpreted data has the value of 5 702 valid interviews. The questionnaires included questions that identified not only the nationality of respondents but also the first language learned as a child, or the language used to communicate in the household. The analysis included the basic question: Is the nationality a decisive factor for a different level of skills proficiency?
5.1 Participation of various nationalities in the survey
The information of the nationality was obtained for 78.6% of the respondents. The Slovak
nationality was stated by 90.1% of the respondents, while 8.7% of the respondents declared the Hungarian nationality. The remaining 1.2% of the respondents were of other nationalities. The question “Which was the first language you learned as a child and you still understand?“ was answered by 99.7 % of the respondents. The Slovak language was stated by 83.4 % of the respondents, the Hungarian language by 9.6 % , the Roma language by 3.7 %, the Czech language by 1.3 %, the Polish language by 0.3 %, the German language by 0.2 %, and another language was stated by about 1.4 % of the respondents.
When combining this question with the variable of Slovak or Hungarian nationality, we see that in the case of 91.8 % of Slovaks (included in the group of the respondents), the first language is Slovak, 3.5 % of Slovaks indicate the Roma language as their first language, 1.9 % indicate the Hungarian language. Finally the Czech language is stated by 1.0 % of Slovaks, the Polish language by 0.4 % of Slovaks, the German language by 0.2 %, and another language was mentioned by 1.2 % of Slovaks. Regarding the respondents of Hungarian nationality, 96.4 % of them indicated the Hungarian language, 2.6 % the Roma language, and 1.0 % the Slovak language. The respondents of other nationalities indicated the Czech language in 38.8 %, the Roma language in 28.2 %, and another language in as many as in 20.1 % of responses. To a much smaller extent, the Slovak (5.7
32
OECD (2013), OECD Skills Outlook 2013: First Results from the Survey of Adult Skills, OECD Publishing, p. 50-56 33
For more detail, see p. 51
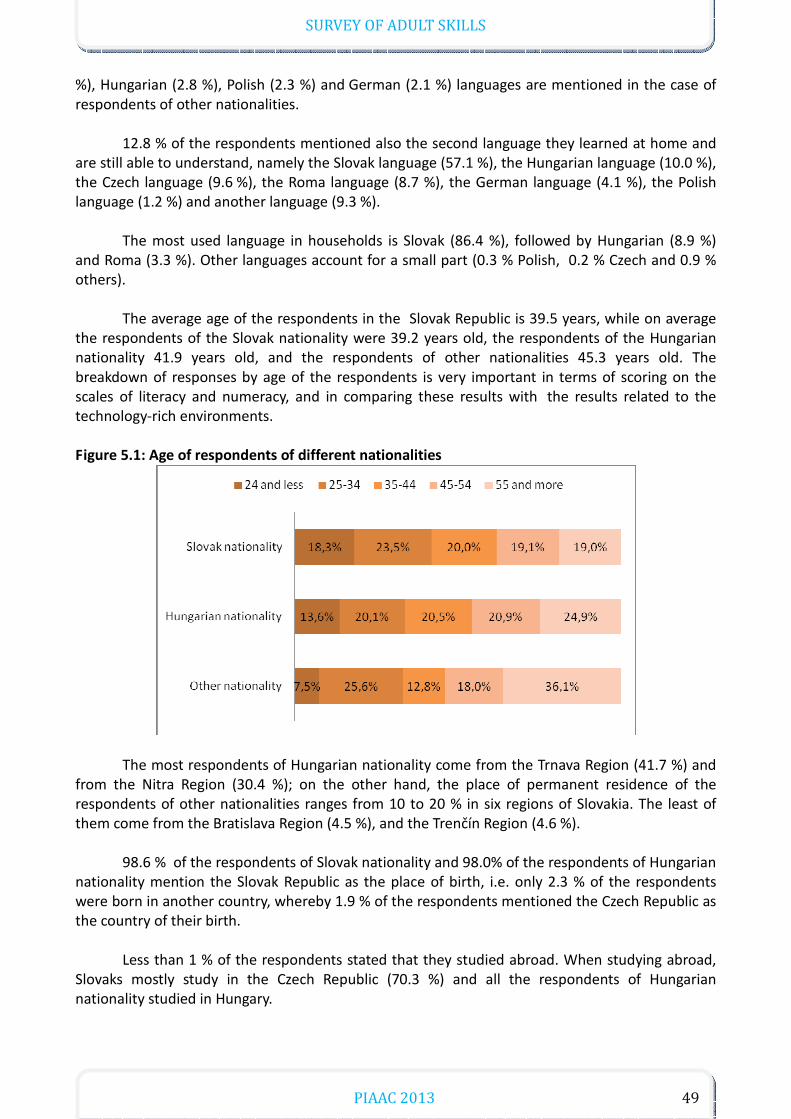
SURVEY OF ADULT SKILLS
PIAAC 2013 49
%), Hungarian (2.8 %), Polish (2.3 %) and German (2.1 %) languages are mentioned in the case of respondents of other nationalities.
12.8 % of the respondents mentioned also the second language they learned at home and are still able to understand, namely the Slovak language (57.1 %), the Hungarian language (10.0 %), the Czech language (9.6 %), the Roma language (8.7 %), the German language (4.1 %), the Polish language (1.2 %) and another language (9.3 %).
The most used language in households is Slovak (86.4 %), followed by Hungarian (8.9 %) and Roma (3.3 %). Other languages account for a small part (0.3 % Polish, 0.2 % Czech and 0.9 % others).
The average age of the respondents in the Slovak Republic is 39.5 years, while on average the respondents of the Slovak nationality were 39.2 years old, the respondents of the Hungarian nationality 41.9 years old, and the respondents of other nationalities 45.3 years old. The breakdown of responses by age of the respondents is very important in terms of scoring on the scales of literacy and numeracy, and in comparing these results with the results related to the technology-rich environments. Figure 5.1: Age of respondents of different nationalities
The most respondents of Hungarian nationality come from the Trnava Region (41.7 %) and from the Nitra Region (30.4 %); on the other hand, the place of permanent residence of the respondents of other nationalities ranges from 10 to 20 % in six regions of Slovakia. The least of them come from the Bratislava Region (4.5 %), and the Trenčín Region (4.6 %).
98.6 % of the respondents of Slovak nationality and 98.0% of the respondents of Hungarian nationality mention the Slovak Republic as the place of birth, i.e. only 2.3 % of the respondents were born in another country, whereby 1.9 % of the respondents mentioned the Czech Republic as the country of their birth.
Less than 1 % of the respondents stated that they studied abroad. When studying abroad, Slovaks mostly study in the Czech Republic (70.3 %) and all the respondents of Hungarian nationality studied in Hungary.

SURVEY OF ADULT SKILLS
PIAAC 2013 50
5.2 Selection of testing language and questionnaire language
The respondents participating in PIAAC were given a possibility to choose from the Slovak
and Hungarian languages in the questionnaire part as well as the testing part. In the course of filling-out the questionnaire, the respondents were able to switch from one language to the other. In the testing part, the respondents could solve tasks only in one language selected at the start. 95.1 % of questionnaires were filled-out in Slovak, and 4.9 % in Hungarian. From those respondents where we are able to identify Hungarian nationality, 45.2 % opted for Slovak to solve test tasks, and 47.3% opted for Slovak to fill out the questionnaire. Table 5.1: Language used in testing by the nationality of the respondents
What is your nationality? Total Slovak
nationality Hungarian nationality
Other nationality
Language of questionnaire
Hungarian 0,4% 54,8% 8,5% 5,2%
Slovak 99,6% 45,2% 91,5% 94,8%
Total 100,0% 100,0% 100,0% 100,0%
Table 5.2: Language used in questionnaire survey by nationality of respondents
What is your nationality? Total Slovak
nationality Hungarian nationality
Other nationality
Language of questionnaire
Hungarian 0,2% 52,7% 8,5% 4,9%
Slovak 99,8% 47,3% 91,5% 95,1%
Total 100,0% 100,0% 100,0% 100,0%
What was the educational attainment of the nationalities that opted for various language
mutations?
Table 5.3: Educational attainment by nationality and language of assessment
Educational attainment
Nationality and language of assessment
Total
Slovak nationality and
Slovak language of assessment
Slovak nationality and
Hungarian language of assessment
Hungarian nationality and
Slovak language of assessment
Hungarian nationality and
Hungarian language of assessment
Other nationality
Without formal education/lower than ISCED 1
% 0,1% 0,1%
ISCED 1 % 0,4% 0,6% 1,2% 2,0% 0,5% ISCED 2 % 13,8% 27,9% 12,4% 24,5% 37,4% 14,6% ISCED 3C shorter than 2 years % 4,8% 8,3% 10,4% 3,6% 5,2% ISCED 3C 2 years or longer % 22,5% 19,0% 28,7% 31,3% 14,6% 23,1% ISCED 3A-B % 36,2% 34,9% 34,5% 27,1% 18,4% 35,5% ISCED 3 (no difference A-B-C, 2r+)
% 1,8% 2,1% 1,0% 1,7%
ISCED 4C % 0,5% 1,2% 0,0% 0,5% ISCED 5A, bachelor´s degree % 4,2% 8,0% 4,1% 2,0% 4,1% ISCED 5A, master ´s degree % 14,6% 10,2% 8,2% 2,1% 24,1% 13,8% ISCED 6 % 1,0% 0,9% Foreign education % 0,1% 0,3% 0,1% Total % 100,0% 100,0% 100,0% 100,0% 100,0% 100,0%
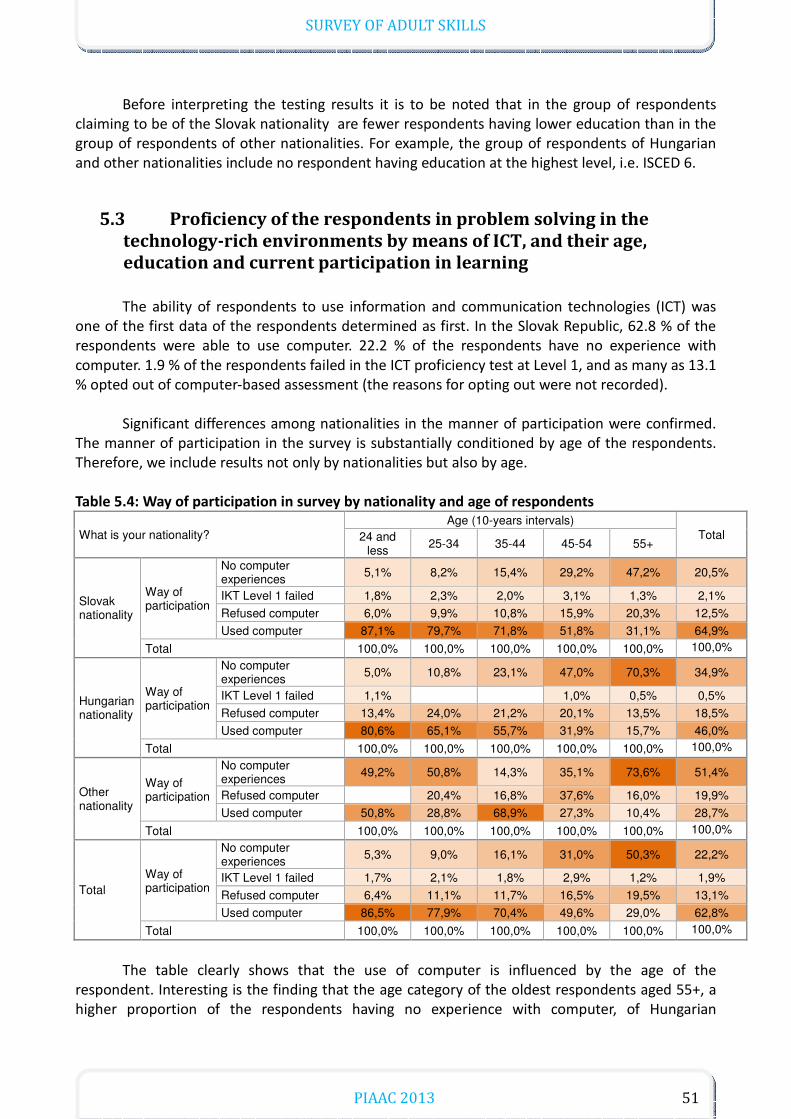
SURVEY OF ADULT SKILLS
PIAAC 2013 51
Before interpreting the testing results it is to be noted that in the group of respondents
claiming to be of the Slovak nationality are fewer respondents having lower education than in the group of respondents of other nationalities. For example, the group of respondents of Hungarian and other nationalities include no respondent having education at the highest level, i.e. ISCED 6.
5.3 Proficiency of the respondents in problem solving in the
technology-rich environments by means of ICT, and their age,
education and current participation in learning
The ability of respondents to use information and communication technologies (ICT) was
one of the first data of the respondents determined as first. In the Slovak Republic, 62.8 % of the respondents were able to use computer. 22.2 % of the respondents have no experience with computer. 1.9 % of the respondents failed in the ICT proficiency test at Level 1, and as many as 13.1 % opted out of computer-based assessment (the reasons for opting out were not recorded).
Significant differences among nationalities in the manner of participation were confirmed. The manner of participation in the survey is substantially conditioned by age of the respondents. Therefore, we include results not only by nationalities but also by age. Table 5.4: Way of participation in survey by nationality and age of respondents
What is your nationality? Age (10-years intervals)
Total 24 and less 25-34 35-44 45-54 55+
Slovak nationality
Way of participation
No computer experiences 5,1% 8,2% 15,4% 29,2% 47,2% 20,5%
IKT Level 1 failed 1,8% 2,3% 2,0% 3,1% 1,3% 2,1%
Refused computer 6,0% 9,9% 10,8% 15,9% 20,3% 12,5%
Used computer 87,1% 79,7% 71,8% 51,8% 31,1% 64,9%
Total 100,0% 100,0% 100,0% 100,0% 100,0% 100,0%
Hungarian nationality
Way of participation
No computer experiences 5,0% 10,8% 23,1% 47,0% 70,3% 34,9%
IKT Level 1 failed 1,1% 1,0% 0,5% 0,5%
Refused computer 13,4% 24,0% 21,2% 20,1% 13,5% 18,5%
Used computer 80,6% 65,1% 55,7% 31,9% 15,7% 46,0%
Total 100,0% 100,0% 100,0% 100,0% 100,0% 100,0%
Other nationality
Way of participation
No computer experiences 49,2% 50,8% 14,3% 35,1% 73,6% 51,4%
Refused computer 20,4% 16,8% 37,6% 16,0% 19,9%
Used computer 50,8% 28,8% 68,9% 27,3% 10,4% 28,7%
Total 100,0% 100,0% 100,0% 100,0% 100,0% 100,0%
Total Way of participation
No computer experiences 5,3% 9,0% 16,1% 31,0% 50,3% 22,2%
IKT Level 1 failed 1,7% 2,1% 1,8% 2,9% 1,2% 1,9%
Refused computer 6,4% 11,1% 11,7% 16,5% 19,5% 13,1%
Used computer 86,5% 77,9% 70,4% 49,6% 29,0% 62,8%
Total 100,0% 100,0% 100,0% 100,0% 100,0% 100,0%
The table clearly shows that the use of computer is influenced by the age of the
respondent. Interesting is the finding that the age category of the oldest respondents aged 55+, a higher proportion of the respondents having no experience with computer, of Hungarian
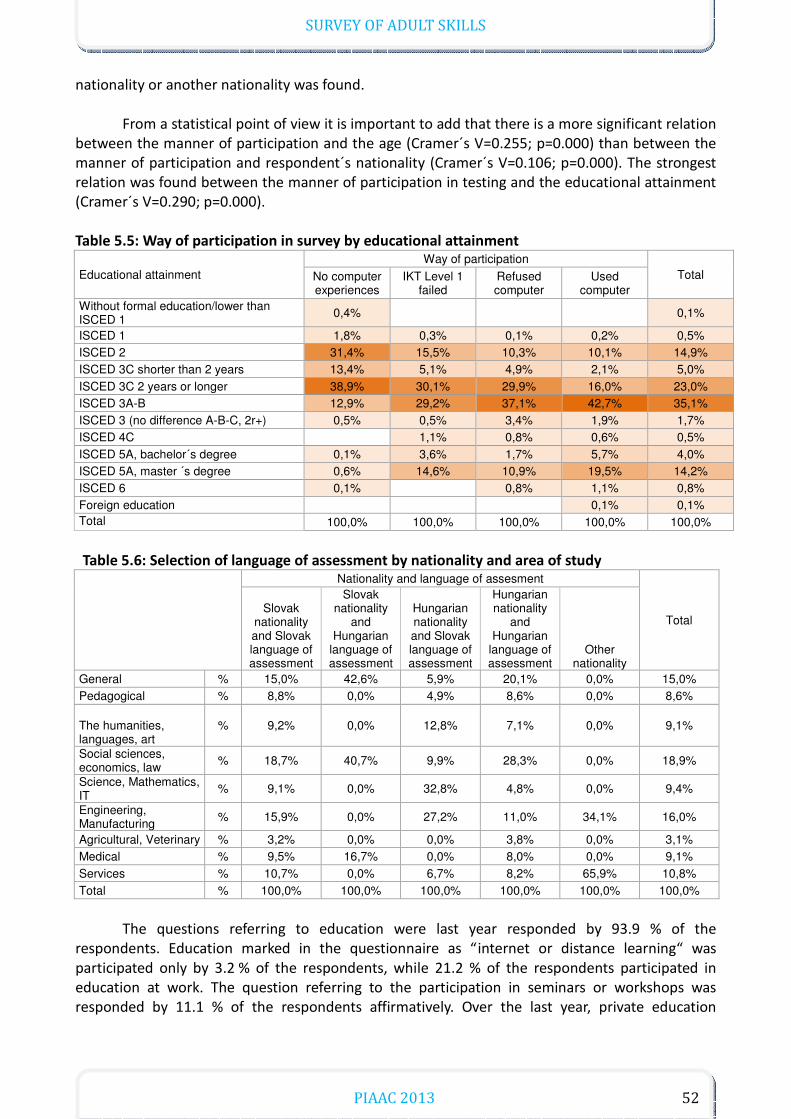
SURVEY OF ADULT SKILLS
PIAAC 2013 52
nationality or another nationality was found.
From a statistical point of view it is important to add that there is a more significant relation between the manner of participation and the age (Cramer´s V=0.255; p=0.000) than between the manner of participation and respondent´s nationality (Cramer´s V=0.106; p=0.000). The strongest relation was found between the manner of participation in testing and the educational attainment (Cramer´s V=0.290; p=0.000). Table 5.5: Way of participation in survey by educational attainment
Educational attainment Way of participation
Total No computer experiences
IKT Level 1 failed
Refused computer
Used computer
Without formal education/lower than ISCED 1 0,4% 0,1%
ISCED 1 1,8% 0,3% 0,1% 0,2% 0,5% ISCED 2 31,4% 15,5% 10,3% 10,1% 14,9% ISCED 3C shorter than 2 years 13,4% 5,1% 4,9% 2,1% 5,0% ISCED 3C 2 years or longer 38,9% 30,1% 29,9% 16,0% 23,0% ISCED 3A-B 12,9% 29,2% 37,1% 42,7% 35,1% ISCED 3 (no difference A-B-C, 2r+) 0,5% 0,5% 3,4% 1,9% 1,7% ISCED 4C 1,1% 0,8% 0,6% 0,5% ISCED 5A, bachelor´s degree 0,1% 3,6% 1,7% 5,7% 4,0% ISCED 5A, master ´s degree 0,6% 14,6% 10,9% 19,5% 14,2% ISCED 6 0,1% 0,8% 1,1% 0,8% Foreign education 0,1% 0,1% Total 100,0% 100,0% 100,0% 100,0% 100,0%
Table 5.6: Selection of language of assessment by nationality and area of study
Nationality and language of assesment
Total Slovak
nationality and Slovak language of assessment
Slovak nationality
and Hungarian
language of assessment
Hungarian nationality and Slovak language of assessment
Hungarian nationality
and Hungarian
language of assessment
Other nationality
General % 15,0% 42,6% 5,9% 20,1% 0,0% 15,0% Pedagogical % 8,8% 0,0% 4,9% 8,6% 0,0% 8,6% The humanities, languages, art
% 9,2% 0,0% 12,8% 7,1% 0,0% 9,1%
Social sciences, economics, law % 18,7% 40,7% 9,9% 28,3% 0,0% 18,9%
Science, Mathematics, IT
% 9,1% 0,0% 32,8% 4,8% 0,0% 9,4%
Engineering, Manufacturing % 15,9% 0,0% 27,2% 11,0% 34,1% 16,0%
Agricultural, Veterinary % 3,2% 0,0% 0,0% 3,8% 0,0% 3,1% Medical % 9,5% 16,7% 0,0% 8,0% 0,0% 9,1% Services % 10,7% 0,0% 6,7% 8,2% 65,9% 10,8% Total % 100,0% 100,0% 100,0% 100,0% 100,0% 100,0%
The questions referring to education were last year responded by 93.9 % of the
respondents. Education marked in the questionnaire as “internet or distance learning“ was participated only by 3.2 % of the respondents, while 21.2 % of the respondents participated in education at work. The question referring to the participation in seminars or workshops was responded by 11.1 % of the respondents affirmatively. Over the last year, private education

SURVEY OF ADULT SKILLS
PIAAC 2013 53
activities were attended only by 6 % of the respondents, and as many as 93.8 % of the respondents did not participate in any such activity.
When we again combine these variables also with the question of nationality, Slovaks and Hungarians participated in internet or distance learning approximately in the same degree (97 % of respondents of Slovak nationality, 96.6 % of respondents of Hungarian nationality). Education at work was attended by the respondents of Slovak nationality in a much higher degree (22.1 %) than by the respondents of Hungarian nationality (9.1 %). 18.8 % of the respondents of other nationalities participated in education in the workplace. Significant are also differences in participation in seminars and workshops, 11.4 % of the respondents of Slovak nationality compared to 3.4 % of the respondents of Hungarian nationality and 17.3 % of respondents of other nationalities. Private courses were attended by the respondents of Hungarian nationality in a bit higher degree, 86.0 % of the respondents responded affirmatively, while in the case of the respondents of Slovak nationality it is 73 %, and 22.1 % of the respondents of other nationalities attended private courses. These results were obtained from responses of only 6 % of the respondents.
The question whether the respondents fulfil the requirements to perform work in their
current employment in a satisfying manner was responded by the respondents of various nationalities in the same way. Table 5.7: Work requirements on educational attainment in current occupation by nationality of
respondents
Current occupation - requirements - do the job satisfactorily
What is your nationality?
Total Slovak
nationality Hungarian nationality
Other nationality
This level is needed 77,3% 76,5% 80,8% 77,3%
The lower level would be sufficient 20,2% 19,9% 19,2% 20,2%
Higher level would be needed 2,5% 3,6% 2,6%
Total 100,0% 100,0% 100,0% 100,0%
Approximately three quarters of the respondents say that the level of requirements for
educational attainment is important for their work. One fifth of the respondents of all nationalities say that a lower level of requirements would be sufficient. Approximately 3-4 % of the respondents admitted that a higher level of requirements would be needed. A higher level of requirements was not confirmed by any of the respondents of other nationalities.
In the course of interview with respondents, the interviewer asked also about skills proficiency in literacy, numeracy or proficiency in problem solving in technology-rich environments. The questions referred also to the work environment but also everyday habits. The responses of the respondents to these questions will be available for later analyses, and for time- and space-related reasons, they are not included in these papers.

SURVEY OF ADULT SKILLS
PIAAC 2013 54
5.4 Scoring by nationalities
In the previous chapters we examined participation of particular nationalities in the survey,
their age and educational attainment. This part deals with their performance in testing.
Table 5.8: The results of assessment by nationality of respondents and language of assesment
Nationality and language of assessment
Average
Literacy Numeracy Solving
problems with ICT
Slovak nationality and Slovak language of assessment
276,6 278,9 283,6
Slovak nationality and Hungarian language of assessment
277,7 275,9 272,9
Hungarian nationality and Slovak language of assessment
267,0 261,3 269,9
Hungarian nationality and Hungarian language of assessment
254,8 247,8 267,8
Other nationality 256,8 251,4 274,6
Total 274,9 276,4 282,6
The results of the respondents stating Slovak nationality are approximately the same
regardless of the used language of testing (e.g. for the Slovak language of testing 276.6 score points, and for the Hungarian language of testing 277.7 score points). A bit lower level of scoring is found for the respondents of Hungarian and other nationalities. Did we put ourselves other questions that could explain the findings? What is the distribution of scoring by nationalities like? Are these results related to age and education of the respondents in the survey?
The distribution of scoring for particular compared populations shows where the results of compared populations differ. This fact may be caused by a higher proportion of the Slovak nationality respondents with higher education, and of the Hungarian nationality respondents with lower education.

SURVEY OF ADULT SKILLS
PIAAC 2013 55
Figure 5.2: Distribution of results of literacy by nationality and language of assessment34
The median of results found for the Slovak nationality respondents is a bit higher than the
median for other nationalities. The spread of results is the smallest for the adults stating Slovak nationality, but opting for Hungarian as the testing language. The worst results, being at a very low level, were found for the population of another nationality. Results of such a low level were found for other nationalities in exceptional or extreme cases only.
Table 5.9: Distribution of results of literacy by nationality and language of assessment
Nationality and language of assessment
Slovak nationality and Slovak language of assessment
Slovak nationality and Hungarian
language of assessment
Hungarian nationality and
Slovak language of assessment
Hungarian nationality and
Hungarian language of assessment Other nationality
Percentiles 10 226,9 237,3 228,4 209,5 170,9
20 248,3 248,0 242,6 228,7 216,5
25 256,5 250,4 250,7 235,0 229,7
30 262,8 261,7 254,7 239,9 231,0
40 273,2 281,4 262,7 249,4 237,9
50 281,9 283,4 266,9 256,8 263,7
60 289,9 283,8 273,7 266,2 276,7
70 298,1 299,2 281,6 272,5 298,0
75 301,9 299,2 286,6 276,3 303,5
80 306,5 302,0 292,9 283,8 304,3
90 318,8 312,9 305,5 297,0 314,8
34
Note: Individual box figures show distribution of results for particular types of tests. The thick line in the middle of the box shows
the median of scoring, and the borders of the boxes show the upper and lower quartiles of scoring. The standard spread of scoring of
given population is followed by deviation values marked by circle, and extreme values marked by asterisk.
Nationality and language
of assesment
Slovak
nationality and
Slovak language
of assesment
Slovak
nationality and
Hungarian
language of assesment
Hungarian
nationality and
Slovak language
of assesment
Hungarian
nationality and
Hungarian
language of
assesment
Other nationality

SURVEY OF ADULT SKILLS
PIAAC 2013 56
Figure 5.3: Distribution of results of numeracy by nationality and language of assessment35
The median of results found for the respondents of Slovak nationality is again a bit higher. A
distribution of the results similar to the distribution of the results in case of literacy was confirmed. Table 5.10: Distribution of results of numeracy by nationality and language of assessment
Nationality and language of assessment
Slovak nationality and Slovak language of assessment
Slovak nationality and Hungarian
language of assessment
Hungarian nationality and
Slovak language of assessment
Hungarian nationality and
Hungarian language of assessment Other nationality
Percentiles 10 220,6 222,7 214,5 196,1 160,7
20 247,5 234,5 235,0 219,6 199,9
25 255,6 234,5 243,2 225,6 209,3
30 263,1 245,9 247,8 229,2 213,6
40 274,9 262,6 256,5 240,4 223,8
50 284,9 279,9 263,7 249,4 260,9
60 294,2 295,7 269,9 259,8 281,2
70 303,1 298,9 280,8 271,1 300,0
75 308,3 298,9 287,6 275,1 303,5
80 314,1 298,9 293,2 282,5 309,6
90 328,7 351,4 307,2 295,3 326,4
35
Note: Individual box figures show distribution of results for particular types of tests. The thick line in the middle of the box shows
the median of scoring, and the borders of the boxes show the upper and lower quartiles of scoring. The standard spread of scoring of
given population is followed by deviation values marked by circle, and extreme values marked by asterisk.
Slovak
nationality and
Slovak language
of assesment
Slovak
nationality and
Hungarian
language of assesment
Hungarian
nationality and
Slovak language
of assesment
Hungarian
nationality and
Hungarian
language of
assesment
Other nationality
Nationality and language
of assesment

SURVEY OF ADULT SKILLS
PIAAC 2013 57
Figure 5.4: Distribution of results of problem solving in technology-rich environment by
nationality and language of assessment36
Also the median of results for the proficiency in problem solving by means of ICT is a bit
higher for the population of Slovak nationality. The spread of results found for the respondents of Slovak nationality taking tests in Slovak was the highest. Interesting is the finding that the respondents of another nationality achieved in the upper quartile much better results than the respondents of Slovak or Hungarian nationality.
Table 5.11: Distribution of results of problem solving in technology-rich environment by
nationality and language of assessment
Nationality and language of assessment
Slovak nationality and Slovak language of assessment
Slovak nationality and Hungarian
language of assessment
Hungarian nationality and
Slovak language of assessment
Hungarian nationality and
Hungarian language of assessment Other nationality
Percentiles 10 238,5 226,5 236,3 238,5 232,7
20 256,3 270,1 245,7 246,6 245,1
25 262,5 270,1 250,4 249,1 246,4
30 268,0 274,4 254,4 252,6 252,4
40 276,3 274,4 261,9 259,9 253,7
50 285,7 274,4 268,5 270,5 260,7
60 293,8 275,7 275,5 275,1 260,7
70 302,0 279,0 282,2 284,4 316,4
75 306,9 290,6 286,5 289,3 316,4
80 312,1 290,6 292,4 293,1 316,4
90 324,3 306,5 308,5 301,5 340,8
36
Note: Individual box figures show distribution of results for particular types of tests. The thick line in the middle of the box shows
the median of scoring, and the borders of the boxes show the upper and lower quartiles of scoring. The standard spread of scoring of
given population is followed by deviation values marked by circle, and extreme values marked by asterisk.
Slovak
nationality and
Slovak language
of assesment
Slovak
nationality and
Hungarian
language of assesment
Hungarian
nationality and
Slovak language
of assesment
Hungarian
nationality and
Hungarian
language of assesment
Other nationality
Nationality and language
of assesment

SURVEY OF ADULT SKILLS
PIAAC 2013 58
5.5 Influence of selected factors on scoring of the respondents of
surveyed nationalities
The results indicate a slightly better scoring in literacy of the respondents of Slovak
nationality. The conclusions, however, need to be interpreted also in connection with other facts. Are there any statistically significant differences among nationalities and/or testing languages in the population of the same educational attainment?
As shown by the following table, the educational attainment is crucial for literacy and proficiency in problem solving by means of ICT. Lower levels of educational attainment are related to considerably worse scoring, regardless of the stated nationality and chosen language of testing. Table 5.12: Results of assessment by nationality of respondents and language of assessment in
relationship to educational attainment of respondents
Educational attainmet Average
Literacy Numeracy Problem solving
Without formal education/lower than ISCED 1 Slovak nationality and Slovak language of assessment
165,4 157,3
ISCED 1
Slovak nationality and Hungarian language of assessment
202,5 210,4 282,0
Hungarian nationality and Slovak language of assessment
174,9 171,2
Hungarian nationality and Hungarian language of assessment
192,7 201,8 287,9
Other nationality 156,9 160,7
ISCED 2
Slovak nationality and Slovak language of assessment
251,8 245,8 286,0
Slovak nationality and Hungarian language of assessment
260,0 244,4 270,7
Hungarian nationality and Slovak language of assessment
240,8 226,3 271,0
Hungarian nationality and Hungarian language of assessment
234,5 222,6 269,3
Other nationality 216,3 196,8 233,8
ISCED 3C kratšie ako 2 roky
Slovak nationality and Slovak language of assessment
252,1 244,9 252,3
Hungarian nationality and Slovak language of assessment
244,2 233,2 266,7
Hungarian nationality and Hungarian language of assessment
241,0 232,9 235,2
Iná národnosť 287,5 281,1
ISCED 3C 2 roky a viac
Slovak nationality and Slovak language of assesment
267,5 266,1 265,2
Slovak nationality and Hungarian language of assesment
258,8 248,2
Hungarian nationality and Slovak language of assesment
266,6 255,5 260,8
Hungarian nationality and Hungarian language of assesment
256,3 248,2 250,6
Other nationality 257,4 256,3 276,5
ISCED 3A-B
Slovak nationality and Slovak language of assessment
284,9 289,8 283,3
Slovak nationality and Hungarian language of assessment
291,1 289,8 274,3
Hungarian nationality and Slovak language of assessment
279,7 278,4 272,2
Hungarian nationality and Hungarian language of assessment
272,0 268,0 275,0
Other nationality 280,1 287,7 252,1
ISCED 3 (no difference A-B-C, 2r+) Slovak nationality and Slovak language of assessment
281,1 289,8 284,7

SURVEY OF ADULT SKILLS
PIAAC 2013 59
Hungarian nationality and Slovak language of assessment
228,2 236,7 233,1
Hungarian nationality and Hungarian language of assessment
266,3 273,5 299,4
ISCED 4C
Slovak nationality and Slovak language of assessment
282,6 284,1 272,9
Hungarian nationality and Slovak language of assessment
256,6 265,3 254,7
ISCED 5A, bachelor´s degree
Slovak nationality and Slovak language of assessment
292,6 294,8 294,5
Slovak nationality and Hungarian language of assessment
281,4 295,7
Hungarian nationality and Slovak language of assessment
283,7 288,9 284,3
Hungarian nationality and Hungarian language of assesment
301,4 302,2 287,7
ISCED 5A, master´s degree
Slovak nationality and Slovak language of assessment
297,2 308,1 296,4
Slovak nationality and Hungarian language of assessment
312,9 351,4
Hungarian nationality and Slovak language of assessment
287,2 289,9 286,2
Hungarian nationality and Hungarian language of assessment
303,6 308,9 297,1
Other nationality 305,5 308,7 303,4
ISCED 6 Slovak nationality and Slovak language of assessment
299,0 314,8 299,4
Foreign education
Slovak nationality and Hungarian language of assessment
323,1 347,4 332,7
Hungarian nationality and Hungarian language of assessment
235,0 248,6 251,4
Nevertheless, the results of the survey did not show any clear differences in scoring of any
of the nationalities compared at the same levels of educational attainment. This is also confirmed by the following facts indicating as follows:
1. Comparison of the results by nationalities at various levels of education attainment did not show a clear majority of better results of any of the nationalities.
2. At the lowest level of educational attainment, ISCED 1, significantly better results of the respondents of Hungarian nationality that opted for Hungarian as the testing language were found compared to those who opted for Slovak as the testing language. The respondents with higher educational attainment that claimed to be of Hungarian nationality and opted for Hungarian as the testing language achieved better scoring than those who opted for Slovak as the testing language. This fact, however, was not shown at the mid-level of educational attainment.
3. Considering the results of another nationality on the level of ISCED 2, the scoring is substantially worse than the scoring of other nationalities. When the level of ISCED 3C shorter than two years is considered, the scoring is clearly higher than the scoring of other nationalities at the same level of educational attainment.
In our interpretation, we used the expression “facts indicating as follows” deliberately
because some levels of educational attainment were not represented by a sufficient number of the respondents.
The survey results confirm the fact that nationality as such does not have any clear influence on scoring on the scale of literacy, numeracy and proficiency in problem solving in technology-rich environments by means of ICT. On the contrary, the results more likely depend on factors such as age and educational attainment. The survey results will be further analysed in detail to explain achievements or failures of the respondents in particular domains of PIAAC.

SURVEY OF ADULT SKILLS
PIAAC 2013 60
Conclusion
The results of the survey assessing skills proficiency of adults, presented in the OECD International Report “Skills Outlook“37 and the PIAAC National Report clearly show that we cannot remain to be content with the presented level of achieved competencies of adults in Slovakia. It is obvious that more attention needs to be paid to circumstances of adult education, and investments into this area should be considered. It is advisable to start with improving awareness of adults regarding life-long education as it was confirmed that the proficiency of adults and the extent to which they use this proficiency, skills and competencies have a strong influence on their possibilities to succeed on the labour market.
The outputs included in the report indicate that it is necessary to emphasize continuous education. They also clearly confirm that there is a strong positive relation between a person participating in further education and skills of that person scoring at higher levels on the scales of skills proficiency. The influence of skills is much deeper than just influencing employment and income of the person. Across the countries participating in the survey, respondents scoring at lower levels on the scale of literacy are much more likely to state being of a poor health, or believing that they have little influence on the political development in given country. They do not work as volunteers, and in most countries they are also less likely to report trust in others. Continuous education is what we all need.
OECD started to build assessments of education policies mainly in the field of vocational training, and its influence on developing skills based on the first findings obtained by large-scale assessment of skills of students 15-year old, running the PISA project since 1997. About ten years after publishing the first results of PISA, OECD publishes and creates conditions for a survey of competencies of the overall adult population of working age, whereby the survey is focused on skills proficiency in literacy and numeracy, and proficiency in problem solving in technology-rich environments, a parallel of PISA. Both surveys are unique as the scoring is based on the content that is related to dealing with common problems of everyday life, situations adequate to the age of the respondent, when the learned knowledge needs to be applied, not just reproduced. The aim of PIAAC is to determine how the adults develop their knowledge, skills and competencies; how they use them, and what advantages they are able to achieve using their skills and competencies, whether at home, at work or generally in the society where they live.
“More education does not automatically mean achievement of better skills,“ claims the report by OECD38 based on the results of the survey of skills of adults. Formal education plays a key role in developing basic skills, and educational attainment closely correlates with the achieved level of knowledge, skills and competencies. The level of achieved skills, however, significantly differs among respondents of having similar qualifications. Success of an individual person is increased by developing competencies also after completion of the formal education as a major part of learning takes part outside the formal schooling environment.
The results of PIAAC also indicate that “a country cannot change its past. However, policies to provide for high-quality life-long education can be proposed to help adults maintain their skills also in the future“ (Key Findings from the Survey39), since:
- The skills of adults tend to be lost when they are not used,
37
OECD (2013), OECD Skills Outlook 2013: First Results from the Survey of Adult Skills, OECD Publishing 38
OECD (2013), Skilled for life? Key findings from the Survey of Adult Skills, OECD Publishing, p 14 39
OECD (2013), Skilled for life? Key findings from the Survey of Adult Skills, OECD Publishing, p 16

SURVEY OF ADULT SKILLS
PIAAC 2013 61
- The difference in literacy of adults is still bigger considering the age categories of the respondents,
- The level of competencies differs across countries, in a given country as well as among generations. In its report, OECD, with regard to the global development, recommends the following
in the field of education policies40: - creating connection between the environment of work and environment of learning, - providing for education of workers in the workplace, - making sure that further education of adults is relevant, - enabling the workers to adapt their learning to their living conditions, - identifying those who face the greatest risks of poor levels of skills proficiency, - underlining the fact what advantages the adults having better skills may achieve, - providing easily accessible information about possibilities of further education of adults, - acknowledging and certifying levels of achieved knowledge, skills and competencies.
We believe that life-long education is a key to wider knowledge, better skills and higher
competencies. In this way, adults will be better prepared for the labour market, the competitiveness will improve, and the employment will be boosted. Currently, for the purpose of improvements in the life-long education field, the following eight recommendations are world-wide valid:
1. Increasing public investments in the life-long education 2. Supporting personal and social advantages of non-formal education 3. Providing for basic skills should be in close cooperation of all educational institutions 4. Involving employers in the life-long education 5. Education plays a key role at the time of global economic crisis 6. Approaching groups of people poorly represented (e.g. migrants, older people,
prisoners,...) 7. Providing for cooperation between shareholders that simultaneously operate at various
levels – establishing partnerships 8. Creating a comprehensive system of life-long education
40
OECD (2013), Skilled for life? Key findings from the Survey of Adult Skills, OECD Publishing, p. 18

SURVEY OF ADULT SKILLS
PIAAC 2013 62
List of Tables and Figures Table 2.1 Education and literacy in the Slovak Republic Table 2.2: Education and numeracy in the Slovak Republic Table 2.3: Education and skills in problem solving in technology-rich environment in the Slovak Republic Table 2.4: Average results of 16-65 year-olds in literacy and numeracy and percentage of 16-65 year-olds who scored at the levels 2 or 3 in problem solving in technology-rich environment Tab. 4.1: Skills proficiency of adults, by regions Table 5.1: Language used in testing by the nationality of the respondents Table 5.2: Language used in questionnaire survey by nationality of respondents Table 5.3: Educational attainment by nationality and language of assessment Table 5.4: Way of participation in survey by nationality and age of respondents Table 5.5: Way of participation in survey by educational attainment Table 5.6: Selection of language of assessment by nationality and area of study Table 5.7: Work requirements on educational attainment in current occupation by nationality of respondents Table 5.8: The results of assessment by nationality of respondents and language of assessment Table 5.9: Distribution of results of literacy by nationality and language of assessment Table 5.10: Distribution of results of numeracy by nationality and language of assessment Table 5.11: Distribution of results of problem solving in technology-rich environment by nationality and language of assessment Table 5.12: Results of assessment by nationality of respondents and language of assessment in relationship to educational attainment of respondents Figure 2.1: Literacy level of adults aged 16 – 65 in the OECD countries Figure 2.2: Literacy of five age cohorts in the Slovak Republic Figure 2.3: Level of numeracy of adults aged 16 – 65 in the OECD countries Figure 2.4: Numeracy of five age cohorts in the Slovak Republic Figure 2.5: Proficiency of adults aged 16 – 65 in problem solving in technology-rich environment in the OECD countries Figure 2.6: Proficiency of young adults aged 16 – 24 in problem solving in technology-rich environment in the OECD countries Figure 3.1: Literacy, numeracy and proficiency in problem solving in technology-rich environments, by gender in the Slovak Republic Figure 3.2: Literacy, numeracy and proficiency in problem solving in technology-rich environments and gender in the Slovak Republic Figure 3.3: Numeracy of adults and gender Figure 3.4: Average scores on the literacy and educational attainment scales Figure 3.5: Literacy and numeracy in main sectors of economic activity in the Slovak Republic Figure 3.6: Proficiency in problem solving in technology-rich environments in the main sectors of economic activity in the Slovak Republic Figure 3.7: Skills of people working in the major groups of occupations in the Slovak Republic Figure 3.8: Numeracy and monthly income in the Slovak Republic Figure 3.9: Proficiency in problem solving in technology-rich environments and monthly incomes in the Slovak Republic Figure 3.10: Proficiency in problem solving in technology-rich environments and education of parents

SURVEY OF ADULT SKILLS
PIAAC 2013 63
Figure 5.1: Age of respondents of different nationalities Figure 5.2: Distribution of results of literacy by nationality and language of assessment Figure 5.3: Distribution of results of numeracy by nationality and language of assessment Figure 5.4: Distribution of results of problem solving in technology-rich environment by nationality and language of assessment

SURVEY OF ADULT SKILLS
PIAAC 2013 64
References OECD (2013), OECD Skills Outlook 2013: First Results from the Survey of Adult Skills, OECD Publishing OECD (2013), Skilled for life? Key findings from the Survey of Adult Skills, OECD Publishing

SURVEY OF ADULT SKILLS
PIAAC 2013 65
National report PIAAC Slovakia 2013. Survey of Adult Skills (PIAAC) Authors: doc. Mgr. Ján Bunčák, CSc., JUDr. Mgr. Zuzana Štrbíková, Ing. Adriana Mesárošová, PhD., Ing. Ildikó Pathóová, Mgr. Júlia Štěpánková, PhDr. Iveta Árva Sklenárová, PaedDr. Jozef Kuraj, PhD., Mgr. Tomáš Faško Critics: Ing. Vladimír Belovič, CSc., Mgr. Paulína Koršňáková, PhD. Published by: © Národný ústav celoživotného vzdelávania, Tomášikova 4, 820 09 Bratislava, www.nuczv.sk Imprint date: 2013 Publication: First Number of pages: 65 Cover: Typoset print, s. r. o., Bratislava Printed by: Typoset print, s. r. o., Bratislava ISBN 978-80-971503-2-7

ISBN 978-80-971503-2-7
9 788097 150327


