164
Survey of Undergraduate Alumni Fall 2001 Southeastern Louisiana University September 2003 Office of Institutional Research & Assessment

Survey of Undergraduate Alumni
Fall 2001
Southeastern Louisiana University
September 2003
Office of Institutional Research & Assessment

i
Table of Contents Executive Summary.........................................................................................................................1 Method .............................................................................................................................................2 Results..............................................................................................................................................6 All Respondents ...................................................................................................................6 General Skills...........................................................................................................6 Perceptions of Southeastern.....................................................................................9 Graduate/Professional Education...........................................................................10 Employment History..............................................................................................12 Current Employment..............................................................................................15 Professional Activities ...........................................................................................16 Overall Satisfaction................................................................................................17 Comparison to Other Years ...................................................................................17 Department of Biological Sciences....................................................................................18 Department of Communication..........................................................................................31 Department of English .......................................................................................................37 Department of Foreign Languages & Literature................................................................41 General Studies ..................................................................................................................46 Department of History and Political Science.....................................................................52 Department of Psychology.................................................................................................65 Department of Sociology & Criminal Justice....................................................................70 Department of Visual Arts .................................................................................................78 Department of Accounting.................................................................................................83 Department of Computer Science......................................................................................89 Department of Industrial Technology................................................................................96 Department of Management ............................................................................................101 Department of Marketing and Finance ............................................................................108 Department of Human Development ...............................................................................120 Department of Teaching & Learning...............................................................................130 Department of Communication Sciences & Disorders ....................................................145 Department of Kinesiology and Health Studies...............................................................152 School of Nursing ............................................................................................................158

Page 1
Executive Summary Southeastern Louisiana University believes that Baccalaureate Degree Alumni can provide insights into the value of their degree and the influence a degree from Southeastern has had on their lives. The information provided can be used to help assess where the university has been, and help plan where the university is going. Alumni’s perceptions of the value of their education, the influence their educational experiences have had on their life, and where and what the alumni are currently doing gives the university a wonderful opportunity to review the university’s accomplishments and shortcomings. Therefore, in Academic Year 2001-2002, Southeastern conducted a Survey of Undergraduate Alumni Overall, the alumni respondents perceived that Southeastern provided a positive educational experience with a family friendly campus. This report provides detailed information regarding perception and satisfaction of alumni with the university, its services, and degree programs. Summary highlights include: ! Over 75% of respondents are continuing or plan to continue their education. ! The majority of respondents who have continued their education have done so in a
program related to their Southeastern major. ! 92% of respondents are satisfactorily employed. ! Of the respondents employed full-time, 81% are employed in the state of Louisiana. ! The vast majority of respondents are employed in the area of their Southeastern major, or
a related major. ! Overall, the average income of alumni exceeds the average income of Louisiana
residents. ! 97% of respondents indicated they would recommend Southeastern to a friend or family
member considering college. ! The majority of respondents would select Southeastern again for their college education,
and over a quarter have chosen Southeastern for their graduate education. ! Almost all of the respondents felt that their college education improved the quality of
their lives. ! Southeastern helped respondents develop the ability to learn on their own as well as
learning to work with groups or teams.

Page 2
Method Participants A total of 1,709 surveys were mailed to Baccalaureate degree alumni who graduated in Academic Years 98-99 and 99-2000 and for whom the Southeastern Alumni Office had a valid address. For those majors in which there were fewer than 100 graduates, all graduates were sent a survey. If a major had more than 100 graduates, a random sample of 100 was sent a survey. Of the 1,709 surveys sent, 76 were returned as non-deliverable and 274 were completed and returned. This reflects a response rate of 17%. Table 1 provides a breakdown of return rates by program.
Table 1 Survey Return Rates by Program
Program Number of Surveys Mailed
Number of Surveys Returned Return Rate
B.S. Biology 98 11 11%
B.S. Horticulture 23 6 26%
B.S. Science Education 17 4 24%
B.S. Chemistry 22 2 9%
B.A. Communications 69 10 14%
B.A. English 33 3 9%
B.A. English Education 8 2 25%
B.A. Liberal Arts Studies 15 2 13%
B.A. French 2 0 0%
B.A. Spanish 11 5 45%
B.A. Spanish Education 2 0 0%
B.G.S. General Studies 96 15 16%
B.A. Government 15 3 20%
B.A. History 31 3 10%
B.A. Social Studies Teaching 21 3 14%
B.S. Mathematics 11 2 18%
B.S. Mathematics Education 15 2 13%
B. Mu. Music 7 2 29%

Page 3
Table 1
Survey Return Rates by Program
Program Number of Surveys Mailed
Number of Surveys Returned Return Rate
B.A. Psychology 47 7 15%
B.A. Criminal Justice 95 9 10%
B.A. Sociology 34 4 12%
B.A. Art 9 2 22%
B.A. Art Education 8 1 13%
B.A. Cultural Resource Management 11 3 27%
B.S. Accounting 97 23 24%
B.S. Computer Science 32 7 22%
B.A. General Business 35 2 6%
B.S. Industrial Technology 76 12 16%
B.A. Management 91 10 11%
B.S. Finance 50 10 20%
B.A. Marketing 94 14 15%
B.S. Family Consumer Sciences 30 3 10%
B.A. Social Work 95 24 25%
B.A. Elementary Education 95 17 18%
B.A. Special Education, Mild/Moderate 26 4 15%
B.A. Speech, Language & Hearing 33 8 24%
B.A. Kinesiology 83 11 13%
B.S. Nursing 98 28 29% Of the returned surveys, 72% (n=197) were female and 28% (n=77) were male. The vast majority (93%, n=254) were White, Non-Hispanic, while 3% (n=9) were Black, Non-Hispanic, 4% (n=10) were Hispanic, 0.4% (n=1) were Asian/Pacific Islander.

Page 4
Procedure A notification post card was mailed to alumni in September, 2001. This informed alumni of the upcoming survey and allowed for address updates. The survey was mailed to alumni during November 2001. Included in the survey was a business reply envelope and a small gift. Ten days later, a post card reminder was mailed to students who had not responded. A few weeks following the mailing of the post cards, a second survey was mailed to all students who had not yet responded. The second mailing included a personalized cover letter from department heads encouraging alumni to respond to the survey. Instrument There were seven sections in the survey, including: ! “Section 1 - Satisfaction with Your Degree Program”. Questions corresponded to the SLU
Exit Survey, but also asked for information about the quality of any internships, practicum, or clinical experiences while a student.
! “Section 2 - General Skills". General education outcomes, such as ability to use logic and
critical thinking skills, ability to comprehend and analyze reading material, and ability to speak effectively were addressed.
! “Section 3 - Perceptions of Southeastern”. Alumni were asked to rate their level of
agreement with statements concerning strategic planning benchmarks of the university. ! “Section 4 - Graduate/Professional Education”. This section asked the alumni to indicate
what further educational goals they have completed or plan to pursue. ! “Section 5 - Employment”. Questions centered on the types of employment found, how long
it took to find employment, and obstacles encountered while searching for full-time employment, as well as annual salary range.
! “Section 6 - Professional Activities”. Alumni were asked about any types of
licensure/certification obtained, as well as participation in any professional organizations. ! “Section 7 - Overall Satisfaction with Southeastern”. Attitudes regarding overall satisfaction
with their educational experience at Southeastern, and whether they would recommend Southeastern to a friend or family member considering college were addressed.
The survey also requested information regarding immediate supervisors, in order to allow the university to conduct an Employer Survey. At the end of the survey, alumni were given the opportunity to make any additional comments regarding their experience as a student at Southeastern. A complete copy of the survey can be found in Appendix A.

Page 5
In addition, departments were given the opportunity to develop questions specific to their majors which would be included as a special insert. Seven departments developed questions to be included in the alumni survey, those departments were: Computer Science, Management, Marketing & Finance, Mathematics, Music, Nursing, Teaching & Learning. A copy of the special questions can be found in Appendix B.

Page 6
Results All Respondents The overall results of Section 2 - “General Skills”, Section 3 - “Perceptions of Southeastern”, Section 4 - “Graduate/Professional Education”, Section 5 - “Employment”, Section 6 - “Professional Activities”, and Section 7 - “Overall Satisfaction with Southeastern” are reported first. This is followed by program specific results arranged by department from Section 1 - “Satisfaction with Your Degree Program”, Section 4 - “Graduate/Professional Education”, Section 5 - “Employment” and Section 6 - “Professional Activities”. It is important to note that the report is organized according to the July 2000 reorganization, e.g. Social Work is included in the Human Development department rather than Sociology, Social Work and Criminal Justice. However, when the respondents were enrolled at Southeastern, this reorganization had not occurred. Therefore, for those majors and departments which were affected by the reorganization, any question which refers to the respondent’s “department” must be interpreted with caution. The final portion reports, verbatim, additional comments and suggestions regarding Southeastern provided by the respondents.
General Skills Overall, respondents indicated that Southeastern helped them develop various skills and abilities. They indicated that Southeastern was most helpful in helping them develop the ability to learn on their own, and least helpful in developing an awareness of how political and economic trends impact families and communities.
Table 2 General Skills
7. On a scale of 1 through 5, where 1 means Did Not Help at All and 5 means Helped a Lot,
indicate how much Southeastern helped you in developing the following skills or abilities. Did Not Help
at All - 1 2 3 4 Helped a Lot -5
Ability to write well
5.1% (14) 8.0% (22) 22.3% (61) 39.8% (109) 23.4% (64)
Ability to speak effectively
4.4% (12) 4.4% (12) 21.5% (59) 41.2% (113) 27.4% (75)
Ability to comprehend reading material and to analyze its meaning
3.3% (9) 4.4% (12) 24.8% (68) 43.1% (118) 23.0% (63)

Page 7
Table 2 cont. General Skills
7. On a scale of 1 through 5, where 1 means Did Not Help at All and 5 means Helped a Lot, indicate how much Southeastern helped you in developing the following skills or abilities.
Did Not Help at All - 1 2 3 4 Helped a
Lot -5
Ability to use logic and critical thinking skills
2.9% (8) 2.9% (8) 19.3% (53) 43.8% (120) 29.9% (82)
Ability to see relationships, similarities, and distinctions between ideas
2.6% (7) 4.4% (12) 20.1% (55) 44.5% (122) 27.4% (74)
Ability to apply problem-solving techniques
2.6% (7) 5.1% (14) 20.1% (55) 43.2% (117) 28.8% (78)
Ability to use mathematical and statistical concepts and tools
3.3% (9) 11.7% (32) 21.9% (60) 35.0% (96) 27.0% (74)
Ability to locate, evaluate, and effectively use information
1.8% (5) 3.6% (10) 21.5% (59) 39.4% (108) 31.8% (87)
Understanding the nature of science and the scientific method
3.3% (9) 6.9% (19) 28.1% (77) 40.1% (110) 20.1% (55)
Familiarity with key applications of the basic sciences
2.6% (7) 6.9% (19) 28.1% (77) 39.8% (109) 21.2% (58)
Ability to learn on your own
2.6% (7) 3.6% (10) 13.1% (36) 39.4% (108) 40.1% (110)
Ability to work with groups or teams
2.2% (6) 4.7% (13) 18.2% (50) 32.8% (90) 40.5% (111)
Recognition of the value of coming into contact with people different from you
3.6% (10) 5.8% (16) 16.8% (46) 34.3% (94) 38.3% (105)
Understanding the nature and value of at least one of the performing arts
4.0% (11) 7.7% (21) 17.9% (49) 36.1% (99) 33.2% (91)
Wider acquaintance with and enjoyment of literature
5.5% (15) 9.9% (27) 23.0% (63) 33.2% (91) 27.0% (74)
Page 8
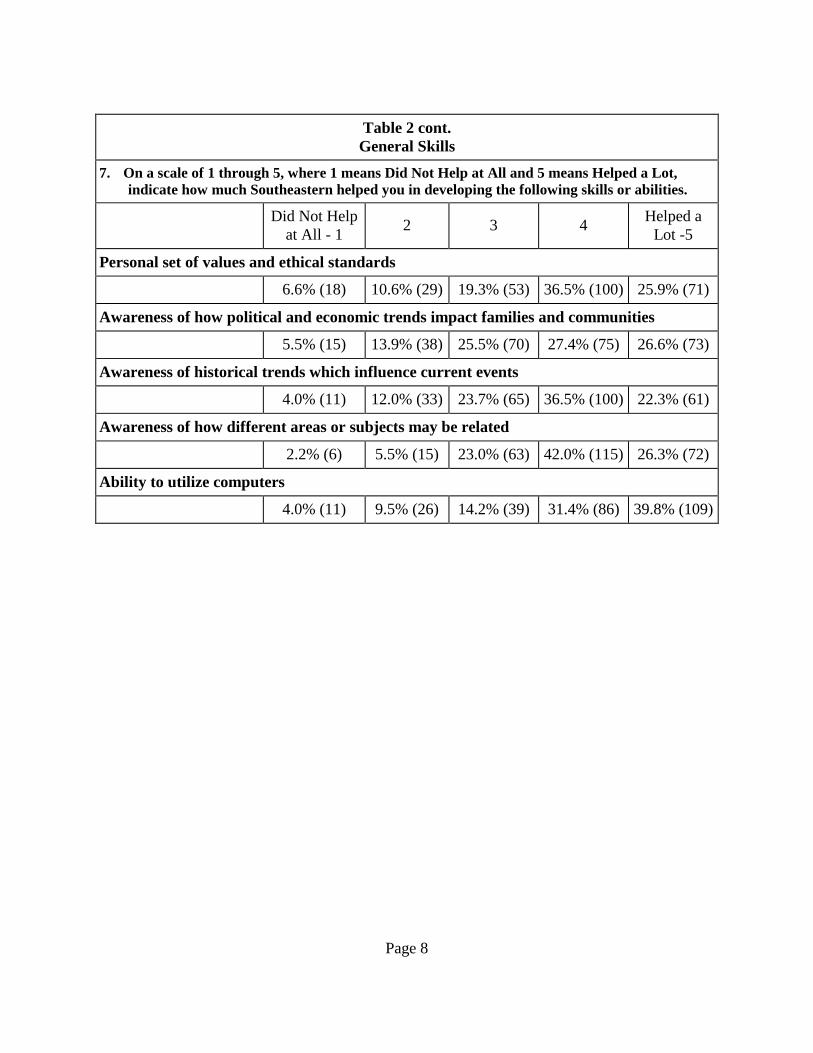
Table 2 cont. General Skills
7. On a scale of 1 through 5, where 1 means Did Not Help at All and 5 means Helped a Lot, indicate how much Southeastern helped you in developing the following skills or abilities.
Did Not Help at All - 1 2 3 4 Helped a
Lot -5
Personal set of values and ethical standards
6.6% (18) 10.6% (29) 19.3% (53) 36.5% (100) 25.9% (71)
Awareness of how political and economic trends impact families and communities
5.5% (15) 13.9% (38) 25.5% (70) 27.4% (75) 26.6% (73)
Awareness of historical trends which influence current events
4.0% (11) 12.0% (33) 23.7% (65) 36.5% (100) 22.3% (61)
Awareness of how different areas or subjects may be related
2.2% (6) 5.5% (15) 23.0% (63) 42.0% (115) 26.3% (72)
Ability to utilize computers
4.0% (11) 9.5% (26) 14.2% (39) 31.4% (86) 39.8% (109)

Page 9
Perceptions of Southeastern
Table 3 Perceptions of Southeastern
8. Using a scale from 1 to 5, where 1 means Strongly Disagree, and 5 means Strongly
Agree, please indicate your agreement with the following.
Strongly Disagree - 1
2
3
4
Strongly Agree - 5
Southeastern was a “family friendly” campus. 1.1% (3) 2.9% (8) 17.9% (49) 32.8% (90) 44.2% (121)Southeastern provided a positive, supportive environment for minority students. 1.8% (5) 3.3% (9) 28.5% (78) 32.5% (89) 31.5% (86)Southeastern has a pretty campus. 3.6% (10) 4.4% (12) 22.6% (62) 36.1% (99) 32.1% (88)The appearance of Southeastern’s campus improved while I attended Southeastern. 4.7% (13) 2.6% (7) 15.0% (41) 28.8% (79) 47.8% (131)Race relations on campus were not as good as they could have been. 17.9% (49) 26.3% (72) 31.4% (86) 12.0% (33) 10.6% (29)There was a sense of personal safety/security on campus 0.7% (2) 5.5% (15) 24.1% (66) 39.1% (107) 29.2% (80)The campus was, generally, free from harassment (e.g. sexual, racial, etc.) 1.5% (4) 4.4% (12) 15.3% (42) 35.4% (97) 41.6% (114)Overall, there was a campus atmosphere of ethnic, political, and religious understanding and acceptance. 2.2% (6) 2.2% (6) 17.9% (49) 41.6% (114) 34.7% (95) In this section, students were also asked about their participation in and satisfaction with study abroad/student exchange program, honors program, and research programs. Six percent (n=17) of the respondents had participated in a study-abroad/student exchange program. Of those who participated, 81% (n=13) were satisfied with the program. In general, 84% of respondents felt that participation in such a program is valuable. Almost 19% (n=51) of respondents participated in an honors program, and of those who participated, 82% (n=42) were satisfied with the experience. Almost one-fourth of the respondents (n=66) participated in a research program, and 86% (n=57) of the participants were satisfied with the experience.
Page 10
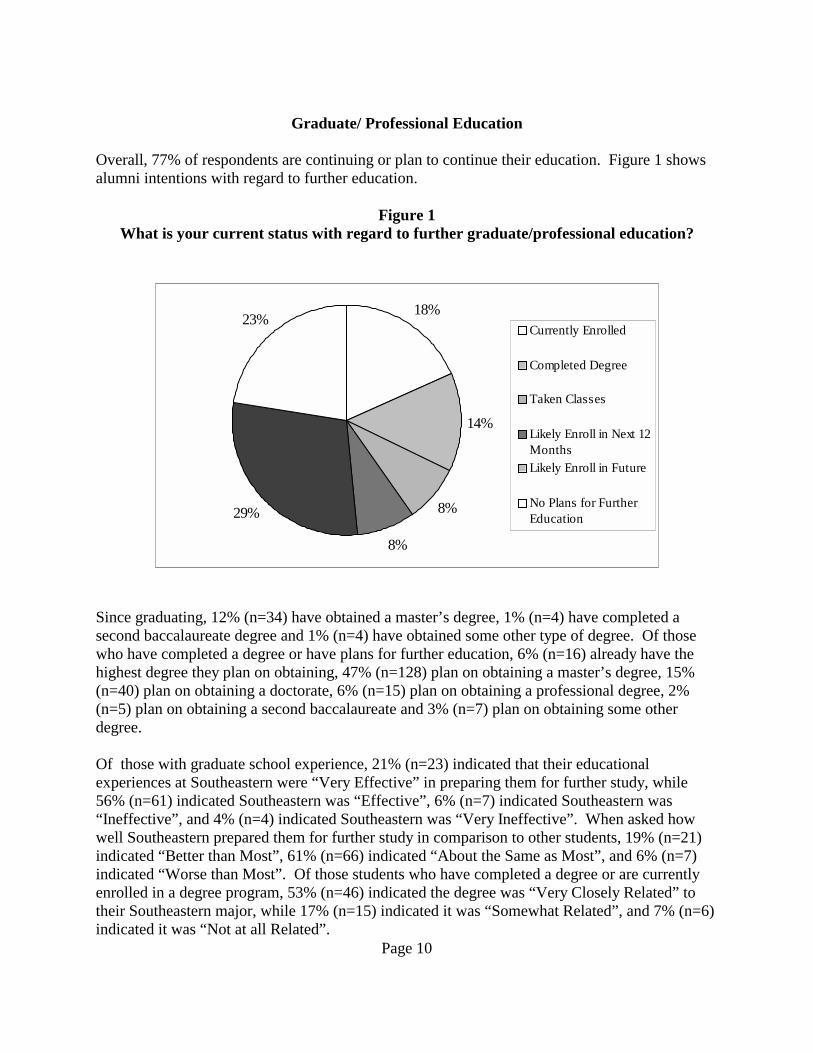
Graduate/ Professional Education Overall, 77% of respondents are continuing or plan to continue their education. Figure 1 shows alumni intentions with regard to further education.
Figure 1 What is your current status with regard to further graduate/professional education?
18%
14%
8%
8%
29%
23%Currently Enrolled
Completed Degree
Taken Classes
Likely Enroll in Next 12MonthsLikely Enroll in Future
No Plans for FurtherEducation
Since graduating, 12% (n=34) have obtained a master’s degree, 1% (n=4) have completed a second baccalaureate degree and 1% (n=4) have obtained some other type of degree. Of those who have completed a degree or have plans for further education, 6% (n=16) already have the highest degree they plan on obtaining, 47% (n=128) plan on obtaining a master’s degree, 15% (n=40) plan on obtaining a doctorate, 6% (n=15) plan on obtaining a professional degree, 2% (n=5) plan on obtaining a second baccalaureate and 3% (n=7) plan on obtaining some other degree. Of those with graduate school experience, 21% (n=23) indicated that their educational experiences at Southeastern were “Very Effective” in preparing them for further study, while 56% (n=61) indicated Southeastern was “Effective”, 6% (n=7) indicated Southeastern was “Ineffective”, and 4% (n=4) indicated Southeastern was “Very Ineffective”. When asked how well Southeastern prepared them for further study in comparison to other students, 19% (n=21) indicated “Better than Most”, 61% (n=66) indicated “About the Same as Most”, and 6% (n=7) indicated “Worse than Most”. Of those students who have completed a degree or are currently enrolled in a degree program, 53% (n=46) indicated the degree was “Very Closely Related” to their Southeastern major, while 17% (n=15) indicated it was “Somewhat Related”, and 7% (n=6) indicated it was “Not at all Related”.

Page 11
Graduates are attending or attended the following institutions: Southeastern Louisiana University - 29 graduates Louisiana State University - 12 graduates Southern University, New Orleans - 3 graduates Tulane University - 2 graduates University of Louisiana Lafayette - 2 graduates University of New Orleans - 2 graduates Louisiana State University Medical Center - 1 graduate Belhaven College - 1 graduate Louisiana State University Health Sciences Center - 1 graduate Loyola University School of Law - 1 graduate Southern University Law Center - 1 graduate Spertus Institute -1 graduate Tarleton State University - 1 graduate University of Alabama - 1 graduate University of Florida - 1 graduate University of Mississippi - 1 graduates University of Mississippi Medical Center - 1 graduate University of North Carolina, Greensboro -1 graduate University of South Alabama - 1 graduate US Sports Academy - 1 graduate University of Memphis - 1 graduate University of North Dakota - 1 graduate Washington University -1 graduate

Page 12
Employment History Overall, 92% of the respondents are satisfactorily employed. Eighty-one percent (81%) are employed full-time. Figure 2 shows current employment status.
Figure 2 16. What is your current employment status? If you are self-employed or in the military,
please indicate “employed”.
81%
5% 4%
5%
2%
3%Full-Time
Part-Time, Satisfied
Part-Time, Looking forFull-Time
GraduateAssistantship/Fellowship
Unemployed, Looking
Unemployed, Not Looking
Twenty-three of the respondents (8%) have held no full-time job since graduating from Southeastern. Twenty-seven percent of respondents (27%, n=73) had their first full-time permanent job before completing their degree, and 36 (13%) accepted the position upon graduation. An additional 35% (n=96) obtained a full-time position 1-6 months after completing their degree, while 15 respondents (6%) took 7-12 months to find a job, and 14 respondents (5%) took more than a year to obtain a position. The 133 respondents who did not have a job upon graduation faced a variety of problems in obtaining employment. Table 4 presents what were considered major problems, minor problems, or no problem.

Page 13
Table 4
Please indicate whether each of the following was a major problem, minor problem, or not a problem in obtaining employment after graduating from Southeastern with your
Bachelors. Major Problem Minor Problem Not A Problem Limited to only one geographic area 13% (17) 18% (24) 53% (71) Not knowing what I wanted to do 16% (21) 19% (25) 50% (67) Tight job market 30% (40) 34% (45) 21% (28) Lack of marketable skills 14% (19) 21% (28) 49% (65) Lack of educational qualifications 5% (6) 13% (17) 68% (90) Reputation of Southeastern 4% (5) 10% (13) 71% (95) Lack of experience 30% (40) 29% (38) 26% (35) Lack of job search skills 5% (6) 26% (34) 55% (73) Poor GPA 0% 6% (8) 85% (113) Racial discrimination 1% (1) 2% (3) 82% (109) Gender discrimination 2% (2) 4% (5) 80% (106) Age discrimination 3% (4) 10% (13) 72% (96) Respondents who have had full-time employment since graduating from Southeastern were asked how effective their education was in preparing them for employment or improving their job performance. Twenty-four percent (24%, n=55) indicated their education was “Very Effective”, 44% (n=104) indicated it was “Effective”, 12% (n=29) indicated it was “Ineffective”, and 3% (n=7) indicated it was “Very Ineffective”. Furthermore, 50% (n=116) have had one full-time job or are in their first job since graduating, 29% (n=68) have had two full-time jobs, and 10% (n=23) have had three or more full-time jobs. Alumni were also asked where they learned about their first full-time job. Table 5 provides information on how students found a job.

Page 14
Table 5 From what source(s) did you learn about the first full-time job you held after graduating
from Southeastern? (Mark all that apply)
Number and Percent Indicating Yes Faculty at Southeastern 10% (24)
Parent or relative 7% (17)
Southeastern’s Career Development Services 2% (4)
Newspaper/trade publication 9% (21)
Professional meeting 1% (3)
Another student/friend 10% (23)
Recruited by employer 9% (21)
Public/Private employment agency 2% (4)
Southeastern Job Fair 3% (7)
Internet 7% (16)
Already had job 4% (10)
Internship, Practicum, or Student Teaching 9% (20)
Page 15
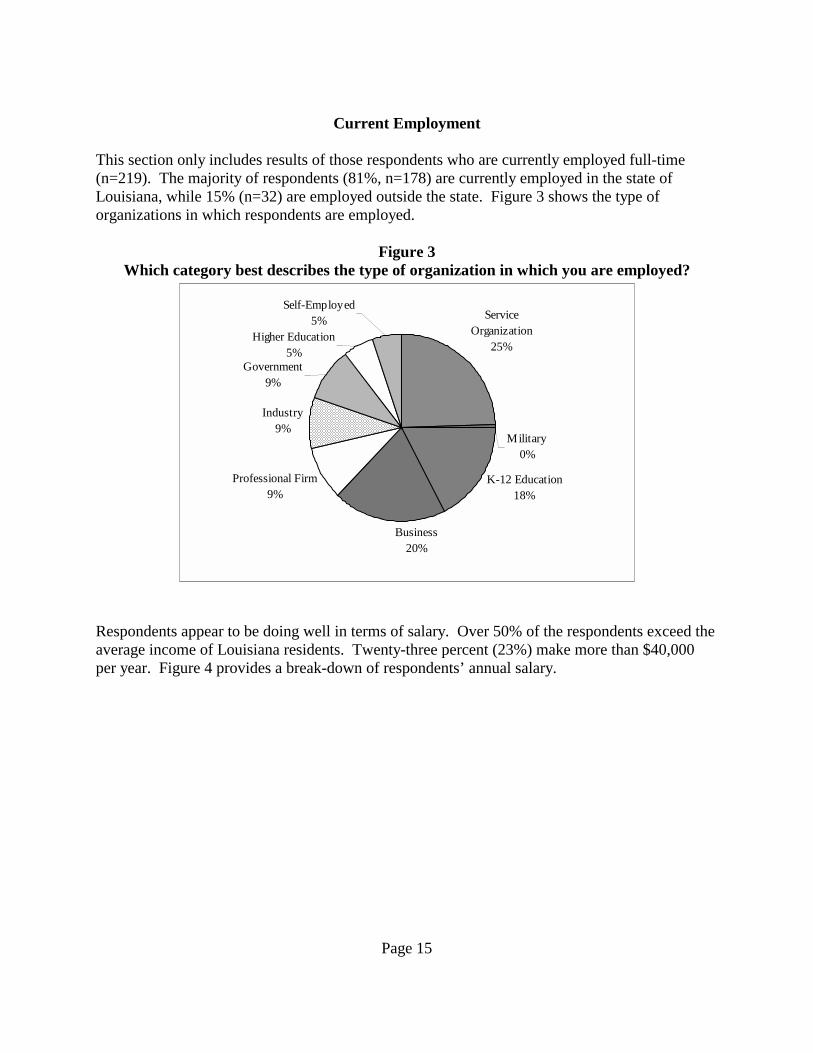
Current Employment This section only includes results of those respondents who are currently employed full-time (n=219). The majority of respondents (81%, n=178) are currently employed in the state of Louisiana, while 15% (n=32) are employed outside the state. Figure 3 shows the type of organizations in which respondents are employed.
Figure 3 Which category best describes the type of organization in which you are employed?
Service Organization
25%
K-12 Education18%
Professional Firm9%
Industry9%
Government9%
Business20%
Military0%
Self-Employed5%
Higher Education5%
Respondents appear to be doing well in terms of salary. Over 50% of the respondents exceed the average income of Louisiana residents. Twenty-three percent (23%) make more than $40,000 per year. Figure 4 provides a break-down of respondents’ annual salary.

Page 16
Figure 4 Please indicate your annual salary range.
0%
10%
20%
30%
40%
50%
60%
70%
80%
90%
100%
More than $50,000$40,001-$50,000$30,001-$40,000$25,001-$30,000$20,001-$25,000$15,001-$20,000$10,000-$15,000Less than $10,000
Average Louisiana Income
Overall, respondents are satisfied with their current employment. Forty-two percent (42%, n=92) indicated they are well satisfied and would not consider leaving, while 45% (n=99) are satisfied, but would consider leaving for more desirable employment. Only 8% (n=17) dislike their employment, and an additional 1% (n=1) are not sure. A quarter (25%, n=54) of the respondents did indicate that they are currently underemployed, that is their job requires lower levels of skill and training than those they acquired at Southeastern. The majority of the respondents are employed in the area of their Southeastern major, or in an area related to their major. Twenty percent (20%, n=44) of the respondents are employed in an area not related to their Southeastern major. The main reason for not being employed in an area related to their Southeastern major is because they “Could not find a job” they wanted (30%, n=13). This was followed by: “Better pay” (18%, n=8), “New career interest” (18%, n=8), “Better opportunity for advancement” (14%, n=6), “Never planned to” (7%, n=3), “Would have to relocate for a job” in the field (7%, n=3), and “Have not obtained licensure, registration, or certification required for my field” (5%, n=2).
Professional Activities Fifteen percent of the respondents (15%, n=41) indicated that licensure/certification is not available in their field. Of the remaining, 36% (n=98) currently hold licensure/certification in their field. Of the 47% (n=128) who do not currently have licensure, 38% (n=49) plan to obtain licensure/certification in the next 12 months. Our graduates are moderately active in professional organizations. Forty-one percent (n=112) are a member of a professional organization, and 44% (n=120) had attended a professional meeting in the past year.

Page 17
Overall Satisfaction with Southeastern
In general, respondents were satisfied with Southeastern. Forty percent (40%, n=109) had a Very Positive general attitude toward Southeastern, and an additional 46% (n=126) had a Positive general attitude toward Southeastern. Thirty-one respondents (11%) indicated they had a Neutral general attitude toward Southeastern. Two percent (n=5) had a Negative attitude toward Southeastern, and only 1% (n=2) had a Very Negative general attitude. When asked if they would recommend Southeastern to a friend or family member considering college, 59% (n=161) said they would with no reservations, an additional 34% (n=94) indicated they would with some reservations, and 4% (n=10) indicated they would with strong reservations. Two percent (n=6) indicated they probably would not, and two respondents indicated they would not under any circumstances. Overwhelmingly respondents indicated that if they were to do it again, they would elect to attend Southeastern for their undergraduate degree (n=207, 76%). Fifteen percent (15%, n=40) did not know if they would attend Southeastern, and only 10% (n=26) indicated they would not attend Southeastern. When asked to compare the quality of education provided at Southeastern with that of other universities, 29% (n=80) indicated it was better than most, 62% (n=169) indicated it was about the same as most, and 8% (n=21) indicated it was worse than most. Respondents were also asked if their college education had improved the quality of their life, regardless of the financial benefits. Ninety-five percent (95%, n=259) indicated that the quality of their life had improved, and 5% (n=14) indicated it had not improved.
Comparison to Other Years A similar survey was conducted in Fall 1997 (1994-94/1995-96 graduates) and Fall 1999 (1996-97/1997-98 graduates). The percent of respondents continuing or planning to continue their education is slowly decreasing. Eighty-four (84%) of the 1994-95/1995-96 graduates were either continuing their education or planned to continue it. However only 77% of the 1998-99/1999-2000 graduates had such plans. Respondents with satisfactory employment has remained steady at 92%. A higher percentage of students are indicating that Southeastern faculty helped them find their first full-time job, from 5% in the 1997 survey to 10% in the current survey. More students are reporting an annual salary which exceeds the Louisiana average, from 40% in 1997 to 50% in 2001. In 1997, only 8% of respondents reported an annual income of more than $40,000, while in 2001, 23% reported that level of income.

Page 18
Department of Biological Sciences
Table 6 Satisfaction with Degree Program
Number of Respondents: B.S. Biological Sciences - 11; B.S. Horticulture - 6; B.S. Science
Education - 4
Very Dissatisfied - 1
2
3
4
Very Satisfied - 5
Overall quality of your department B.S. Biological Sciences 0.0% 0.0% 63.6%(7) 18.2%(2) 18.2%(2)B.S. Horticulture 16.7%(1) 0.0% 50.0%(3) 0.0% 33.3%(2)B.S. Science Education 0.0% 0.0% 25.0%(1) 25.0%(1) 50.0%(2)Overall quality of your degree program B.S. Biological Sciences 0.0% 9.1%(1) 36.4%(4) 27.3%(3) 27.3%(3)B.S. Horticulture 0.0% 0.0% 50.0% (3) 33.3%(2) 16.7%(1)B.S. Science Education 0.0% 0.0% 25.0%(1) 25.0%(1) 50.0%(2)Clarity of the degree requirements as outlined in the catalogue and/or curriculum sheets B.S. Biological Sciences 0.0% 0.0% 18.2%(2) 63.6%(7) 18.2%(2)B.S. Horticulture 0.0% 0.0% 33.3%(2) 0.0% 66.7%(4)B.S. Science Education 0.0% 0.0% 0.0% 50.0%(2) 50.0% (2)Usefulness of the academic advice you received from your advisor B.S. Biological Sciences 45.5%(5) 18.2%(2) 0.0% 18.2%(2) 18.2%(2)B.S. Horticulture 0.0% 16.7%(1) 33.3%(2) 33.3%(2) 16.7%(1)B.S. Science Education 0.0% 0.0% 0.0% 25.0%(1) 75.0%(3)Opportunities to interact with faculty outside of class B.S. Biological Sciences 0.0% 18.2%(2) 54.5%(6) 9.1%(1) 18.2%9(2)B.S. Horticulture 0.0% 16.7%(1) 16.7%(1) 33.3%(2) 33.3%(2)B.S. Science Education 0.0% 0.0% 25.0%(1) 0.0% 75.0%(3)Effectiveness of the faculty as teachers B.S. Biological Sciences 0.0% 0.0% 45.5%(5) 27.3%(3) 27.3%(3)B.S. Horticulture 0.0% 0.0% 33.3%(2) 50.0%(3) 16.7%(1)B.S. Science Education 0.0% 0.0% 0.0% 25.0%(1) 75.0%(3)Friendliness and helpfulness of the office staff B.S. Biological Sciences 18.2%(2) 18.2%(2) 18.2%(2) 18.2%(2) 27.3%(3)B.S. Horticulture 0.0% 16.7%(1) 50.0%(3) 0.0% 33.3%(2)B.S. Science Education 0.0% 25.0%(1) 0.0% 25.0%(1) 50.0%(2)

Page 19
Table 6 continued
Satisfaction with Degree Program Department of Biological Sciences
Number of Respondents: B.S. Biological Sciences - 11; B.S. Horticulture - 6; B.S. Science Education - 4
Very Dissatisfied - 1
2
3
4
Very Satisfied - 5
Interest shown by faculty in your academic development B.S. Biological Sciences 9.1%(1) 36.4%(4) 18.2%(2) 18.2%(2) 18.2%(2)B.S. Horticulture 0.0% 0.0% 50.0% (3) 33.3%(2) 16.7%(1)B.S. Science Education 0.0% 0.0% 25.0%(1) 25.0%(1) 50.0% (2)Effectiveness of beginning courses in preparing you for advanced courses B.S. Biological Sciences 0.0% 27.3%(3) 36.4%(4) 18.2%(2) 18.2%(2)B.S. Horticulture 0.0% 0.0% 50.0% (3) 33.3%(2) 16.7%(1)B.S. Science Education 0.0% 0.0% 25.0%(1) 50.0%(2) 25.0%(1)Quality of instruction in advanced courses B.S. Biological Sciences 0.0% 9.1%(1) 9.1%(1) 36.4%(4) 45.5%(5)B.S. Horticulture 0.0% 0.0% 16.7%(1) 16.7%(1) 50.0%(3)B.S. Science Education 0.0% 0.0% 0.0% 25.0%(1) 75.0%(3)Professional activities, associations, or clubs B.S. Biological Sciences 9.1%(1) 18.2%(2) 36.4%(4) 18.2%(2) 18.2%(2)B.S. Horticulture 0.0% 0.0% 50.0%(3) 33.3%(2) 16.7%(1)B.S. Science Education 0.0% 0.0% 25.0%(1) 75.0%(3) 0.0%Practicum, internship, clinical, or other hands-on experiences outside of the classroom B.S. Biological Sciences 18.2%(2) 18.2%(2) 36.4%(4) 9.1%(1) 18.2%(2)B.S. Horticulture 16.7%(1) 16.7%(1) 33.3%(2) 16.7%(1) 16.7%(1)B.S. Science Education 0.0% 0.0% 0.0% 0.0% 100.0%(4)Opportunity for meaningful interaction with faculty in research or other scholarly activityB.S. Biological Sciences 18.2%(2) 36.4%(4) 27.3%(3) 0.0% 18.2%(2)B.S. Horticulture 0.0% 16.7%(1) 16.7%(1) 33.3%(2) 33.3%(2)B.S. Science Education 0.0% 25.0%(1) 25.0%(1) 25.0%(1) 25.0%(1)Availability of the required courses B.S. Biological Sciences 36.4%(4) 27.3%(3) 9.1%(1) 9.1%(1) 18.2%(2)B.S. Horticulture 0.0% 50.0% (3) 33.3%(2) 16.7%(1) 0.0%B.S. Science Education 0.0% 50.0%(2) 25.0%(1) 25.0%(1) 0.0%

Page 20
Table 6 continued
Satisfaction with Degree Program Department of Biological Sciences
Number of Respondents: B.S. Biological Sciences - 11; B.S. Horticulture - 6; B.S. Science Education - 4
Very Dissatisfied - 1
2
3
4
Very Satisfied - 5
Availability of elective courses you wanted to take in your major B.S. Biological Sciences 18.2%(2) 18.2%(2) 18.2%(2) 27.3%(3) 18.2%(2)B.S. Horticulture 0.0% 0.0% 66.7%(4) 16.7%(1) 16.7%(1)B.S. Science Education 0.0% 25.0%(1) 0.0% 50.0%(2) 25.0%(1)Quality of instruction regarding standards and ethics in your major field B.S. Biological Sciences 0.0% 18.2%(2) 45.5%(5) 18.2%(2) 18.2%(2)B.S. Horticulture 16.7%(1) 16.7%(1) 16.7%(1) 16.7%(1) 33.3%(2)B.S. Science Education 0.0% 0.0% 0.0% 25.0%(1) 75.0%(3)Friendliness and helpfulness of faculty B.S. Biological Sciences 0.0% 9.1%(1) 54.5%(6) 18.2%(2) 18.2%(2)B.S. Horticulture 0.0% 16.7%(1) 33.3%(2) 16.7%(1) 33.3%(2)B.S. Science Education 0.0% 25.0%(1) 0.0% 25.0%(1) 50.0%(2)Opportunities for you to collaborate with other students on class projects B.S. Biological Sciences 0.0% 9.1%(1) 27.3%(3) 36.4%(4) 27.3%(3)B.S. Horticulture 0.0% 0.0% 33.3%(2) 50.0%(3) 16.7%(1)B.S. Science Education 0.0% 0.0% 25.0%(1) 25.0%(1) 50.0% (2)Computer resources (PC and/or mainframe) for courses in your major B.S. Biological Sciences 0.0% 27.3%(3) 18.2%(2) 36.4%(4) 18.2%(2)B.S. Horticulture 0.0% 16.7%(1) 50.0%(3) 16.7%(1) 16.7%(1)B.S. Science Education 0.0% 0.0% 25.0%(1) 0.0% 75.0%(3)Library resources related to your major B.S. Biological Sciences 9.1%(1) 18.2%(2) 45.5%(5) 9.1%(1) 18.2%(2)B.S. Horticulture 16.7%(1) 0.0% 33.3%(2) 33.3%(2) 16.7%(1)B.S. Science Education 0.0% 0.0% 0.0% 50.0%(2) 50.0% (2)Use of appropriate technology in the classroom B.S. Biological Sciences 0.0% 36.4%(4) 36.4%(4) 18.2%(2) 9.1%(1)B.S. Horticulture 16.7%(1) 16.7%(1) 16.7%(1) 33.3%(2) 16.7%(1)B.S. Science Education 0.0% 0.0% 25.0%(1) 25.0%(1) 50.0% (2)
Page 21
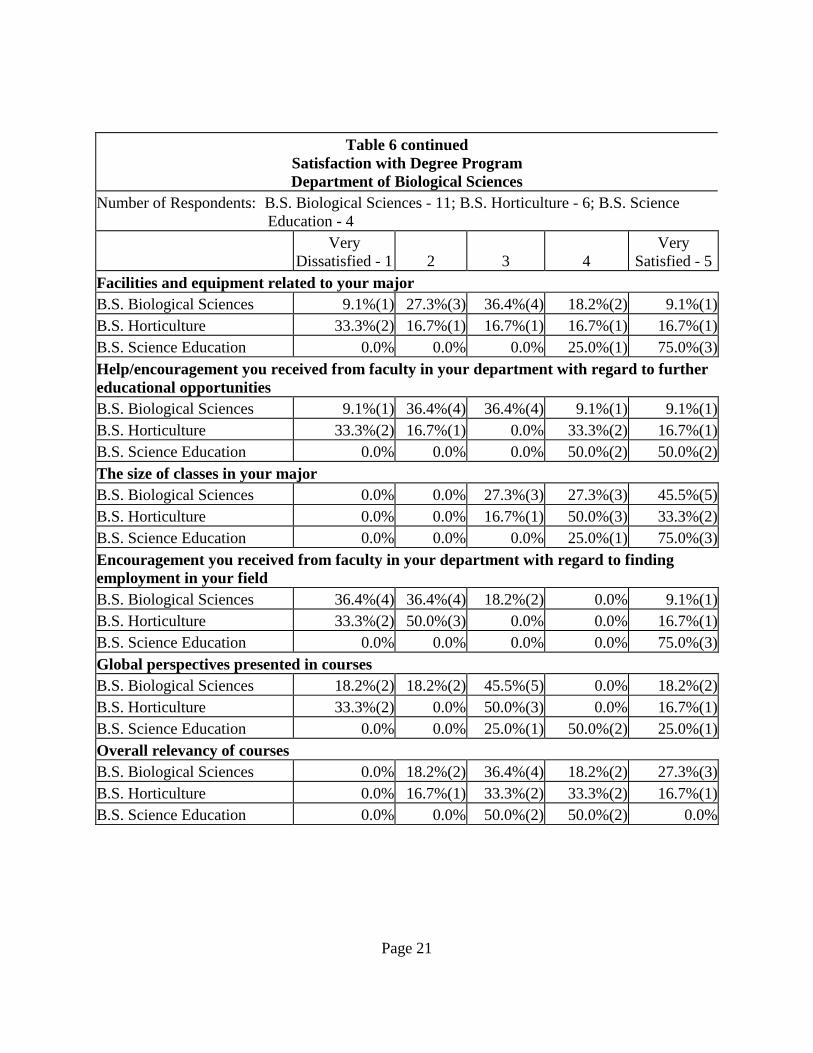
Table 6 continued
Satisfaction with Degree Program Department of Biological Sciences
Number of Respondents: B.S. Biological Sciences - 11; B.S. Horticulture - 6; B.S. Science Education - 4
Very Dissatisfied - 1
2
3
4
Very Satisfied - 5
Facilities and equipment related to your major B.S. Biological Sciences 9.1%(1) 27.3%(3) 36.4%(4) 18.2%(2) 9.1%(1)B.S. Horticulture 33.3%(2) 16.7%(1) 16.7%(1) 16.7%(1) 16.7%(1)B.S. Science Education 0.0% 0.0% 0.0% 25.0%(1) 75.0%(3)Help/encouragement you received from faculty in your department with regard to further educational opportunities B.S. Biological Sciences 9.1%(1) 36.4%(4) 36.4%(4) 9.1%(1) 9.1%(1)B.S. Horticulture 33.3%(2) 16.7%(1) 0.0% 33.3%(2) 16.7%(1)B.S. Science Education 0.0% 0.0% 0.0% 50.0%(2) 50.0%(2)The size of classes in your major B.S. Biological Sciences 0.0% 0.0% 27.3%(3) 27.3%(3) 45.5%(5)B.S. Horticulture 0.0% 0.0% 16.7%(1) 50.0%(3) 33.3%(2)B.S. Science Education 0.0% 0.0% 0.0% 25.0%(1) 75.0%(3)Encouragement you received from faculty in your department with regard to finding employment in your field B.S. Biological Sciences 36.4%(4) 36.4%(4) 18.2%(2) 0.0% 9.1%(1)B.S. Horticulture 33.3%(2) 50.0%(3) 0.0% 0.0% 16.7%(1)B.S. Science Education 0.0% 0.0% 0.0% 0.0% 75.0%(3)Global perspectives presented in courses B.S. Biological Sciences 18.2%(2) 18.2%(2) 45.5%(5) 0.0% 18.2%(2)B.S. Horticulture 33.3%(2) 0.0% 50.0%(3) 0.0% 16.7%(1)B.S. Science Education 0.0% 0.0% 25.0%(1) 50.0%(2) 25.0%(1)Overall relevancy of courses B.S. Biological Sciences 0.0% 18.2%(2) 36.4%(4) 18.2%(2) 27.3%(3)B.S. Horticulture 0.0% 16.7%(1) 33.3%(2) 33.3%(2) 16.7%(1)B.S. Science Education 0.0% 0.0% 50.0%(2) 50.0%(2) 0.0%

Page 22
Table 6 continued
Satisfaction with Degree Program Department of Biological Sciences
No Yes 2. Would you recommend Southeastern to someone interested in what you majored in? B.S. Biological Sciences 54.5%(6) 45.5%(5) B.S. Horticulture 33.3%(2) 66.7%(4) B.S. Science Education 0.0% 100.0% (4) 3. If you had it to do over again, would you choose the same major?
B.S. Biological Sciences 36.4%(4) 27.3% (3); 36.4%(4) Not at Southeastern
B.S. Horticulture 33.3%(2) 16.7%(1); 50.0%(3) Not at Southeastern
B.S. Science Education 0.0% 100.0% (4) 4. Did you participate in an internship, a practicum, a clinical experience, or student
teaching as part of your degree requirements? B.S. Biological Sciences 90.9%(10) 9.1%(1) B.S. Horticulture 100.0%(6) 0.0% B.S. Science Education 0.0% 100.0% (4) 6. Should a hands-on course be required in your program? B.S. Biological Sciences 27.3%(3) 54.5%(6) B.S. Horticulture 0.0% 83.3%(5) B.S. Science Education 0.0% 100.0% (4) When asked what benefits they received from hands-on experience, Biology graduates had the following to say:
“Got a chance to actually get out of the classroom and into the field for some actual experience instead of always looking at a book.”
Science Education graduates had the following to say about hands-on experience:
“I participated in the student teaching aspect of my degree requirements. It gave me an idea of what exactly I needed to improve on in terms of being an effective teacher.”
“It was one of the few education classes that actually helped me to prepare for teaching. Methods and tests and measurements also helped.”
“Much more ‘realistic’ then any education class I took at SLU.”

Page 23
Perceptions of Southeastern
B.S. Biological Sciences None of the Biology graduates had participated in the study-abroad/student exchange program, but all of them thought it would be a valuable experience. Five (45.5%) of the respondents had participated in the honors program. One (20.0%) of the participants was “Very Satisfied” with the honors program, three (60.0%) were “Somewhat Satisfied”, and one (20.0%) was “Somewhat Dissatisfied.” Four of the respondents had participated in a research program. Two (50.0%) of the participants were “Very Satisfied” and two (50.0%) were “Somewhat Satisfied.” B.S. Horticulture None of the Horticulture graduates had participated in the study-abroad/student exchange program, but 83% (n=5) of them thought it would be a valuable experience. None of the respondents had participated in the honors program. Two (33.3%) of the respondents had participated in a research program. Both (100%) of the participants were Somewhat Satisfied. B.S. Science Education None of the Science Education graduates had participated in the study-abroad/student exchange program, but all of them thought it would be a valuable experience. None of the respondents had participated in the honors program. One (25.0%) of the respondents had participated in a research program, and the respondents was “Very Satisfied” with it.
Graduate/Professional Education B.S. Biological Sciences One (9.1%) of the respondents is currently enrolled in a graduate/professional degree program. Two (18.2%) of the respondents have completed a graduate or professional degree, one (9.1%) of the respondents plans to enroll in a degree program in the next 12 months, and five (45.5%) respondents are likely to enroll in a degree program in the future. Two (18.2%) respondents have no plans for further education. Of those respondents who have plans for further education, five (55.6%) plan on obtaining a master’s, three (33.3%) plan on obtaining a doctorate and one (11.1%) plans on obtaining a professional degree. Of the three individuals with graduate school experience, one (33.3%) indicated that his/her educational experiences at Southeastern were “Very Effective” in preparing her/him for further graduate/professional study, and two (66.7%) indicated that they were “Effective”. One (33.3%) indicated that Southeastern prepared him/her “Worse than Most” other students and two (66.7%) indicated that Southeastern prepared them “About the Same as Most”.
Page 24
Of the three respondents who are enrolled in a degree program or had completed a degree, two (66.7%) indicated it was “Very Closely Related” to their bachelor’s degree from Southeastern. B.S. Horticulture One (16.7%) of the respondents has earned a degree, but did not specify what type of degree, and one (16.7%) plans on enrolling in a degree program in the future. Four respondents (66.7%) have no plans for further graduate/professional study. Of those with plans for further study, one (50.0%) of the respondents plans on obtaining a master’s degree and one (50.0%) plans on obtaining a doctorate. The respondent who has completed a degree felt his/her undergraduate experiences “Ineffectively” prepared him/her for graduate study. In addition, the respondent felt she/he was prepared “About the Same as Most” other students. B.S. Science Education One (25.0%) of the respondents is currently enrolled in a graduate/professional degree program, one (25.0%) plans to enroll in a degree program in the next 12 months, and two (50.0%) are likely to enroll in a degree program in the future. Two (50.0%) respondents plan on obtaining a master’s and two (50.0%) plan on obtaining a doctorate.
Employment B.S. Biological Sciences Eighty-two percent of the respondents (81.8%, n=9) are employed full-time. Nine percent (9.1%, n=1) are employed part-time and satisfied with part-time employment while 9% (9.1%, n=1) are not employed but looking for employment. Two (18.2%) of the respondents have never had a full-time job since graduating from Southeastern, but they have looked for one. Two (18.2%) of the respondents had their jobs before completing their degrees, five (45.5%) respondents obtained a job 1-6 months after graduation, one (9.1%) found a job 7-12 months after graduation, and one (9.1%) took over a year to find a job. The nine respondents who did not have a job upon graduation faced a variety of problems in obtaining employment. Table 7 presents what were considered major problems, minor problems, or no problem.

Page 25
Table 7
Please indicate whether each of the following was a major problem, minor problem, or not a problem in obtaining employment after graduating from Southeastern with your Bachelors. Major Problem Minor Problem Not A Problem Limited to only one geographic area 0.0% 0.0% 88.9% (8) Not knowing what I wanted to do 33.3% (3) 22.2% (2) 33.3% (3) Tight job market 22.2% (2) 55.6% (5) 11.1% (1) Lack of marketable skills 33.3% (3) 22.2% (2) 33.3% (3) Lack of educational qualifications 22.2% (2) 11.1% (1) 55.6% (5) Reputation of Southeastern 0.0% 11.1% (1) 77.8% (7) Lack of experience 44.4% (4) 33.3% (3) 11.1% (1) Lack of job search skills 11.1% (1) 55.6% (5) 22.2% (2) Poor GPA 0.0% 0.0% 88.9% (8) Racial discrimination 0.0% 0.0% 88.9% (8) Gender discrimination 0.0% 0.0% 88.9% (8) Age discrimination 0.0% 33.3% (3) 55.6% (5) Of those respondents who have had a full-time job since graduating, three (33.3%) indicated their education was “Effective” in preparing them for employment or improving their job performance, while five (55.6%) indicated it was “Ineffective”. Six (66.7%) of the respondents indicated that they are currently in their first full-time job since graduating from Southeastern, one (11.1%) has had two full-time jobs since graduating, and two (22.2%) have had three or more full-time jobs. In regards to sources for learning about their first full-time job, two (22.2%) indicated a newspaper or trade publication, one (11.1%) from another student or friend, one (11.1%) was recruited by an employer, and one (11.1%) from the Internet. Of the eleven respondents who are currently employed full-time, seven (22.2%) are employed in the state of Louisiana, and two (22.2%) are employed out of state. Three (33.3%) of the respondents are employed in a service organization, two (22.2%) are employed in government, one (11.1%) in a professional firm, one (11.1%) in industry, and two (22.2%) are self-employed. When asked “If underemployment is defined as a condition in which your job requires lower levels of skill and training than those you acquired in college, would you say that you are currently underemployed”, two (22.2%) respondents felt they are not underemployed, while seven (77.8%) felt they are underemployed. When asked about satisfaction with their present employment, one (11.1%) of the respondents is “Well satisfied; would not consider leaving”; six (66.7%) of the respondents are “Satisfied, but would consider more desirable employment”; two (18.2%) of the respondents “Dislike employment; seeking or will seek other employment.” Three (33.3%) of the respondents are currently employed in the area of their Southeastern major, five (55.6%) are employed in an area related to their Southeastern major, and one (11.1%) is

Page 26
employed in an area not related to their Southeastern major because of better pay. Four (22.2%) of the respondents gave a salary range of $20,001-$25,000, three (33.3%) gave a salary range of $25,001-$30,000, two (22.2%) gave a salary range of $30,001-$40,000, and two (22.2%) indicated an annual salary of greater than $50,000. B.S. Horticulture Eighty-three percent of the respondents (83.3%, n=5) are employed full-time. One (16.7%) is employed part-time and satisfied with part-time employment while one (9.1%) is not employed but looking for employment. Two (33.3%) of the respondents had their jobs before completing their degrees, one (16.7%) had a job upon graduations, two (33.3%) respondents obtained a job 1-6 months after graduation, and one (16.7%) found a job 7-12 months after graduation. The three respondents who did not have a job upon graduation indicated that “limited to only one geographic area” was a major problem in obtaining employment, while “tight job market”and “lack of experience” were minor problems. Of those respondents who have had a full-time job since graduating, one (16.7%) indicated his/her education was “Very Effective” in preparing her/him for employment or improving his/her job performance, while three (50.0%) indicated it was “Effective”. Two (33.3%) of the respondents indicated that they are currently in their first full-time job since graduating from Southeastern, one (16.7%) has had two full-time jobs since graduating, and one (16.7%) has had three or more full-time jobs. In regards to sources for learning about their first full-time job, three (50.0%) indicated parents or relative, and one (16.7%) already had a job. One of the respondents who is employed full-time did not respond to this section, so the results are based on four respondents. All of the respondents are employed in the state of Louisiana. Two (50.0%) of the respondents are employed in a business, one (25.0%) is self-employed, and one (25.0%) is in the military. When asked “If underemployment is defined as a condition in which your job requires lower levels of skill and training than those you acquired in college, would you say that you are currently underemployed”, all of the respondents felt they are not underemployed. When asked about satisfaction with their present employment, two (25.0%) of the respondents are “Well satisfied; would not consider leaving”and two (25.0%) are “Satisfied, but would consider more desirable employment”. Three (75.0%) of the respondents are currently employed in the area of their Southeastern major and one (25.0%) is employed in an area related to his/her Southeastern major. Two (50.0%) of the respondents gave a salary range of $30,001-$40,000, one indicated a range of $40,001-$50,00, and one (25.0%) indicated an annual salary of greater than $50,000.

Page 27
B.S. Science Education One of the respondents did not answer any of the employment questions, therefore this section of the analyses is based on three respondents. All of the respondents are employed full-time. One (33.3%) of the respondents had his/her job before completing her/his degree and two (66.7%) respondents obtained a job 1-6 months after graduation. The two respondents who did not have a job upon graduation indicated that “tight job market” was a minor problem in obtaining employment. One (33.3%) of the respondents indicated his/her education was “Very Effective” in preparing him/her for employment or improving her/his job performance and one (33.3%) indicated it was “Effective”. Two (66.7%) of the respondents indicated that they are currently in their first full-time job since graduating from Southeastern and one (33.3%) has had two full-time jobs since graduating. All the respondents are employed in K-12 education in the state of Louisiana. When asked “If underemployment is defined as a condition in which your job requires lower levels of skill and training than those you acquired in college, would you say that you are currently underemployed”, all of the respondents felt they are not underemployed. When asked about satisfaction with their present employment, two (66.7%) of the respondents are “Well satisfied; would not consider leaving” and one (33.3%) of the respondents is “Satisfied, but would consider more desirable employment”. All of the respondents are currently employed in the area of their Southeastern major. Two (66.7%) of the respondents gave a salary range of $25,001-$30,000 and one (33.3%) gave a salary range of $30,001-$40,000.
Professional Activities B.S. Biological Sciences Three (27.3%) of the respondents indicated that licensure/certification is not available in their field, and five (45.5%) indicated that they do not have licensure/certification. Three (27.3%) currently do have licensure/certification, one has ALT CERT. 2- BIO, one has Medical technologist, and one is a registered radiologic technologist. Of those who do not have licensure/certification, three (60.0%) plan on obtaining it in the next twelve months, one as a Horticulture Service/Landscape Contractor, one as an oncology, cytogenetics technologist, and one a LMT. Two (18.2%) of the respondents are members of a professional organization, and three (27.3%) have attended a professional meeting in the past year. B.S. Horticulture

Page 28
One (16.7%) of the respondents indicated that licensure/certification is not available and one (16.7%) does not have liscensure/certification and does not plan on obtaining it. Four of the respondents (66.7%) currently hold licensure/certification. One in Horticulture services, one has LNLA certification, one as a Landscape contractor, and one has a Chemical App. license. Four (66.7%) of the respondents are members of a professional organization, and five (83.3%) have attended a professional meeting in the past year. B.S. Science Education All of the respondents indicated they have teaching certification. All (100%) of the respondents are members of a professional organization, and three (75.0%) have attended a professional meeting in the past year.
Special Questions B.S. Science Education All of the respondents completed the insert which contained the special questions. All four indicated they teach in public schools, three in St. Tammany parish and one in Lafayette. Respondents were first asked what activities they thought would be helpful as they began their career. Table 8 provides the activities and the percent of respondents who thought they would be useful.
Table 8 University Assistance for Beginning Teachers
Activity % Useful
Workshops on various topics 50.0% Assistance with the use of technology in the classroom 25.0% Observations upon request 0.0% Assistance from content specialist 100.0% Seminars on a regular basis at Southeastern 25.0% On-line Assistance 25.0% Other: More classes in content area, less in education 25.0%
Next, students were asked how much assistance they would like to have in various areas during their first two years of teaching. Table 9 provides the percentage of desired help for each area.

Page 29
Table 9 Amount of Assistance Desired During First Two Years of Teaching
1 - No
Help 2 3 4 5 - Lots of Help
Communicating with the principal 75.0% 25.0% 0.0% 0.0% 0.0% Communicating with parents 50.0% 25.0% 0.0% 0.0% 25.0% Planning specific learner outcomes in clear, concise objectives 100.0% 0.0% 0.0% 0.0% 0.0%
Creating activities that develop objectives 25.0% 0.0% 75.0% 0.0% 0.0% Identifying and planning for individual differences 25.0% 0.0% 25.0% 50.0% 0.0%
Identifying and using appropriate materials needed for lessons 50.0% 25.0% 25.0% 0.0% 0.0%
Assessing student progress 75.0% 0.0% 25.0% 0.0% 0.0% Organizing available space, materials and/or equipment to facilitate learning 100.0% 0.0% 0.0% 0.0% 0.0%
Managing routines and transitions in a timely manner 100.0% 0.0% 0.0% 0.0% 0.0%
Establishing expectations for learner behavior 100.0% 0.0% 0.0% 0.0% 0.0% Seeking community involvement in instructional programs 50.0% 25.0% 0.0% 25.0% 0.0%
Communicating with students 50.0% 25.0% 0.0% 25.0% 0.0% Integrating technology into instruction 50.0% 0.0% 50.0% 0.0% 0.0% Using monitoring techniques to facilitate learning 100.0% 0.0% 0.0% 0.0% 0.0%
Sequencing lessons to promote learning 75.0% 25.0% 0.0% 0.0% 0.0% Maintaining an environment conducive to learning 100.0% 0.0% 0.0% 0.0% 0.0%
Acquiring additional knowledge of content 50.0% 0.0% 0.0% 50.0% 25.0% Remaining knowledgeable of current scholarship 75.0% 0.0% 0.0% 25.0% 0.0%
When asked what other areas they would have liked assistance, respondents answered: ! Again, more credit hours in biology, chemistry, etc. Practical lab experiments
designed for the minimally equipped high school lab situation!

Page 30
Finally, respondents were asked what was they thought the most important thing Southeastern could do to provide assistance in their teaching. Respondents gave the following replies: ! Provide ideas & activities to promote hands-on learning ! A mentoring professor the first year of teaching. ! Eliminate some of the education classes, as many of the topics are redundant. Focus
more on content knowledge & lab experience for secondary education majors. The more we know, the more we can pass on to our students!
! If I taught closer, I would probably like a more close relationship/sharing equipment with my department at the university.

Page 31
Department of Communications
Table 11 Satisfaction with Degree Program
Number of Respondents: B.A. Communications-10
Very Dissatisfied - 1
2
3
4
Very Satisfied - 5
Overall quality of your department B.A. Communication 0.0% 0.0% 10.0%(1) 50.0%(5) 40.0%(4)Overall quality of your degree program B.A. Communication 0.0% 0.0% 20.0%(2) 40.0%(4) 40.0%(4)Clarity of the degree requirements as outlined in the catalogue and/or curriculum sheets B.A. Communication 0.0% 0.0% 10.0%(1) 10.0%(1) 80.0%(8)Usefulness of the academic advice you received from your advisor B.A. Communication 10.0%(1) 0.0% 30.0%(3) 40.0%(4) 20.0%(2)Opportunities to interact with faculty outside of class B.A. Communication 0.0% 10.0%(1) 0.0% 50.0%(5) 40.0%(4)Effectiveness of the faculty as teachers B.A. Communication 0.0% 0.0% 10.0%(1) 10.0%(1) 80.0%(8)Friendliness and helpfulness of the office staff B.A. Communication 10.0%(1) 0.0% 20.0%(2) 10.0%(1) 60.0%(6)Interest shown by faculty in your academic development B.A. Communication 0.0% 10.0%(1) 0.0% 30.0%(3) 60.0%(6)Effectiveness of beginning courses in preparing you for advanced courses B.A. Communication 0.0% 10.0%(1) 0.0% 20.0%(2) 70.0%(7)Quality of instruction in advanced courses B.A. Communication 0.0% 0.0% 20.0%(2) 20.0%(2) 60.0%(6)Professional activities, associations, or clubs B.A. Communication 0.0% 10.0%(1) 50.0%(5) 20.0%(2) 20.0%(2)Practicum, internship, clinical, or other hands-on experiences outside of the classroom B.A. Communication 10.0%(1) 0.0% 30.0%(3) 30.0%(3) 30.0%(3)Opportunity for meaningful interaction with faculty in research or other scholarly activityB.A. Communication 10.0%(1) 10.0%(1) 10.0%(1) 50.0%(5) 20.0%(2)Availability of the required courses B.A. Communication 10.0%(1) 0.0% 20.0%(2) 60.0%(6) 10.0%(1)

Page 32
Table 11 continued
Satisfaction with Degree Program Department of Communications
Number of Respondents: B.A. Communications-10
Very Dissatisfied - 1
2
3
4
Very Satisfied - 5
Availability of elective courses you wanted to take in your major B.A. Communication 0.0% 0.0% 20.0%(2) 70.0%(7) 10.0%(1)Quality of instruction regarding standards and ethics in your major field B.A. Communication 0.0% 0.0% 20.0%(2) 20.0%(2) 60.0%(6)Friendliness and helpfulness of faculty B.A. Communication 0.0% 0.0% 10.0%(1) 30.0%(3) 60.0%(6)Opportunities for you to collaborate with other students on class projects B.A. Communication 0.0% 0.0% 0.0% 30.0%(3) 70.0%(7)Computer resources (PC and/or mainframe) for courses in your major B.A. Communication 0.0% 10.0%(1) 60.0%(6) 0.0% 30.0%(3)Library resources related to your major B.A. Communication 0.0% 10.0%(1) 30.0%(3) 40.0%(4) 10.0%(1)Use of appropriate technology in the classroom B.A. Communication 10.0%(1) 10.0%(1) 30.0%(3) 30.0%(3) 20.0%(2)Facilities and equipment related to your major B.A. Communication 10.0%(1) 10.0%(1) 40.0%(4) 10.0%(1) 30.0%(3)Help/encouragement you received from faculty in your department with regard to further educational opportunities B.A. Communication 0.0% 20.0%(2) 0.0% 40.0%(4) 40.0%(4)The size of classes in your major B.A. Communication 0.0% 0.0% 10.0%(1) 20.0%(2) 70.0%(7)Encouragement you received from faculty in your department with regard to finding employment in your field B.A. Communication 20.0%(2) 30.0%(3) 10.0%(1) 10.0%(1) 30.0%(3)Global perspectives presented in courses B.A. Communication 0.0% 0.0% 40.0%(4) 30.0%(3) 30.0%(3)Overall relevancy of courses B.A. Communication 0.0% 10.0%(1) 0.0% 60.0%(6) 30.0%(3)
Page 33
Table 11 continued
Satisfaction with Degree Program Department of Communications
No Yes 2. Would you recommend Southeastern to someone interested in what you majored in? B.A. Communication 30.0%(3) 70.0%(7) 3. If you had it to do over again, would you choose the same major? B.A. Communication 50.0%(5) 50.0%(5) 4. Did you participate in an internship, a practicum, a clinical experience, or student
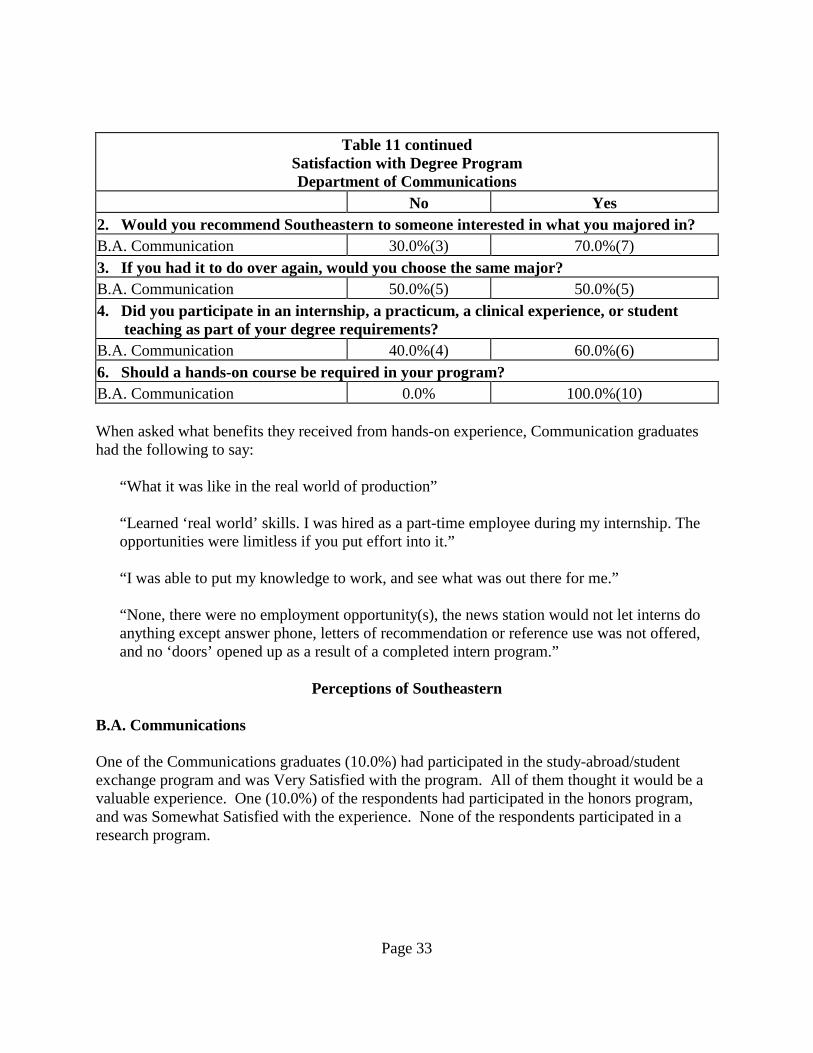
teaching as part of your degree requirements? B.A. Communication 40.0%(4) 60.0%(6) 6. Should a hands-on course be required in your program? B.A. Communication 0.0% 100.0%(10) When asked what benefits they received from hands-on experience, Communication graduates had the following to say:
“What it was like in the real world of production”
“Learned ‘real world’ skills. I was hired as a part-time employee during my internship. The opportunities were limitless if you put effort into it.”
“I was able to put my knowledge to work, and see what was out there for me.”
“None, there were no employment opportunity(s), the news station would not let interns do anything except answer phone, letters of recommendation or reference use was not offered, and no ‘doors’ opened up as a result of a completed intern program.”
Perceptions of Southeastern
B.A. Communications One of the Communications graduates (10.0%) had participated in the study-abroad/student exchange program and was Very Satisfied with the program. All of them thought it would be a valuable experience. One (10.0%) of the respondents had participated in the honors program, and was Somewhat Satisfied with the experience. None of the respondents participated in a research program.

Page 34
Graduate/Professional Education
B.A. Communications Three (30.0%) of the respondents are currently enrolled in a graduate/professional degree program. One (10.0%) of the respondents has completed a master’s degree. One (10.0%) of the respondents has taken classes, but not enrolled in a degree program. Two (20.0%) of the respondents plan to enroll in a degree program in the next 12 months, and three (30.0%) are likely to enroll in a degree program in the future. Four (40.0%) of the respondents plan on obtaining a master’s, three (30.0%) plan on obtaining a doctorate, and three (30.0%) plan on obtaining a professional degree. Of the five individuals with graduate school experience, four (80.0%) indicated that Southeastern prepared them “Effectively” for further graduate/professional study, and one indicated he/she was “Very Effectively” prepared. All of the respondents (100%) indicated that Southeastern prepared them “About the Same as Most” other students. Of the four respondents who are enrolled in a degree program or had completed a degree, one (25.0%) indicated it was “Very Closely Related” and two (50.0%) indicated it was “Somewhat Related” to their bachelor’s degree from Southeastern.
Employment B.A. Communications The majority of the respondents (90.0%, n=9) are employed full-time, and one (10.0%) respondent is unemployed but looking for full-time employment. Two (20.0%) of the respondents had their jobs before completing their degrees, one (10.0%) accepted a position upon graduation, six (60.0%) respondents obtained a job 1-6 months after graduation and one (10.0%) has never had full-time employment, but has looked. The seven respondents who did not have a job upon graduation, faced a variety of problems in obtaining employment. Table 12 presents what were considered major problems, minor problems, or no problem for the remaining seventeen.

Page 35
Table 12
Please indicate whether each of the following was a major problem, minor problem, or not a problem in obtaining employment after graduating from Southeastern with your Bachelors. Major Problem Minor Problem Not A Problem Limited to only one geographic area 14.3% (1) 0.0% 57.1% (4) Not knowing what I wanted to do 0.0% 14.3% (1) 57.1% (4) Tight job market 14.3% (1) 0.0% 57.1% (4) Lack of marketable skills 28.6% (2) 28.6% (2) 14.3% (1) Lack of educational qualifications 0.0% 42.9% (3) 28.6% (2) Reputation of Southeastern 0.0% 14.3% (1) 57.1% (4) Lack of experience 42.9% (3) 0.0% 28.6% (2) Lack of job search skills 0.0% 28.6% (2) 42.9% (3) Poor GPA 0.0% 0.0% 71.4% (5) Racial discrimination 0.0% 0.0% 71.4% (5) Gender discrimination 0.0% 14.3% (1) 57.1% (4) Age discrimination 0.0% 14.3% (1) 57.1% (4) Of those respondents who have had a full-time job since graduating, one (11.1%) indicated his/her education was “Very Effective” in preparing them for employment or improving their job performance, six (66.7%) indicated it was “Effective”, and one (11.1%) indicated it was “Ineffective”. Three (33.3%) of the respondents indicated that they are currently in their first full-time job since graduating from Southeastern and five (55.6%) have had two full-time jobs since graduating. In regards to sources for learning about their first full-time job, two (22.2%) indicated faculty at Southeastern, two (22.2%) from another student or friend, one (11.1%) was recruited by an employer, and one (11.1%) from the Internet. All (100%) of the respondents who are employed full-time, work in the state of Louisiana. Four (44.4%) of the respondents are employed in higher education, three (33.3%) are employed in business, and two (22.2%) are employed in a professional firm. When asked “If underemployment is defined as a condition in which your job requires lower levels of skill and training than those you acquired in college, would you say that you are currently underemployed”, seven (77.8%) respondents felt they are not underemployed, while two (22.2%) felt they are underemployed. When asked about satisfaction with their present employment, six (66.7%) are “Satisfied, but would consider more desirable employment” and three (33.3%) “Dislike employment; seeking or will seek other employment”. Six (66.7%) of the respondents are currently employed in an area related to their Southeastern major and three (33.3%) are employed in an area not related to their Southeastern major. One (33.3%) of the respondents not employed in an area related to their major indicated that better pay was the reason, one (33.3%) respondent could not find a job he/she wanted, and one (33.3%)
Page 36
for better opportunity for advancement. Two (22.2%) of the respondents gave a salary range of $20,001-$25,000 and seven (77.8%) gave a salary range of $25,001-$30,000.
Professional Activities B.A. Communication Six (60.0%) of the respondents indicated that licensure/certification is not available in their field, and four (40.0%) indicated they did not have licensure/certification. Of those who do not have licensure/certification, one (25.0%) plans on obtaining it in the next twelve months, but did not indicate the type of licensure/certification. Five (50.0%) of the respondents are members of a professional organization, and six (60.0%) have attended a professional meeting in the past year.

Page 37
Department of English
Table 13 Satisfaction with Degree Program
Number of Respondents: B. A. English-3
Very Dissatisfied - 1
2
3
4
Very Satisfied - 5
Overall quality of your department B.A. English 0.0% 0.0% 33.3% (1) 0.0% 66.7% (2)Overall quality of your degree program B.A. English 0.0% 0.0% 33.3% (1) 33.3%(1) 33.3% (1)Clarity of the degree requirements as outlined in the catalogue and/or curriculum sheets B.A. English 0.0% 0.0% 33.3%(1) 66.7%(2) 0.0%Usefulness of the academic advice you received from your advisor B.A. English 0.0% 0.0% 0.0% 66.7%(2) 33.3% (1)Opportunities to interact with faculty outside of class B.A. English 0.0% 33.3%(1) 0.0% 0.0% 66.7% (2)Effectiveness of the faculty as teachers B.A. English 0.0% 0.0% 33.3% (1) 0.0% 66.7% (2)Friendliness and helpfulness of the office staff B.A. English 0.0% 0.0% 0.0% 33.3%(1) 66.7% (2)Interest shown by faculty in your academic development B.A. English 0.0% 0.0% 0.0% 33.3%(1) 66.7% (2)Effectiveness of beginning courses in preparing you for advanced courses B.A. English 0.0% 0.0% 33.3% (1) 33.3%(1) 33.3%(1)Quality of instruction in advanced courses B.A. English 0.0% 33.3%(1) 0.0% 0.0% 66.7% (2)Professional activities, associations, or clubs B.A. English 0.0% 33.3%(1) 0.0% 33.3%(1) 33.3%(1)Practicum, internship, clinical, or other hands-on experiences outside of the classroom B.A. English 0.0% 33.3%(1) 0.0%) 33.3% (1) 33.3%(1)Opportunity for meaningful interaction with faculty in research or other scholarly activityB.A. English 33.3%(1) 0.0% 0.0% 33.3% (1) 33.3% (1)Availability of the required courses B.A. English 33.3%(1) 0.0% 33.3%(1) 33.3% (1) 0.0%

Page 38
Table 13 continued
Satisfaction with Degree Program Department of English
Number of Respondents: B. A. English-3
Very Dissatisfied - 1
2
3
4
Very Satisfied - 5
Availability of elective courses you wanted to take in your major B.A. English 33.3%(1) 0.0% 33.3%(1) 33.3%(1) 0.0% Quality of instruction regarding standards and ethics in your major field B.A. English 33.3%(1) 0.0% 0.0% 33.3% (1) 33.3%(1)Friendliness and helpfulness of faculty B.A. English 0.0% 33.3%(1) 0.0% 0.0% 66.7% (2)Opportunities for you to collaborate with other students on class projects B.A. English 0.0% 33.3%(1) 0.0% 33.3% (1) 33.3%(1)Computer resources (PC and/or mainframe) for courses in your major B.A. English 33.3%(1) 0.0% 33.3%(1) 0.0% 33.3%(1)Library resources related to your major B.A. English 33.3%(1) 33.3% (1) 33.3%(1) 0.0% 0.0%Use of appropriate technology in the classroom B.A. English 33.3%(1) 33.3%(1) 0.0% 33.3% (1) 0.0%Facilities and equipment related to your major B.A. English 66.7%(2) 0.0% 0.0% 33.3% (1) 0.0%Help/encouragement you received from faculty in your department with regard to further educational opportunities B.A. English 33.3%(1) 0.0% 0.0% 33.3%(1) 33.3% (1)The size of classes in your major B.A. English 33.3%(1) 0.0% 0.0% 0.0% 66.7%(2)Encouragement you received from faculty in your department with regard to finding employment in your field B.A. English 33.3%(1) 0.0% 0.0% 0.0% 66.7%(2)Global perspectives presented in courses B.A. English 33.3%(1) 0.0% 0.0% 33.3% (1) 33.3% (1)Overall relevancy of courses B.A. English 33.3%(1) 0.0% 0.0% 33.3% (1) 33.3% (1)

Page 39
Table 13 continued
Satisfaction with Degree Program Department of English
No Yes 2. Would you recommend Southeastern to someone interested in what you majored in? B.A. English 33.3%(1) 66.7%(2) 3. If you had it to do over again, would you choose the same major? B.A. English 33.3%(1) 66.7% (2) 4. Did you participate in an internship, a practicum, a clinical experience, or student
teaching as part of your degree requirements? B.A. English 0.0% 100.0%(3) 6. Should a hands-on course be required in your program? B.A. English 0.0% 100.0%(3) When asked what benefits they received from hands-on experience, English graduates had the following to say:
“Invaluable experience which led to eventually employment with same company - highly effective.”
“What I realized was how inadequately prepared I was to do the work. Technology and the English Dept. have not yet become-one.”
“Teaching/scheduling experience”
Perceptions of Southeastern
B.A. English None of the English graduates had participated in the study-abroad/student exchange. All of them thought it would be a valuable experience. One (33.3%) of the respondents had participated in the honors program, and was Very Satisfied with the experience. None of the respondents participated in a research program.
Graduate/Professional Education B.A. English One (33.3%) of the respondents has completed a master’s degree, and the other two respondents (66.7%) are currently enrolled in a graduate/professional degree program. Of the two currently enrolled, one (50.0%) of the respondents plans on obtaining a doctorate and one (50.0%) a professional degree.

Page 40
Two (66.7%) of the respondents indicated that their educational experience at Southeastern “Very Effectively” prepared them for further study, and one (33.3%) indicated he/she was “Ineffectively” prepared. One (33.3%) respondent indicated that Southeastern prepared her/him “Better than Most” students, and two (66.7%) indicated that Southeastern prepared them “About the Same as Most” students. One (33.3%) respondent indicated that his/her graduate degree program was “Very Closely Related” to her/his bachelor’s degree from Southeastern and two (66.7%) indicated it was “Somewhat Related”.
Employment B. A. English All of the respondents (100%) are employed full-time. Two respondents (66.7%) had a job prior to graduation and one (33.3%) accepted a job upon graduation. One of the respondents (33.3%) indicated his/her education was “Very Effective” in preparing her/him for employment or improving their job performance, one (33.3%) indicated it was “Effective”, and one (33.3%) indicated it was “Ineffective”. All of the respondents indicated that they are currently in their first full-time job since graduating from Southeastern. In regards to sources for learning about their first full-time job, one (33.3%) indicated faculty at Southeastern, one (33.3%) from a parent or relative, one (33.3%) from a newspaper/trade publication, and two (66.7%) from an internship or practicum. All of the respondents are employed in the state of Louisiana. One (33.3%) in higher education, one (33.3%) in business, and one (33.3%) in a professional firm. When asked “If underemployment is defined as a condition in which your job requires lower levels of skill and training than those you acquired in college, would you say that you are currently underemployed”, two (66.7%) indicated they were not underemployed, while one respondent (33.3%) indicated she/he is underemployed. When asked about satisfaction with their present employment, two (66.7%) were “Well Satisfied; would not consider leaving”, and one (33.3%) was “Satisfied, but would consider more desirable employment”. One (33.3%) of the respondents is working in the area of his/her Southeastern major, one in a related area and one in an area not related because the respondent could not find a job he/she wanted. All (100%) of the respondents gave a salary range of $30,001-$40,000.
Professional Activities B.A. English None of the respondents have licensure/certification nor do they plan on obtaining it in the next 12 months. All (100%) of the respondents are members of a professional organization and two (66.7%) of the respondents have attended a professional meeting in the past year.

Page 41
Department of Foreign Languages
Table 16 Satisfaction with Degree Program
Number of Respondents: B.A. Spanish - 5
Very Dissatisfied - 1
2
3
4
Very Satisfied - 5
Overall quality of your department B.A. Spanish 0.0% 0.0% 20.0%(1) 40.0%(2) 40.0%(2)Overall quality of your degree program B.A. Spanish 0.0% 0.0% 40.0%(2) 40.0%(2) 20.0%(@)Clarity of the degree requirements as outlined in the catalogue and/or curriculum sheets B.A. Spanish 0.0% 40.0%(2) 0.0% 20.0%(1) 40.0%(2)Usefulness of the academic advice you received from your advisor B.A. Spanish 20.0%(1) 20.0%(1) 0.0% 20.0%(1) 40.0%(2)Opportunities to interact with faculty outside of class B.A. Spanish 0.0% 20.0%(1) 20.0%(1) 20.0%(1) 40.0%(2)Effectiveness of the faculty as teachers B.A. Spanish 0.0% 20.0%(1) 0.0% 60.0%(3) 20.0%(1)Friendliness and helpfulness of the office staff B.A. Spanish 20.0%(1) 0.0% 20.0%(1) 0.0% 60.0%(3)Interest shown by faculty in your academic development B.A. Spanish 0.0% 0.0% 20.0%(1) 20.0%(1) 60.0%(3)Effectiveness of beginning courses in preparing you for advanced courses B.A. Spanish 0.0% 20.0%(1) 40.0%(2) 20.0%(1) 20.0%(1)Quality of instruction in advanced courses B.A. Spanish 0.0% 20.0%(1) 20.0%(1) 40.0%(2) 20.0%(1)Professional activities, associations, or clubs B.A. Spanish 0.0% 20.0%(1) 60.0%(3) 20.0%(1) 0.0% Practicum, internship, clinical, or other hands-on experiences outside of the classroom B.A. Spanish 0.0% 40.0%(2) 40.0%(2) 0.0% 20.0%(1)Opportunity for meaningful interaction with faculty in research or other scholarly activityB.A. Spanish 0.0% 20.0%(1) 40.0%(2) 20.0%(1) 20.0%(1)Availability of the required courses B.A. Spanish 0.0% 40.0%(2) 20.0%(1) 40.0%(2) 0.0%

Page 42
Table 16 continued
Satisfaction with Degree Program Department of Foreign Languages
Number of Respondents: B.A. Spanish - 5
Very Dissatisfied - 1
2
3
4
Very Satisfied - 5
Availability of elective courses you wanted to take in your major B.A. Spanish 20.0%(1) 20.0%(1) 60.0%(3) 0.0% 0.0%Quality of instruction regarding standards and ethics in your major field B.A. Spanish 0.0% 20.0%(1) 20.0%(1) 20.0%(1) 40.0%(2)Friendliness and helpfulness of faculty B.A. Spanish 0.0% 0.0% 40.0%(2) 20.0%(1) 40.0%(2)Opportunities for you to collaborate with other students on class projects B.A. Spanish 0.0% 20.0%(1) 60.0%(3) 20.0%(1) 0.0% Computer resources (PC and/or mainframe) for courses in your major B.A. Spanish 40.0%(2) 0.0% 40.0%(2) 20.0%(1) 0.0%Library resources related to your major B.A. French 0.0% 0.0% 0.0% 0.0% 100.0% (1)B.A. Spanish 40.0%(2) 0.0% 40.0%(2) 20.0%(1) 0.0%Use of appropriate technology in the classroom B.A. Spanish 40.0%(2) 20.0%(1) 0.0% 40.0%(2) 0.0%Facilities and equipment related to your major B.A. Spanish 40.0%(2) 0.0% 20.0%(1) 40.0%(2) 0.0%Help/encouragement you received from faculty in your department with regard to further educational opportunities B.A. Spanish 0.0% 0.0% 20.0%(1) 40.0%(2) 40.0%(2)The size of classes in your major B.A. Spanish 0.0% 20.0%(1) 20.0%(1) 20.0%(1) 40.0%(2)Encouragement you received from faculty in your department with regard to finding employment in your field B.A. Spanish 0.0% 20.0%(1) 40.0%(2) 20.0%(1) 20.0%(1)Global perspectives presented in courses B.A. Spanish 0.0% 20.0%(1) 40.0%(2) 0.0% 40.0%(2)Overall relevancy of courses B.A. Spanish 0.0% 20.0%(1) 20.0%(1) 0.0% 60.0%(3)
Page 43
Table 16 continued Satisfaction with Degree Program Department of Foreign Languages
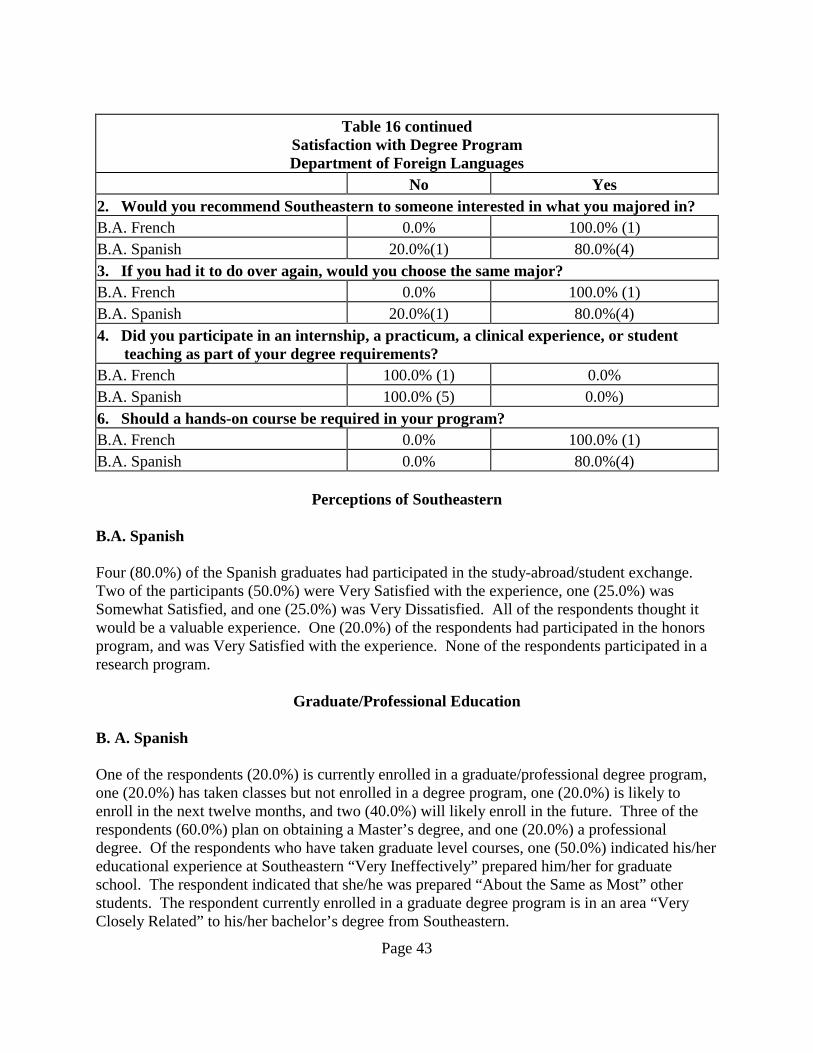
No Yes 2. Would you recommend Southeastern to someone interested in what you majored in? B.A. French 0.0% 100.0% (1) B.A. Spanish 20.0%(1) 80.0%(4) 3. If you had it to do over again, would you choose the same major? B.A. French 0.0% 100.0% (1) B.A. Spanish 20.0%(1) 80.0%(4) 4. Did you participate in an internship, a practicum, a clinical experience, or student
teaching as part of your degree requirements? B.A. French 100.0% (1) 0.0% B.A. Spanish 100.0% (5) 0.0%) 6. Should a hands-on course be required in your program? B.A. French 0.0% 100.0% (1) B.A. Spanish 0.0% 80.0%(4)
Perceptions of Southeastern B.A. Spanish Four (80.0%) of the Spanish graduates had participated in the study-abroad/student exchange. Two of the participants (50.0%) were Very Satisfied with the experience, one (25.0%) was Somewhat Satisfied, and one (25.0%) was Very Dissatisfied. All of the respondents thought it would be a valuable experience. One (20.0%) of the respondents had participated in the honors program, and was Very Satisfied with the experience. None of the respondents participated in a research program.
Graduate/Professional Education B. A. Spanish One of the respondents (20.0%) is currently enrolled in a graduate/professional degree program, one (20.0%) has taken classes but not enrolled in a degree program, one (20.0%) is likely to enroll in the next twelve months, and two (40.0%) will likely enroll in the future. Three of the respondents (60.0%) plan on obtaining a Master’s degree, and one (20.0%) a professional degree. Of the respondents who have taken graduate level courses, one (50.0%) indicated his/her educational experience at Southeastern “Very Ineffectively” prepared him/her for graduate school. The respondent indicated that she/he was prepared “About the Same as Most” other students. The respondent currently enrolled in a graduate degree program is in an area “Very Closely Related” to his/her bachelor’s degree from Southeastern.

Page 44
Employment
B.A. Spanish Four of the respondents (80.0%) are employed full-time, and one (20.0%) is unemployed but seeking employment. One of the respondents had a full-time job prior to graduating and three (60.0%) took 1-6 months after graduation to find a full-time job. The respondents who did not have a full-time job upon graduation indicated that “Not knowing what I wanted to do” was a major problem in finding employment, while “Tight job market” and “Lack of educational qualifications” were minor problems. Of the respondents who have had a full-time job since graduating from Southeastern, two (50.0%) respondents indicated their education was “Effective” in preparing them for employment or improving their job performance. Two (50.0%) of the respondents indicated that they are currently in their first full-time job since graduating from Southeastern, one (25.0%) has had two jobs, and one (25.0%) has had three or more jobs. Of the respondents currently employed full-time three (75.0%) are employed in the state of Louisiana and one (25.0%) out of state. One (25.0%) respondent is employed in a professional firm and three (75.0%) in K-12 education. When asked “If underemployment is defined as a condition in which your job requires lower levels of skill and training than those you acquired in college, would you say that you are currently underemployed”, three (75.0%) indicated they were not underemployed, while one respondent (25.0%) indicated she/he is underemployed. When asked about satisfaction with their present employment, three (75.0%) were “Well Satisfied; would not consider leaving”, and one (25.0%) was “Satisfied, but would consider more desirable employment”. Three (75.0%) of the respondents are working in the area of their Southeastern major and one in an area not related because the respondent would have to relocate for a job in his/her field. One of the respondents (25.0%) indicated an annual salary range of $15,001-$20,000, two (50.0%) indicated a range of $25,001-$30,000 and one (25.0%) indicated a range of $40,002-$50,000.
Professional Activities B.A. Spanish Two of the respondents (40.0%) currently hold licensure/certification. One has a teaching certificate and one is a Certified Child Care Director. The three respondents who currently do not hold licensure/certification plan on obtaining it in the next twelve months, one plans on obtaining a teaching certificate, one a professional engineers license, and one a CPA. Three (75.0%) of the respondents are members of a professional organization, and two (40.0%) have attended a professional meeting within the past year.

Page 45
General Studies
Table 17 Satisfaction with Degree Program
Number of Respondents: B.G.S. General Studies - 15
Very Dissatisfied - 1
2
3
4
Very Satisfied - 5
Overall quality of your department B.G.S. General Studies 0.0% 0.0% 46.7%(7) 26.7%(4) 26.7%(4)Overall quality of your degree program B.G.S. General Studies 0.0% 13.3%(2) 13.3%(2) 46.7%(7) 26.7%(4)Clarity of the degree requirements as outlined in the catalogue and/or curriculum sheets B.G.S. General Studies 0.0% 6.7%(1) 13.3%(2) 40.0%(6) 40.0%(6)Usefulness of the academic advice you received from your advisor B.G.S. General Studies 20.0%(3) 6.7%(1) 20.0%(3) 40.0%(6) 13.3%(2)Opportunities to interact with faculty outside of class B.G.S. General Studies 6.7%(1) 6.7%(1) 26.7%(4) 13.3%(2) 46.7%(7)Effectiveness of the faculty as teachers B.G.S. General Studies 0.0% 0.0% 20.0%(3) 26.7%(4) 53.3%(8)Friendliness and helpfulness of the office staff B.G.S. General Studies 6.7%(1) 6.7%(1) 33.3%(5) 20.0%(3) 33.3%(5)Interest shown by faculty in your academic development B.G.S. General Studies 6.7%(1) 13.3%(2) 0.0% 40.0%(6) 40.0%(6)Effectiveness of beginning courses in preparing you for advanced courses B.G.S. General Studies 0.0% 6.7%(1) 20.0%(3) 40.0%(6) 33.3%(5)Quality of instruction in advanced courses B.G.S. General Studies 0.0% 0.0% 6.7%(1) 60.0%(9) 33.3%(5)Professional activities, associations, or clubs B.G.S. General Studies 0.0% 0.0% 40.0% (6) 26.7%(4) 26.7%(4)Practicum, internship, clinical, or other hands-on experiences outside of the classroom B.G.S. General Studies 0.0% 13.3%(2) 26.7%(4) 26.7%(4) 26.7%(4)Opportunity for meaningful interaction with faculty in research or other scholarly activityB.G.S. General Studies 0.0% 13.3%(2) 33.3%(5) 26.7%(4) 20.0%(3)Availability of the required courses B.G.S. General Studies 0.0% 6.7%(1) 13.3%(2) 53.3%(8) 26.7%(4)

Page 46
Table 17 continued
Satisfaction with Degree Program General Studies
Number of Respondents: B.G.S. General Studies - 15
Very Dissatisfied - 1
2
3
4
Very Satisfied - 5
Availability of elective courses you wanted to take in your major B.G.S. General Studies 6.7%(1) 6.7%(1) 6.7%(1) 53.3%(8) 26.7%(4)Quality of instruction regarding standards and ethics in your major field B.G.S. General Studies 0.0% 0.0% 20.0%(3) 46.7%(7) 33.3%(5)Friendliness and helpfulness of faculty B.G.S. General Studies 0.0% 20.0%(3) 6.7%(1) 33.3%(5) 40.0%(6)Opportunities for you to collaborate with other students on class projects B.G.S. General Studies 0.0% 6.7%(1) 6.7%(1) 33.3%(5) 53.3%(8)Computer resources (PC and/or mainframe) for courses in your major B.G.S. General Studies 0.0% 13.3%(2) 13.3%(2) 33.3%(5) 40.0%(6)Library resources related to your major B.G.S. General Studies 0.0% 0.0% 13.3%(2) 33.3%(5) 53.3%(8)Use of appropriate technology in the classroom B.G.S. General Studies 0.0% 6.7%(1) 20.0%(3) 26.7%(4) 46.7%(7)Facilities and equipment related to your major B.G.S. General Studies 0.0% 0.0% 26.7%(4) 26.7%(4) 46.7%(7)Help/encouragement you received from faculty in your department with regard to further educational opportunities B.G.S. General Studies 6.7%(1) 6.7%(1) 20.0%(3) 33.3%(5) 33.3%(5)The size of classes in your major B.G.S. General Studies 0.0% 6.7%(1) 6.7%(1) 40.0%(6) 46.7%(7)Encouragement you received from faculty in your department with regard to finding employment in your field B.G.S. General Studies 20.0%(3) 13.3%(2) 40.0%(6) 20.0%(3) 6.7%(1)Global perspectives presented in courses B.G.S. General Studies 0.0% 6.7%(1) 40.0%(6) 13.3%(2) 40.0%(6)Overall relevancy of courses B.G.S. General Studies 0.0% 6.7%(1) 26.7%(4) 33.3%(5) 33.3%(5)

Page 47
Table 17 continued
Satisfaction with Degree Program General Studies
No Yes 2. Would you recommend Southeastern to someone interested in what you majored in? B.G.S. General Studies 33.3%(5) 66.7%(10) 3. If you had it to do over again, would you choose the same major?
B.G.S. General Studies 80.0%(12) 13.3%(2); 6.7% (1)Not at Southeastern
4. Did you participate in an internship, a practicum, a clinical experience, or student teaching as part of your degree requirements?
B.G.S. General Studies 66.7%(10) 33.3%(5) 6. Should a hands-on course be required in your program? B.G.S. General Studies 46.7%(7) 40.0%(6) When asked what benefits they received from hands-on experience, General Studies graduates had the following to say:
“I learned what my job would really be like.”
“I was able to get a good idea of what it would be like in the real world in my chosen profession.”
“Very informative about how the environment will be.”
“I got to see how things worked instead of just hearing about it from a professor.”
Perceptions of Southeastern
B.G.S. General Studies None of the General Studies graduates had participated in the study-abroad/student exchange, but all of them thought it would be a valuable experience. Two (13.3%) of the respondents had participated in the honors program. One (50.0%) was Very Satisfied with the experience and one (50.0%) was somewhat satisfied. One (6.7%) of the respondents participated in a research program and was Very Satisfied with the experience.
Graduate/Professional Education Four (26.7%) of the respondents are currently enrolled in a graduate/professional degree program. One (6.7%) of the respondents has completed a master’s degree and one (6.7%) has taken classes but not enrolled in a degree program. One (6.7%) of the respondents plans to
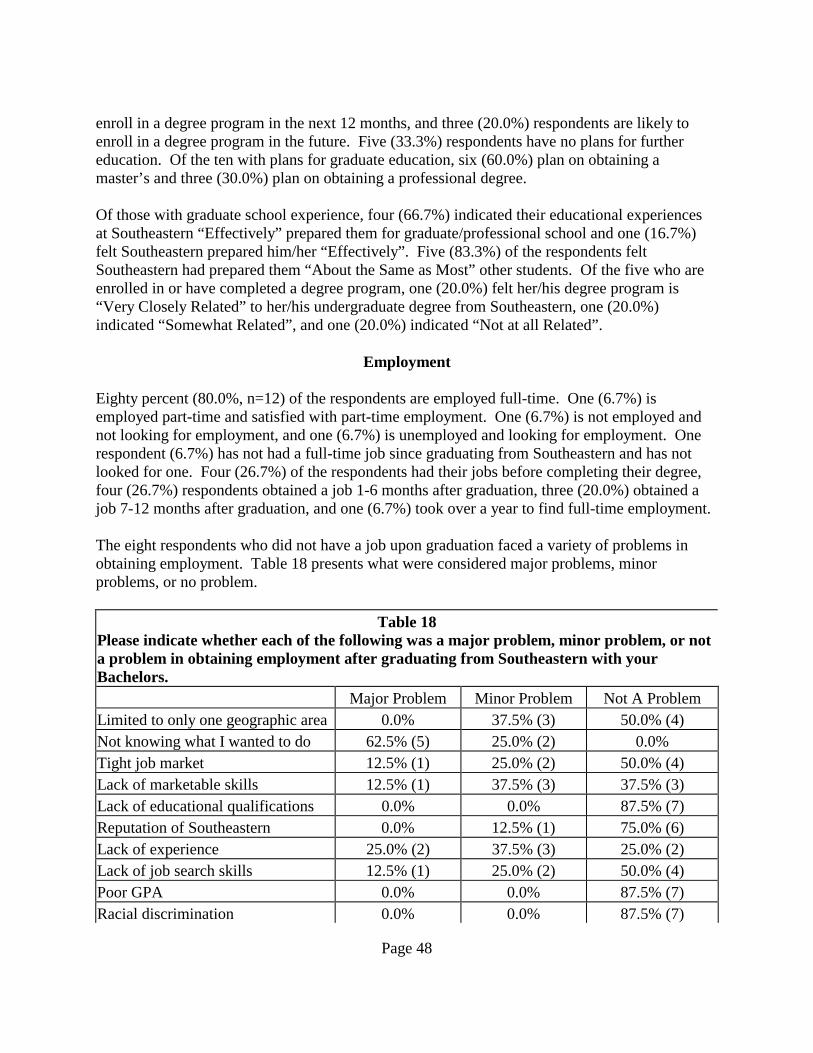
Page 48
enroll in a degree program in the next 12 months, and three (20.0%) respondents are likely to enroll in a degree program in the future. Five (33.3%) respondents have no plans for further education. Of the ten with plans for graduate education, six (60.0%) plan on obtaining a master’s and three (30.0%) plan on obtaining a professional degree. Of those with graduate school experience, four (66.7%) indicated their educational experiences at Southeastern “Effectively” prepared them for graduate/professional school and one (16.7%) felt Southeastern prepared him/her “Effectively”. Five (83.3%) of the respondents felt Southeastern had prepared them “About the Same as Most” other students. Of the five who are enrolled in or have completed a degree program, one (20.0%) felt her/his degree program is “Very Closely Related” to her/his undergraduate degree from Southeastern, one (20.0%) indicated “Somewhat Related”, and one (20.0%) indicated “Not at all Related”.
Employment Eighty percent (80.0%, n=12) of the respondents are employed full-time. One (6.7%) is employed part-time and satisfied with part-time employment. One (6.7%) is not employed and not looking for employment, and one (6.7%) is unemployed and looking for employment. One respondent (6.7%) has not had a full-time job since graduating from Southeastern and has not looked for one. Four (26.7%) of the respondents had their jobs before completing their degree, four (26.7%) respondents obtained a job 1-6 months after graduation, three (20.0%) obtained a job 7-12 months after graduation, and one (6.7%) took over a year to find full-time employment. The eight respondents who did not have a job upon graduation faced a variety of problems in obtaining employment. Table 18 presents what were considered major problems, minor problems, or no problem.
Table 18 Please indicate whether each of the following was a major problem, minor problem, or not a problem in obtaining employment after graduating from Southeastern with your Bachelors. Major Problem Minor Problem Not A Problem Limited to only one geographic area 0.0% 37.5% (3) 50.0% (4) Not knowing what I wanted to do 62.5% (5) 25.0% (2) 0.0% Tight job market 12.5% (1) 25.0% (2) 50.0% (4) Lack of marketable skills 12.5% (1) 37.5% (3) 37.5% (3) Lack of educational qualifications 0.0% 0.0% 87.5% (7) Reputation of Southeastern 0.0% 12.5% (1) 75.0% (6) Lack of experience 25.0% (2) 37.5% (3) 25.0% (2) Lack of job search skills 12.5% (1) 25.0% (2) 50.0% (4) Poor GPA 0.0% 0.0% 87.5% (7) Racial discrimination 0.0% 0.0% 87.5% (7)

Page 49
Gender discrimination 0.0% 0.0% 87.5% (7) Age discrimination 0.0% 0.0% 87.5% (7) Two of the respondents (16.7%) indicated their education was “Very Effective” in preparing them for employment or improving their job performance, seven (58.3%) indicated it was “Effective”, and two (16.7%) indicated it was “Ineffective”. Eight (66.7%) of the respondents indicated that they are currently in their first full-time job since graduating from Southeastern and three (25.0%) are in their second full-time job. In regards to sources for learning about their first full-time job, two (16.7%) indicated a parent or relative, two (16.7%) from a newspaper/trade publication, and one (8.3%) already had the job. One of the twelve who are employed full-time did not complete the rest of the employment section, so the analyses are based on eleven respondents. All of the eleven who are employed full-time (100%) are employed in the state of Louisiana. One (9.1%) of the respondents is employed in higher education, three (27.3%) in business, two (18.2%) with a professional firm, one (9.1%) in K-12 education, two (16.7%) are in industry, and two (16.7%) are self-employed. When asked “If underemployment is defined as a condition in which your job requires lower levels of skill and training than those you acquired in college, would you say that you are currently underemployed”, seven (63.6%) felt they are not underemployed, while four (36.4%) felt they are underemployed. When asked about satisfaction with their present employment, four (36.4%) are “Well satisfied; would not consider leaving”; six (50.0%) are “Satisfied, but would consider more desirable employment”; and one (8.3%) of the respondents “Dislike employment; seeking or will seek other employment.” One (9.1%) of the respondents is currently employed in the area of his/her Southeastern major, three (27.3%) are employed in an area related to their Southeastern major, and seven (63.6%) are employed in an area not related to their Southeastern major. Of the six respondents not currently working in the field of their major, one (16.7%) never planned to work in the field, one (16.7%) developed a new career interest, two (33.33%) could not find a job they wanted in the field and two (33.3%) had better opportunity for advancement outside the field. Two (18.2%) of the respondents gave a salary range of $15,001-$20,000, one (9.1%) gave a range of $20,001-$25,000, four (36.4%) gave a range of $25,001-$30,000, three (27.3%) gave a salary range of $30,001-$40,000, and one (9.1%) gave a salary range of $40,001-$50,000.
Professional Activities Two (13.3%) of the respondents indicated that licensure/certification is not available in their field and one (6.7%) has a physical therapy license. Of the eleven who do not currently have licensure/certification, three (27.3%) plan on obtaining it in the next twelve months. One plans on obtaining SPH.rn and one CHES. Four (26.7%) respondents belong to a professional organization and four (26.7%) attended a professional meeting in the previous year.

Page 50
Department of History and Political Science
Table 19 Satisfaction with Degree Program
Number of Respondents: B.A. Government-3; B.A. History-3; B.A. Social Studies Education-3
Very Dissatisfied - 1
2
3
4
Very Satisfied - 5
Overall quality of your department B.A. Government 0.0% 0.0% 0.0% 66.7%(2) 33.3%(1)B.A. History 0.0% 0.0% 0.0% 33.3%(1) 66.7%(2)B.A. Social Studies Education 0.0% 0.0% 0.0% 66.7%(2) 33.3%(1)Overall quality of your degree program B.A. Government 0.0% 0.0% 0.0% 66.7%(2) 33.3%(1)B.A. History 0.0% 0.0% 0.0% 0.0% 100.0%(3)B.A. Social Studies Education 0.0% 0.0% 0.0% 66.7%(2) 33.3%(1)Clarity of the degree requirements as outlined in the catalogue and/or curriculum sheets B.A. Government 0.0% 0.0% 0.0% 66.7%(2) 33.3%(1)B.A. History 0.0% 0.0% 0.0% 66.7%(2) 33.3%(1)B.A. Social Studies Education 0.0% 33.3%(1) 0.0% 33.3%(1) 33.3%(1)Usefulness of the academic advice you received from your advisor B.A. Government 0.0% 0.0% 0.0% 66.7%(2) 33.3%(1)B.A. History 0.0% 0.0% 0.0% 33.3%(1) 66.7%(2)B.A. Social Studies Education 0.0% 33.3%(1) 33.3%(1) 0.0% 33.3%(1)Opportunities to interact with faculty outside of class B.A. Government 0.0% 0.0% 0.0% 66.7%(2) 33.3%(1)B.A. History 0.0% 0.0% 0.0% 66.7%(2) 33.3%(1)B.A. Social Studies Education 0.0% 0.0% 0.0% 66.7%(2) 33.3%(1)Effectiveness of the faculty as teachers B.A. Government 0.0% 0.0% 0.0% 66.7%(2) 33.3%(1)B.A. History 0.0% 0.0% 0.0% 0.0% 100.0%(3)B.A. Social Studies Education 0.0% 0.0% 0.0% 33.3%(1) 66.7%(2)

Page 51
Table 19 continued
Satisfaction with Degree Program Department of History and Political Science
Number of Respondents: B.A. Government-3; B.A. History-3; B.A. Social Studies Education-3
Very Dissatisfied - 1
2
3
4
Very Satisfied - 5
Friendliness and helpfulness of the office staff B.A. Government 0.0% 0.0% 0.0% 33.3%(1) 66.7%(2)B.A. History 0.0% 0.0% 0.0% 100.0%(3) 0.0%B.A. Social Studies Education 0.0% 0.0% 33.3%(1) 66.7%(2) 0.0%Interest shown by faculty in your academic development B.A. Government 0.0% 0.0% 0.0% 33.3%(1) 66.7%(2)B.A. History 0.0% 0.0% 0.0% 0.0% 100.0%(3)B.A. Social Studies Education 0.0% 0.0% 33.3%(1) 66.7%(2) 0.0%Effectiveness of beginning courses in preparing you for advanced courses B.A. Government 0.0% 0.0% 0.0% 66.7%(2) 33.3%(1)B.A. History 0.0% 0.0% 33.3%(1) 66.7%(2) 0.0%B.A. Social Studies Education 0.0% 0.0% 66.7%(2) 33.3%(1) 0.0%Quality of instruction in advanced courses B.A. Government 0.0% 0.0% 0.0% 33.3%(1) 66.7%(2)B.A. History 0.0% 0.0% 0.0% 0.0% 100.0%(3)B.A. Social Studies Education 0.0% 0.0% 0.0% 66.7%(2) 33.3%(1)Professional activities, associations, or clubs B.A. Government 0.0% 33.3%(1) 33.3%(1) 0.0% 33.3%(1)B.A. History 0.0% 0.0% 66.7%(2) 0.0% 0.0%B.A. Social Studies Education 0.0% 0.0% 66.7%(2) 33.3%(1) 0.0%Practicum, internship, clinical, or other hands-on experiences outside of the classroom B.A. Government 0.0% 33.3%(1) 33.3%(1) 0.0% 33.3%(1)B.A. History 0.0% 0.0% 33.3%(1) 33.3%(1) 0.0%B.A. Social Studies Education 0.0% 0.0% 0.0% 66.7%(2) 33.3%(1)

Page 52
Table 19 continued
Satisfaction with Degree Program Department of History and Political Science
Number of Respondents: B.A. Government-3; B.A. History-3; B.A. Social Studies Education-3
Very Dissatisfied - 1
2
3
4
Very Satisfied - 5
Opportunity for meaningful interaction with faculty in research or other scholarly activityB.A. Government 0.0% 0.0% 33.3%(1) 0.0% 66.7%(2)B.A. History 0.0% 0.0% 33.3%(1) 66.7%(2) 0.0%
B.A. Social Studies Education 0.0% 0.0% 33.3%(1) 66.7%(2) 0.0%
Availability of the required courses B.A. Government 0.0% 0.0% 33.3%(1) 33.3%(1) 33.3%(1)B.A. History 0.0% 0.0% 33.3%(1) 0.0% 66.7%(2)B.A. Social Studies Education 0.0% 0.0% 33.3%(1) 66.7%(2) 0.0%Availability of elective courses you wanted to take in your major B.A. Government 0.0% 0.0% 33.3%(1) 33.3%(1) 33.3%(1)B.A. History 0.0% 0.0% 0.0% 33.3%(1) 66.7%(2)B.A. Social Studies Education 0.0% 33.3%(1) 33.3%(1) 0.0% 33.3%(1)Quality of instruction regarding standards and ethics in your major field B.A. Government 0.0% 0.0% 0.0% 66.7%(2) 33.3%(1)B.A. History 0.0% 0.0% 0.0% 33.3%(1) 66.7%(2)B.A. Social Studies Education 0.0% 0.0% 33.3%(1) 66.7%(2) 0.0%Friendliness and helpfulness of faculty B.A. Government 0.0% 0.0% 0.0% 66.7%(2) 33.3%(1)B.A. History 0.0% 0.0% 0.0% 0.0% 100.0%(3)B.A. Social Studies Education 0.0% 0.0% 33.3%(1) 33.3%(1) 33.3%(1)Opportunities for you to collaborate with other students on class projects B.A. Government 0.0% 0.0% 0.0% 66.7%(2) 33.3%(1)B.A. History 0.0% 0.0% 66.7%(2) 33.3%(1) 0.0%B.A. Social Studies Education 0.0% 0.0% 66.7%(2) 0.0% 33.3%(1)

Page 53
Table 19 continued
Satisfaction with Degree Program Department of History and Political Science
Number of Respondents: B.A. Government-3; B.A. History-3; B.A. Social Studies Education-3
Very Dissatisfied - 1
2
3
4
Very Satisfied - 5
Computer resources (PC and/or mainframe) for courses in your major B.A. Government 0.0% 0.0% 66.7%(2) 0.0% 33.3%(1)B.A. History 0.0% 33.3%(1) 33.3%(1) 33.3%(1) 0.0%B.A. Social Studies Education 0.0% 0.0% 100.0%(3) 0.0% 0.0%Library resources related to your major B.A. Government 0.0% 0.0% 66.7%(2) 0.0% 33.3%(1)B.A. History 0.0% 0.0% 33.3%(1) 33.3%(1) 33.3%(1)B.A. Social Studies Education 0.0% 0.0% 33.3%(1) 33.3%(1) 33.3%(1)Use of appropriate technology in the classroom B.A. Government 0.0% 33.3%(1) 33.3%(1) 0.0% 33.3%(1)B.A. History 0.0% 0.0% 66.7%(2) 33.3%(1) 0.0%B.A. Social Studies Education 0.0% 0.0% 33.3%(1) 66.7%(2) 0.0%Facilities and equipment related to your major B.A. Government 0.0% 66.7%(2) 0.0% 0.0% 33.3%(1)B.A. History 0.0% 0.0% 33.3%(1) 66.7%(2) 0.0%B.A. Social Studies Education 0.0% 0.0% 0.0% 100.0%(3) 0.0%Help/encouragement you received from faculty in your department with regard to further educational opportunities B.A. Government 0.0% 0.0% 0.0% 66.7%(2) 33.3%(1)B.A. History 0.0% 0.0% 0.0% 0.0% 100.0%(3)B.A. Social Studies Education 0.0% 0.0% 66.7%(2) 33.3%(1) 0.0%The size of classes in your major B.A. Government 0.0% 0.0% 0.0% 33.3%(1) 66.7%(2)B.A. History 0.0% 0.0% 0.0% 0.0% 100.0%(3)B.A. Social Studies Education 0.0% 0.0% 0.0% 100.0%(3) 0.0%

Page 54
Table 19 continued
Satisfaction with Degree Program Department of History and Political Science
Number of Respondents: B.A. Government-3; B.A. History-3; B.A. Social Studies Education-3
Very Dissatisfied - 1
2
3
4
Very Satisfied - 5
Encouragement you received from faculty in your department with regard to finding employment in your field B.A. Government 0.0% 0.0% 66.7%(2) 0.0% 33.3%(1)B.A. History 0.0% 33.3%(1) 33.3%(1) 33.3%(1) 0.0%B.A. Social Studies Education 0.0% 0.0% 0.0% 100.0%(3) 0.0%Global perspectives presented in courses B.A. Government 0.0% 0.0% 0.0% 66.7%(2) 33.3%(1)B.A. History 0.0% 0.0% 33.3%(1) 0.0% 66.7%(2)B.A. Social Studies Education 0.0% 0.0% 33.3%(1) 66.7%(2) 0.0%Overall relevancy of courses B.A. Government 0.0% 0.0% 0.0% 66.7%(2) 33.3%(1)B.A. History 0.0% 0.0% 0.0% 66.7%(2) 33.3%(1)B.A. Social Studies Education 0.0% 0.0% 0.0% 66.7%(2) 33.3%(1)

Page 55
Table 19 continued
Satisfaction with Degree Program Department of History and Political Science
No Yes 2. Would you recommend Southeastern to someone interested in what you majored in? B.A. Government 0.0% 100.0%(3) B.A. History 0.0% 100.0%(3) B.A. Social Studies Education 0.0% 100.0%(3) 3. If you had it to do over again, would you choose the same major? B.A. Government 66.7%(2) 33.3%(1) B.A. History 33.3%(1) 66.7%(2) B.A. Social Studies Education 0.0% 10.0%(3) 4. Did you participate in an internship, a practicum, a clinical experience, or student
teaching as part of your degree requirements? B.A. Government 100.0%(3) 0.0% B.A. History 100.0%(3) 0.0% B.A. Social Studies Education 0.0% 100.0%(3) 6. Should a hands-on course be required in your program? B.A. Government 66.7%(2) 33.3%(1) B.A. History 0.0% 100.0%(3) B.A. Social Studies Education 0.0% 100.0%(3) When asked what benefits they received from hands-on experience, Social Studies Education graduates had the following to say:
“Student teaching offered me a hands-on experience with students in a school setting. It definitely helped me.”
“To see first hand what the job would be like. Very beneficial!”
“Real life situations.”
Perceptions of Southeastern
B.A. Government None of the Government graduates had participated in the study-abroad/student exchange, but 66.7% of them thought it would be a valuable experience. One (33.3%) of the respondents had participated in the honors program and was Somewhat Satisfied with the experience. None of the respondents participated in a research program.

Page 56
B.A. History One (33.3%) of the History graduates had participated in the study-abroad/student exchange and was Somewhat Satisfied with the experience. All of the respondents thought it would be a valuable experience. One (33.3%) of the respondents had participated in the honors program and was Very Satisfied with the experience. One (33.3%) of the respondents had participated in a research program. B.A. Social Studies Education None of the Social Studies Education graduates had participated in the study-abroad/student exchange, but 66.7% of them thought it would be a valuable experience. Furthermore, none of the of the respondents had participated in the honors program or a research program.
Graduate/Professional Education B.A. Government One (33.3%) of the respondents is currently enrolled in a graduate/professional degree program, one (33.3%) will likely enroll in the future, and one (33.3%) has no plans for further education. Of the two respondents with plans for further education, one (50.0%) plans on obtaining a master’s and one (50.0%) plans on obtaining a professional degree. The respondent currently enrolled in graduate/professional school indicated his/her educational experiences at Southeastern “Effectively” prepared her/him for graduate/professional study. The respondent indicated that Southeastern prepared him/her “Worse than Most” other students for further educational study. The respondent is enrolled in a degree program “Very Closely Related” to her/his bachelor’s degree from Southeastern. B.A. History One (33.3%) of the respondents is currently enrolled in a graduate/professional degree program. One (33.3%) respondent has taken classes but has not enrolled in a program, and one (33.3%) respondent has no plans for further education. Of the two respondents who have plans for further education, one (50.0%) plans on obtaining a doctorate and one (50.0%) plans on obtaining some “Other” degree. Both (100%) of the respondents with graduate experience indicated their educational experiences at Southeastern “Effectively” prepared them for graduate/professional study. Both (100%) respondents indicated that Southeastern prepared them “About the Same” as other students for further educational study. The respondent who is enrolled in a degree indicted it was “Very Closely Related” to his/her bachelor’s degree from Southeastern.

Page 57
B.A. Social Studies Education One (33.3%) respondent plans to enroll in a degree program in the next 12 months and two (66.7%) plan to enroll in the future. Two (66.7%) of the respondents plan on obtaining a master’s degree and one (33.3%) plans on obtaining a doctorate.
Employment B.A. Government Two (66.7%) of the respondents are employed full-time and one (33.3%) is employed part-time and satisfied with part-time employment. One (33.3%) respondent had a full-time job before completing his/her degree, one (33.3%) accepted a position upon graduation, and one (33.3%) respondent took 1-6 months to find full-time employment. The respondent who did not have a job upon graduation indicated “Limited to only one geographic area” and a “tight job market” were minor problems in finding employment, while “Not knowing what I wanted to do” and “Gender discrimination” were major problems. One of the respondents (33.3%) indicated their education was “Very Effective” in preparing them for employment or improving their job performance and two (66.7%) indicated it was “Effective”. Two (66.7%) of the respondents indicated that they are currently in their first full-time job since graduating from Southeastern and one (33.3%) has had two full-time job. In regards to sources for learning about their first full-time job, one (33.3%) indicated a parent or relative, one (33.3%) from a newspaper/trade publication, and one (33.3%) from an employment agency. One (50.0%) of the respondents who are currently employed full-time, works in the state of Louisiana and one (50.0%) works out of state. Both respondents (100%) are employed in business. When asked “If underemployment is defined as a condition in which your job requires lower levels of skill and training than those you acquired in college would you say that you are currently underemployed”, neither of the respondents indicated they are underemployed. Both (100%) of the respondents indicated they are satisfied with their employment but would consider other employment. Both (100%) of the respondents indicted their employment was not in an area related to their major. One (50.0%) because of better pay and one because of better opportunity for advancement. Both (100%) respondents indicated a salary range of $30,001-$40,000. B.A. History One (33.3%) of the respondents is employed full-time, one (33.3%) is on graduate assistantship, fellowship or student employment status, and one (33.3%) is unemployed and not looking for employment. One (33.3%) respondent took over a year to find employment, and two (66.7%)

Page 58
have never looked for full-time employment. The respondent who took a year to find employment indicated that “Limited to only one geographic area”, “Not knowing what I wanted to do”, “Tight job market”, and “Lack of marketable skills” were major problems in finding employment. Minor problems included “Lack of experience” and “Lack of job search skills”. The respondent indicated his/her education was “Very Ineffective” in preparing him/her for employment or improving their job performance. The respondents indicated he/she is currently in his/her second full-time job since graduating from Southeastern. The respondent who is currently employed full-time is employed in the state of Louisiana in government. When asked “If underemployment is defined as a condition in which your job requires lower levels of skill and training than those you acquired in college, would you say that you are currently underemployed”, the respondent indicated he/she is not underemployed. The respondent is “Satisfied, but would consider more desirable employment”. The respondent is employed in an area related to her/his Southeastern major. The respondent indicated a salary range of $15,001-$20,000. B.A. Social Studies Education All three (100.0%) respondents are employed full-time. One (33.3%) respondent had his/her job before graduating from Southeastern, one (33.3%) respondent accepted a position upon graduation, and one (33.3%) respondent obtained employment within six months. The respondent who did not have a job upon graduation indicated “Limited to only one geographic area” was a minor problem in obtaining employment. One of the respondents (33.3%) indicated their education was “Very Effective” in preparing them for employment or improving their job performance and one (33.3%) indicated it was “Effective”. Two (66.7%) of the respondents indicated that they are currently in their first full-time job since graduating from Southeastern. One of the respondents did not complete the remaining employment questions, so this section is based on two respondents. Both of the respondents (100%) currently work in the state of Louisiana, in K-12 education. When asked “If underemployment is defined as a condition in which your job requires lower levels of skill and training than those you acquired in college, would you say that you are currently underemployed”, both (100%) respondents felt they are not underemployed. When asked about the satisfaction with their present employment, both (100%) are “Satisfied, but would consider more desirable employment”. Both of the respondents are currently employed in the area of their Southeastern major. When asked to indicate their salary range, one (50.0%) respondent gave a range of $25,001-$30,000 and one (50.0%) a range of $30,001-$40,000.

Page 59
Professional Activities B.A. Government None (0.0%) of the respondents currently hold licensure/certification in their field. Two (66.7%) of the respondents plan on obtaining licensure/certification in the next 12 months, one a notary and one a MCSE or related. One (33.3%) of the respondents indicated he/she is a member of a professional organization and two (66.7%) respondents have attended a professional meeting in the past year. B. A. History One (33.3%) of the respondents indicated that licensure/certification is not available in her/his field and two (66.7%) indicated they did not currently hold certification in their field and have no plans to obtain it in the next 12 months. None of the respondents are members of a professional organization, nor have they attended a professional meeting in the past year. B.A. Social Studies Education All three (100.0%) of the respondents indicated they hold teaching certification. One (33.3%) respondent is a member of a professional organization and one (33.3%) respondent has attended a professional meeting in the past year.
Special Questions B.A. Social Studies Education All of the respondents completed the insert which contained the special questions. All three indicated they teach in public schools, one in St. Charles parish, one in East Baton Rouge and one in Livingston. Respondents were first asked what activities they thought would be helpful as they began their career. Table 20 provides the activities and the percent of respondents who thought they would be useful.

Page 60
Table 20 University Assistance for Beginning Teachers
Activity % Useful
Workshops on various topics 100.0% Assistance with the use of technology in the classroom 33.3% Observations upon request 33.3% Assistance from content specialist 0.0% Seminars on a regular basis at Southeastern 0.0% On-line Assistance 33.3%
Next, students were asked how much assistance they would like to have in various areas during their first two years of teaching. Table 21 provides the percentage of desired help for each area.

Page 61
Table 21 Amount of Assistance Desired During First Two Years of Teaching
1 - No
Help 2 3 4 5 - Lots of Help
Communicating with the principal 33.3% 33.3% 33.3% 0.0% 0.0% Communicating with parents 33.3% 33.3% 0.0% 0.0% 33.3% Planning specific learner outcomes in clear, concise objectives 100.0% 0.0% 0.0% 0.0% 0.0%
Creating activities that develop objectives 100.0% 0.0% 0.0% 0.0% 0.0% Identifying and planning for individual differences 33.3% 33.3% 0.0% 33.3% 0.0%
Identifying and using appropriate materials needed for lessons 100.0% 0.0% 0.0% 0.0% 0.0%
Assessing student progress 66.7% 0.0% 33.3% 0.0% 0.0% Organizing available space, materials and/or equipment to facilitate learning 33.3% 33.3% 33.3% 0.0% 0.0%
Managing routines and transitions in a timely manner 33.3% 66.7% 0.0% 0.0% 0.0%
Establishing expectations for learner behavior 33.3% 66.7% 0.0% 0.0% 0.0% Seeking community involvement in instructional programs 66.7% 0.0% 0.0% 0.0% 33.3%
Communicating with students 66.7% 0.0% 33.3% 0.0% 0.0% Integrating technology into instruction 33.3% 33.3% 0.0% 33.3% 0.0% Using monitoring techniques to facilitate learning 100.0% 0.0% 0.0% 0.0% 0.0%
Sequencing lessons to promote learning 100.0% 0.0% 0.0% 0.0% 0.0% Maintaining an environment conducive to learning 66.7% 33.3% 0.0% 0.0% 0.0%
Acquiring additional knowledge of content 33.3% 33.3% 33.3% 0.0% 0.0% Remaining knowledgeable of current scholarship 66.7% 0.0% 33.3% 0.0% 0.0%
When asked what other areas they would have liked assistance, respondents answered: ! More knowledge of special needs (504’s, IEP’s, etc.)
Page 62
Finally, respondents were asked what was they thought the most important thing Southeastern could do to provide assistance in their teaching. Respondents gave the following replies: ! Maybe some on-line assistance.

Page 63
Department of Psychology
Table 28 Satisfaction with Degree Program
Number of Respondents: B.A. Psychology-7
Very Dissatisfied - 1
2
3
4
Very Satisfied - 5
Overall quality of your department B.A. Psychology 0.0% 0.0% 71.4%(5) 28.6%(2) 0.0%Overall quality of your degree program B.A. Psychology 0.0% 0.0% 57.1%(4) 42.9%(3) 0.0%Clarity of the degree requirements as outlined in the catalogue and/or curriculum sheets B.A. Psychology 0.0% 0.0% 0.0% 28.6%(2) 71.4%(5)Usefulness of the academic advice you received from your advisor B.A. Psychology 28.6%(2) 14.3%(1) 42.9%(3) 0.0% 14.3%(1)Opportunities to interact with faculty outside of class B.A. Psychology 14.3%(1) 0.0% 42.9%(3) 28.6%(2) 14.3%(1)Effectiveness of the faculty as teachers B.A. Psychology 0.0% 0.0% 42.9%(3) 57.1%(4) 0.0%Friendliness and helpfulness of the office staff B.A. Psychology 0.0% 0.0% 42.9%(3) 57.1%(4) 0.0%Interest shown by faculty in your academic development B.A. Psychology 14.3%(1) 42.9%(3) 28.6%(2) 14.3%(1) 0.0%Effectiveness of beginning courses in preparing you for advanced courses B.A. Psychology 0.0% 14.3%(1) 14.3%(1) 28.6%(2) 42.9%(3)Quality of instruction in advanced courses B.A. Psychology 0.0% 14.3%(1) 0.0% 57.1%(4) 28.6%(2)Professional activities, associations, or clubs B.A. Psychology 0.0% 14.3%(1) 71.4%(5) 14.3%(1) 0.0% Practicum, internship, clinical, or other hands-on experiences outside of the classroom B.A. Psychology 28.6%(2) 14.3%(1) 42.9%(3) 14.3%(1) 0.0%Opportunity for meaningful interaction with faculty in research or other scholarly activityB.A. Psychology 14.3%(1) 28.6%(2) 57.1%(4) 0.0% 0.0%Availability of the required courses B.A. Psychology 0.0% 14.3%(1) 14.3%(1) 57.1%(4) 14.3%(1)

Page 64
Table 28 continued
Satisfaction with Degree Program Department of Psychology
Number of Respondents: B.A. Psychology-7
Very Dissatisfied - 1
2
3
4
Very Satisfied - 5
Availability of elective courses you wanted to take in your major B.A. Psychology 0.0% 0.0% 0.0% 71.4%(5) 14.3%(1)Quality of instruction regarding standards and ethics in your major field B.A. Psychology 0.0% 0.0% 57.1%(4) 28.6%(2) 14.3%(1)Friendliness and helpfulness of faculty B.A. Psychology 0.0% 14.3%(1) 85.7%(6) 0.0% 0.0%Opportunities for you to collaborate with other students on class projects B.A. Psychology 0.0% 0.0% 42.9%(3) 28.6%(2) 28.6%(2)Computer resources (PC and/or mainframe) for courses in your major B.A. Psychology 0.0% 14.3%(1) 42.9%(3) 28.6%(2) 14.3%(1)Library resources related to your major B.A. Psychology 0.0% 0.0% 57.1%(4) 28.6%(2) 14.3%(1)Use of appropriate technology in the classroom B.A. Psychology 0.0% 0.0% 57.1%(4) 42.9%(3) 0.0%Facilities and equipment related to your major B.A. Psychology 0.0% 28.6%(2) 71.4%(5) 0.0% 0.0%Help/encouragement you received from faculty in your department with regard to further educational opportunities B.A. Psychology 14.3%(1) 42.9%(3) 28.6%(2) 14.3%(1) 0.0%The size of classes in your major B.A. Psychology 0.0% 0.0% 0.0% 71.4%(5) 28.6%(2)Encouragement you received from faculty in your department with regard to finding employment in your field B.A. Psychology 14.3%(1) 85.7%(6) 0.0% 0.0% 0.0%Global perspectives presented in courses B.A. Psychology 14.3%(1) 14.3%(1) 57.1%(4) 14.3%(1) 0.0%Overall relevancy of courses B.A. Psychology 0.0% 0.0% 57.1%(4) 28.6%(2) 14.3%(1)

Page 65
Table 28 continued
Satisfaction with Degree Program Department of Psychology
No Yes 2. Would you recommend Southeastern to someone interested in what you majored in? B.A. Psychology 71.4%(5) 28.6%(2) 3. If you had it to do over again, would you choose the same major?
B.A. Psychology 71.4%(5) 14.3%(1); 14.3%(1) Not at Southeastern
4. Did you participate in an internship, a practicum, a clinical experience, or student teaching as part of your degree requirements?
B.A. Psychology 71.4%(5) 28.6%(2) 6. Should a hands-on course be required in your program? B.A. Psychology 0.0% 100.0%(7) When asked what benefits they received from hands-on experience, Psychology graduates had the following to say:
“How to read, interpret and understand research results”
Perceptions of Southeastern B.A. Psychology None of the Psychology graduates had participated in the study-abroad/student exchange, but all of them thought it would be a valuable experience. Two (28.6%) of the respondents had participated in the honors program. One (50.0%) was Very Satisfied with the experience and one (50.0%) was Somewhat Satisfied. Six (85.7%) of the respondents participated in a research program. Five (83.3%) of the participants were Somewhat Satisfied with the experience and one was Somewhat Dissatisfied.
Graduate/Professional Education Two (28.6%) of the respondents are currently enrolled in a graduate/professional degree program one (14.3%) has completed a master’s degree, and two (28.6%) have take courses but not enrolled in a degree program. One (14.3%) of the respondents plans to enroll in a degree program in the next 12 months, and one (14.3%) has no plans for further education. Of those respondents with plans for further education, two (33.3%) plan on eventually obtaining a doctorate, two (33.3%) plan on obtaining a master’s, and two (33.3%) plan on obtaining a professional degree.
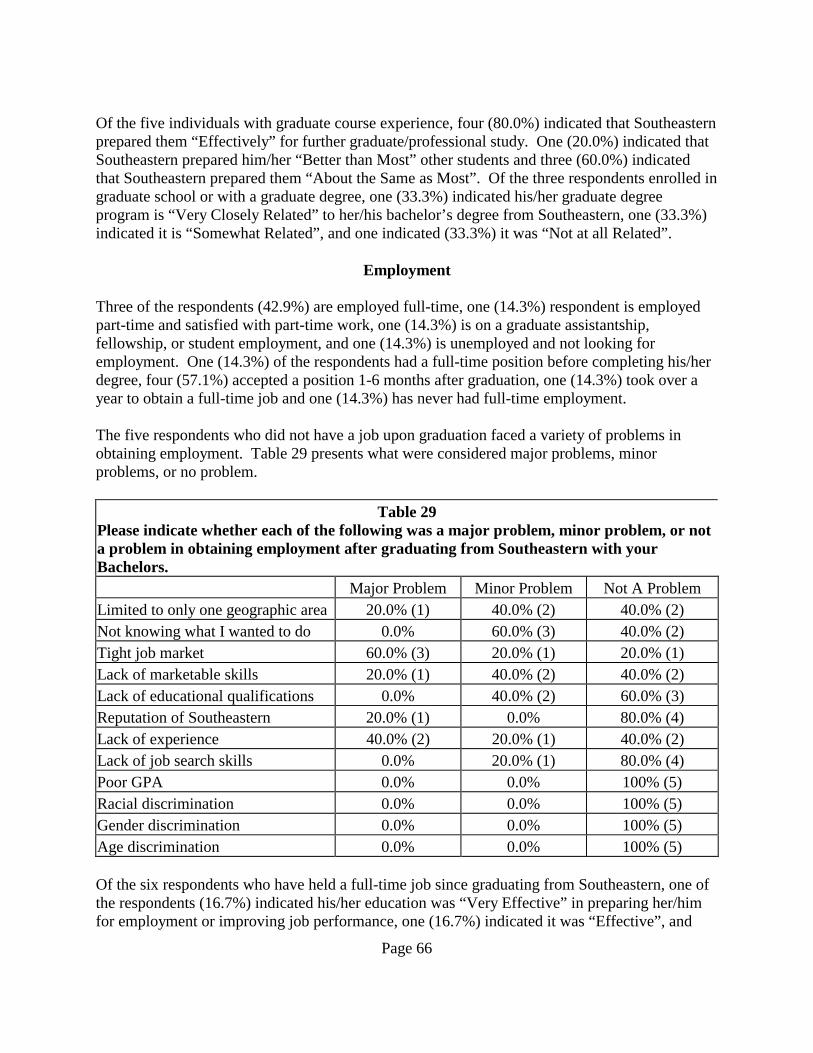
Page 66
Of the five individuals with graduate course experience, four (80.0%) indicated that Southeastern prepared them “Effectively” for further graduate/professional study. One (20.0%) indicated that Southeastern prepared him/her “Better than Most” other students and three (60.0%) indicated that Southeastern prepared them “About the Same as Most”. Of the three respondents enrolled in graduate school or with a graduate degree, one (33.3%) indicated his/her graduate degree program is “Very Closely Related” to her/his bachelor’s degree from Southeastern, one (33.3%) indicated it is “Somewhat Related”, and one indicated (33.3%) it was “Not at all Related”.
Employment Three of the respondents (42.9%) are employed full-time, one (14.3%) respondent is employed part-time and satisfied with part-time work, one (14.3%) is on a graduate assistantship, fellowship, or student employment, and one (14.3%) is unemployed and not looking for employment. One (14.3%) of the respondents had a full-time position before completing his/her degree, four (57.1%) accepted a position 1-6 months after graduation, one (14.3%) took over a year to obtain a full-time job and one (14.3%) has never had full-time employment. The five respondents who did not have a job upon graduation faced a variety of problems in obtaining employment. Table 29 presents what were considered major problems, minor problems, or no problem.
Table 29 Please indicate whether each of the following was a major problem, minor problem, or not a problem in obtaining employment after graduating from Southeastern with your Bachelors. Major Problem Minor Problem Not A Problem Limited to only one geographic area 20.0% (1) 40.0% (2) 40.0% (2) Not knowing what I wanted to do 0.0% 60.0% (3) 40.0% (2) Tight job market 60.0% (3) 20.0% (1) 20.0% (1) Lack of marketable skills 20.0% (1) 40.0% (2) 40.0% (2) Lack of educational qualifications 0.0% 40.0% (2) 60.0% (3) Reputation of Southeastern 20.0% (1) 0.0% 80.0% (4) Lack of experience 40.0% (2) 20.0% (1) 40.0% (2) Lack of job search skills 0.0% 20.0% (1) 80.0% (4) Poor GPA 0.0% 0.0% 100% (5) Racial discrimination 0.0% 0.0% 100% (5) Gender discrimination 0.0% 0.0% 100% (5) Age discrimination 0.0% 0.0% 100% (5) Of the six respondents who have held a full-time job since graduating from Southeastern, one of the respondents (16.7%) indicated his/her education was “Very Effective” in preparing her/him for employment or improving job performance, one (16.7%) indicated it was “Effective”, and

Page 67
two (33.3%) indicated it was “Ineffective”. One (16.7%) of the respondents indicated that she/he is currently in her/his first full-time job since graduating from Southeastern, two (33.3%) are in their second full-time job, and one (16.7%) has had three or more full-time jobs. In regards to sources for learning about their first full-time job, one (16.7%) indicated faculty at Southeastern, one (16.7%) from a parent or relative, one (16.7%) from a newspaper/trade publication, one (16.7%) from another student or friend, one (16.7%) from an employment agency, one (16.7%) from the Internet, and one (16.7%) already had the job. Of the three respondents who are currently employed full-time, two (66.7%) are employed in the state of Louisiana. Two (66.7%) are employed in a service organization and one (33.3%) in higher education. When asked “If underemployment is defined as a condition in which your job requires lower levels of skill and training than those you acquired in college, would you say that you are currently underemployed”, two (66.7%) respondents felt they are underemployed. When asked about satisfaction with their present employment, one (33.3%) is “Well satisfied; would not consider leaving”, one (33.3%) is “Satisfied, but would consider more desirable employment”, and one (33.3%) “Dislike[s] employment; seeking or will seek other employment”. One (33.3%) respondent is employed in the area of his/her Southeastern major, and two respondents (66.7%) are employed in an area not related to their Southeastern major. One respondent is employed in an area not related to their major because they could not find a job they wanted and one because of better pay. One (33.3%) respondent gave a salary range of $10,000-$15,000, one (33.3%) gave a range of $20,001-$25,000, and one (33.3%) gave a salary range of $30,001-$40,000.
Professional Activities One (14.3%) of the respondents indicated that licensure/certification is not available in his/her field, one (14.3%) is a Licensed Master social worker (LMSW), and five (71.4%) indicated they do not currently have licensure/certification. Of those who do not have licensure/certification, two (40.0%) plan on obtaining it in the next twelve months. One intends to become a Licensed Physical therapist and the other did not indicate the type of licensure/certification. Three (42.9%) of the respondents are members of a professional organization, and three (42.9%) have attended a professional meeting in the past year.

Page 68
Department of Sociology& Criminal Justice
Table 30 Satisfaction with Degree Program
Number of Respondents: B.A. Criminal Justice - 9; B.A. Sociology - 4
Very Dissatisfied - 1
2
3
4
Very Satisfied - 5
Overall quality of your department B.A. Criminal Justice 11.1%(1) 0.0% 0.0% 66.7%(6) 22.2%(2)B.A. Sociology 0.0% 0.0% 50.0%(2) 50.0%(2) 0.0%Overall quality of your degree program B.A. Criminal Justice 11.1%(1) 0.0% 22.2%(2) 55.6%(5) 11.1%(1)B.A. Sociology 0.0% 0.0% 50.0%(2) 50.0%(2) 0.0%Clarity of the degree requirements as outlined in the catalogue and/or curriculum sheets B.A. Criminal Justice 11.1%(1) 0.0% 0.0% 44.4%(4) 44.4%(4)B.A. Sociology 0.0% 0.0% 0.0% 50.0% (2) 50.0%(2)Usefulness of the academic advice you received from your advisor B.A. Criminal Justice 0.0% 11.1%(1) 33.3%(3) 33.3%(3) 22.2%(2)B.A. Sociology 0.0% 25.0%(1) 25.0%(1) 25.0%(1) 25.0%(1)Opportunities to interact with faculty outside of class B.A. Criminal Justice 11.1%(1) 0.0% 22.2%(2) 55.6%(5) 11.1%(1)B.A. Sociology 25.0%(1) 0.0% 25.0%(1) 0.0% 50.0%(2)Effectiveness of the faculty as teachers B.A. Criminal Justice 11.1%(1) 0.0% 0.0% 77.8%(7) 11.1%(1)B.A. Sociology 0.0% 0.0% 75.0%(3) 25.0%(1) 0.0%Friendliness and helpfulness of the office staff B.A. Criminal Justice 11.1%(1) 0.0% 22.2%(2) 22.2%(2) 44.4%(4)B.A. Sociology 25.0%(1) 0.0% 25.0%(1) 25.0%(1) 25.0%(1)Interest shown by faculty in your academic development B.A. Criminal Justice 11.1%(1) 0.0% 22.2%(2) 44.4%(4) 22.2%(2)B.A. Sociology 0.0% 0.0% 50.0%(2) 25.0%(1) 25.0%(1)Effectiveness of beginning courses in preparing you for advanced courses B.A. Criminal Justice 11.1%(1) 0.0% 11.1%(1) 55.6%(5) 22.2%(2)B.A. Sociology 0.0% 0.0% 25.0%(1) 50.0%(2) 0.0%

Page 69
Table 30 continued
Satisfaction with Degree Program Department of Sociology & Criminal Justice
Number of Respondents: B.A. Criminal Justice - 9; B.A. Sociology - 4
Very Dissatisfied - 1
2
3
4
Very Satisfied - 5
Quality of instruction in advanced courses B.A. Criminal Justice 11.1%(1) 0.0% 11.1%(1) 44.4%(4) 33.3%(3)B.A. Sociology 0.0% 0.0% 0.0% 50.0%(2) 50.0%(2)Professional activities, associations, or clubs B.A. Criminal Justice 11.1%(1) 11.1%(1) 66.7%(6) 0.0% 11.1%(1)B.A. Sociology 25.0%(1) 25.0%(1) 50.0%(2) 0.0% 0.0% Practicum, internship, clinical, or other hands-on experiences outside of the classroom B.A. Criminal Justice 11.1%(1) 44.4%(4) 11.1%(1) 22.2%(2) 11.1%(1)B.A. Sociology 25.0%(1) 25.0%(1) 50.0%(2) 0.0% 0.0%Opportunity for meaningful interaction with faculty in research or other scholarly activityB.A. Criminal Justice 0.0% 33.3%(3) 44.4%(4) 22.2%(2) 0.0%B.A. Sociology 25.0%(1) 25.0%(1) 25.0%(1) 25.0%(1) 0.0%Availability of the required courses B.A. Criminal Justice 22.2%(2) 11.1%(1) 0.0% 55.6%(5) 11.1%(1)B.A. Sociology 0.0% 50.0%(2) 25.0%(1) 25.0%(1) 0.0%Availability of elective courses you wanted to take in your major B.A. Criminal Justice 22.2%(2) 11.1%(1) 11.1%(1) 33.3%(3) 22.2%(2)B.A. Sociology 0.0% 0.0% 25.0%(1) 25.0%(1) 50.0%(2)Quality of instruction regarding standards and ethics in your major field B.A. Criminal Justice 11.1%(1) 11.1%(1) 11.1%(1) 55.6%(5) 11.1%(1)B.A. Sociology 0.0% 0.0% 50.0%(2) 25.0%(1) 25.0%(1)Friendliness and helpfulness of faculty B.A. Criminal Justice 11.1%(1) 0.0% 11.1%(1) 55.6%(5) 22.2%(2)B.A. Sociology 0.0% 25.0%(1) 25.0%(1) 25.0%(1) 25.0%(1)Opportunities for you to collaborate with other students on class projects B.A. Criminal Justice 11.1%(1) 0.0% 44.4%(4) 22.2%(2) 22.2%(2)B.A. Sociology 25.0%(1) 0.0% 25.0%(1) 50.0%(2) 0.0%Computer resources (PC and/or mainframe) for courses in your major B.A. Criminal Justice 11.1%(1) 33.3%(3) 11.1%(1) 33.3%(3) 11.1%(1)B.A. Sociology 25.0%(1) 25.0%(1) 0.0% 25.0%(1) 25.0%(1)

Page 70
Table 30 continued
Satisfaction with Degree Program Department of Sociology & Criminal Justice
Number of Respondents: B.A. Criminal Justice - 9; B.A. Sociology - 4
Very Dissatisfied - 1
2
3
4
Very Satisfied - 5
Library resources related to your major B.A. Criminal Justice 11.1%(1) 33.3%(3) 22.2%(2) 22.2%(2) 11.1%(1)B.A. Sociology 0.0% 25.0%(1) 0.0% 25.0%(1) 50.0%(2)Use of appropriate technology in the classroom B.A. Criminal Justice 11.1%(1) 33.3%(3) 11.1%(1) 44.4%(4) 0.0%B.A. Sociology 0.0% 25.0%(1) 25.0%(1) 50.0%(2) 0.0%Facilities and equipment related to your major B.A. Criminal Justice 11.1%(1) 22.2%(2) 33.3%(3) 33.3%(3) 0.0%B.A. Sociology 0.0% 0.0% 50.0%(2) 50.0%(2) 0.0%Help/encouragement you received from faculty in your department with regard to further educational opportunities B.A. Criminal Justice 11.1%(1) 11.1%(1) 33.3%(3) 33.3%(3) 11.1%(1)B.A. Sociology 25.0%(1) 50.0%(2) 0.0% 0.0% 25.0%(1)The size of classes in your major B.A. Criminal Justice 22.2%(2) 0.0% 22.2%(2) 22.2%(2) 33.3%(3)B.A. Sociology 0.0% 0.0% 50.0%(2) 25.0%(1) 25.0%(1)Encouragement you received from faculty in your department with regard to finding employment in your field B.A. Criminal Justice 11.1%(1) 22.2%(2) 55.6%(5) 0.0% 11.1%(1)B.A. Sociology 75.0%(3) 0.0% 0.0% 25.0%(1) 0.0%Global perspectives presented in courses B.A. Criminal Justice 11.1%(1) 11.1%(1) 33.3%(3) 33.3%(3) 11.1%(1)B.A. Sociology 0.0% 0.0% 25.0%(1) 25.0%(1) 50.0%(2)Overall relevancy of courses B.A. Criminal Justice 11.1%(1) 0.0% 22.2%(2) 55.6%(5) 11.1%(1)B.A. Sociology 0.0% 0.0% 25.0%(1) 50.0%(2) 25.0%(1)

Page 71
Table 30 continued
Satisfaction with Degree Program Department of Sociology & Criminal Justice
No Yes 2. Would you recommend Southeastern to someone interested in what you majored in? B.A. Criminal Justice 11.1%(1) 88.9%(8) B.A. Sociology 0.0% 75.0%(3);25.0%(1) Missing 3. If you had it to do over again, would you choose the same major? B.A. Criminal Justice 33.3%(3) 66.7%(6) B.A. Sociology 50.0%(2) 50.0%(2) 4. Did you participate in an internship, a practicum, a clinical experience, or student
teaching as part of your degree requirements? B.A. Criminal Justice 77.8%(7) 22.2%(2) B.A. Sociology 75.0%(3) 0.0%; 25.0%(1) Missing 6. Should a hands-on course be required in your program? B.A. Criminal Justice 22.2%(2) 77.8%(7) B.A. Sociology 75.0%(3) 25.0%(1) When asked what benefits they received from hands-on experience, Criminal Justice graduates had the following to say:
“First hand observation of work by that specific agency - meeting and interacting with those professionals. Contacts established for future.”
“‘Real world’ applications”
Perceptions of Southeastern
B.A. Criminal Justice One of the Criminal Justice graduates had participated in the study-abroad/student exchange and the participant was Very Dissatisfied with the experience. The majority (77.8%) thought it would be a valuable experience. None of the respondents had participated in the honors program. One (11.1%) of the respondents participated in a research program, and was Somewhat Satisfied with the experience. B.A. Sociology None of the Sociology graduates had participated in the study-abroad/student exchange, but they all thought it would be a valuable experience. None of the respondents had participated in the

Page 72
honors program. One (25.0%) of the respondents participated in a research program, and was Somewhat Satisfied with the experience.
Graduate/Professional Education B.A. Criminal Justice Two (22.2%) of the respondents are currently enrolled in a graduate/professional degree program. One (11.1%) of the respondents plans to enroll in a degree program in the next 12 months, and three (33.3%) respondents are likely to enroll in a degree program in the future. Two (22.2%) respondents have no plans for further education. Of those respondents who have plans for further education, five (83.3%) plan on obtaining a master’s and one (16.7%) plans on obtaining a doctorate. Of the two individuals with graduate school experience, one (50.0%) indicated Southeastern prepared him/her “Effectively” for further graduate/professional study and one (50.0%) indicated she/he was prepared “Very Ineffectively”. One (50.0%) indicated that Southeastern prepared him/her “About the Same as Most” other students, and one (50.0%) indicated that Southeastern prepared her/him “Worse than Most”. The two respondents who are enrolled in a degree program indicated it was “Not at all Related” to their bachelor’s degree from Southeastern. B.A. Sociology Two (50.0%) of the respondents plan on enrolling in a degree program in the future and two (50.0%) have no plans for further graduate/professional study. Of the two respondents with plans for graduate/professional education, one (50.0%) plans on obtaining a master’s degree and one (50.0%) plans on obtaining a doctorate.
Employment B.A. Criminal Justice One of the respondents did not respond to the employment section, therefore this section is based on eight respondents. Almost ninety percent (87.5%, n=7) of the respondents are employed full-time, one respondent (12.5%) is employed part-time and looking for full-time employment. One (12.5%) of the respondents accepted a position upon graduation, one (12.5%) respondent obtained a job 1-6 months after graduation, one (12.5%) found a job 7-12 months after graduation, three (37.5%) took over a year to find a job, and one (12.5%) has never been employed full-time since graduating from Southeastern, but has looked. The six respondents who did not have a job upon graduation faced a variety of problems in obtaining employment. Table 31 presents what were considered major problems, minor problems, or no problem.

Page 73
Table 31
Please indicate whether each of the following was a major problem, minor problem, or not a problem in obtaining employment after graduating from Southeastern with your Bachelors. Major Problem Minor Problem Not A Problem Limited to only one geographic area 0.0% 33.3% (2) 66.7% (4) Not knowing what I wanted to do 83.3% (5) 16.7% (1) 0.0% Tight job market 16.7% (1) 66.7% (4) 16.7% (1) Lack of marketable skills 33.3% (2) 33.3% (2) 33.3% (2) Lack of educational qualifications 0.0% 16.7% (1) 83.3% (5) Reputation of Southeastern 16.7% (1) 16.7% (1) 66.7% (4) Lack of experience 66.7% (4) 33.3% (2) 0.0% Lack of job search skills 33.3% (2) 33.3% (2) 33.3% (2) Poor GPA 0.0% 33.3% (2) 66.7% (4) Racial discrimination 0.0% 16.7% (1) 83.3% (5) Gender discrimination 0.0% 0.0% 100% (6) Age discrimination 0.0% 16.7% (1) 83.3% (5) Of the six respondents who have held a full-time job since graduating from Southeastern, one of the respondents (16.7%) indicated his/her education was “Very Effective” in preparing her/him for employment or improving job performance and five (83.3%) indicated it was “Effective”. Four (66.7%) of the respondents indicated that they are currently in their first full-time job since graduating from Southeastern and two (33.3%) are in their second full-time. In regards to sources for learning about their first full-time job, one (16.7%) indicated a professional meeting, one (16.7%) from another student or friend, one (16.7%) was recruited by the employer, and one (16.7%) already had the job. One of the respondents who is employed full-time did not complete this section, so it is based on six respondents. Four (66.7%) of the six respondents are employed in the state of Louisiana, and two (33.3%) are employed out-of-state. One (16.7%) of the respondents is employed in a service organization, two (33.3%) in government, one (16.7%) in a professional firm, and two (33.3%) are self-employed. When asked “If underemployment is defined as a condition in which your job requires lower levels of skill and training than those you acquired in college, would you say that you are currently underemployed”, three (50.0%) respondents felt they are not underemployed, while three (50.0%) felt they are underemployed. When asked about satisfaction with their present employment, two (33.3%) of the respondents are “Well satisfied; would not consider leaving”; and four (66.7%) of the respondents are “Satisfied, but would consider more desirable employment”. Three (50.0%) of the respondents are currently employed in an area related to their Southeastern major and three (50.0%) are employed in an area not related to their Southeastern major. One of

Page 74
the respondents not employed in an area related to his/her major found “Better pay” in another area and two because of “Better opportunity for advancement”. One (16.7%) of the respondents gave a salary range of $15,001-$20,000, two (33.3%) gave a range of $20,001-$25,000, two (33.3%) gave a salary range of $40,001-$50,000, and one (16.7%) indicated a salary of more than $50,000. B.A. Sociology Three (75.%) of the respondents are employed full-time and one (25.0%) is not employed and not looking for employment. One (25.0%) of the respondents had a full-time job before completing his/her degree, one (25.0%) accepted a position upon graduation, and two (50.%) found a job 7-12 months after graduation. The two respondents who did not have a full-time job upon graduation indicated that “Limited to only one geographic area”, “Tight job market”, “Lack of educational qualifications”and “Lack of experience” were major problems in obtaining a position. Minor problems included “Tight job market”, “Lack of marketable skills”, “Lack of experience”, and “Gender discrimination”. Of the four respondents who have held a full-time job since graduating from Southeastern, one of the respondents (25.0%) indicated his/her education was “Very Effective” in preparing her/him for employment or improving job performance , two (83.3%) indicated it was “Effective”, and one (25.0%) indicated it was “Very Ineffective”. One (25.0%) of the respondents indicated that he/she is currently in his/her first full-time job since graduating from Southeastern and two (50.0%) have had three or more positions. In regards to sources for learning about their first full-time job, one (25.0%) indicated a parent or relative, one (25.0%) from a newspaper/trade publication, and one (25.0%) from another student or friend. All (100%) of the respondents who are currently employed full-time are employed in the state of Louisiana. One (33.3%) of the respondents is employed in a service organization, one (33.3%) in a professional firm, and one (25.0%) is self-employed. When asked “If underemployment is defined as a condition in which your job requires lower levels of skill and training than those you acquired in college, would you say that you are currently underemployed”, one (333.3%) respondent felt he/she is not underemployed, while one (33.3%) felt she/he is underemployed. When asked about satisfaction with their present employment, one (33.3%) of the respondents are “Well satisfied; would not consider leaving”; two (66.7%) of the respondents are “Satisfied, but would consider more desirable employment”. One (33.3%) of the respondents is currently employed in an area related to his/her Southeastern major and two (66.7%) are employed in an area not related to their Southeastern major. One of the respondents not employed in an area related to their major found “Better pay” in another area and one “Never planned to work in [the] field”. One (33.3%) of the respondents gave a salary range of less than $10,000, one (33.3%) gave a salary range of $25,001-$30,000, and one (33.3%) gave a salary of more than $50,000.

Page 75
Professional Activities B.A. Criminal Justice Two (22.2%) of the respondents indicated that licensure/certification is not available in their field, and two (22.2%) indicated that they do not have licensure/certification. Five (55.6%) of the respondents have licensure/certification in the following areas: paralegal, police dog trainer, Peace officers and standards training (post) certified, and LA Sales license. Of those who do not have licensure/certification, one (50.0%) plans on obtaining it in the next twelve months, but did not indicate the type. Four (44.4%) of the respondents are members of a professional organization, and four (44.4%) have attended a professional meeting in the past year. B.A. Sociology Two of the respondents (50.0%) indicated that licensure/certification is not available in their field and two (50.%) indicated they do not currently hold licensure/certification and do not plan on obtaining it in the next 12 months. None of the respondents are members of a professional organization, and one (25.0%) has attended a professional meeting in the past year.

Page 76
Department of Visual Arts
Table 32 Satisfaction with Degree Program
Number of Respondents: B.A. Cultural Resource Management-3
Very Dissatisfied - 1
2
3
4
Very Satisfied - 5
Overall quality of your department B.A. Cultural Resource Management 0.0% 0.0% 66.7%(2) 0.0% 33.5%(1)
Overall quality of your degree program B.A. Cultural Resource Management 0.0% 33.3%(1) 33.3%(1) 0.0% 33.3%(1)
Clarity of the degree requirements as outlined in the catalogue and/or curriculum sheets B.A. Cultural Resource Management 33.3%(1) 0.0% 0.0% 33.3%(1) 33.3%(1)
Usefulness of the academic advice you received from your advisor B.A. Cultural Resource Management 0.0% 33.3%(1) 0.0% 0.0% 66.7%(2)
Opportunities to interact with faculty outside of class B.A. Cultural Resource Management 0.0% 33.3%(1) 0.0% 33.3%(1) 33.3%(1)
Effectiveness of the faculty as teachers B.A. Cultural Resource Management 0.0% 0.0% 33.3%(1) 33.3%(1) 33.3%(1)
Friendliness and helpfulness of the office staff B.A. Cultural Resource Management 0.0% 0.0% 0.0% 0.0% 100.0%(3)
Interest shown by faculty in your academic development B.A. Cultural Resource Management 0.0% 0.0% 0.0% 66.7%(2) 33.3%(1)
Effectiveness of beginning courses in preparing you for advanced courses B.A. Cultural Resource Management 0.0% 33.3%(1) 0.0% 33.3%(1) 33.3%(1)
Quality of instruction in advanced courses B.A. Cultural Resource Management 33.3%(1)0.0% 0.0% 0.0% 0.0% 66.7%(2)

Page 77
Table 32 continued
Satisfaction with Degree Program Department of Visual Arts
Number of Respondents: B.A. Cultural Resource Management-3
Very Dissatisfied - 1
2
3
4
Very Satisfied - 5
Professional activities, associations, or clubs B.A. Cultural Resource Management 0.0% 33.3%(1) 33.3%(1) 33.3%(1) 0.0%
Practicum, internship, clinical, or other hands-on experiences outside of the classroom B.A. Cultural Resource Management 0.0% 0.0% 33.3%(1) 33.3%(1) 33.3%(1)
Opportunity for meaningful interaction with faculty in research or other scholarly activityB.A. Cultural Resource Management 0.0% 33.3%(1) 0.0% 66.7%(2) 0.0%
Availability of the required courses B.A. Cultural Resource Management 33.3%(1) 0.0% 0.0% 33.3%(1) 33.3%(1)
Availability of elective courses you wanted to take in your major B.A. Cultural Resource Management 0.0% 0.0% 33.3%(1) 66.7%(2) 0.0%
Quality of instruction regarding standards and ethics in your major field B.A. Cultural Resource Management 0.0% 0.0% 0.0% 66.7%(2) 33.3%(1)
Friendliness and helpfulness of faculty B.A. Cultural Resource Management 0.0% 0.0% 0.0% 33.3%(1) 66.7%(2)
Opportunities for you to collaborate with other students on class projects B.A. Cultural Resource Management 0.0% 0.0% 0.0% 66.7%(2) 33.3%(1)
Computer resources (PC and/or mainframe) for courses in your major B.A. Cultural Resource Management 0.0% 33.3%(1) 0.0% 33.3%(1) 33.3%(1)
Library resources related to your major B.A. Cultural Resource Management 0.0% 0.0% 66.7%(2) 33.3%(1) 0.0%
Use of appropriate technology in the classroom B.A. Cultural Resource Management 0.0% 33.3%(1) 0.0% 66.7%(2) 0.0%

Page 78
Table 32 continued Satisfaction with Degree Program
Department of Visual Arts Number of Respondents: B.A. Cultural Resource Management-3
Very Dissatisfied - 1
2
3
4
Very Satisfied - 5
Facilities and equipment related to your major B.A. Cultural Resource Management 33.3%(1) 0.0% 0.0% 33.3%(1) 33.3%(1)
Help/encouragement you received from faculty in your department with regard to further educational opportunities B.A. Cultural Resource Management 0.0% 33.3%(1) 0.0% 33.3%(1) 33.3%(1)
The size of classes in your major B.A. Cultural Resource Management 0.0% 0.0% 0.0% 0.0% 100.0% (3)
Encouragement you received from faculty in your department with regard to finding employment in your field B.A. Cultural Resource Management 0.0% 66.7%(2) 0.0% 0.0% 33.3%(1)
Global perspectives presented in courses B.A. Cultural Resource Management 33.3%(1) 33.3%(1) 0.0% 0.0% 33.3%(1)
Overall relevancy of courses B.A. Cultural Resource Management 0.0% 66.7%(2) 0.0% 0.0% 33.3%(1)
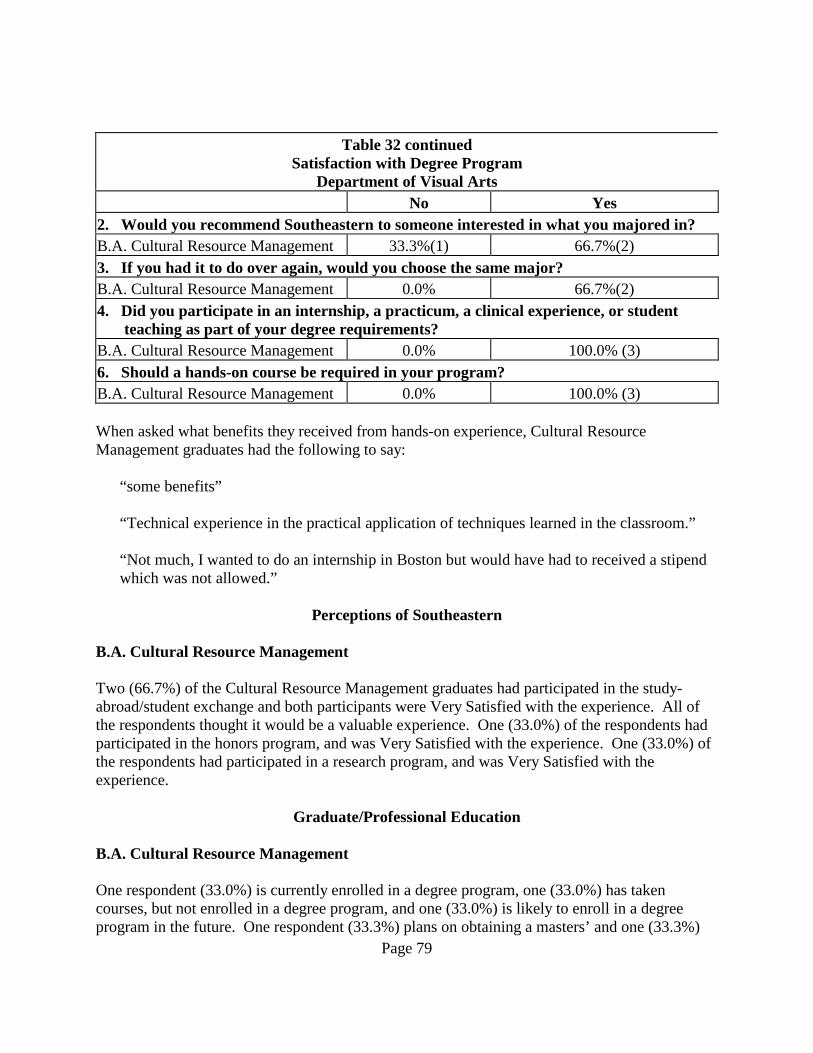
Page 79
Table 32 continued
Satisfaction with Degree Program Department of Visual Arts
No Yes 2. Would you recommend Southeastern to someone interested in what you majored in? B.A. Cultural Resource Management 33.3%(1) 66.7%(2) 3. If you had it to do over again, would you choose the same major? B.A. Cultural Resource Management 0.0% 66.7%(2) 4. Did you participate in an internship, a practicum, a clinical experience, or student
teaching as part of your degree requirements? B.A. Cultural Resource Management 0.0% 100.0% (3) 6. Should a hands-on course be required in your program? B.A. Cultural Resource Management 0.0% 100.0% (3) When asked what benefits they received from hands-on experience, Cultural Resource Management graduates had the following to say:
“some benefits”
“Technical experience in the practical application of techniques learned in the classroom.”
“Not much, I wanted to do an internship in Boston but would have had to received a stipend which was not allowed.”
Perceptions of Southeastern
B.A. Cultural Resource Management Two (66.7%) of the Cultural Resource Management graduates had participated in the study-abroad/student exchange and both participants were Very Satisfied with the experience. All of the respondents thought it would be a valuable experience. One (33.0%) of the respondents had participated in the honors program, and was Very Satisfied with the experience. One (33.0%) of the respondents had participated in a research program, and was Very Satisfied with the experience.
Graduate/Professional Education B.A. Cultural Resource Management One respondent (33.0%) is currently enrolled in a degree program, one (33.0%) has taken courses, but not enrolled in a degree program, and one (33.0%) is likely to enroll in a degree program in the future. One respondent (33.3%) plans on obtaining a masters’ and one (33.3%)

Page 80
plans on obtaining a doctorate. Of the two respondents with graduate experience, one (50.0%) indicated her/his educational experiences at Southeastern “Ineffectively” prepared him/her for graduate school, while one (50.0%) indicated it had “Effectively” prepared her/him. One respondent (50.0%) indicated he/she was prepared “About the Same as Most” other students, while one (50.0%) indicated she/he was prepared “Worse than Most” other students. The respondent currently enrolled in a degree program indicated it is “Not at All Related” to his/her bachelor’s degree from Southeastern.
Employment B.A. Cultural Resource Management One respondent (33.3%) has a graduate assistantship, one (33.3%) is unemployed, but seeking employment, and one (33.3%) did not respond to this section. One respondent took over 1 year to find full-time employment, and one (33.3%) has not held a full-time job and has not looked. The respondent who had a full-time indicated that “Limited to only one geographic area” and “Tight job market” were major problems in finding employment. Minor problems included “Lack of experience” and “Age discrimination”. The respondent indicated that his/her education was Ineffective in preparing him/her for employment, and the respondent has had two full-time jobs. The respondent learned about his/her first full-time job through another student or friend.
Professional Activities B.A. Cultural Resource Management One respondent (33.3%) indicated that licensure/certification is not available in his/her field. One respondent (33.3%) is a member of a professional organization and one (33.3%) has attended a professional meeting in the past year.

Page 81
Department of Accounting
Table 35 Satisfaction with Degree Program
Number of Respondents: B.S. Accounting-23
Very Dissatisfied - 1
2
3
4
Very Satisfied - 5
Overall quality of your department B.S. Accounting 0.0% 0.0% 0.0% 43.5%(10) 56.5%(13)Overall quality of your degree program B.S. Accounting 0.0% 0.0% 0.0% 47.8%(11) 52.2%(12)Clarity of the degree requirements as outlined in the catalogue and/or curriculum sheets B.S. Accounting 0.0% 0.0% 0.0% 39.1%(9) 60.9%(14)Usefulness of the academic advice you received from your advisor B.S. Accounting 0.0% 4.3%(1) 39.1%(9) 34.8%(8) 21.7%(5)Opportunities to interact with faculty outside of class B.S. Accounting 0.0% 4.3%(1) 21.7%(5) 30.4%(7) 43.5%(10)Effectiveness of the faculty as teachers B.S. Accounting 0.0% 0.0% 4.3%(1) 52.2%(12) 43.5%(10)Friendliness and helpfulness of the office staff B.S. Accounting 0.0% 4.3%(1) 4.3%(1) 30.4%(7) 60.9%(14)Interest shown by faculty in your academic development B.S. Accounting 0.0% 0.0% 8.7%(2) 52.2%(12) 34.8%(8)Effectiveness of beginning courses in preparing you for advanced courses B.S. Accounting 0.0% 0.0% 4.3%(1) 60.9%(14) 34.8%(8)Quality of instruction in advanced courses B.S. Accounting 0.0% 0.0% 0.0% 43.5%(10) 52.2%(12)Professional activities, associations, or clubs B.S. Accounting 0.0% 4.3%(1) 17.4%(4) 34.8%(8) 39.1%(9)Practicum, internship, clinical, or other hands-on experiences outside of the classroom B.S. Accounting 4.3%(1) 8.7%(2) 13.0%(3) 39.1%(9) 30.4%(7)Opportunity for meaningful interaction with faculty in research or other scholarly activityB.S. Accounting 0.0% 13.0%(3) 43.5%(10) 34.8%(8) 8.7%(2)Availability of the required courses B.S. Accounting 4.3%(1) 8.7%(2) 13.0%(3) 43.5%(10) 30.4%(7)

Page 82
Table 35 continued
Satisfaction with Degree Program Department of Accounting
Number of Respondents: B.S. Accounting-23
Very Dissatisfied - 1
2
3
4
Very Satisfied - 5
Availability of elective courses you wanted to take in your major B.S. Accounting 0.0% 8.7%(2) 4.3%(1) 65.2%(15) 21.7%(5)Quality of instruction regarding standards and ethics in your major field B.S. Accounting 0.0% 4.3%(1) 8.7%(2) 47.8%(11) 39.1%(9)Friendliness and helpfulness of faculty B.S. Accounting 0.0% 0.0% 4.3%(1) 34.8%(8) 60.9%(14)Opportunities for you to collaborate with other students on class projects B.S. Accounting 0.0% 0.0% 4.3%(1) 56.5%(13) 39.1%(9)Computer resources (PC and/or mainframe) for courses in your major B.S. Accounting 4.3%(1) 0.0% 8.7%(2) 47.8%(11) 39.1%(9)Library resources related to your major B.S. Accounting 0.0% 0.0% 21.7%(5) 43.5%(10) 30.4%(7)Use of appropriate technology in the classroom B.S. Accounting 4.3%(1) 4.3%(1) 4.3%(1) 52.2%(12) 34.8%(8)Facilities and equipment related to your major B.S. Accounting 4.3%(1) 4.3%(1) 17.4%(4) 34.8%(8) 39.1%(9)Help/encouragement you received from faculty in your department with regard to further educational opportunities B.S. Accounting 4.3%(1) 0.0% 21.7%(5) 43.5%(10) 30.4%(7)The size of classes in your major B.S. Accounting 0.0% 0.0% 4.3%(1) 34.8%(8) 60.9%(14)Encouragement you received from faculty in your department with regard to finding employment in your field B.S. Accounting 13.0%(3) 8.7%(2) 17.4%(4) 39.1%(9) 21.7%(5)Global perspectives presented in courses B.S. Accounting 4.3%(1) 13.0%(3) 4.3%(1) 56.5%(13) 21.7%(5)Overall relevancy of courses B.S. Accounting 0.0% 4.3%(1) 0.0% 47.8%(11) 47.8%(11)

Page 83
Table 35 continued
Satisfaction with Degree Program Department of Accounting
No Yes 2. Would you recommend Southeastern to someone interested in what you majored in? B.S. Accounting 0.0% 100.0% (23) 3. If you had it to do over again, would you choose the same major? B.S. Accounting 4.3%(1) 95.7%(22) 4. Did you participate in an internship, a practicum, a clinical experience, or student
teaching as part of your degree requirements? B.S. Accounting 69.6%(16) 30.4%(7) 6. Should a hands-on course be required in your program? B.S. Accounting 21.7%(5) 73.9%(17) When asked what benefits they received from hands-on experience, Accounting graduates had the following to say:
“Experienced a work environment. Learned to deal with different types of people.”
“Professional knowledge”
“I gained experience that helped me get a job after I graduated from Southeastern.”
“I felt that it helped me to put all of the accounting theory into a practical environment. It helped me greatly in the preparation for a career.”
“It helped me realize that I was in the right major.”
“Perspective and experience.”
“I was capable of learning things that I was not taught in school”
Perceptions of Southeastern
B.S. Accounting One (4.3%) of the Accounting graduates had participated in study-abroad/student exchange and was Very Satisfied with the experience. The majority (73.9%) thought it would be a valuable experience. Three (13.0%) of the respondents had participated in the honors program, two (66.7%) were Somewhat Satisfied with the experience, and one (33.3%) was Very Dissatisfied. Two (8.7%) of the respondents participated in a research program, one (50.0%) was Somewhat Satisfied with the experience and one (50.0%) was Somewhat Dissatisfied.
Page 84
Graduate/Professional Education
Two (8.7%) of the respondents are currently enrolled in a graduate/professional degree program, Five (21.7%) of the respondents have completed a master’s degree, and two (8.7%) respondents have taken classes but have not enrolled in a degree program. One (4.3%) of the respondents plans to enroll in a degree program in the next 12 months, and five (21.7%) are likely to enroll in a degree program in the future. Eight (34.8%) of the respondents have no plans for further education. Of the fifteen respondents with plans for graduate education, three (20.0%) already have the highest degree they plan on obtaining, six (40.0%) plan on obtaining a master’s, three (20.0%) plan on obtaining a doctorate, and two (13.3%) plan on obtaining a professional degree. Of the nine individuals with graduate school experience, one (11.1%) respondent indicated that Southeastern prepared him/her “Ineffectively” for further graduate/professional study, six (66.7%) respondents indicated they were prepared “Effectively”, and two (22.2%) indicated they were “Very Effectively” prepared. One (11.1%) indicated Southeastern prepared him/her “Better than Most” other students and eight (88.9%) indicated that Southeastern prepared them “About the Same as Most” other students. Of the seven respondents who are enrolled in a degree program or have completed a degree, three (42.9%) indicated it was “Very Closely Related” to their bachelor’s degree from Southeastern and two (28.6%) indicated it is “Somewhat Related”.
Employment Over eighty percent of the respondents (87.0%, n=20) are employed full-time, one (4.3%) respondent is employed part-time and satisfied with part-time employment, one (4.3%) respondent is unemployed but seeking employment, and one (4.3%) respondent is unemployed and not looking for employment. Twelve (52.2%) of the respondents had their job before completing the degree, three (13.0%) accepted a position upon graduation, six (26.1%) respondents obtained a job 1-6 months after graduation, and one (4.3%) has never had find full-time employment and never looked. The six respondents who did not have a job upon graduation faced a variety of problems in obtaining employment. Table 36 presents what were considered major problems, minor problems, or no problem.

Page 85
Table 36
Please indicate whether each of the following was a major problem, minor problem, or not a problem in obtaining employment after graduating from Southeastern with your Bachelors. Major Problem Minor Problem Not A Problem Limited to only one geographic area 16.7% (1) 0.0% 66.7% (4) Not knowing what I wanted to do 0.0% 16.7% (1) 66.7% (4) Tight job market 16.7% (1) 33.3% (2) 33.3% (2) Lack of marketable skills 0.0% 16.7% (1) 66.7% (4) Lack of educational qualifications 0.0% 0.0% 83.3% (5) Reputation of Southeastern 0.0% 33.3% (2) 50.0% (3) Lack of experience 50.0% (3) 0.0% 33.3% (2) Lack of job search skills 0.0% 16.7% (1) 66.7% (4) Poor GPA 0.0% 16.7% (1) 66.7% (4) Racial discrimination 0.0% 0.0% 83.3% (5) Gender discrimination 0.0% 0.0% 83.3% (5) Age discrimination 0.0% 16.7% (1) 66.7% (4) Of the twenty-one respondents who have held a full-time job since graduating from Southeastern, nine of the respondents (42.9%) indicated their education was “Very Effective” in preparing them for employment or improving job performance, nine (42.9%) indicated it was “Effective”, and two (9.5%) indicated it was “Ineffective”. Eleven (52.4%) of the respondents indicated that they are currently in their first full-time job since graduating from Southeastern, six (28.6%) are in their second full-time, and four (19.0%) have had three or more. In regards to sources for learning about their first full-time job, three (14.3%) indicated from faculty at Southeastern, one (4.8%) from a parent or relative, three (14.3%) from a newspaper or trade publication, one (4.8%) from another student or friend, one (4.8%) was recruited by the employer, two (9.5%) from the Southeastern Job Fair, two (9.5%) from the Internet, three (14.3%) already had the job, and one (4.8%) from an internship. Of the twenty respondents who are currently employed full-time, nineteen (95.0%) are employed in the state of Louisiana and one (5.0%) is employed out of state. Seven (35.0%) of the respondents are employed in government, four (20.0%) are employed in business, five (25.0%) are employed in a professional firm, one (5.0%) is employed in K-12 education, and three (15.0%) are employed in industry. When asked “If underemployment is defined as a condition in which your job requires lower levels of skill and training than those you acquired in college, would you say that you are currently underemployed”, eighteen (90.0%) respondents felt they are not underemployed, while two (10.0%) felt they are underemployed. When asked about satisfaction with their present employment, twelve (60.0%) of the respondents are “Well satisfied; would not consider leaving”; seven (35.0%) are “Satisfied, but would consider more desirable employment”; and one (5.0%) “Dislike employment; seeking or will seek other employment.”

Page 86
Seventeen (85.0%) of the respondents are currently employed in the area of their Southeastern major, and two (10.0%) are employed in an area related to their Southeastern major. One (5.0%) is employed in an area not related to his/her Southeastern major because she/he developed a new career interest. One of the respondents (5.0%) gave a salary range of $15,001-$20,000, three (15.0%) gave a salary range of $20,001-$25,000, three (15.0%) gave a salary range of $25,001-$30,000, seven (35.0%) gave a salary range of $30,001-$40,000, five (25.0%) gave a salary range of $40,001-$50,000, and one (5.0%) indicated an annual salary of more than $50,000.
Professional Activities Twenty (87.0%) of the respondents do not currently hold certification/licensure and three (13.0%) do, two are CPAs. Of the remaining twenty, six (30.0%) do not plan on obtaining certification/licensure in the next twelve months, while thirteen (65.0%) do. Eight of the thirteen plan on obtaining a CPA and one plans on obtaining teaching certification. Eight (34.8%) of the respondents are members of a professional organization, and seven (30.4%) have attended a professional meeting in the past year.
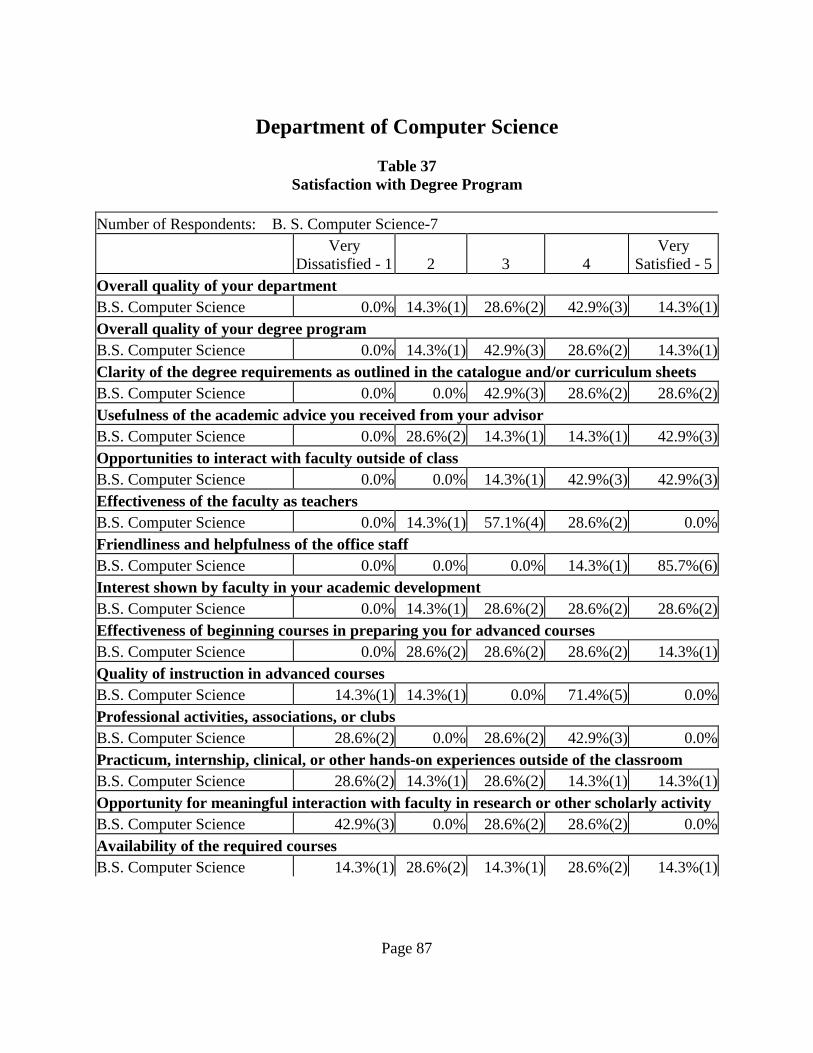
Page 87
Department of Computer Science
Table 37 Satisfaction with Degree Program
Number of Respondents: B. S. Computer Science-7
Very Dissatisfied - 1
2
3
4
Very Satisfied - 5
Overall quality of your department B.S. Computer Science 0.0% 14.3%(1) 28.6%(2) 42.9%(3) 14.3%(1)Overall quality of your degree program B.S. Computer Science 0.0% 14.3%(1) 42.9%(3) 28.6%(2) 14.3%(1)Clarity of the degree requirements as outlined in the catalogue and/or curriculum sheets B.S. Computer Science 0.0% 0.0% 42.9%(3) 28.6%(2) 28.6%(2)Usefulness of the academic advice you received from your advisor B.S. Computer Science 0.0% 28.6%(2) 14.3%(1) 14.3%(1) 42.9%(3)Opportunities to interact with faculty outside of class B.S. Computer Science 0.0% 0.0% 14.3%(1) 42.9%(3) 42.9%(3)Effectiveness of the faculty as teachers B.S. Computer Science 0.0% 14.3%(1) 57.1%(4) 28.6%(2) 0.0%Friendliness and helpfulness of the office staff B.S. Computer Science 0.0% 0.0% 0.0% 14.3%(1) 85.7%(6)Interest shown by faculty in your academic development B.S. Computer Science 0.0% 14.3%(1) 28.6%(2) 28.6%(2) 28.6%(2)Effectiveness of beginning courses in preparing you for advanced courses B.S. Computer Science 0.0% 28.6%(2) 28.6%(2) 28.6%(2) 14.3%(1)Quality of instruction in advanced courses B.S. Computer Science 14.3%(1) 14.3%(1) 0.0% 71.4%(5) 0.0%Professional activities, associations, or clubs B.S. Computer Science 28.6%(2) 0.0% 28.6%(2) 42.9%(3) 0.0%Practicum, internship, clinical, or other hands-on experiences outside of the classroom B.S. Computer Science 28.6%(2) 14.3%(1) 28.6%(2) 14.3%(1) 14.3%(1)Opportunity for meaningful interaction with faculty in research or other scholarly activityB.S. Computer Science 42.9%(3) 0.0% 28.6%(2) 28.6%(2) 0.0%Availability of the required courses B.S. Computer Science 14.3%(1) 28.6%(2) 14.3%(1) 28.6%(2) 14.3%(1)

Page 88
Table 37 continued
Satisfaction with Degree Program Department of Computer Science
Number of Respondents: B.S. Computer Science-7
Very Dissatisfied - 1
2
3
4
Very Satisfied - 5
Availability of elective courses you wanted to take in your major B.S. Computer Science 14.3%(1) 28.6%(2) 28.6%(2) 14.3%(1) 14.3%(1)Quality of instruction regarding standards and ethics in your major field B.S. Computer Science 14.3%(1) 0.0% 42.9%(3) 42.9%(3) 0.0%Friendliness and helpfulness of faculty B.S. Computer Science 0.0% 0.0% 14.3%(1) 57.1%(4) 28.6%(2)Opportunities for you to collaborate with other students on class projects B.S. Computer Science 0.0% 0.0% 28.6%(2) 28.6%(2) 42.9%(3)Computer resources (PC and/or mainframe) for courses in your major B.S. Computer Science 0.0% 0.0% 42.9%(3) 42.9%(3) 14.3%(1)Library resources related to your major B.S. Computer Science 28.6%(2) 0.0% 42.9%(3) 28.6%(2) 0.0%Use of appropriate technology in the classroom B.S. Computer Science 14.3%(1) 14.3%(1) 42.9%(3) 28.6%(2) 0.0%Facilities and equipment related to your major B.S. Computer Science 14.3%(1) 28.6%(2) 42.9%(3) 14.3%(1) 0.0% Help/encouragement you received from faculty in your department with regard to further educational opportunities B.S. Computer Science 14.3%(1) 0.0% 42.9%(3) 28.6%(2) 14.3%(1)The size of classes in your major B.S. Computer Science 0.0% 0.0% 14.3%(1) 28.6%(2) 57.1%(4)Encouragement you received from faculty in your department with regard to finding employment in your field B.S. Computer Science 14.3%(1) 28.6%(2) 0.0% 28.6%(2) 28.6%(2)Global perspectives presented in courses B.S. Computer Science 14.3%(1) 28.6%(2) 28.6%(2) 14.3%(1) 14.3%(1)Overall relevancy of courses B.S. Computer Science 14.3%(1) 0.0% 71.4%(5) 14.3%(1) 0.0%

Page 89
Table 37 continued
Satisfaction with Degree Program Department of Computer Science
No Yes 2. Would you recommend Southeastern to someone interested in what you majored in? B.S. Computer Science 14.3%(1) 85.7%(6) 3. If you had it to do over again, would you choose the same major?
B.S. Computer Science 28.6%(2) 57.1%(4); Not at Southeastern 14.3%(1)
4. Did you participate in an internship, a practicum, a clinical experience, or student teaching as part of your degree requirements?
B.S. Computer Science 85.7%(6) 14.3%(1) 6. Should a hands-on course be required in your program? B.S. Computer Science 14.3%(1) 85.7%(6) When asked what benefits they received from their hands-on experience, respondents said,
“The work experience is the benefit. Employers want experience.”
Perceptions of Southeastern None of the Computer Science graduates had participated in study-abroad/student exchange, but 57.1% thought it would be a valuable experience. None of the respondents had participated in the honors program. One (14.3%) of the respondents participated in a research program and was Somewhat Dissatisfied with the experience.
Graduate/Professional Education Two (28.6%) respondents are currently enrolled in a degree program, one (14.3%) has taken classes, but not enrolled in a degree program, one (14.3%) plans to enroll in a graduate or professional degree program within the next twelve months, and three (42.9%) plan to enroll in a degree program in the future. Six (85.7%) of the respondents plan to obtain a masters degree, and one (14.3%) plans on obtaining a second baccalaureate. The three individuals with graduate school experience indicated that their educational experiences at Southeastern “Effectively” prepared them for further graduate/professional study and that Southeastern prepared them “About the Same as Most” other students. Of the two respondents who are enrolled in a degree program, one (50.0%) indicated it was “Somewhat Related” to their bachelor’s degree from Southeastern and one (50.0%) indicated it was “Very Closely Related”.

Page 90
Employment
All (100%) of the respondents are employed full-time. Three (42.9%) of the respondents had their jobs before completing their degrees, two (28.6%) respondents obtained a job 1-6 months after graduation, and one (14.3%) took 7-12 months. The three respondents who did not have a job upon graduation faced a variety of problems in obtaining employment. Table 38 presents what were considered major problems, minor problems, or no problem.
Table 38 Please indicate whether each of the following was a major problem, minor problem, or not a problem in obtaining employment after graduating from Southeastern with your Bachelors. Major Problem Minor Problem Not A Problem Limited to only one geographic area 33.3% (1) 0.0% 33.3% (1) Not knowing what I wanted to do 0.0% 0.0% 66.7% (2) Tight job market 33.3% (1) 0.0% 33.3% (1) Lack of marketable skills 33.3% (1) 0.0% 33.3% (1) Lack of educational qualifications 33.3% (1) 0.0% 33.3% (1) Reputation of Southeastern 0.0% 33.3% (1) 33.3% (1) Lack of experience 33.3% (1) 33.3% (1) 0.0% Lack of job search skills 0.0% 0.0% 33.3% (3) Poor GPA 0.0% 0.0% 33.3% (3) Racial discrimination 0.0% 0.0% 33.3% (3) Gender discrimination 0.0% 0.0% 33.3% (3) Age discrimination 0.0% 0.0% 33.3% (3) One of the respondents (14.3%) indicated his/her education was “Very Effective” in preparing her/him for employment or improving job performance, three (42.9%) indicated it was “Effective”, and one (14.3%) indicated it was “Ineffective”. Four (57.1%) of the respondents indicated that they are currently in their first full-time job since graduating from Southeastern, one (14.3%) is in her/his second full-time, and one (14.3%) has had three or more. In regards to sources for learning about their first full-time job, two (28.6%) indicated from faculty at Southeastern, one (14.3%) was recruited by the employer, and one (14.3%) from the Internet. Six (85.7%) of the respondents are employed in the state of Louisiana, and one (14.3%) is employed out of state. Two (28.6%) of the respondents are employed in higher education, three(42.9%) in government, one (14.3%) in business, and one (14.3%) in industry. When asked “If underemployment is defined as a condition in which your job requires lower levels of skill and training than those you acquired in college, would you say that you are currently underemployed”, six (85.7%) respondents felt they are not underemployed, while one (14.3%) felt he/she is underemployed. When asked about satisfaction with their present employment, one

Page 91
(14.3%) of the respondents is “Well satisfied; would not consider leaving”, five (71.4%) are “Satisfied, but would consider more desirable employment”, and one (14.3%) “Dislike[s] employment; seeking or will seek other employment.” Four (57.1%) of the respondents are currently employed in the area of their Southeastern major, two (28.6%) are employed in an area related to their Southeastern major, and one (14.3%) is employed in an unrelated area because he/she developed a new career interest. One (14.3%) of the respondents gave a salary range of $10,000-$15,000, two (28.6%) gave a range of $20,001-$25,000, two (28.6%) gave a salary range of $30,001-$40,000, one (14.3%) gave a salary range of $40,000-$50,000, and one (14.3%) indicated an annual salary of over $50,000.
Professional Activities One (14.3%) respondent indicated that licensure/certification was not available in his/her field and one (14.3%) currently holds CNA certification. None of the five who are not currently certified plan on obtaining certification/licensure in the next twelve months. One (14.3%) respondent is a member of a professional organization and two (28.6%) of the respondents have attended a professional meeting in the previous year.
Special Questions All of the respondents completed the insert which contained the special questions. When asked what type of work they do, four (57.1%) indicated they are developing and maintaining business-types of applications, four (57.1%) are working toward a graduate degree, one (14.3%) works in systems and/or network administration, and three (28.6%) work on other types of computing-based tasks. Alumni were also asked to indicate how much help the concepts learned in various classes have been in their jobs and/or graduate studies. Table 39 provides the frequencies and the means for those courses. It should be noted that the means do not include any NA responses.
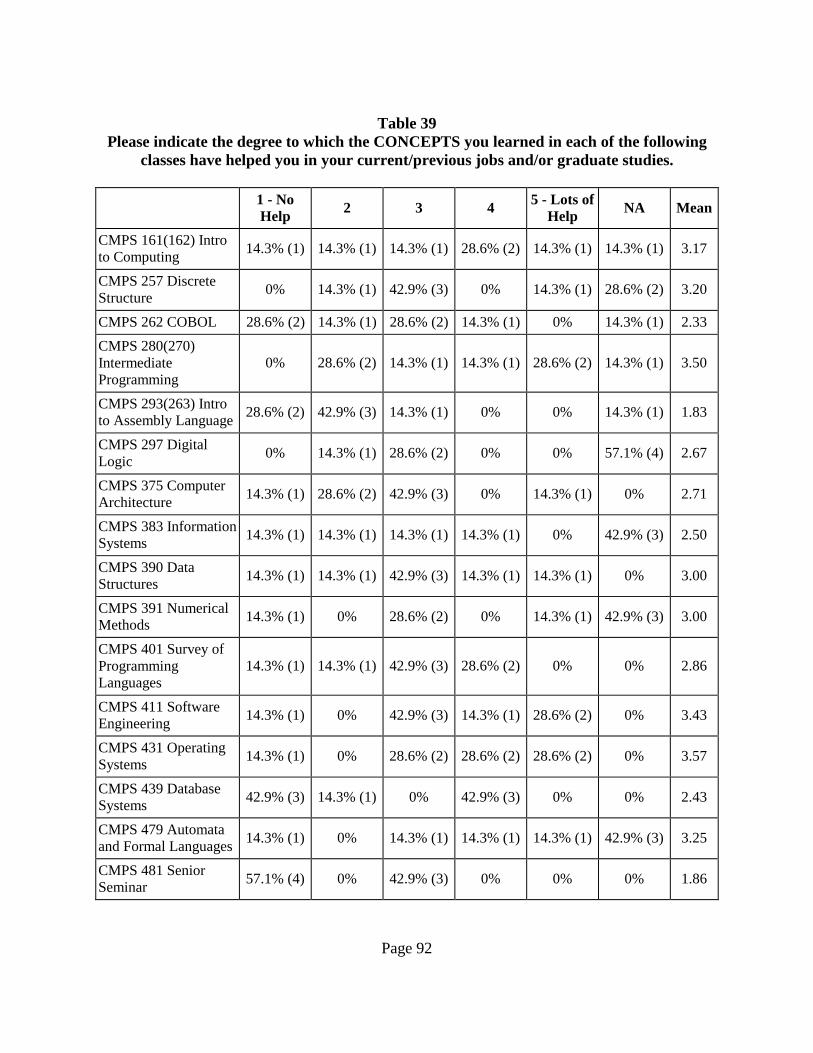
Page 92
Table 39 Please indicate the degree to which the CONCEPTS you learned in each of the following
classes have helped you in your current/previous jobs and/or graduate studies. 1 - No
Help 2 3 4 5 - Lots of Help NA Mean
CMPS 161(162) Intro to Computing 14.3% (1) 14.3% (1) 14.3% (1) 28.6% (2) 14.3% (1) 14.3% (1) 3.17
CMPS 257 Discrete Structure 0% 14.3% (1) 42.9% (3) 0% 14.3% (1) 28.6% (2) 3.20
CMPS 262 COBOL 28.6% (2) 14.3% (1) 28.6% (2) 14.3% (1) 0% 14.3% (1) 2.33 CMPS 280(270) Intermediate Programming
0% 28.6% (2) 14.3% (1) 14.3% (1) 28.6% (2) 14.3% (1) 3.50
CMPS 293(263) Intro to Assembly Language 28.6% (2) 42.9% (3) 14.3% (1) 0% 0% 14.3% (1) 1.83
CMPS 297 Digital Logic 0% 14.3% (1) 28.6% (2) 0% 0% 57.1% (4) 2.67
CMPS 375 Computer Architecture 14.3% (1) 28.6% (2) 42.9% (3) 0% 14.3% (1) 0% 2.71
CMPS 383 Information Systems 14.3% (1) 14.3% (1) 14.3% (1) 14.3% (1) 0% 42.9% (3) 2.50
CMPS 390 Data Structures 14.3% (1) 14.3% (1) 42.9% (3) 14.3% (1) 14.3% (1) 0% 3.00
CMPS 391 Numerical Methods 14.3% (1) 0% 28.6% (2) 0% 14.3% (1) 42.9% (3) 3.00
CMPS 401 Survey of Programming Languages
14.3% (1) 14.3% (1) 42.9% (3) 28.6% (2) 0% 0% 2.86
CMPS 411 Software Engineering 14.3% (1) 0% 42.9% (3) 14.3% (1) 28.6% (2) 0% 3.43
CMPS 431 Operating Systems 14.3% (1) 0% 28.6% (2) 28.6% (2) 28.6% (2) 0% 3.57
CMPS 439 Database Systems 42.9% (3) 14.3% (1) 0% 42.9% (3) 0% 0% 2.43
CMPS 479 Automata and Formal Languages 14.3% (1) 0% 14.3% (1) 14.3% (1) 14.3% (1) 42.9% (3) 3.25
CMPS 481 Senior Seminar 57.1% (4) 0% 42.9% (3) 0% 0% 0% 1.86

Page 93
When asked “What course(s), not listed above, have helped you in your job(s) and/or graduate studies?”, alumni responded: ! All of my business courses have helped! ! Physics - E/M; Linear Algebra; Diff. Eq.; For grad school, you must force more math!!! When asked “What concepts were NOT taught that, if taught, would have better prepared you for your job(s) or graduate studies?”, alumni responded: ! Actual business network system...e-mail server setup, router configuration, abstract
networking concepts, network programming ! The courses listed above gave me a great background for the work I currently do. None
were directly related to my job function. ! Include more hands-on classes, covering current in-use business applications. Visual
Basic, Visual C, Oracle, Networking, not just introductory courses When asked “What changes would you suggest to improve the computer science program?”, alumni responded: ! They have already improved since Dr. Howatt has been here. It is just too bad I was
unable to benefit. The department was not accredited when I graduated. ! Create a few more dedicated labs - different OS’s, Linux, Solaris, NT, 2000...etc. Use
some of the technology money make a course using C not C++. ! Give the students more hands on experience with Operating systems such as LINUX and
Solaris...Java, Perl, PHP, XML ! Get someone who will actually teach software engineering. ! Perhaps a showing of different computing systems would be helpful, i.e. AIX, Linux,
VMS, SCO, NT, NetWare... ! The program has to change to adapt to businsess needs. Theory is good, but practicle
experience gets graduates jobs!

Page 94
Department of Industrial Technology
Table 41 Satisfaction with Degree Program
Number of Respondents: B.S. Industrial Technology - 12
Very Dissatisfied - 1
2
3
4
Very Satisfied - 5
Overall quality of your department B.S. Industrial Technology 0.0% 0.0% 33.3%(4) 50.0%(6) 16.7%(2)Overall quality of your degree program B.S. Industrial Technology 0.0% 16.7%(2) 25.0%(3) 41.7%(5) 16.75(2)Clarity of the degree requirements as outlined in the catalogue and/or curriculum sheets B.S. Industrial Technology 0.0% 8.3%(1) 8.3%(1) 50.0%(6) 33.3%(4)Usefulness of the academic advice you received from your advisor B.S. Industrial Technology 0.0% 16.7%(2) 16.7%(2) 41.7%(5) 25.0%(3)Opportunities to interact with faculty outside of class B.S. Industrial Technology 0.0% 8.3%(1) 8.3%(1) 41.7%(5) 41.7%(5)Effectiveness of the faculty as teachers B.S. Industrial Technology 0.0% 16.7%(2) 8.3%(1) 66.7%(8) 8.3%(1)Friendliness and helpfulness of the office staff B.S. Industrial Technology 0.0% 0.0% 16.7%(2) 41.7%(5) 41.7%(5)Interest shown by faculty in your academic development B.S. Industrial Technology 0.0% 8.3%(1) 25.0%(3) 41.7%(5) 25.0%(3)Effectiveness of beginning courses in preparing you for advanced courses B.S. Industrial Technology 0.0% 8.3%(1) 16.7%(2) 58.3%(7) 16.7%(2)Quality of instruction in advanced courses B.S. Industrial Technology 0.0% 8.3%(1) 16.7%(2) 58.3%(7) 16.7%(2)Professional activities, associations, or clubs B.S. Industrial Technology 0.0% 8.3%(1) 50.0%(6) 25.0%(3) 16.7%(2)Practicum, internship, clinical, or other hands-on experiences outside of the classroom B.S. Industrial Technology 0.0% 16.7%(2) 33.3%(4) 25.0%(3) 25.0%(3)Opportunity for meaningful interaction with faculty in research or other scholarly activityB.S. Industrial Technology 0.0% 25.0%(3) 33.3%(4) 8.3%(1) 33.3%(4)Availability of the required courses B.S. Industrial Technology 8.3%(1) 41.7%(5) 25.0%(3) 25.0%(3) 0.0%

Page 95
Table 41 continued
Satisfaction with Degree Program Department of Industrial Technology
Number of Respondents: B.S. Industrial Technology - 12
Very Dissatisfied - 1
2
3
4
Very Satisfied - 5
Availability of elective courses you wanted to take in your major B.S. Industrial Technology 0.0% 16.7%(2) 41.7%(5) 33.3%(4) 8.3%(1)Quality of instruction regarding standards and ethics in your major field B.S. Industrial Technology 0.0% 16.7%(2) 16.7%(2) 41.7%(5) 25.0%(3)Friendliness and helpfulness of faculty B.S. Industrial Technology 0.0% 0.0% 8.3%(1) 58.3%(7) 25.0%(3)Opportunities for you to collaborate with other students on class projects B.S. Industrial Technology 0.0% 0.0% 0.0% 66.7%(8) 33.3%(4)Computer resources (PC and/or mainframe) for courses in your major B.S. Industrial Technology 0.0% 8.3%(1) 16.7%(2) 66.7%(8) 8.3%(1)Library resources related to your major B.S. Industrial Technology 8.3%(1) 8.3%(1) 50.0%(6) 33.3%(4) 0.0%Use of appropriate technology in the classroom B.S. Industrial Technology 0.0% 25.0%(3) 16.7%(2) 50.0%(6) 8.3%(1)Facilities and equipment related to your major B.S. Industrial Technology 0.0% 8.3%(1) 25.0%(3) 66.7%(8) 0.0%Help/encouragement you received from faculty in your department with regard to further educational opportunities B.S. Industrial Technology 0.0% 16.7%(2) 25.0%(3) 50.0%(6) 8.3%(1)The size of classes in your major B.S. Industrial Technology 0.0% 0.0% 16.7%(2) 41.7%(5) 41.7%(5)Encouragement you received from faculty in your department with regard to finding employment in your field B.S. Industrial Technology 0.0% 25.0%(3) 16.7%(2) 33.3%(4) 25.0%(3)Global perspectives presented in courses B.S. Industrial Technology 8.3%(1) 8.3%(1) 58.3%(7) 16.7%(2) 8.3%(1)Overall relevancy of courses B.S. Industrial Technology 8.3%(1) 0.0% 25.0%(3) 58.3%(7) 8.3%(1)

Page 96
Table 41 continued
Satisfaction with Degree Program Department of Industrial Technology
No Yes 2. Would you recommend Southeastern to someone interested in what you majored in? B.S. Industrial Technology 25.0%(3) 75.0%(9) 3. If you had it to do over again, would you choose the same major?
B.S. Industrial Technology 58.3%(7) 33.3%(4); 8.3%(1)Not at Southeastern
4. Did you participate in an internship, a practicum, a clinical experience, or student teaching as part of your degree requirements?
B.S. Industrial Technology 66.7%(8) 33.3%(4) 6. Should a hands-on course be required in your program? B.S. Industrial Technology 25.0%(3) 66.7%(8) When asked what benefits they received from hands-on experience, Industrial Technology graduates had the following to say:
“Some benefit in supervising others.”
“Team work, interaction.”
“None. I just did it for the credits to graduate sooner.”
“Greater perspective of actual situations in the workforce.”
“It allows students to increase their horizon of a “book learned only” subject to an activity that the student has actually experienced.”
Perceptions of Southeastern
None of the Industrial Technology graduates had participated in the study-abroad/student exchange, but 66.7% thought it would be a valuable experience. Two (16.7%) of the respondents had participated in the honors program, one was Very Satisfied and one was Somewhat Satisfied with the experience. Two (16.7%) of the respondents had participated in a research program, one was Very Satisfied and one was Somewhat Satisfied with the experience.
Graduate/Professional Education Two (16.7%) of the respondents have taken classes, but not enrolled in a degree program. One (8.3%) respondent plans to enroll in a degree program in the next 12 months and four (33.3%) are likely to enroll in a degree program in the future. Five (41.7%) of the respondents have no

Page 97
plans for further education. Of those respondents who have plans for further education, six (85.7%) plan on obtaining a master’s and one (14.3%) plans on obtaining a professional degree. Of the two respondents with graduate school experience, one (50.0%) indicated that Southeastern “Very Effectively” prepared him/her while one (50.0%) felt she/he was “Effectively” prepared. One (50.0%) respondent indicated that Southeastern prepared him/her “Better than Most” other students and one (50.0%) indicated that Southeastern prepared him/her “About the Same as Most” students.
Employment All twelve (100%) of the respondents are employed full-time. One (8.3%) of the respondents had a job before completing his/her degree, four (33.3%) accepted a position upon graduation, five (41.7%) respondents obtained a job 1-6 months after graduation, and two (16.7%) took 7-12 months. The seven respondents who did not have a job upon graduation faced a variety of problems in obtaining employment. Table 42 presents what were considered major problems, minor problems, or no problems.
Table 42 Please indicate whether each of the following was a major problem, minor problem, or not a problem in obtaining employment after graduating from Southeastern with your Bachelors. Major Problem Minor Problem Not A Problem Limited to only one geographic area 14.3% (1) 28.6% (2) 28.6% (2) Not knowing what I wanted to do 14.3% (1) 28.6% (2) 28.6% (2) Tight job market 28.6% (2) 42.9% (3) 0.0% Lack of marketable skills 14.3% (1) 28.6% (2) 28.6% (2) Lack of educational qualifications 0.0% 42.9% (3) 28.6% (2) Reputation of Southeastern 0.0% 14.3% (1) 57.1% (4) Lack of experience 28.6% (2) 28.6% (2) 14.3% (1) Lack of job search skills 14.3% (1) 57.1% (4) 0.0% Poor GPA 0.0% 14.3% (1) 57.1% (4) Racial discrimination 0.0% 0.0% 71.4% (5) Gender discrimination 0.0% 0.0% 57.1% (4) Age discrimination 0.0% 0.0% 57.1% (4) Two of the respondents (16.7%) indicated their education was “Very Effective” in preparing them for employment or improving job performance, six (50.0%) indicated it was “Effective”, and three (25.0%) indicated it was “Ineffective”. Five (41.7%) of the respondents indicated that they are currently in their first full-time job since graduating from Southeastern, five (41.7%) are in their second full-time job, and one (8.3%) has had three or more. In regards to sources for

Page 98
learning about their first full-time job, four (33.3%) indicated from faculty at Southeastern, two (16.7%) from parents or relatives, one (8.3%) from a newspaper or trade publication, one (8.3%) from another student or friend, one (8.3%) from an employment agency, one (8.3%) from the Internet, one (8.3%) already had a job, and one (8.3%) from an internship or practicum. Nine (75.0%) of the respondents work in the state of Louisiana, and three (25.0%) work out of state. Two (16.7%) of the respondents work in government, one (8.3%) of the respondents works in a business, and nine (75.0%) are employed in industry. When asked “If underemployment is defined as a condition in which your job requires lower levels of skill and training than those you acquired in college, would you say that you are currently underemployed”, nine (75.0%) indicated they were not underemployed while three (25.0%) felt that they were underemployed. When asked about satisfaction with their present employment, six (50.0%) of the respondents are “Well satisfied; would not consider leaving”; and six (50.0%) of the respondents are “Satisfied, but would consider more desirable employment”. Two (16.7%) of the respondents are currently employed in the area of their Southeastern major, nine (75.0%) are employed in an area related to their Southeastern major and one (8.3%) is employed in an area not related to his/her Southeastern major because he/she could not find a job she/he wanted. When asked to give a salary range, one (8.3%) gave a range between $20,001-$25,000, one (8.3%) between $25,001-$30,000, three (25.0%) between $30,001-$40,000, two (16.7%) between $40,001-$50,000, and five (41.7%) indicated a range of more than $50,000.
Professional Activities Four (33.3%) of the respondents indicated that licensure/certification is not available in their field, seven (58.3%) indicated they do not have licensure/certification, and one (8.3%) has C.I.T. licensure/certification. Of the seven who do not hold licensure/certification, five (71.4%) do not plan on obtaining licensure/certification in the next twelve months while two (28.6%) plan on obtaining licensure/certification. Six (50.0%) of the respondents are members of a professional organization and four (33.3%) have attended a professional meeting in the past year.

Page 99
Department of Management
Table 43 Satisfaction with Degree Program
Number of Respondents: B.A. Management-10
Very Dissatisfied - 1
2
3
4
Very Satisfied - 5
Overall quality of your department B.A. Management 0.0% 10.0%(1) 10.0%(1) 50.0%(5) 30.0%(3)Overall quality of your degree program B.A. Management 0.0% 10.0%(1) 20.0%(2) 30.0%(3) 40.0%(4)Clarity of the degree requirements as outlined in the catalogue and/or curriculum sheets B.A. Management 0.0% 0.0% 0.0% 60.0%(6) 30.0%(3)Usefulness of the academic advice you received from your advisor B.A. Management 0.0% 40.0%(4) 0.0% 50.0%(5) 10.0%(1)Opportunities to interact with faculty outside of class B.A. Management 0.0% 10.0%(1) 30.0%(3) 20.0%(2) 40.0%(4)Effectiveness of the faculty as teachers B.A. Management 0.0% 10.0%(1) 0.0% 50.0%(5) 40.0%(4)Friendliness and helpfulness of the office staff B.A. Management 0.0% 0.0% 20.0%(2) 20.0%(2) 60.0%(6)Interest shown by faculty in your academic development B.A. Management 0.0% 10.0%(1) 20.0%(2) 30.0%(3) 40.0%(4)Effectiveness of beginning courses in preparing you for advanced courses B.A. Management 0.0% 0.0% 30.0%(3) 60.0%(6) 10.0%(1)Quality of instruction in advanced courses B.A. Management 0.0% 0.0% 20.0%(2) 40.0%(4) 40.0%(4)Professional activities, associations, or clubs B.A. Management 0.0% 0.0% 30.0%(3) 40.0%(4) 20.0%(2)Practicum, internship, clinical, or other hands-on experiences outside of the classroom B.A. Management 0.0% 30.0%(3) 30.0%(3) 20.0%(2) 10.0%(1)Opportunity for meaningful interaction with faculty in research or other scholarly activityB.A. Management 0.0% 10.0%(1) 30.0%(3) 40.0%(4) 10.0%(1)Availability of the required courses B.A. Management 0.0% 0.0% 20.0%(2) 50.0%(5) 30.0%(3)

Page 100
Table 43 continued
Satisfaction with Degree Program Department of Management
Number of Respondents: B.A. Management-10
Very Dissatisfied - 1
2
3
4
Very Satisfied - 5
Availability of elective courses you wanted to take in your major B.A. Management 0.0% 0.0% 20.0%(2) 30.0%(3) 40.0%(4)Quality of instruction regarding standards and ethics in your major field B.A. Management 0.0% 0.0% 20.0%(2) 40.0%(4) 30.0%(3)Friendliness and helpfulness of faculty B.A. Management 0.0% 0.0% 0.0% 30.0%(3) 60.0%(6)Opportunities for you to collaborate with other students on class projects B.A. Management 0.0% 0.0% 30.0%(3) 30.0%(3) 30.0%(3)Computer resources (PC and/or mainframe) for courses in your major B.A. Management 0.0% 0.0% 40.0%(4) 20.0%(2) 30.0%(3)Library resources related to your major B.A. Management 0.0% 0.0% 40.0%(4) 20.0%(2) 30.0%(3)Use of appropriate technology in the classroom B.A. Management 0.0% 10.0%(1) 30.0%(3) 30.0%(3) 20.0%(2)Facilities and equipment related to your major B.A. Management 0.0% 0.0% 30.0%(3) 20.0%(2) 40.0%(4)Help/encouragement you received from faculty in your department with regard to further educational opportunities B.A. Management 0.0% 10.0%(1) 30.0%(3) 40.0%(4) 10.0%(1)The size of classes in your major B.A. Management 0.0% 0.0% 10.0%(1) 30.0%(3) 50.0%(5)Encouragement you received from faculty in your department with regard to finding employment in your field B.A. Management 10.0%(1) 10.0%(1) 40.0%(4) 10.0%(1) 10.0%(1)Global perspectives presented in courses B.A. Management 0.0% 0.0% 40.0%(4) 30.0%(3) 20.0%(2)Overall relevancy of courses B.A. Management 0.0% 0.0% 20.0%(2) 40.0%(4) 30.0%(3)
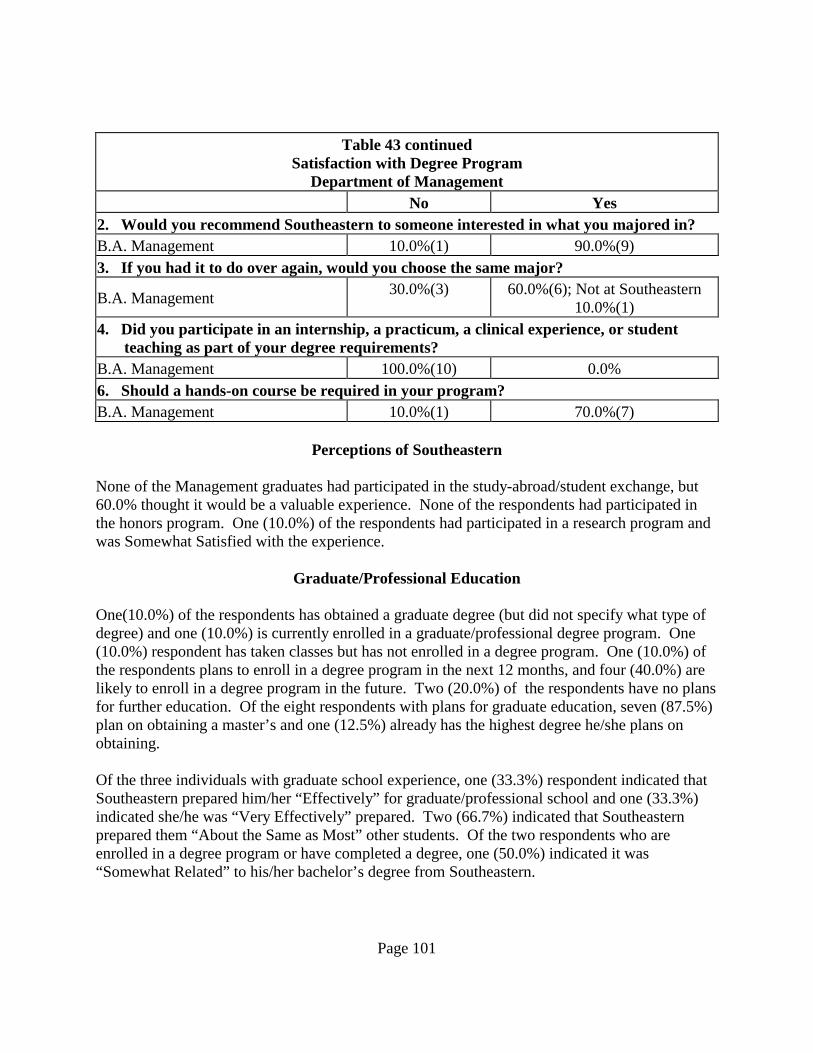
Page 101
Table 43 continued
Satisfaction with Degree Program Department of Management
No Yes 2. Would you recommend Southeastern to someone interested in what you majored in? B.A. Management 10.0%(1) 90.0%(9) 3. If you had it to do over again, would you choose the same major?
B.A. Management 30.0%(3) 60.0%(6); Not at Southeastern 10.0%(1)
4. Did you participate in an internship, a practicum, a clinical experience, or student teaching as part of your degree requirements?
B.A. Management 100.0%(10) 0.0% 6. Should a hands-on course be required in your program? B.A. Management 10.0%(1) 70.0%(7)
Perceptions of Southeastern None of the Management graduates had participated in the study-abroad/student exchange, but 60.0% thought it would be a valuable experience. None of the respondents had participated in the honors program. One (10.0%) of the respondents had participated in a research program and was Somewhat Satisfied with the experience.
Graduate/Professional Education One(10.0%) of the respondents has obtained a graduate degree (but did not specify what type of degree) and one (10.0%) is currently enrolled in a graduate/professional degree program. One (10.0%) respondent has taken classes but has not enrolled in a degree program. One (10.0%) of the respondents plans to enroll in a degree program in the next 12 months, and four (40.0%) are likely to enroll in a degree program in the future. Two (20.0%) of the respondents have no plans for further education. Of the eight respondents with plans for graduate education, seven (87.5%) plan on obtaining a master’s and one (12.5%) already has the highest degree he/she plans on obtaining. Of the three individuals with graduate school experience, one (33.3%) respondent indicated that Southeastern prepared him/her “Effectively” for graduate/professional school and one (33.3%) indicated she/he was “Very Effectively” prepared. Two (66.7%) indicated that Southeastern prepared them “About the Same as Most” other students. Of the two respondents who are enrolled in a degree program or have completed a degree, one (50.0%) indicated it was “Somewhat Related” to his/her bachelor’s degree from Southeastern.

Page 102
Employment
The majority of the respondents (90.0%, n=9) are employed full-time, with one (10.0%) employed part-time and looking for full-time. Four (40.0%) of the respondents had a job before graduation from Southeastern, two (20.0%) accepted a position upon graduation, three (30.0%) respondents obtained a job 1-6 months after graduation, and one (10.0%) respondent took over a year to obtain a full-time job. The four respondents who did not have a job upon graduation faced a variety of problems in obtaining employment. Table 44 presents what were considered major problems, minor problems, or no problem.
Table 44 Please indicate whether each of the following was a major problem, minor problem, or not a problem in obtaining employment after graduating from Southeastern with your Bachelors. Major Problem Minor Problem Not A Problem Limited to only one geographic area 0.0% 50.0% (2) 50.0% (2) Not knowing what I wanted to do 0.0% 50.0% (2) 50.0% (2) Tight job market 50.0% (2) 0.0% 50.0% (2) Lack of marketable skills 0.0% 25.0% (1) 75.0% (3) Lack of educational qualifications 0.0% 25.0% (1) 75.0% (3) Reputation of Southeastern 0.0% 0.0% 100% (4) Lack of experience 0.0% 25.0% (1) 75.0% (3) Lack of job search skills 0.0% 25.0% (1) 75.0% (3) Poor GPA 0.0% 25.0% (1) 75.0% (3) Racial discrimination 0.0% 0.0% 100% (4) Gender discrimination 0.0% 0.0% 100% (4) Age discrimination 0.0% 25.0% (1) 75.0% (3) Two of the respondents (20.0%) indicated their education was “Very Effective” in preparing them for employment or improving job performance, five (50.0%) indicated it was “Effective”, and one (10.0%) indicated it was “Ineffective”. Five (50.0%) of the respondents indicated that they are currently in their first full-time job since graduating from Southeastern, three (30.0%) are in their second full-time job, and one (10.0%) has had three or more. In regards to sources for learning about their first full-time job, one (10.0%) indicated from parents or relatives, two (20.0%) from another student or friend, one (10.0%) from the Internet, and three (30.0%) already had a job. Of the nine respondents who are currently employed full-time, six (66.7%) are employed in the state of Louisiana and three (33.3%) are employed out of state. Two (22.2%) of the respondents

Page 103
are employed in a service organization, two (22.2%) in higher education, and five (55.6%) in business. When asked “If underemployment is defined as a condition in which your job requires lower levels of skill and training than those you acquired in college, would you say that you are currently underemployed”, seven (77.8%) respondents felt they are not underemployed, while two (22.2%) felt they are underemployed. When asked about satisfaction with their present employment, four (44.4%) of the respondents are “Well satisfied; would not consider leaving”; and five (55.6%) are “Satisfied, but would consider more desirable employment.” Three (33.3%) of the respondents are currently employed in the area of their Southeastern major and five (55.6%) are employed in an area related to their Southeastern major. One (11.1%) of the respondents indicated an annual salary of less than $10,000, four (22.2%) gave a salary range of $20,001-$25,000, one (11.1%) gave a salary range of $25,001-$30,000, one (11.1%) gave a salary range of $30,001-$40,000, one (11.1%) gave a salary range of $40,001-$50,000, and three (33.3%) indicated an annual salary of more than $50,000.
Professional Activities Five (50.0%) of the respondents indicated certification/licensure is not available in their field and five (50.0%) do not currently hold certification/licensure. None of those without certification/licensure plan on obtaining it within the next 12 months. Three (30.0%) of the respondents are members of a professional organization, and six (60.0%) have attended a professional meeting in the past year.
Special Questions All of the respondents completed the insert which contained the special questions. Alumni were first asked which concentration their curriculum followed. Two (20.0%) of the respondents were in the Entrepreneurship & Small Business Management curriculum, seven (70.0%) were in the General Management curriculum, and one (10.0%) indicated there were no concentrations when he/she attended. Next, students were asked how much they agree with various statement about the management program. Table 45 provides the frequencies and the means for those items.
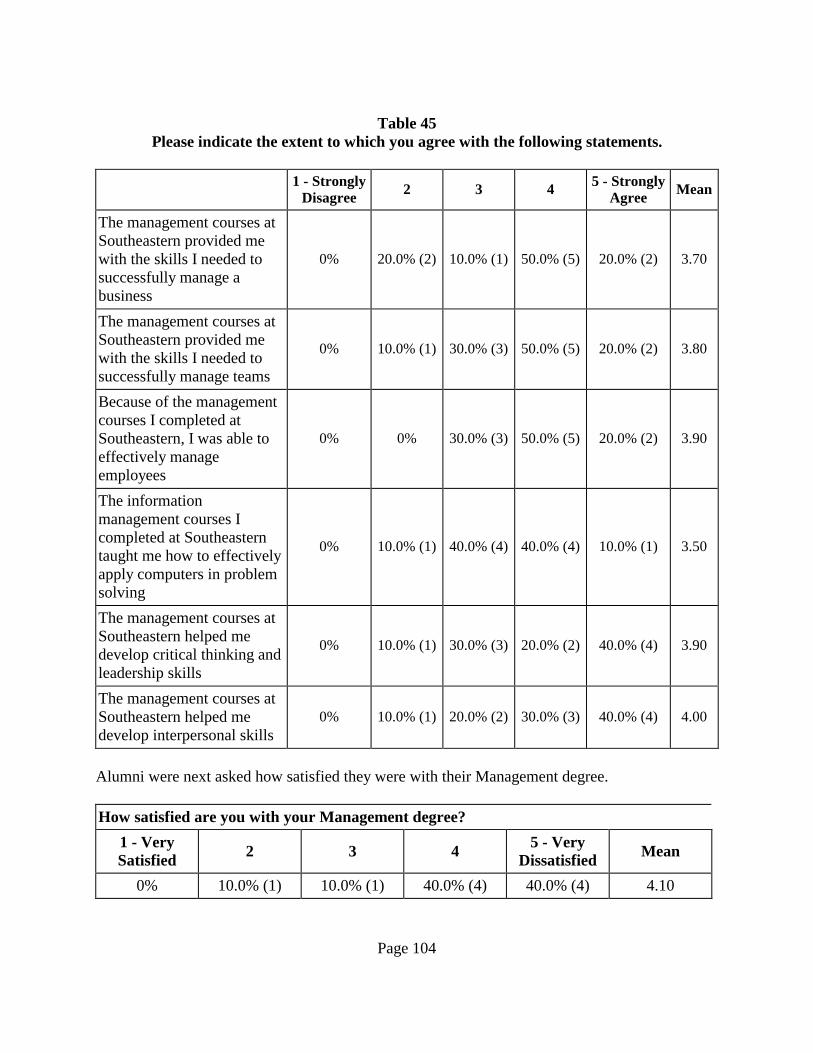
Page 104
Table 45 Please indicate the extent to which you agree with the following statements.
1 - Strongly
Disagree 2 3 4 5 - Strongly Agree Mean
The management courses at Southeastern provided me with the skills I needed to successfully manage a business
0% 20.0% (2) 10.0% (1) 50.0% (5) 20.0% (2) 3.70
The management courses at Southeastern provided me with the skills I needed to successfully manage teams
0% 10.0% (1) 30.0% (3) 50.0% (5) 20.0% (2) 3.80
Because of the management courses I completed at Southeastern, I was able to effectively manage employees
0% 0% 30.0% (3) 50.0% (5) 20.0% (2) 3.90
The information management courses I completed at Southeastern taught me how to effectively apply computers in problem solving
0% 10.0% (1) 40.0% (4) 40.0% (4) 10.0% (1) 3.50
The management courses at Southeastern helped me develop critical thinking and leadership skills
0% 10.0% (1) 30.0% (3) 20.0% (2) 40.0% (4) 3.90
The management courses at Southeastern helped me develop interpersonal skills
0% 10.0% (1) 20.0% (2) 30.0% (3) 40.0% (4) 4.00
Alumni were next asked how satisfied they were with their Management degree. How satisfied are you with your Management degree?
1 - Very Satisfied 2 3 4 5 - Very
Dissatisfied Mean
0% 10.0% (1) 10.0% (1) 40.0% (4) 40.0% (4) 4.10

Page 105
Next, alumni were asked about their preparation for the future as a result of their Management degree. In your opinion, how well prepared for the business world or an academic career are you as a result of majoring in Management at Southeastern?
1 - Very Satisfied 2 3 4 5 - Very
Dissatisfied Mean
0% 0% 30.0% (3) 30.0% (3) 40.0% (4) 4.10 Finally, respondents were asked what subjects areas they thought should be covered in more depth by Management electives. ! Human resources; loss prevention ! Computers; stock market; manage money ! More real-life problem/solution discussions; encourage a love of reading material; a look at
management of several different types/sizes of companies ! Computer/technical skills; MIS course should be more technical (applied) rather than theory ! Computers (applying to business); finance; stock market and investing; general money
management for business and personal situations; government and tax issues

Page 106
Department of Marketing and Finance
Table 46 Satisfaction with Degree Program
Number of Respondents: B.S. Finance - 10; B.A. Marketing - 14
Very Dissatisfied - 1
2
3
4
Very Satisfied - 5
Overall quality of your department B.S. Finance 0.0% 0.0% 0.0% 20.0%(2) 80.0%(8)B.A. Marketing 7.1%(1) 0.0% 14.3%(2) 28.6%(4) 50.0%(7)Overall quality of your degree program B.S. Finance 0.0% 0.0% 0.0% 30.0%(3) 70.0%(7)B.A. Marketing 7.1%(1) 0.0% 14.3%(2) 42.9%(6) 35.7%(5)Clarity of the degree requirements as outlined in the catalogue and/or curriculum sheets B.S. Finance 0.0% 0.0% 10.0%(1) 20.0%(2) 70.0%(7)B.A. Marketing 0.0% 7.1%(1) 21.4%(3) 28.6%(4) 42.9%(6)Usefulness of the academic advice you received from your advisor B.S. Finance 0.0% 0.0% 30.0%(3) 10.0%(1) 60.0%(6)B.A. Marketing 7.1%(1) 28.6%(4) 21.4%(3) 21.4%(3) 21.4%(3)Opportunities to interact with faculty outside of class B.S. Finance 0.0% 0.0% 0.0% 20.0%(2) 80.0%(8)B.A. Marketing 0.0% 0.0% 28.6%(4) 28.6%(4) 42.9%(6)Effectiveness of the faculty as teachers B.S. Finance 0.0% 0.0% 0.0% 30.0%(3) 70.0%(7)B.A. Marketing 0.0% 0.0% 7.1%(1) 50.0%(7) 42.9%(6)Friendliness and helpfulness of the office staff B.S. Finance 0.0% 0.0% 10.0%(1) 30.0%(3) 60.0%(6)B.A. Marketing 0.0% 0.0% 21.4%(3) 50.0%(7) 28.6%(4)Interest shown by faculty in your academic development B.S. Finance 0.0% 0.0% 20.0%(2) 30.0%(3) 50.0%(5)B.A. Marketing 7.1%(1) 0.0% 14.3%(2) 42.9%(6) 35.7%(5)Effectiveness of beginning courses in preparing you for advanced courses B.S. Finance 0.0% 0.0% 20.0%(2) 20.0%(2) 50.0%(5)B.A. Marketing 7.1%(1) 7.1%(1) 28.6%(4) 28.6%(4) 28.6%(4)
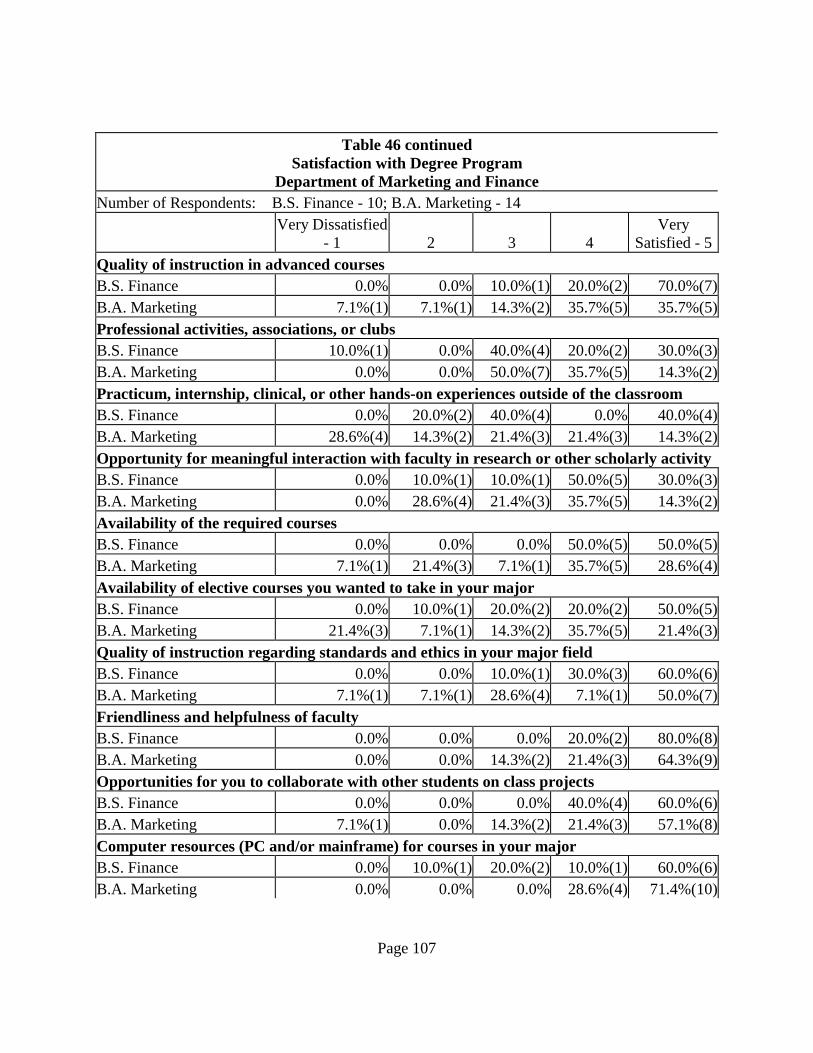
Page 107
Table 46 continued
Satisfaction with Degree Program Department of Marketing and Finance
Number of Respondents: B.S. Finance - 10; B.A. Marketing - 14
Very Dissatisfied - 1
2
3
4
Very Satisfied - 5
Quality of instruction in advanced courses B.S. Finance 0.0% 0.0% 10.0%(1) 20.0%(2) 70.0%(7)B.A. Marketing 7.1%(1) 7.1%(1) 14.3%(2) 35.7%(5) 35.7%(5)Professional activities, associations, or clubs B.S. Finance 10.0%(1) 0.0% 40.0%(4) 20.0%(2) 30.0%(3)B.A. Marketing 0.0% 0.0% 50.0%(7) 35.7%(5) 14.3%(2)Practicum, internship, clinical, or other hands-on experiences outside of the classroom B.S. Finance 0.0% 20.0%(2) 40.0%(4) 0.0% 40.0%(4)B.A. Marketing 28.6%(4) 14.3%(2) 21.4%(3) 21.4%(3) 14.3%(2)Opportunity for meaningful interaction with faculty in research or other scholarly activityB.S. Finance 0.0% 10.0%(1) 10.0%(1) 50.0%(5) 30.0%(3)B.A. Marketing 0.0% 28.6%(4) 21.4%(3) 35.7%(5) 14.3%(2)Availability of the required courses B.S. Finance 0.0% 0.0% 0.0% 50.0%(5) 50.0%(5)B.A. Marketing 7.1%(1) 21.4%(3) 7.1%(1) 35.7%(5) 28.6%(4)Availability of elective courses you wanted to take in your major B.S. Finance 0.0% 10.0%(1) 20.0%(2) 20.0%(2) 50.0%(5)B.A. Marketing 21.4%(3) 7.1%(1) 14.3%(2) 35.7%(5) 21.4%(3)Quality of instruction regarding standards and ethics in your major field B.S. Finance 0.0% 0.0% 10.0%(1) 30.0%(3) 60.0%(6)B.A. Marketing 7.1%(1) 7.1%(1) 28.6%(4) 7.1%(1) 50.0%(7)Friendliness and helpfulness of faculty B.S. Finance 0.0% 0.0% 0.0% 20.0%(2) 80.0%(8)B.A. Marketing 0.0% 0.0% 14.3%(2) 21.4%(3) 64.3%(9)Opportunities for you to collaborate with other students on class projects B.S. Finance 0.0% 0.0% 0.0% 40.0%(4) 60.0%(6)B.A. Marketing 7.1%(1) 0.0% 14.3%(2) 21.4%(3) 57.1%(8)Computer resources (PC and/or mainframe) for courses in your major B.S. Finance 0.0% 10.0%(1) 20.0%(2) 10.0%(1) 60.0%(6)B.A. Marketing 0.0% 0.0% 0.0% 28.6%(4) 71.4%(10)

Page 108
Table 46 continued
Satisfaction with Degree Program Department of Marketing and Finance
Number of Respondents: B.S. Finance - 10; B.A. Marketing - 14
Very Dissatisfied - 1
2
3
4
Very Satisfied - 5
Library resources related to your major B.S. Finance 0.0% 10.0%(1) 20.0%(2) 30.0%(3) 40.0%(4)B.A. Marketing 7.1%(1) 7.1%(1) 21.4%(3) 35.7%(5) 28.6%(4)Use of appropriate technology in the classroom B.S. Finance 0.0% 10.0%(1) 0.0% 40.0%(4) 50.0%(5)B.A. Marketing 0.0% 0.0% 28.6%(4) 14.3%(2) 57.1%(8)Facilities and equipment related to your major B.S. Finance 0.0% 0.0% 40.0%(4) 20.0%(2) 40.0%(4)B.A. Marketing 0.0% 0.0% 28.6%(4) 28.6%(4) 42.9%(6)Help/encouragement you received from faculty in your department with regard to further educational opportunities B.S. Finance 0.0% 10.0%(1) 0.0% 20.0%(2) 70.0%(7)B.A. Marketing 7.1%(1) 14.3%(2) 35.7%(5) 14.3%(2) 28.6%(4)The size of classes in your major B.S. Finance 0.0% 0.0% 0.0% 30.0%(3) 70.0%(7)B.A. Marketing 0.0% 0.0% 14.3%(2) 28.6%(4) 57.1%(8)Encouragement you received from faculty in your department with regard to finding employment in your field B.S. Finance 0.0% 30.0%(3) 20.0%(2) 0.0% 50.0%(5)B.A. Marketing 7.1%(1) 35.7%(5) 14.3%(2) 28.6%(4) 14.3%(2)Global perspectives presented in courses B.S. Finance 0.0% 10.0%(1) 10.0%(1) 30.0%(3) 50.0%(5)B.A. Marketing 0.0% 14.3%(2) 28.6%(4) 35.7%(5) 21.4%(3)Overall relevancy of courses B.S. Finance 0.0% 0.0% 20.0%(2) 20.0%(2) 60.0%(6)B.A. Marketing 7.1%(1) 0.0% 14.3%(2) 42.9%(6) 35.7%(5)

Page 109
Table 46 continued
Satisfaction with Degree Program Department of Marketing and Finance
No Yes 2. Would you recommend Southeastern to someone interested in what you majored in? B.S. Finance 10.0%(1) 90.0%(9) B.A. Marketing 7.1%(1) 92.9%(13) 3. If you had it to do over again, would you choose the same major? B.S. Finance 20.0%(2) 80.0%(8) B.A. Marketing 57.1%(8) 42.9%(6) 4. Did you participate in an internship, a practicum, a clinical experience, or student
teaching as part of your degree requirements? B.S. Finance 50.0%(5) 50.0%(5) B.A. Marketing 85.7%(12) 14.3%(2) 6. Should a hands-on course be required in your program? B.S. Finance 30.0%(3) 60.0%(6) B.A. Marketing 21.4%(3) 64.3%(9) When asked what benefits they received from hands-on experience, the Finance graduates had the following to say:
“NONE”
“Perspective about the correlation between what I was being taught and the real financial world.”
“I was already working in a bank, and my internship there, I learned many new responsibilities”
When asked what benefits they received from hands-on experience, the Marketing graduates had the following to say:
“Real world knowledge, how to be self-sufficient”
Perceptions of Southeastern B.S. Finance One of the Finance graduates (10.0%) had participated in the study-abroad/student exchange and was Very Satisfied with the experience. The majority (70.0%) of the respondents thought it would be a valuable experience. One (10.0%) of the respondents had participated in the honors

Page 110
program and was Very Satisfied with the experience. One (10.0%) of the respondents had participated in a research program and was Very Satisfied with the experience. B.S. Marketing None of the Marketing graduates had participated in the study-abroad/student exchange, but 78.6% (n=11) thought it would be a valuable experience. Three (21.4%) of the respondents had participated in the honors program and were Somewhat Satisfied with the experience. Three (21.4%) of the respondents had participated in a research program and were Somewhat Satisfied with the experience.
Graduate/Professional Education B.S. Finance One (10.0%) of the respondents is currently enrolled in a graduate/professional degree program, and two (20.0%) have completed a master’s degree. Three (30.0%) of the respondents plans to enroll in a degree program in the next 12 months, and four (40.0%) are likely to enroll in a degree program in the future. One (10.0%) of the respondents has earned the highest degree he/she plans on obtaining, seven (70.0%) plan on obtaining a master’s, and one (10.0%) plans on obtaining a doctorate. Of the three individuals with graduate school experience, two (66.7% ) indicated that Southeastern prepared them “Effectively” for further graduate/professional study. One (33.3%) of the respondents indicated that Southeastern prepared him/her “About the Same as Most” other students and one (33.3%) indicated he/she was prepared “Better than Most”. Of the three respondents who are enrolled in a degree program or have completed a degree, two (66.7%) indicated it was “Very Closely Related” to their bachelor’s degree from Southeastern. B. A. Marketing Two (14.3%) of the respondents are currently enrolled in a graduate/professional degree program and two (14.3%) of the respondents have taken classes, but have not enrolled in a degree program. Two (14.3%) are plan on enrolling in a degree program in the next twelve months and two (14.3%) are likely to enroll in the future. Five (35.7%) of the respondents have no plans for further education. Of the eight respondents with plans for graduate education, seven (87.5%) plan on obtaining a master’s and one (12.5%) plans on obtaining a second baccalaureate. Of the four respondents with graduate school experience, three (75%) indicated that Southeastern prepared them “Effectively” for further graduate/professional study. Two (50.0%) indicated that Southeastern prepared them “About the Same as Most” other students and one (25.0%) indicated that Southeastern prepared him/her “Better than Most”. Both of the respondents who are enrolled in a degree program indicated it is “Very Closely Related” to their bachelor’s degree from Southeastern.

Page 111
Employment
B.S. Finance Ninety percent of the respondents (90.0%, n=9) are employed full-time, with one (10.0%) not employed and not looking for employment. Six (60.0%) of the respondents had their job before completing their degree, one (10.0%) accepted a position upon graduation and two (20.0%) respondents obtained a job 1-6 months after graduation. The respondents who did not have job upon graduation indicated that “Limited to one geographic area”, “Tight job market”, “Lack of marketable skills”, and “Lack of experience” were major problems in finding employment. Minor problems included “Tight job market”, “Lack of educational qualifications”, “Reputation of Southeastern”, and “Lack of experience”. One of the respondents (10.0%) indicated his/her education was “Very Effective” in preparing her/him for employment or improving job performance, five (50.0%) indicated it was “Effective”, and one (10.0%) indicated it was “Ineffective”. Three (30.0%) of the respondents indicated that they are currently in their first full-time job since graduating from Southeastern and five (50.0%) are in their second full-time job. In regards to sources for learning about their first full-time job, one (10.0%) indicated from parents or relatives, one (10.0%) from Southeastern’s Career Development Services, two (20.0%) were recruited by the, and three (30.0%) from the Internet. Of the nine respondents who are currently employed full-time, six (66.7%) are employed in the state of Louisiana, and three (33.3%) are employed out of state. Two (22.2%) of the respondents are employed in a service organization, two (22.2%) are employed in a professional firm, one (11.1%) is employed in government, and four (44.4%) are employed in business. When asked “If underemployment is defined as a condition in which your job requires lower levels of skill and training than those you acquired in college, would you say that you are currently underemployed”, five (55.6%) of the respondents felt they are not underemployed while four (44.4%) felt they are underemployed. When asked about satisfaction with their present employment, three (33.3%) of the respondents are “Well satisfied; would not consider leaving”; five (55.6%) are “Satisfied, but would consider more desirable employment”; and one (11.1%) “Dislike[s] employment; seeking or will seek other employment”. Two (22.2%) of the respondents are currently employed in the area of their Southeastern major, three (33.3%) are employed in an area related to their Southeastern major, and four (44.4%) are employed in an area not related to their Southeastern major. One of the four (25.0%) found better pay outside the field, two (50.0%) could not find a job they wanted, and one (25.0%) would have to relocate for a job in the field. One (11.1%) of the respondents gave a salary range of $25,001-$30,000, six (66.7%) gave a salary range of $30,001-$40,000, and two (22.2%) indicated a salary of more than $50,000.

Page 112
B.A. Marketing One of the respondents did not complete the employment section of the survey, therefore, this section is based on thirteen respondents. All (100%) of the respondents are employed full-time. Three (21.4%) of the respondents had a full-time job before completing their degree, one (7.1%) accepted a position upon graduation, six (42.9%) respondents obtained a job 1-6 months after graduation and two (14.3%) took over a year to find employment. The seven respondents who did not have a job upon graduation faced a variety of problems in obtaining employment. Table 47 presents what were considered major problems, minor problems, or no problem.
Table 47 Please indicate whether each of the following was a major problem, minor problem, or not
a problem in obtaining employment after graduating from Southeastern with your Bachelors.
Major Problem Minor Problem Not A Problem Limited to only one geographic area 28.6% (2) 14.3% (1) 42.9% (3) Not knowing what I wanted to do 0.0% 57.1% (4) 28.6% (2) Tight job market 28.6% (2) 57.1% (4) 0.0% Lack of marketable skills 42.9% (3) 28.6% (2) 14.3% (1) Lack of educational qualifications 0.0% 14.3% (1) 71.4% (5) Reputation of Southeastern 14.3% (1) 0.0% 71.4% (5) Lack of experience 71.4% (5) 14.3% (1) 0.0% Lack of job search skills 0.0% 42.9% (3) 42.9% (3) Poor GPA 0.0% 14.3% (1) 71.4% (5) Racial discrimination 0.0% 0.0% 85.7% (6) Gender discrimination 0.0% 0.0% 85.7% (6) Age discrimination 0.0% 0.0% 85.7% (6) Eight of the respondents (61.5%) indicated their education was “Effective” in preparing them for employment or improving job performance and two (15.4%) indicated it was “Ineffective”. Three (23.1%) of the respondents indicated that they are currently in their first full-time job since graduating from Southeastern, six (46.2%) are in their second full-time job, and two (15.4%) have had three or more full-time jobs. In regards to sources for learning about their first full-time job, two (15.4%) indicated from a newspaper or trade publication and one (7.7%) from the Internet. Eleven (84.6%) of the respondents are employed in the state of Louisiana and two (15.4%) are employed out of state. Three (23.1%) of the respondents are employed in a service organization,

Page 113
one (7.7%) in K-12 education, one (7.7%) is employed in a professional firm, and eight (61.5%) are employed in business. When asked “If underemployment is defined as a condition in which your job requires lower levels of skill and training than those you acquired in college, would you say that you are currently underemployed”, six (46.2%) of the respondents felt they are not underemployed, while six (46.2%) felt they are. When asked about satisfaction with their present employment, four (30.8%) of the respondents are “Well satisfied; would not consider leaving”; eight (61.5%) are “Satisfied, but would consider more desirable employment”; and one (7.7%) “Dislike employment, seeking or will seek other employment”. Two (15.4%) of the respondents are currently employed in the area of their Southeastern major, seven (53.8%) are employed in an area related to their Southeastern major, and four (30.8%) are employed in an area not related to their Southeastern major. One (25.0%) of the four developed a new career interest and three (75.0%) couldn’t find a job they wanted in the field. One (7.7%) of the respondents gave a salary range of $15,001-$20,000, one (7.7%) gave a salary range of $20,001-$25,000, four (30.8%) gave a salary range of $25,001-$30,000, four (30.8%) gave a salary range of $30,001-$40,000, one (7.7%) gave a salary range of $40,001-$50,000, and two (15.4%) indicated a salary of more than $50,000.
Professional Activities B.S. Finance One (10.0%) of the respondents indicated certification/licensure is not available in his/her field, seven (70.0%) do not hold certification/licensure, and two (10.0%) have licensure/certification, one has JOYES 6, L&H, P &C and one has NASD Series 7 Insurance (L&H) License. None of those without certification/licensure plan on obtaining it within the next 12. One (10.0%) of the respondents is a member of a professional organization, and three (30.0%) have attended a professional meeting in the past year. B.A. Marketing Three (21.4%) of the respondents indicated certification/licensure is not available in their field, seven (50.0%) do not hold certification/licensure, and three (21.4%) currently hold licensure/certification. One is a Microsoft Certified systems engineer (MCSEN4.0), one has secondary education certification, and one has Series 7 and life and health. Of those without certification/licensure, one (14.3%) plans on obtaining MCSE Windows 2000 in the next twelve months. Six (42.9%) of the respondents are members of a professional organization, and six (42.9%) have attended a professional meeting in the past year.
Special Questions B.S. Finance

Page 114
All of the respondents completed the insert which contained the special questions. Alumni were first asked how much they thought some courses would increase their marketability. Table 48 provides the frequencies and the means for those courses.
Table 48 Please indicate the extent to which each would have increased your marketability in the
business world. 1 -
Definitely would not
have increased
2 3 4
5 - Definitely
would have increased
Mean
Property and Casualty Insurance 20.0% (2) 30.0% (3) 0% 20.0% (2) 30.0% (3) 3.10
Financial Planning 20.0% (2) 0% 0% 20.0% (2) 60.0% (6) 4.00 Options and Futures 10.0% (1) 10.0% (1) 20.0% (2) 20.0% (2) 40.0% (4) 3.70 Other courses which respondents indicated would definitely have increased their marketability include: ! Designations ASA/CFA/CPA, etc. ! Stocks and Fund Analysis ! Corporate Finance Alumni were next asked how important various skills were for a job/graduate education. Table 49 provides the frequencies and the means for these skills.

Page 115
Table 49 For each skill listed below, please indicate how important you believe it is for a
job/graduate education. 1 -
Definitely not
important
2 3 4 5 -
Definitely important
Mean
Spreadsheet skills 0% 0% 0% 10.0% (1) 90.0% (9) 4.90 Critical thinking skills 0% 0% 10.0% (1) 10.0% (1) 80.0% (8) 4.70 Teamwork skills 0% 0% 0% 20.0% (2) 80.0% (8) 4.80 Written communication skills 0% 0% 0% 10.0% (1) 90.0% (9) 4.90
Oral communication skills 0% 0% 0% 0% 100% (10) 5.00 Interpersonal skills 0% 0% 0% 10.0% (1) 90.0% (9) 4.90 Research skills 0% 0% 10.0% (1) 30.0% (3) 60.0% (6) 4.50 Accounting skills 0% 0% 20.0% (2) 10.0% (1) 70.0% (7) 4.50 Internship program 0% 0% 30.0% (3) 20.0% (2) 50.0% (5) 4.20 Finally, respondents were asked how interested they would have been in getting a concentration in four areas. Table 50 provides the frequencies and the means for each of the areas.
Table 50 How interested would you have been in getting a concentration in the following areas if
they had been available? 1 -
Definitely not
interested
2 3 4 5 -
Definitely interested
Mean
Financial Planning 20.0% (2) 10.0% (1) 10.0% (1) 20.0% (2) 40.0% (4) 3.50 Corporate Finance 0% 0% 0% 20.0% (2) 80.0% (8) 4.80 Financial Institutions 0% 0% 20.0% (2) 20.0% (2) 60.0% (6) 4.40 Investments 0% 10.0% (1) 20.0% (2) 20.0% (2) 50.0% (5) 4.10 In addition, respondents indicated they would have definitely been interested in the following concentrations: ! Investment Banking - IPO/Mergers & Acquisition
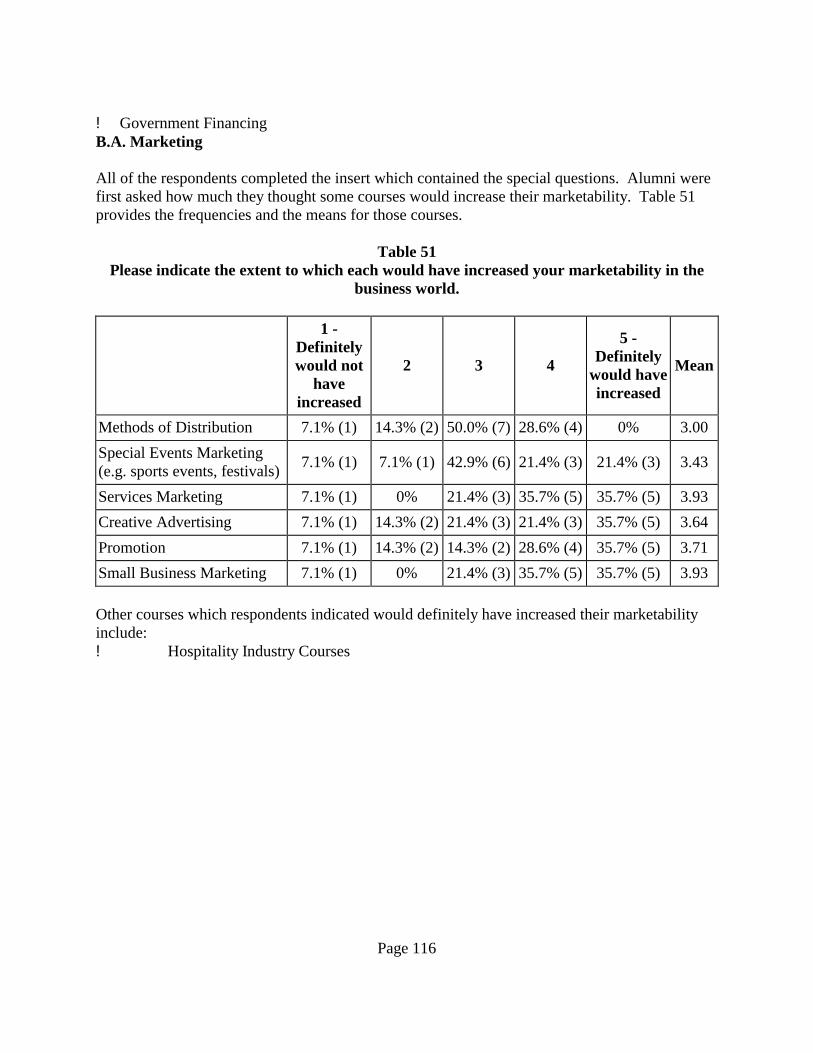
Page 116
! Government Financing B.A. Marketing All of the respondents completed the insert which contained the special questions. Alumni were first asked how much they thought some courses would increase their marketability. Table 51 provides the frequencies and the means for those courses.
Table 51 Please indicate the extent to which each would have increased your marketability in the
business world. 1 -
Definitely would not
have increased
2 3 4
5 - Definitely
would have increased
Mean
Methods of Distribution 7.1% (1) 14.3% (2) 50.0% (7) 28.6% (4) 0% 3.00 Special Events Marketing (e.g. sports events, festivals) 7.1% (1) 7.1% (1) 42.9% (6) 21.4% (3) 21.4% (3) 3.43
Services Marketing 7.1% (1) 0% 21.4% (3) 35.7% (5) 35.7% (5) 3.93 Creative Advertising 7.1% (1) 14.3% (2) 21.4% (3) 21.4% (3) 35.7% (5) 3.64 Promotion 7.1% (1) 14.3% (2) 14.3% (2) 28.6% (4) 35.7% (5) 3.71 Small Business Marketing 7.1% (1) 0% 21.4% (3) 35.7% (5) 35.7% (5) 3.93 Other courses which respondents indicated would definitely have increased their marketability include: ! Hospitality Industry Courses

Page 117
Alumni were next asked how important various skills were for a job/graduate education. Table 52 provides the frequencies and the means for these skills.
Table 52 For each skill listed below, please indicate how important you believe it is for a
job/graduate education. 1 -
Definitely not
important
2 3 4 5 -
Definitely important
Mean
Computer software skills (e.g. desktop publishing, web design, spreadsheets)
0% 0% 7.1% (1) 14.3% (2) 78.6% (11) 4.71
Critical thinking skills 0% 7.1% (1) 14.3% (2) 42.9% (6) 35.7% (5) 4.07 Teamwork skills 0% 7.1% (1) 7.1% (1) 28.6% (4) 57.1% (8) 4.36 Written communication skills 0% 0% 7.1% (1) 21.4% (3) 71.4% (10) 4.64
Oral communication skills 0% 0% 0% 14.3% (2) 85.7% (12) 4.86 Interpersonal skills 0% 0% 7.1% (1) 14.3% (2) 78.6% (11) 4.71 Research skills 7.1% (1) 14.3% (2) 28.6% (4) 14.3% (2) 35.7% (5) 3.57 Global environmental factors 21.4% (3) 21.4% (3) 14.3% (2) 14.3% (2) 28.6% (4) 3.07

Page 118
Department of Human Development
Table 53 Satisfaction with Degree Program
Number of Respondents: B.S. Family Consumer Sciences - 3; B.A. Social Work - 24
Very Dissatisfied - 1
2
3
4
Very Satisfied - 5
Overall quality of your department B.S. Family Consumer Sciences 0.0% 33.3%(1) 33.3%(1) 33.3% (1) 0.0%
B.A. Social Work 0.0% 0.0% 16.7%(4) 54.2%(13) 29.2%(7)Overall quality of your degree program B.S. Family Consumer Sciences 33.3%(1) 0.0% 33.3%(1) 33.3%(1) 0.0%
B.A. Social Work 0.0% 0.0% 4.2%(1) 58.3%(14) 37.5%(9)Clarity of the degree requirements as outlined in the catalogue and/or curriculum sheets B.S. Family Consumer Sciences 0.0% 33.3%(1) 33.3%(1) 0.0% 33.3%(1)
B.A. Social Work 0.0% 4.2%(1) 12.5%(3) 41.7%(10) 41.7%(10)Usefulness of the academic advice you received from your advisor B.S. Family Consumer Sciences 0.0% 33.3%(1) 33.3%(1) 0.0% 33.3%(1)
B.A. Social Work 8.3%(2) 8.3%(2) 25.0%(6) 37.5%(9) 20.8%(5)Opportunities to interact with faculty outside of class B.S. Family Consumer Sciences 0.0% 0.0% 0.0% 100.0%(3) 0.0%
B.A. Social Work 0.0% 4.2%(1) 33.3%(8) 37.5%(9) 25.0%(6)Effectiveness of the faculty as teachers B.S. Family Consumer Sciences 0.0% 33.3%(1) 0.0% 33.3%(1) 33.3%(1)
B.A. Social Work 0.0% 0.0% 16.7%(4) 62.5%(15) 20.8%(5)Friendliness and helpfulness of the office staff B.S. Family Consumer Sciences 0.0% 0.0% 33.3%(1) 33.3%(1) 33.3%(1)
B.A. Social Work 0.0% 0.0% 20.8%(5) 29.2%(7) 50.0%(12)
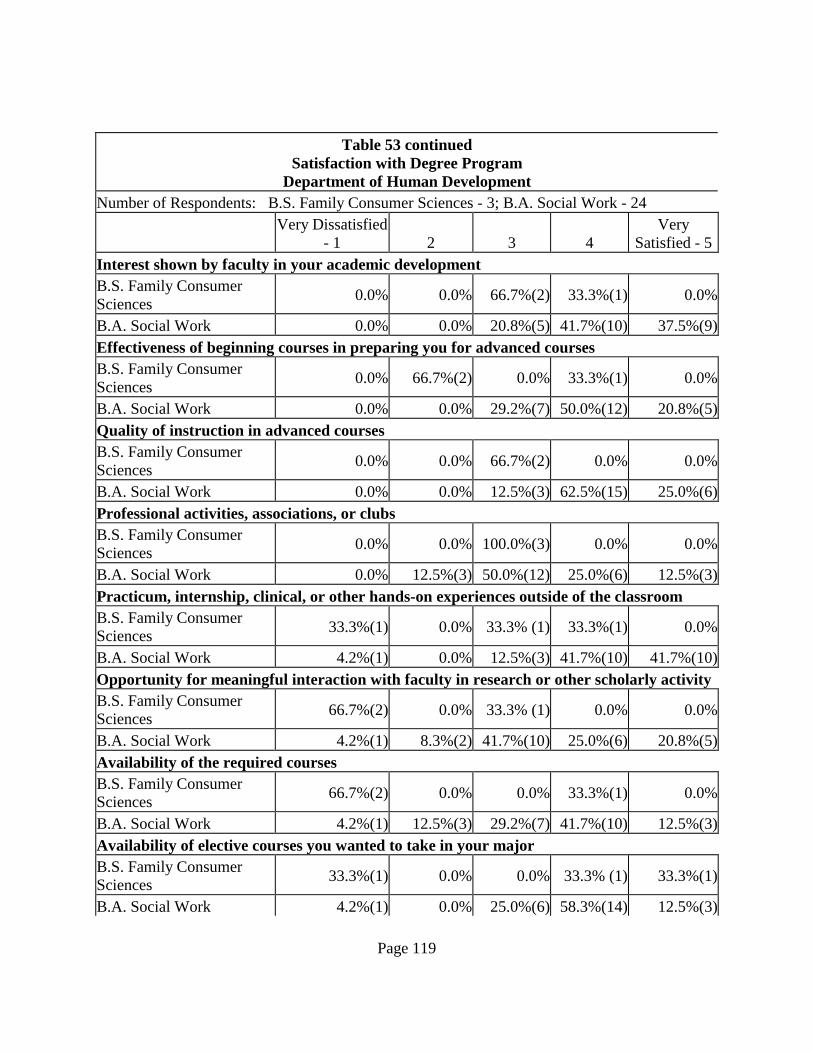
Page 119
Table 53 continued
Satisfaction with Degree Program Department of Human Development
Number of Respondents: B.S. Family Consumer Sciences - 3; B.A. Social Work - 24
Very Dissatisfied - 1
2
3
4
Very Satisfied - 5
Interest shown by faculty in your academic development B.S. Family Consumer Sciences 0.0% 0.0% 66.7%(2) 33.3%(1) 0.0%
B.A. Social Work 0.0% 0.0% 20.8%(5) 41.7%(10) 37.5%(9)Effectiveness of beginning courses in preparing you for advanced courses B.S. Family Consumer Sciences 0.0% 66.7%(2) 0.0% 33.3%(1) 0.0%
B.A. Social Work 0.0% 0.0% 29.2%(7) 50.0%(12) 20.8%(5)Quality of instruction in advanced courses B.S. Family Consumer Sciences 0.0% 0.0% 66.7%(2) 0.0% 0.0%
B.A. Social Work 0.0% 0.0% 12.5%(3) 62.5%(15) 25.0%(6)Professional activities, associations, or clubs B.S. Family Consumer Sciences 0.0% 0.0% 100.0%(3) 0.0% 0.0%
B.A. Social Work 0.0% 12.5%(3) 50.0%(12) 25.0%(6) 12.5%(3)Practicum, internship, clinical, or other hands-on experiences outside of the classroom B.S. Family Consumer Sciences 33.3%(1) 0.0% 33.3% (1) 33.3%(1) 0.0%
B.A. Social Work 4.2%(1) 0.0% 12.5%(3) 41.7%(10) 41.7%(10)Opportunity for meaningful interaction with faculty in research or other scholarly activityB.S. Family Consumer Sciences 66.7%(2) 0.0% 33.3% (1) 0.0% 0.0%
B.A. Social Work 4.2%(1) 8.3%(2) 41.7%(10) 25.0%(6) 20.8%(5)Availability of the required courses B.S. Family Consumer Sciences 66.7%(2) 0.0% 0.0% 33.3%(1) 0.0%
B.A. Social Work 4.2%(1) 12.5%(3) 29.2%(7) 41.7%(10) 12.5%(3)Availability of elective courses you wanted to take in your major B.S. Family Consumer Sciences 33.3%(1) 0.0% 0.0% 33.3% (1) 33.3%(1)
B.A. Social Work 4.2%(1) 0.0% 25.0%(6) 58.3%(14) 12.5%(3)

Page 120
Table 53 continued Satisfaction with Degree Program
Department of Human Development Number of Respondents: B.S. Family Consumer Sciences - 3; B.A. Social Work - 24
Very Dissatisfied - 1
2
3
4
Very Satisfied - 5
Quality of instruction regarding standards and ethics in your major field B.S. Family Consumer Sciences 0.0% 0.0% 66.7%(2) 33.3%(1) 0.0%
B.A. Social Work 0.0% 0.0% 12.5%(3) 50.0%(12) 37.5%(9)Friendliness and helpfulness of faculty B.S. Family Consumer Sciences 0.0% 0.0% 33.3%(1) 66.7%(2) 0.0%
B.A. Social Work 0.0% 0.0% 8.3%(2) 45.8%(11) 45.8%(11)Opportunities for you to collaborate with other students on class projects B.S. Family Consumer Sciences 0.0% 0.0% 33.3%(1) 66.7%(2) 0.0%
B.A. Social Work 0.0% 4.2%(1) 16.7%(4) 54.2%(13) 25.0%(6)Computer resources (PC and/or mainframe) for courses in your major B.S. Family Consumer Sciences 33.3%(1) 33.3%(1) 33.3% (1) 0.0% 0.0%
B.A. Social Work 4.2%(1) 4.2%(1) 41.7%(10) 41.7%(10) 8.3%(2)Library resources related to your major B.S. Family Consumer Sciences 33.3%(1) 0.0% 33.3% (1) 33.3%(1) 0.0%
B.A. Social Work 4.2%(1) 12.5%(3) 33.3%(8) 33.3%(8) 16.7%(4)Use of appropriate technology in the classroom B.S. Family Consumer Sciences 33.3%(1) 33.3%(1) 33.3%(1) 0.0% 0.0%
B.A. Social Work 8.3%(2) 4.2%(1) 45.8%(11) 25.0%(6) 12.5%(3)Facilities and equipment related to your major B.S. Family Consumer Sciences 33.3%(1) 33.3%(1) 0.0% 33.3%(1) 0.0%
B.A. Social Work 4.2%(1) 4.2%(1) 58.3%(14) 25.0%(6) 8.3%(2)
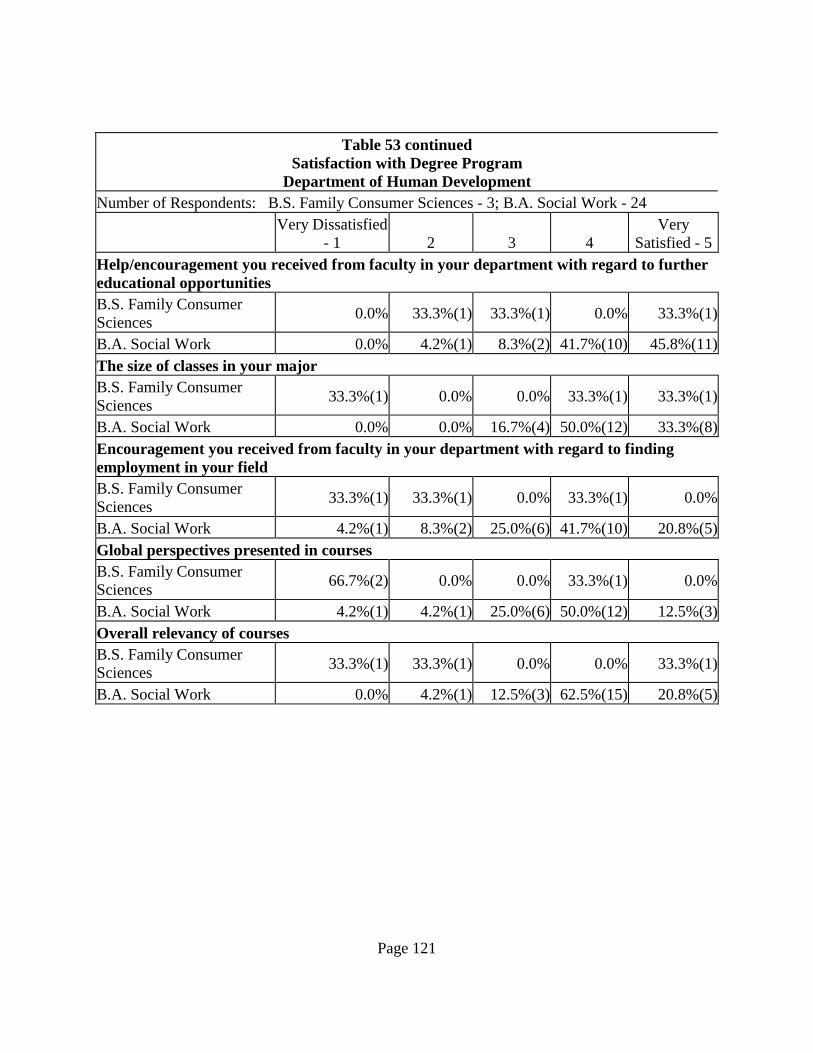
Page 121
Table 53 continued
Satisfaction with Degree Program Department of Human Development
Number of Respondents: B.S. Family Consumer Sciences - 3; B.A. Social Work - 24
Very Dissatisfied - 1
2
3
4
Very Satisfied - 5
Help/encouragement you received from faculty in your department with regard to further educational opportunities B.S. Family Consumer Sciences 0.0% 33.3%(1) 33.3%(1) 0.0% 33.3%(1)
B.A. Social Work 0.0% 4.2%(1) 8.3%(2) 41.7%(10) 45.8%(11)The size of classes in your major B.S. Family Consumer Sciences 33.3%(1) 0.0% 0.0% 33.3%(1) 33.3%(1)
B.A. Social Work 0.0% 0.0% 16.7%(4) 50.0%(12) 33.3%(8)Encouragement you received from faculty in your department with regard to finding employment in your field B.S. Family Consumer Sciences 33.3%(1) 33.3%(1) 0.0% 33.3%(1) 0.0%
B.A. Social Work 4.2%(1) 8.3%(2) 25.0%(6) 41.7%(10) 20.8%(5)Global perspectives presented in courses B.S. Family Consumer Sciences 66.7%(2) 0.0% 0.0% 33.3%(1) 0.0%
B.A. Social Work 4.2%(1) 4.2%(1) 25.0%(6) 50.0%(12) 12.5%(3)Overall relevancy of courses B.S. Family Consumer Sciences 33.3%(1) 33.3%(1) 0.0% 0.0% 33.3%(1)
B.A. Social Work 0.0% 4.2%(1) 12.5%(3) 62.5%(15) 20.8%(5)

Page 122
Table 53 continued
Satisfaction with Degree Program Department of Human Development
Number of Respondents: B.S. Family Consumer Sciences - 6; B.A. Social Work - 22 No Yes 2. Would you recommend Southeastern to someone interested in what you majored in? B.S. Family Consumer Sciences 66.7%(2) 33.3%(1) B.A. Social Work 0.0% 95.8%(23) 3. If you had it to do over again, would you choose the same major?
B.S. Family Consumer Sciences 33.3%(1) 33.3%(1);33.3%(1) Not at Southeastern
B.A. Social Work 37.5%(9) 54.2%(13); 4.2%(1) Not at Southeastern
4. Did you participate in an internship, a practicum, a clinical experience, or student teaching as part of your degree requirements?
B.S. Family Consumer Sciences 0.0% 100.0% (3) B.A. Social Work 0.0% 100.0% (24) 6. Should a hands-on course be required in your program? B.S. Family Consumer Sciences 0.0% 100.0% (3) B.A. Social Work 4.2%(1) 91.7%(22) When asked what benefits they received from hands-on experience, the Family Consumer Sciences graduates had the following to say:
“Not much, it really wasn't connected.”
“Saw what the "real world" would be like; more understanding of career; excellent opportunity to work with other professionals”
“Hands on experience was needed, but was not accurate nor updated to the upcoming careers and internship that was a part of the program. New innovative ideas were a part of curriculum, but society and the real world do not participate in innovation.”
When asked what benefits they received from hands-on experience, Social Work graduates had the following to say:
“Real life experience.”
“How to interact with people. Helped me apply what I learned!”
“Only moderate benefits. I feel there should be longer internships.”

Page 123
“Prior work in the field” “The opportunity to work with professionals in the field. It was also beneficial for employment opportunities.”
“Supervisory skills; problem solving, etc. Just being in the midst of the crisis.”
“I learned a great deal at my internship. It was a reality check for me.”
“Beneficial experience.”
“My internship was most beneficial; both administrative observance and the one-On-one direct service.”
“A better understanding of duties and expectations of my major in the workplace.”
“Putting theory into practice.”
“the benefits of putting the knowledge I had obtained from the classroom into use. The benefit of gaining a deeper understanding.”
“This agency I was with needed great improvements.”
“Experience in case management”
“Employment after internship; Learned more in one semester of internship than entire classroom experience”
“I learned more from this than I ever learned in a book. It was only 1 semester. Should have been 2.”
“Real life experience.”
Perceptions of Southeastern
B.S. Family Consumer Science None of the Family Consumer Science graduates participated in the study-abroad/student exchange, but all thought it would be a valuable experience. None of the respondents participated in the honors program or a research program.

Page 124
B.A. Social Work None of the Social Work graduates participated in the study-abroad/student exchange, but all thought it would be a valuable experience. Four (16.7%) of the respondents participated in the honors program, three (75%) were Very Satisfied with the experience and one (25.0%) was Somewhat Satisfied with the experience. Fifteen (62.5%) of the respondents participated in a research program, 53.3% (n=8) were Very Satisfied with the experience, 33.3% (n=5) were Somewhat Satisfied, and 13.3% (n=2) were Somewhat Dissatisfied.
Graduate/Professional Education B.S. Family Consumer Sciences Two (66.7%) of the respondents are currently enrolled in graduate program and one (33.3%) has completed a master’s degree, and it is the highest degree the respondent plans on obtaining. One of the other respondents plans on obtaining a second baccalaureate and one plans on obtaining some “Other” degree. Only one respondent answered the remaining questions about graduate education. That respondent indicated he/she was prepared “Effectively” for graduate school, and was prepared “Better than Most” other students. The respondent indicated she/he obtained a degree “Very Closely Related” to her/his bachelor’s degree. B.A. Social Work Three (12.5%) of the respondents are currently enrolled in a graduate/professional degree program, and twelve (50.0%) have completed a master’s degree. Two (8.3%) of the respondents have taken classes but not enrolled in a degree program. Two (8.3%) of the respondents plan to enroll in a degree program in the next 12 months, and four (16.7%) respondents are likely to enroll in a degree program in the future. One (4.2%) respondent has no plans for further education. Of those respondents who have plans for further education, five (21.7%) already have the highest degree they plan on obtaining, eight (34.8%) plan on obtaining a master’s, nine (39.1%) plan on obtaining a doctorate, and one (4.3%) plans on obtaining a second baccalaureate. Of the eleven respondents who are enrolled in a degree program or had completed a degree, six (35.3%) indicated that their educational experiences at Southeastern prepared them “Very Effectively” for further graduate/professional study, six (35.3%) indicated that Southeastern prepared them “Effectively”, one (5.9%) indicate he/she was “Ineffectively” prepared, and two (11.8%) indicated they were “Very Ineffectively” prepared. Seven (41.2%) indicated that Southeastern prepared them “Better than Most” other students, seven (41.2%) indicated that Southeastern prepared them “About the Same as Most”, and one (5.9%) indicated she/he was prepared “Worse than Most” other students. Eleven (73.3%) respondent indicated their degree

Page 125
program was “Very Closely Related” to their bachelor’s degree from Southeastern and one (6.7%) indicated it was “Somewhat Related”.
Employment B.S. Family Consumer Sciences One of the respondents (33.3%) is currently employed full-time and two (66.7%) are not employed but seeking employment. One (33.3%) respondent obtained a full-time job upon graduation, one (33.3%) obtained one 1-6 months after graduation, and one (33.3%) has not had a full-time position since graduating from Southeastern, but has looked for one. The two respondents who did not have a job upon graduation indicated that “Tight job market”, “Lack of educational qualifications”, “Lack of job search skills”, “Racial discrimination”, “Gender discrimination”, and “Age discrimination” were major problems in obtaining employment. Minor problems included “Poor GPA” and “Reputation of Southeastern”. One of the respondents who has had full-time employment (50.0%) indicated his/her education was “Effective” in preparing her/him for employment or improving job performance and one (50.0%) indicated it was “Ineffective”. One (50.0%) of the respondents indicated that she/he is currently in her/his first full-time job since graduating from Southeastern and one (50.0%) has had three or more full-time jobs. In regards to sources for learning about their first full-time job, one (50.0%) indicated from a newspaper/trade publication and one (50.0%) was recruited by the employer. The respondent who is currently employed full-time works in a service organization in the state of Louisiana. When asked “If underemployment is defined as a condition in which your job requires lower levels of skill and training than those you acquired in college, would you say that you are currently underemployed”, the respondent indicated she/he is not underemployed. The respondent is “Satisfied, but would consider more desirable employment”. The respondent is employed in an area related to his/her Southeastern major, and indicated an annual salary of less than $10,000. B.A. Social Work Seventeen (70.8%) of the respondents are employed full-time, one respondent (4.2%) is a graduate assistant, two respondents (8.3%) are employed part-time and satisfied, three (12.5%) are unemployed but looking for employment, and one (4.2%) is not employed and not looking for employment. Four (16.7%) of the respondents had their jobs before completing their degrees, two (8.3%) obtained their job upon graduation, ten (41.7%) respondents obtained a job 1-6 months after graduation, one (4.2%) found a job 7-12 months after graduation, one (4.2%) took over a year to find a job, one (4.2%) has never had a full-time job since graduating even though he/she has looked, and three (12.5%) have not looked for full-time employment.
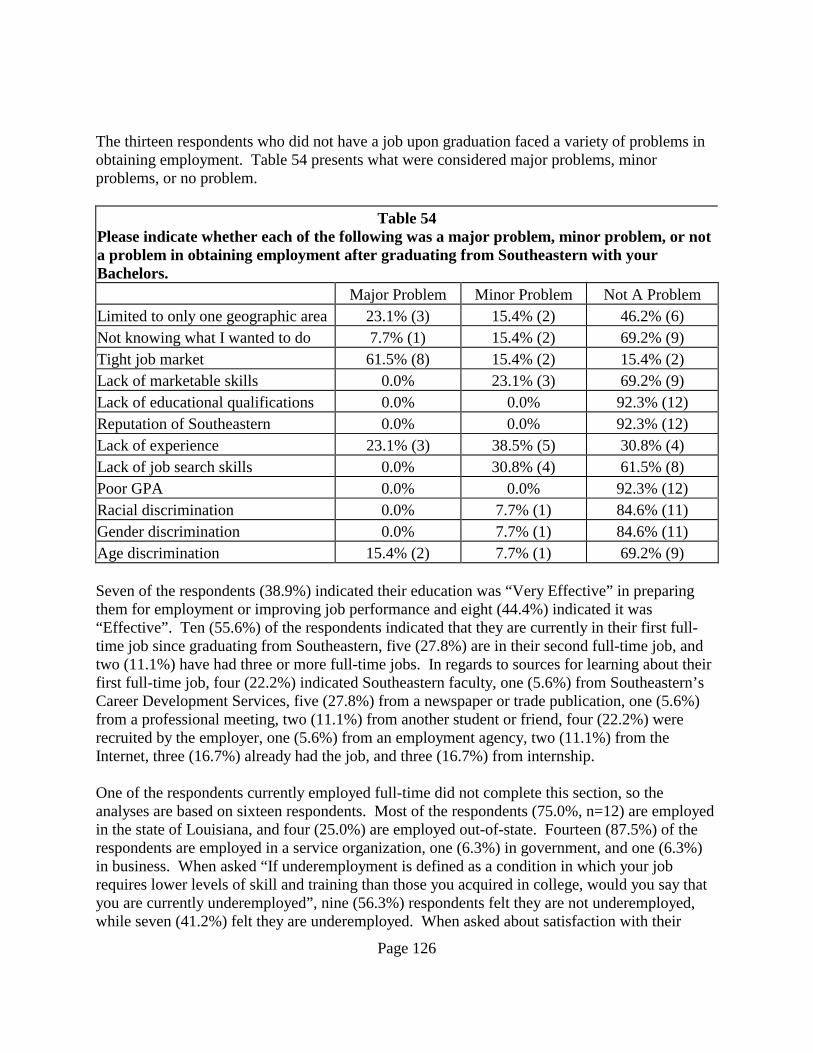
Page 126
The thirteen respondents who did not have a job upon graduation faced a variety of problems in obtaining employment. Table 54 presents what were considered major problems, minor problems, or no problem.
Table 54 Please indicate whether each of the following was a major problem, minor problem, or not a problem in obtaining employment after graduating from Southeastern with your Bachelors. Major Problem Minor Problem Not A Problem Limited to only one geographic area 23.1% (3) 15.4% (2) 46.2% (6) Not knowing what I wanted to do 7.7% (1) 15.4% (2) 69.2% (9) Tight job market 61.5% (8) 15.4% (2) 15.4% (2) Lack of marketable skills 0.0% 23.1% (3) 69.2% (9) Lack of educational qualifications 0.0% 0.0% 92.3% (12) Reputation of Southeastern 0.0% 0.0% 92.3% (12) Lack of experience 23.1% (3) 38.5% (5) 30.8% (4) Lack of job search skills 0.0% 30.8% (4) 61.5% (8) Poor GPA 0.0% 0.0% 92.3% (12) Racial discrimination 0.0% 7.7% (1) 84.6% (11) Gender discrimination 0.0% 7.7% (1) 84.6% (11) Age discrimination 15.4% (2) 7.7% (1) 69.2% (9) Seven of the respondents (38.9%) indicated their education was “Very Effective” in preparing them for employment or improving job performance and eight (44.4%) indicated it was “Effective”. Ten (55.6%) of the respondents indicated that they are currently in their first full-time job since graduating from Southeastern, five (27.8%) are in their second full-time job, and two (11.1%) have had three or more full-time jobs. In regards to sources for learning about their first full-time job, four (22.2%) indicated Southeastern faculty, one (5.6%) from Southeastern’s Career Development Services, five (27.8%) from a newspaper or trade publication, one (5.6%) from a professional meeting, two (11.1%) from another student or friend, four (22.2%) were recruited by the employer, one (5.6%) from an employment agency, two (11.1%) from the Internet, three (16.7%) already had the job, and three (16.7%) from internship. One of the respondents currently employed full-time did not complete this section, so the analyses are based on sixteen respondents. Most of the respondents (75.0%, n=12) are employed in the state of Louisiana, and four (25.0%) are employed out-of-state. Fourteen (87.5%) of the respondents are employed in a service organization, one (6.3%) in government, and one (6.3%) in business. When asked “If underemployment is defined as a condition in which your job requires lower levels of skill and training than those you acquired in college, would you say that you are currently underemployed”, nine (56.3%) respondents felt they are not underemployed, while seven (41.2%) felt they are underemployed. When asked about satisfaction with their
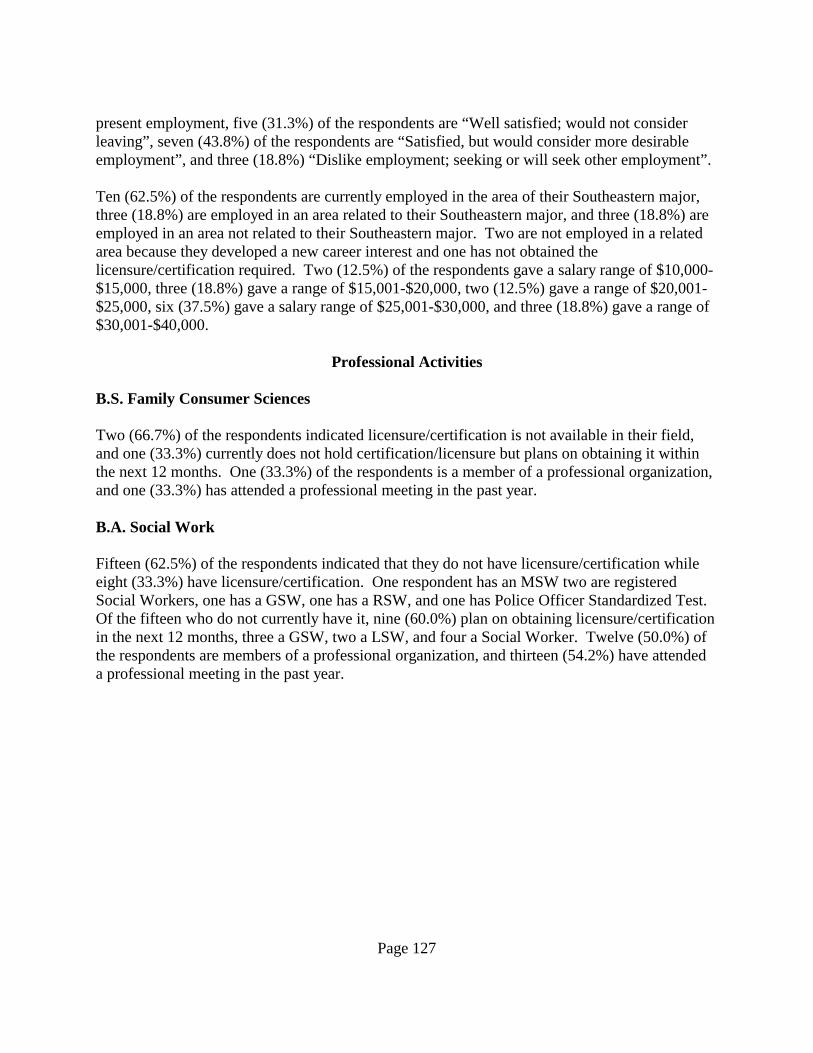
Page 127
present employment, five (31.3%) of the respondents are “Well satisfied; would not consider leaving”, seven (43.8%) of the respondents are “Satisfied, but would consider more desirable employment”, and three (18.8%) “Dislike employment; seeking or will seek other employment”. Ten (62.5%) of the respondents are currently employed in the area of their Southeastern major, three (18.8%) are employed in an area related to their Southeastern major, and three (18.8%) are employed in an area not related to their Southeastern major. Two are not employed in a related area because they developed a new career interest and one has not obtained the licensure/certification required. Two (12.5%) of the respondents gave a salary range of $10,000-$15,000, three (18.8%) gave a range of $15,001-$20,000, two (12.5%) gave a range of $20,001-$25,000, six (37.5%) gave a salary range of $25,001-$30,000, and three (18.8%) gave a range of $30,001-$40,000.
Professional Activities B.S. Family Consumer Sciences Two (66.7%) of the respondents indicated licensure/certification is not available in their field, and one (33.3%) currently does not hold certification/licensure but plans on obtaining it within the next 12 months. One (33.3%) of the respondents is a member of a professional organization, and one (33.3%) has attended a professional meeting in the past year. B.A. Social Work Fifteen (62.5%) of the respondents indicated that they do not have licensure/certification while eight (33.3%) have licensure/certification. One respondent has an MSW two are registered Social Workers, one has a GSW, one has a RSW, and one has Police Officer Standardized Test. Of the fifteen who do not currently have it, nine (60.0%) plan on obtaining licensure/certification in the next 12 months, three a GSW, two a LSW, and four a Social Worker. Twelve (50.0%) of the respondents are members of a professional organization, and thirteen (54.2%) have attended a professional meeting in the past year.
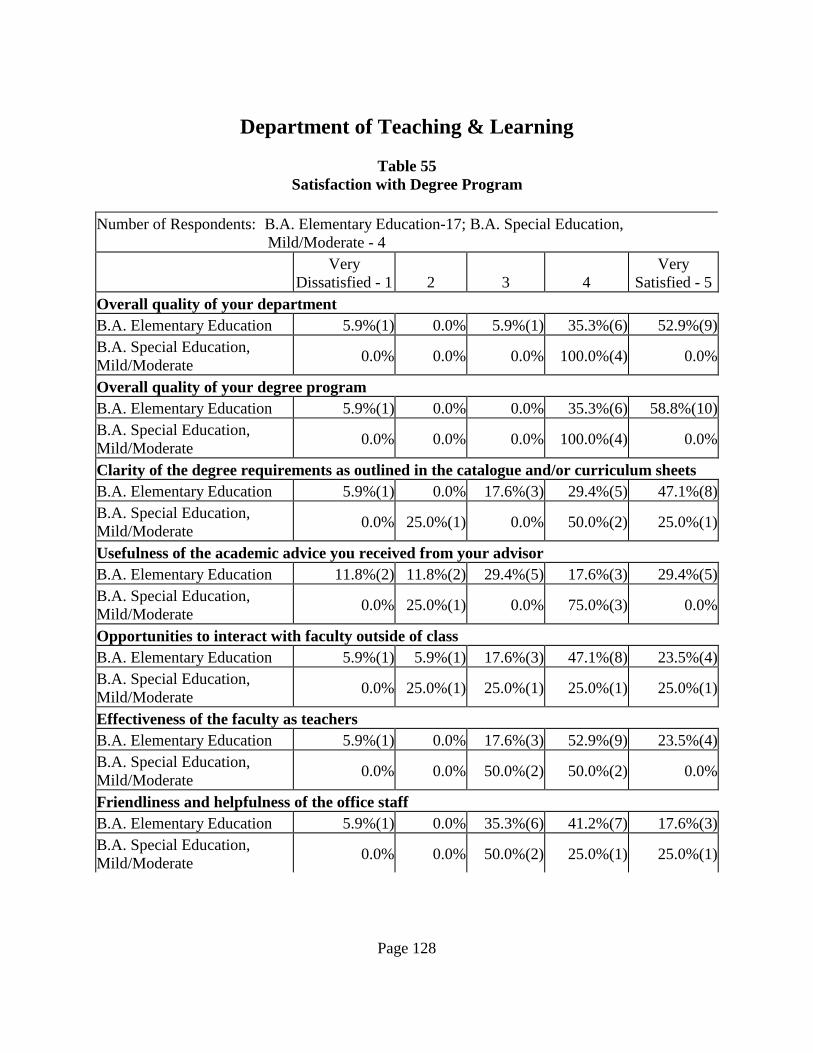
Page 128
Department of Teaching & Learning
Table 55 Satisfaction with Degree Program
Number of Respondents: B.A. Elementary Education-17; B.A. Special Education,
Mild/Moderate - 4
Very Dissatisfied - 1
2
3
4
Very Satisfied - 5
Overall quality of your department B.A. Elementary Education 5.9%(1) 0.0% 5.9%(1) 35.3%(6) 52.9%(9)B.A. Special Education, Mild/Moderate 0.0% 0.0% 0.0% 100.0%(4) 0.0%
Overall quality of your degree program B.A. Elementary Education 5.9%(1) 0.0% 0.0% 35.3%(6) 58.8%(10)B.A. Special Education, Mild/Moderate 0.0% 0.0% 0.0% 100.0%(4) 0.0%
Clarity of the degree requirements as outlined in the catalogue and/or curriculum sheets B.A. Elementary Education 5.9%(1) 0.0% 17.6%(3) 29.4%(5) 47.1%(8)B.A. Special Education, Mild/Moderate 0.0% 25.0%(1) 0.0% 50.0%(2) 25.0%(1)
Usefulness of the academic advice you received from your advisor B.A. Elementary Education 11.8%(2) 11.8%(2) 29.4%(5) 17.6%(3) 29.4%(5)B.A. Special Education, Mild/Moderate 0.0% 25.0%(1) 0.0% 75.0%(3) 0.0%
Opportunities to interact with faculty outside of class B.A. Elementary Education 5.9%(1) 5.9%(1) 17.6%(3) 47.1%(8) 23.5%(4)B.A. Special Education, Mild/Moderate 0.0% 25.0%(1) 25.0%(1) 25.0%(1) 25.0%(1)
Effectiveness of the faculty as teachers B.A. Elementary Education 5.9%(1) 0.0% 17.6%(3) 52.9%(9) 23.5%(4)B.A. Special Education, Mild/Moderate 0.0% 0.0% 50.0%(2) 50.0%(2) 0.0%
Friendliness and helpfulness of the office staff B.A. Elementary Education 5.9%(1) 0.0% 35.3%(6) 41.2%(7) 17.6%(3)B.A. Special Education, Mild/Moderate 0.0% 0.0% 50.0%(2) 25.0%(1) 25.0%(1)
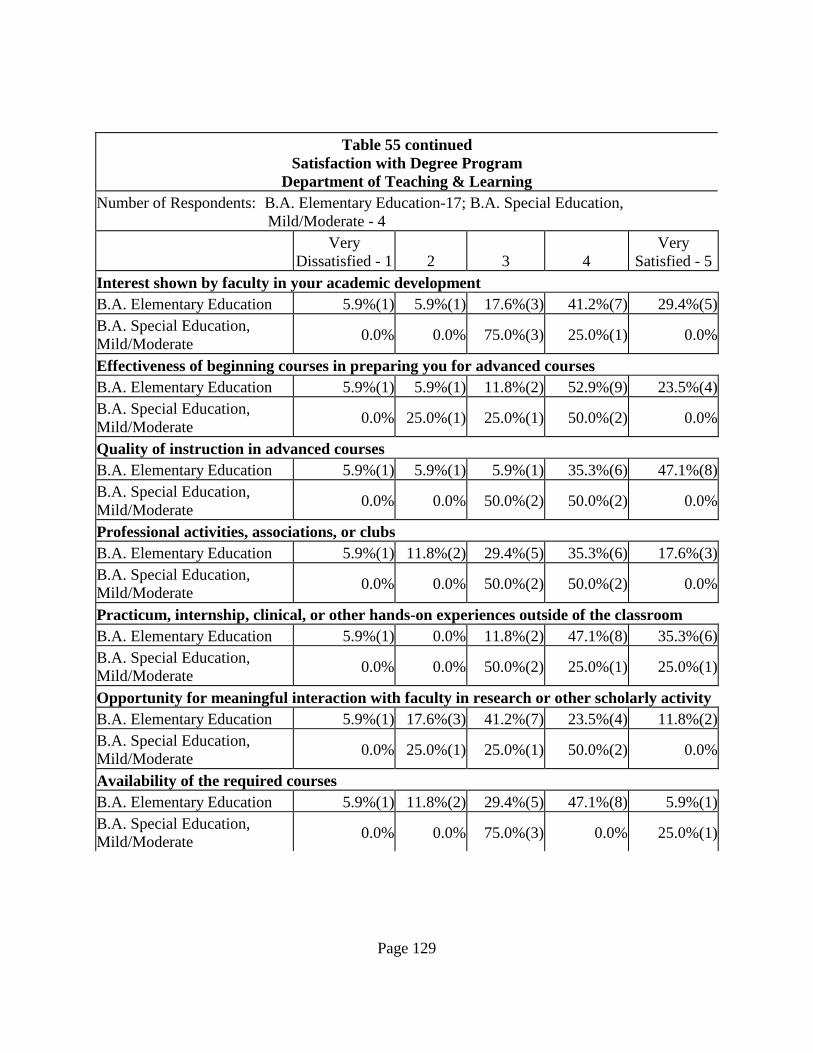
Page 129
Table 55 continued
Satisfaction with Degree Program Department of Teaching & Learning
Number of Respondents: B.A. Elementary Education-17; B.A. Special Education, Mild/Moderate - 4
Very Dissatisfied - 1
2
3
4
Very Satisfied - 5
Interest shown by faculty in your academic development B.A. Elementary Education 5.9%(1) 5.9%(1) 17.6%(3) 41.2%(7) 29.4%(5)B.A. Special Education, Mild/Moderate 0.0% 0.0% 75.0%(3) 25.0%(1) 0.0%
Effectiveness of beginning courses in preparing you for advanced courses B.A. Elementary Education 5.9%(1) 5.9%(1) 11.8%(2) 52.9%(9) 23.5%(4)B.A. Special Education, Mild/Moderate 0.0% 25.0%(1) 25.0%(1) 50.0%(2) 0.0%
Quality of instruction in advanced courses B.A. Elementary Education 5.9%(1) 5.9%(1) 5.9%(1) 35.3%(6) 47.1%(8)B.A. Special Education, Mild/Moderate 0.0% 0.0% 50.0%(2) 50.0%(2) 0.0%
Professional activities, associations, or clubs B.A. Elementary Education 5.9%(1) 11.8%(2) 29.4%(5) 35.3%(6) 17.6%(3)B.A. Special Education, Mild/Moderate 0.0% 0.0% 50.0%(2) 50.0%(2) 0.0%
Practicum, internship, clinical, or other hands-on experiences outside of the classroom B.A. Elementary Education 5.9%(1) 0.0% 11.8%(2) 47.1%(8) 35.3%(6)B.A. Special Education, Mild/Moderate 0.0% 0.0% 50.0%(2) 25.0%(1) 25.0%(1)
Opportunity for meaningful interaction with faculty in research or other scholarly activityB.A. Elementary Education 5.9%(1) 17.6%(3) 41.2%(7) 23.5%(4) 11.8%(2)B.A. Special Education, Mild/Moderate 0.0% 25.0%(1) 25.0%(1) 50.0%(2) 0.0%
Availability of the required courses B.A. Elementary Education 5.9%(1) 11.8%(2) 29.4%(5) 47.1%(8) 5.9%(1)B.A. Special Education, Mild/Moderate 0.0% 0.0% 75.0%(3) 0.0% 25.0%(1)

Page 130
Table 55 continued
Satisfaction with Degree Program Department of Teaching & Learning
Number of Respondents: B.A. Elementary Education-17; B.A. Special Education, Mild/Moderate - 4
Very Dissatisfied - 1
2
3
4
Very Satisfied - 5
Availability of elective courses you wanted to take in your major B.A. Elementary Education 5.9%(1) 0.0% 29.4%(5) 47.1%(8) 17.6%(3)B.A. Special Education, Mild/Moderate 0.0% 0.0% 25.0%(1) 50.0%(2) 25.0%(1)
Quality of instruction regarding standards and ethics in your major field B.A. Elementary Education 5.9%(1) 0.0% 17.6%(3) 52.9%(9) 23.5%(4)B.A. Special Education, Mild/Moderate 0.0% 25.0%(1) 0.0% 75.0%(3) 0.0%
Friendliness and helpfulness of faculty B.A. Elementary Education 5.9%(1) 0.0% 17.6%(3) 58.8%(10) 17.6%(3)B.A. Special Education, Mild/Moderate 0.0% 0.0% 50.0%(2) 50.0%(2) 0.0%
Opportunities for you to collaborate with other students on class projects B.A. Elementary Education 5.9%(1) 0.0% 11.8%(2) 41.2%(7) 41.2%(7)B.A. Special Education, Mild/Moderate 25.0%(1) 0.0% 0.0% 75.0%(3) 0.0%
Computer resources (PC and/or mainframe) for courses in your major B.A. Elementary Education 0.0% 11.8%(2) 29.4%(5) 29.4%(5) 29.4%(5)B.A. Special Education, Mild/Moderate 0.0% 25.0%(1) 25.0%(1) 50.0%(2) 0.0%
Library resources related to your major B.A. Elementary Education 5.9%(1) 0.0% 23.5%(4) 41.2%(7) 29.4%(5)B.A. Special Education, Mild/Moderate 0.0% 50.0%(2) 0.0% 50.0%(2) 0.0%
Use of appropriate technology in the classroom B.A. Elementary Education 11.8%(2) 11.8%(2) 11.8%(2) 47.1%(8) 17.6%(3)B.A. Special Education, Mild/Moderate 0.0% 50.0%(2) 0.0% 50.0%(2) 0.0%

Page 131
Table 55 continued
Satisfaction with Degree Program Department of Teaching & Learning
Number of Respondents: B.A. Elementary Education-17; B.A. Special Education, Mild/Moderate - 4
Very Dissatisfied - 1
2
3
4
Very Satisfied - 5
Facilities and equipment related to your major B.A. Elementary Education 5.9%(1) 0.0% 23.5%(4) 35.3%(6) 35.3%(6)B.A. Special Education, Mild/Moderate 0.0% 25.0%(1) 25.0%(1) 50.0%(2) 0.0%
Help/encouragement you received from faculty in your department with regard to further educational opportunities B.A. Elementary Education 5.9%(1) 5.9%(1) 11.8%(2) 41.2%(7) 35.3%(6)B.A. Special Education, Mild/Moderate 25.0%(1) 0.0% 50.0%(2) 25.0%(1) 0.0%
The size of classes in your major B.A. Elementary Education 5.9%(1) 11.8%(2) 23.5%(4) 23.5%(4) 35.3%(6)B.A. Special Education, Mild/Moderate 0.0% 25.0%(1) 25.0%(1) 50.0%(2) 0.0%
Encouragement you received from faculty in your department with regard to finding employment in your field B.A. Elementary Education 17.6%(3) 11.8%(2) 17.6%(3) 41.2%(7) 11.8%(2)B.A. Special Education, Mild/Moderate 0.0% 50.0%(2) 25.0%(1) 25.0%(1) 0.0%
Global perspectives presented in courses B.A. Elementary Education 5.9%(1) 17.6%(3) 29.4%(5) 29.4%(5) 17.6%(3)B.A. Special Education, Mild/Moderate 0.0% 50.0%(2) 50.0%(2) 0.0% 0.0%
Overall relevancy of courses B.A. Elementary Education 5.9%(1) 5.9%(1) 17.6%(3) 41.2%(7) 29.4%(5)B.A. Special Education, Mild/Moderate 0.0% 0.0% 25.0%(1) 75.0%(3) 0.0%

Page 132
Table 55 continued
Satisfaction with Degree Program Department of Teaching & Learning
No Yes 2. Would you recommend Southeastern to someone interested in what you majored in? B.A. Elementary Education 5.9%(1) 94.1%(16) B.A. Special Education, Mild/Moderate 0.0% 100.0% (4)
3. If you had it to do over again, would you choose the same major?
B.A. Elementary Education 5.9%(1) 88.2%(15); 5.9%(1) Not at Southeastern
B.A. Special Education, Mild/Moderate 25.0%(1) 75.0%(3)
4. Did you participate in an internship, a practicum, a clinical experience, or student teaching as part of your degree requirements?
B.A. Elementary Education 0.0% 100.0% (17) B.A. Special Education, Mild/Moderate 0.0% 100.0% (4)
6. Should a hands-on course be required in your program? B.A. Elementary Education 0.0% 100.0%(17) B.A. Special Education, Mild/Moderate 0.0% 100.0% (4)
When asked what benefits they received from hands-on experience, Elementary Education graduates had the following to say:
“The real life experience of teaching.”
“Learning how to interact w/children.”
“First hand knowledge of what to expect in the future.”
“Real world experiences that would not have come up in the classroom.
“This is the best way to receive instruction. It is very helpful and should be continued.”
“None- I had to earn and learn the benefits myself. Southeastern was of no help.”
“Some- but need more time in actual teaching experience.”

Page 133
“I was able to practice teaching and lesson planning under the supervision and guidance from an experienced teacher.”
“The opportunity to experience a real classroom environment”
“I learned how to deal with different classroom situations that can’t be learned in lecture classes.”
“The ability to apply things that I had learned (or not learned) in the classroom setting. Actually teaching a classroom full of students, instead of a group of 5-6.”
“I was able to see what it would really be like in the job.”
“It was good to see how I would react in situations that could not be controlled.”
“being able to work with kids and other teachers, being prepared for teaching.”
“I was able to be in a classroom and take on daily teaching activities and responsibilities.”
“These experiences prepare you for the real world. A classroom environment can only do so much.”
When asked what benefits they received from hands-on experience, the Special Education graduates had the following to say:
“Learned to write lesson plans”
“In class experience, student interaction, experience with various grade levels.”
“I understood the relationship to my field better.”
Perceptions of Southeastern B.A. Elementary Education None of the Elementary Education graduates participated in the study-abroad/student exchange, but 76.5% (n=13) thought it would be a valuable experience. Three (17.6%) of the respondents participated in the honors program, two (66.7%) were Somewhat Satisfied with the experience. One (5.9%) of the respondents participated in a research program and was Somewhat Satisfied with the experience. B.A. Special Education, Mild/Moderate
Page 134
None of the Special Education graduates participated in the study-abroad/student exchange, but 75.0% (n=3) thought it would be a valuable experience. None of the respondents participated in the honors program. Two (50.0%) of the respondents participated in a research program, one was Very Satisfied with the experience and one was Somewhat Satisfied.
Graduate/Professional Education B.A. Elementary Education Six (35.3%) of the respondents are currently enrolled in a graduate/professional degree program and two (11.8%) have completed a master’s degree. Four (23.5%) of the respondents are likely to enroll in a degree program in the future, and five (29.4%) have no plans for further education. Eight (66.7%) respondents plan on obtaining a master’s degree, and three (25.0%) a doctorate. Of the eight individuals with graduate school experience, five (62.5%) respondents indicated that Southeastern prepared them “Effectively” for graduate/professional education, and two (25.0%) indicated they were “Very Effectively” prepared. Seven (87.5%) indicated that Southeastern prepared them “About the Same as Most” other students. Of the eight respondents who are enrolled in a degree program or have completed a degree, four (50.0%) indicated it was “Very Closely Related” to their bachelor’s degree from Southeastern and two (25.0%) indicated it was “Somewhat Related”. B.A. Special Education, Mild/Moderate One (25.0%) of the respondents is currently enrolled in a graduate/professional degree program and one (25.0%) has taken classes but not enrolled in a degree program. Two (50.0%) of the respondents are likely to enroll in a degree program in the future. Three (75.0%) of the respondents plan on obtaining a master’s degree and one (25.0%) some “other” degree. One (50.0%) of the two individuals with graduate school experience indicated that Southeastern prepared her/him “Effectively” for further graduate/professional study and one (50.0%) indicated he/she was prepared “Ineffectively”. Both respondents indicated that Southeastern prepared them “About the Same as Most” other students. The respondent who is enrolled in a degree program indicated it was “Very Closely Related” to her/his bachelor’s degree from Southeastern.
Employment B.A. Elementary Education Over eighty-five percent of the respondents (88.2%, n=15) are employed full-time, with one (5.9%) employed as a graduate assistant and one (5.9%) unemployed and not looking for full-time employment. Two (11.8%) of the respondents had their job before completing the degree, four (23.5%) accepted a position upon graduation, ten (58.8%) respondents obtained a job 1-6

Page 135
months after graduation, and one (5.9%) respondent has not had a full-time job since graduating from Southeastern. The ten respondents who did not have a job upon graduation faced a variety of problems in obtaining employment. Table 56 presents what were considered major problems, minor problems, or no problem.
Table 56 Please indicate whether each of the following was a major problem, minor problem, or not a problem in obtaining employment after graduating from Southeastern with your Bachelors. Major Problem Minor Problem Not A Problem Limited to only one geographic area 0.0% 20.0% (2) 70.0% (7) Not knowing what I wanted to do 0.0% 0.0% 90.0% (9) Tight job market 30.0% (3) 40.0% (4) 20.0% (2) Lack of marketable skills 0.0% 10.0% (1) 80.0% (8) Lack of educational qualifications 0.0% 10.0% (1) 80.0% (8) Reputation of Southeastern 10.0% (1) 0.0% 80.0% (8) Lack of experience 20.0% (2) 10.0% (1) 60.0% (6) Lack of job search skills 0.0% 20.0% (2) 70.0% (7) Poor GPA 0.0% 10.0% (1) 80.0% (8) Racial discrimination 0.0% 0.0% 90.0% (9) Gender discrimination 0.0% 0.0% 90.0% (9) Age discrimination 0.0% 10.0% (1) 80.0% (8) Eight of the respondents (50.0%) indicated their education was “Very Effective” in preparing them for employment or improving job performance, six (37.5%) indicated it was “Effective”, one (6.3%) indicated it was “Ineffective”, and one (6.3%) indicated it was “Very Ineffective”. Thirteen (81.3%) of the respondents indicated that they are currently in their first full-time job since graduating from Southeastern, two (12.5%) are in their second full-time job, and one (6.3%) has had three or more full-time jobs. In regards to sources for learning about their first full-time job, two (12.5%) indicated Southeastern faculty, three (18.8%) from a parent or relative, one (6.3%) from a professional meeting, two (12.5%) from another student or friend, four (25.0%) were recruited by the employer, two (12.5%) from a Southeastern Job Fair, one (6.3%) from the Internet, one (6.3%) already had the job, and three (18.8%) from internship, practicum, or student teaching. Of the fifteen respondents who are currently working full-time, one did not complete any of the questions on current employment, therefore, the rest of this section will be based on the fourteen respondents who completed the section. All (100.0%) of the respondents are employed in the state of Louisiana in K-12 education. When asked “If underemployment is defined as a condition in which your job requires lower levels of skill and training than those you acquired in

Page 136
college, would you say that you are currently underemployed”, all (100%) of the respondents felt they are not underemployed. When asked about satisfaction with their present employment, nine (64.3%) of the respondents are “Well satisfied; would not consider leaving” and five (35.7%) are “Satisfied, but would consider more desirable employment”. Thirteen (92.9%) of the respondents are currently employed in the area of their Southeastern major, and one (7.1%) is employed in an area related to her/his Southeastern major. One of the respondents (7.1%) gave a salary range of $15,001-$20,000, two (14.3%) gave a salary range of $20,001-$25,000, six (42.9%) gave a salary range of $25,001-$30,000, and five (35.7%) gave a salary range of $30,001-40,000. B.A. Special Education, Mild/Moderate All of the respondents (100.0%) are employed full-time. Two (50.0%) of the respondents had a full-time job prior to graduation and two (50.0%) respondents obtained a job 1-6 months after graduation. One of the two who did not have a job upon graduation indicated that a “Limited to only one geographic area”. “Not knowing what I wanted to do”, “Tight job market”, “Lack of marketable skills”, “Lack of experience”, and “Racial discrimination” were minor problems in obtaining employment. One of the respondents (25.0%) indicated his/her education was “Very Effective” in preparing her/him for employment or improving job performance and one (25.0%) indicated it was “Effective”. Two (50.0%) of the respondents indicated that they are currently in their first full-time job since graduating from Southeastern and one (25.0%) is in his/her second full-time job. In regards to sources for learning about their first full-time job, one (25.0%) indicated Southeastern faculty, two (50.0%) from Southeastern’s Career Development Services, one (25.0%) from another student or friend, and two (25.0%) from a Southeastern Job Fair. All (100%) of the respondents are employed in the state of Louisiana. Three (75.0%) are currently employed in K-12 education and one (25.0%) is in the military. When asked “If underemployment is defined as a condition in which your job requires lower levels of skill and training than those you acquired in college, would you say that you are currently underemployed”, all (100.0%) of the respondents felt they were not underemployed. When asked about satisfaction with their present employment, two (50.0%) of the respondents are “Well satisfied; would not consider leaving” and two (50.0%) are “Satisfied, but would consider more desirable employment”. Three (75.0%) of the respondents are currently employed in the area of their Southeastern major, and one (25.0%) is employed in an area not related to her/his Southeastern major because of better pay. Two (50.0%) of the respondents indicated a salary range of $25,001-$30,000, and two (50.0%) of the respondents indicated a salary range of $30,001-$40,000.
Professional Activities
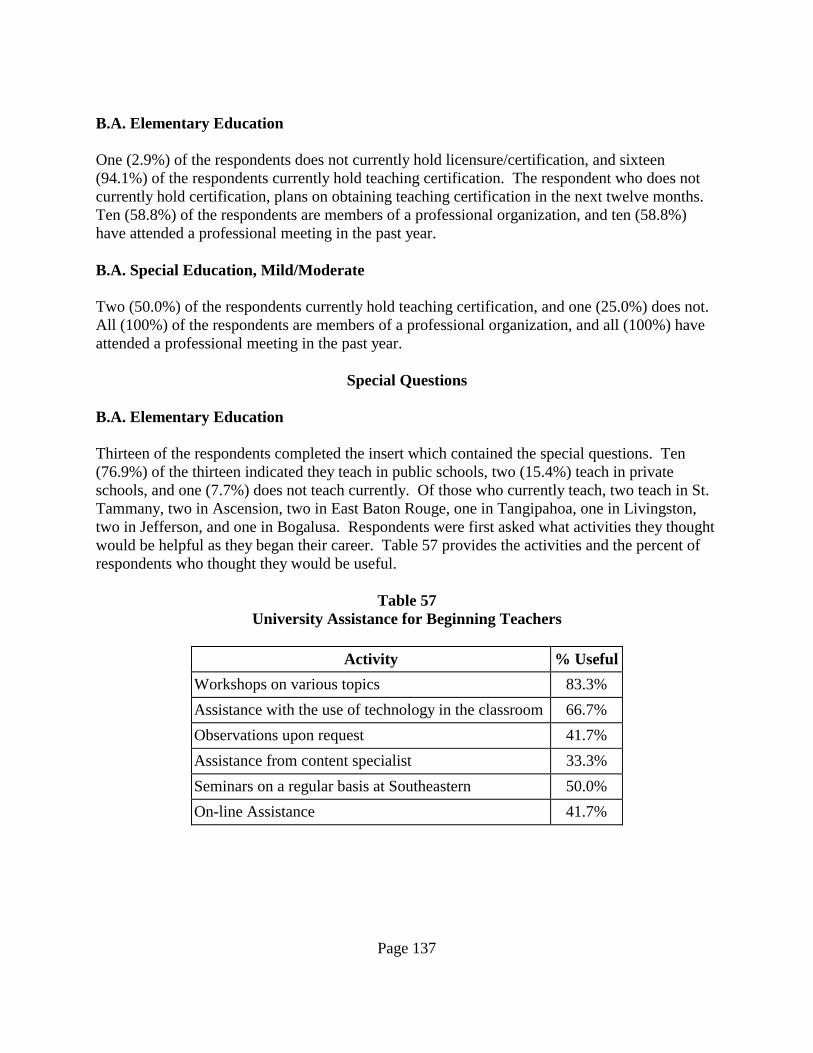
Page 137
B.A. Elementary Education One (2.9%) of the respondents does not currently hold licensure/certification, and sixteen (94.1%) of the respondents currently hold teaching certification. The respondent who does not currently hold certification, plans on obtaining teaching certification in the next twelve months. Ten (58.8%) of the respondents are members of a professional organization, and ten (58.8%) have attended a professional meeting in the past year. B.A. Special Education, Mild/Moderate Two (50.0%) of the respondents currently hold teaching certification, and one (25.0%) does not. All (100%) of the respondents are members of a professional organization, and all (100%) have attended a professional meeting in the past year.
Special Questions B.A. Elementary Education Thirteen of the respondents completed the insert which contained the special questions. Ten (76.9%) of the thirteen indicated they teach in public schools, two (15.4%) teach in private schools, and one (7.7%) does not teach currently. Of those who currently teach, two teach in St. Tammany, two in Ascension, two in East Baton Rouge, one in Tangipahoa, one in Livingston, two in Jefferson, and one in Bogalusa. Respondents were first asked what activities they thought would be helpful as they began their career. Table 57 provides the activities and the percent of respondents who thought they would be useful.
Table 57 University Assistance for Beginning Teachers
Activity % Useful
Workshops on various topics 83.3% Assistance with the use of technology in the classroom 66.7% Observations upon request 41.7% Assistance from content specialist 33.3% Seminars on a regular basis at Southeastern 50.0% On-line Assistance 41.7%

Page 138
Next, students were asked how much assistance they would like to have in various areas during their first two years of teaching. Table 58 provides the percentage of desired help for each area.
Table 58 Amount of Assistance Desired During First Two Years of Teaching
1 - No
Help 2 3 4 5 - Lots of Help
Communicating with the principal 8.3% 16.7% 50.0% 8.3% 16.7% Communicating with parents 0.0% 8.3% 41.7% 25.0% 25.0% Planning specific learner outcomes in clear, concise objectives 0.0% 33.3% 41.7% 8.3% 16.7%
Creating activities that develop objectives 25.0% 25.0% 25.0% 8.3% 16.7% Identifying and planning for individual differences 8.3% 16.7% 16.7% 25.0% 33.3%
Identifying and using appropriate materials needed for lessons 16.7% 33.3% 33.3% 8.3% 8.3%
Assessing student progress 16.7% 41.7% 16.7% 8.3% 16.7% Organizing available space, materials and/or equipment to facilitate learning 50.0% 8.3% 25.0% 8.3% 8.3%
Managing routines and transitions in a timely manner 33.3% 16.7% 25.0% 16.7% 8.3%
Establishing expectations for learner behavior 33.3% 33.3% 16.7% 8.3% 8.3% Seeking community involvement in instructional programs 0.0% 8.3% 50.0% 33.3% 8.3%
Communicating with students 33.3% 25.0% 16.7% 16.7% 8.3% Integrating technology into instruction 0.0% 8.3% 25.0% 33.3% 33.3% Using monitoring techniques to facilitate learning 0.0% 58.3% 16.7% 16.7% 8.3%
Sequencing lessons to promote learning 16.7% 25.0% 33.3% 16.7% 8.3% Maintaining an environment conducive to learning 33.3% 25.0% 8.3% 16.7% 16.7%
Acquiring additional knowledge of content 8.3% 25.0% 33.3% 16.7% 16.7% Remaining knowledgeable of current scholarship 16.7% 33.3% 8.3% 16.7% 25.0%

Page 139
When asked what other areas they would have liked assistance, respondents answered: ! How to deal with special education (autism, etc) and behavior problems ! How to actually teach in the Real World ! Identifying methods/materials to assist students with reading problems ! Classroom management; grant writing; individual differences ! Filling out all the paper work that comes with teaching (report cards, interims,
attendance cards, etc.) ! Working with students who lack the gumption to want to learn ! I left after the Balanced Literacy Program was out. It was hard learning it in the
classroom. We should have all received training. ! Knowledge of all paperwork that needs to be completed of students, e.g. Report
cards, cumulative folders Finally, respondents were asked what they thought was the most important thing Southeastern could do to provide assistance in their teaching career. ! Teach the student how things really are once they get out! ! Have workshops or share a thons to assist in the first few months ! in classroom training ! Have Master classes at better times like 5 or after, not 3 ! Available workshops; help with continuing education B.A. Special Education, Mild/Moderate All of the respondents completed the insert which contained the special questions. Three (75.0%) of the thirteen indicated they teach in public schools and one (25.0%) does not teach currently. Of those who currently teach, one teaches in St. Tammany and one in Livingston. Respondents were first asked what activities they thought would be helpful as they began their career. Table 59 provides the activities and the percent of respondents who thought they would be useful.

Page 140
Table 59 University Assistance for Beginning Teachers
Activity % Useful
Workshops on various topics 33.3% Assistance with the use of technology in the classroom 0.0% Observations upon request 33.3% Assistance from content specialist 33.3% Seminars on a regular basis at Southeastern 66.7% On-line Assistance 66.7%

Page 141
Next, students were asked how much assistance they would like to have in various areas during their first two years of teaching. Table 60 provides the percentage of desired help for each area.
Table 60 Amount of Assistance Desired During First Two Years of Teaching
1 - No
Help 2 3 4 5 - Lots of Help
Communicating with the principal 0.0% 33.3% 66.7% 0.0% 0.0% Communicating with parents 0.0% 33.3% 33.3% 0.0% 33.3% Planning specific learner outcomes in clear, concise objectives 33.3% 0.0% 66.7% 0.0% 0.0%
Creating activities that develop objectives 0.0% 33.3% 33.3% 33.3% 0.0% Identifying and planning for individual differences 33.3% 0.0% 33.3% 0.0% 33.3%
Identifying and using appropriate materials needed for lessons 33.3% 33.3% 33.3% 0.0% 0.0%
Assessing student progress 33.3% 0.0% 33.3% 33.3% 0.0% Organizing available space, materials and/or equipment to facilitate learning 66.7% 0.0% 0.0% 33.3% 0.0%
Managing routines and transitions in a timely manner 66.7% 0.0% 33.3% 0.0% 0.0%
Establishing expectations for learner behavior 33.3% 33.3% 0.0% 33.3% 0.0% Seeking community involvement in instructional programs 0.0% 33.3% 0.0% 66.7% 0.0%
Communicating with students 0.0% 33.3% 33.3% 33.3% 0.0% Integrating technology into instruction 0.0% 33.3% 0.0% 66.7% 0.0% Using monitoring techniques to facilitate learning 33.3% 0.0% 33.3% 33.3% 0.0%
Sequencing lessons to promote learning 33.3% 33.3% 33.3% 0.0% 0.0% Maintaining an environment conducive to learning 33.3% 0.0% 33.3% 0.0% 33.3%
Acquiring additional knowledge of content 0.0% 0.0% 33.3% 0.0% 66.7% Remaining knowledgeable of current scholarship 0.0% 0.0% 33.3% 33.3% 33.3%

Page 142
Finally, respondents were asked what they thought was the most important thing Southeastern could do to provide assistance in their teaching career. ! Interact with students on an individual basis as often as possible. Place students in
the IEP process and SBLC process (hands-on) as well as class discussions ! Keep me up to date on current changes in my field.

Page 143
Department of Communication Sciences & Disorders
Table 61 Satisfaction with Degree Program
Number of Respondents: B.A. Speech, Language, Hearing - 8
Very Dissatisfied - 1
2
3
4
Very Satisfied - 5
Overall quality of your department B.A. Speech, Language, Hearing 0.0% 0.0% 0.0% 12.5%(1) 87.5%(7)
Overall quality of your degree program B.A. Speech, Language, Hearing 0.0% 0.0% 0.1% 25.0%(2) 75.0%(6)
Clarity of the degree requirements as outlined in the catalogue and/or curriculum sheets B.A. Speech, Language, Hearing 0.0% 0.0% 0.0% 12.5%(1) 87.5%(7)
Usefulness of the academic advice you received from your advisor B.A. Speech, Language, Hearing 0.0% 0.0% 25.0%(2) 37.5%(3) 37.5%(3)
Opportunities to interact with faculty outside of class B.A. Speech, Language, Hearing 0.0% 0.0% 0.0% 37.5%(3) 62.5%(5)
Effectiveness of the faculty as teachers B.A. Speech, Language, Hearing 0.0% 0.0% 0.0% 50.0%(4) 50.0%(4)
Friendliness and helpfulness of the office staff B.A. Speech, Language, Hearing 0.0% 0.0% 0.0% 62.5%(5) 37.5%(3)
Interest shown by faculty in your academic development B.A. Speech, Language, Hearing 0.0% 0.0% 12.5%(1) 25.0%(2) 62.5%(5)
Effectiveness of beginning courses in preparing you for advanced courses B.A. Speech, Language, Hearing 0.0% 0.0% 0.0% 50.0%(4) 50.0% (4)
Quality of instruction in advanced courses B.A. Speech, Language, Hearing 0.0% 0.0% 0.0% 37.5%(3) 62.5%(5)

Page 144
Table 61 continued
Satisfaction with Degree Program Department of Communication Sciences & Disorders
Number of Respondents: B.A. Speech, Language, Hearing - 8
Very Dissatisfied - 1
2
3
4
Very Satisfied - 5
Professional activities, associations, or clubs B.A. Speech, Language, Hearing 0.0% 0.0% 0.0% 87.5%(7) 12.5%(1)
Practicum, internship, clinical, or other hands-on experiences outside of the classroom B.A. Speech, Language, Hearing 0.0% 0.0% 0.0% 25.0%(2) 75.0%(6)
Opportunity for meaningful interaction with faculty in research or other scholarly activityB.A. Speech, Language, Hearing 0.0% 0.0% 12.5%(1) 50.0%(4) 37.5%(3)
Availability of the required courses B.A. Speech, Language, Hearing 0.0% 0.0% 25.0%(2) 25.0%(2) 50.0%(4)
Availability of elective courses you wanted to take in your major B.A. Speech, Language, Hearing 0.0% 12.5%(1) 12.5%(1) 37.5%(3) 37.5%(3)
Quality of instruction regarding standards and ethics in your major field B.A. Speech, Language, Hearing 0.0% 0.0% 0.0% 25.0%(2) 75.0%(6)
Friendliness and helpfulness of faculty B.A. Speech, Language, Hearing 0.0% 0.0% 12.5%(1) 12.5%(1) 75.0%(6)
Opportunities for you to collaborate with other students on class projects B.A. Speech, Language, Hearing 0.0% 0.0% 12.5%(1) 62.5%(5) 25.0%(2)
Computer resources (PC and/or mainframe) for courses in your major B.A. Speech, Language, Hearing 0.0% 0.0% 12.5%(1) 87.5%(7) 0.0%
Library resources related to your major B.A. Speech, Language, Hearing 0.0% 12.5%(1) 37.5%(3) 37.5%(3) 12.5%(1)
Use of appropriate technology in the classroom B.A. Speech, Language, Hearing 0.0% 12.5%(1) 12.5%(1) 50.0%(4) 25.0%(2)

Page 145
Table 61 continued Satisfaction with Degree Program
Department of Communication Sciences & Disorders Number of Respondents: B.A. Speech, Language, Hearing - 8
Very Dissatisfied - 1
2
3
4
Very Satisfied - 5
Facilities and equipment related to your major B.A. Speech, Language, Hearing 0.0% 0.0% 0.0% 75.0%(6) 25.0%(2)
Help/encouragement you received from faculty in your department with regard to further educational opportunities B.A. Speech, Language, Hearing 0.0% 12.5%(1) 12.5%(1) 12.5%(1) 62.5%(5)
The size of classes in your major B.A. Speech, Language, Hearing 0.0% 0.0% 0.0% 25.0%(2) 75.0%(6)
Encouragement you received from faculty in your department with regard to finding employment in your field B.A. Speech, Language, Hearing 0.0% 12.5%(1) 25.0%(2) 25.0%(2) 37.5%(3)
Global perspectives presented in courses B.A. Speech, Language, Hearing 0.0% 0.0% 0.0% 50.0%(4) 50.0%(4)
Overall relevancy of courses B.A. Speech, Language, Hearing 0.0% 0.0% 0.0% 25.0%(2) 75.0%(6)
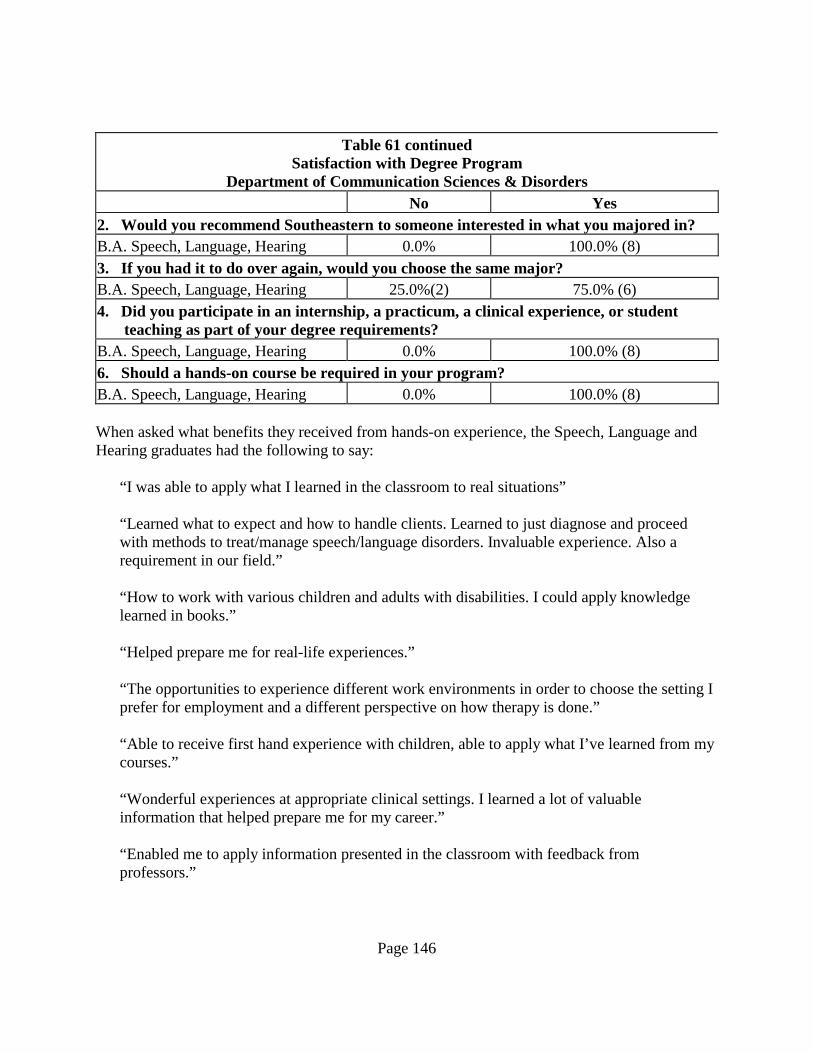
Page 146
Table 61 continued
Satisfaction with Degree Program Department of Communication Sciences & Disorders
No Yes 2. Would you recommend Southeastern to someone interested in what you majored in? B.A. Speech, Language, Hearing 0.0% 100.0% (8) 3. If you had it to do over again, would you choose the same major? B.A. Speech, Language, Hearing 25.0%(2) 75.0% (6) 4. Did you participate in an internship, a practicum, a clinical experience, or student
teaching as part of your degree requirements? B.A. Speech, Language, Hearing 0.0% 100.0% (8) 6. Should a hands-on course be required in your program? B.A. Speech, Language, Hearing 0.0% 100.0% (8) When asked what benefits they received from hands-on experience, the Speech, Language and Hearing graduates had the following to say:
“I was able to apply what I learned in the classroom to real situations”
“Learned what to expect and how to handle clients. Learned to just diagnose and proceed with methods to treat/manage speech/language disorders. Invaluable experience. Also a requirement in our field.”
“How to work with various children and adults with disabilities. I could apply knowledge learned in books.”
“Helped prepare me for real-life experiences.”
“The opportunities to experience different work environments in order to choose the setting I prefer for employment and a different perspective on how therapy is done.”
“Able to receive first hand experience with children, able to apply what I’ve learned from my courses.”
“Wonderful experiences at appropriate clinical settings. I learned a lot of valuable information that helped prepare me for my career.”
“Enabled me to apply information presented in the classroom with feedback from professors.”

Page 147
Perceptions of Southeastern
B.S. Speech, Language & Hearing None of the Speech, Language & Hearing graduates participated in the study-abroad/student exchange, but all thought it would be a valuable experience. Two (25.0%) of the respondents participated in the honors program. One (50.0%) was Somewhat Satisfied with the experience and one (50.0%) was Very Satisfied with the experience. Three (37.5%) of the respondents participated in a research program, one (33.3%) was Very Satisfied with the experience and two (66.7%) were Somewhat Satisfied with the experience.
Graduate/Professional Education Two (25.0%) of the respondents are currently enrolled in a graduate/professional degree program and four (50.0%) of the respondents have completed a master’s degree. One (12.5%) of the respondents has taken classes, but has not enrolled in a degree program, and one (12.5%) is likely to enroll in a degree program in the future. One (12.5%) of the respondents already has the highest degree she/he plans on obtaining, four (50.0%) plan on obtaining a master’s and three (37.5%) plan on obtaining a doctorate. Three (42.9%) of the seven individuals with graduate school experience indicated that Southeastern prepared them “Effectively” for further graduate/professional education and four (57.1%) indicated they were prepared “Very Effectively”. Five (71.4%) indicated that Southeastern prepared them “Better than Most” other students and two (28.6%) indicated that Southeastern prepared them “About the Same as Most” other students. Four (66.7%) of the six respondents who are enrolled in or have complete a degree program indicated it was “Very Closely Related” to their bachelor’s degree from Southeastern and one (16.7%) indicated it was “Somewhat Related”.
Employment Six (75.0%) of the respondents are employed full-time, one (12.5%) is employed part-time and satisfied with part-time work, and one (12.5%) is employed part-time but seeking full-time employment. Three (37.5%) respondent had a full-time job prior to graduation, one (12.5%) accepted a position upon graduation, and four (50.0%) respondents obtained a job 1-6 months after graduation. The four respondents who did not have a job upon graduation faced a variety of problems in obtaining employment. Table 62 presents what were considered major problems, minor problems, or no problem.

Page 148
Table 62
Please indicate whether each of the following was a major problem, minor problem, or not a problem in obtaining employment after graduating from Southeastern with your Bachelors. Major Problem Minor Problem Not A Problem Limited to only one geographic area 25.0% (1) 0.0% 75.0% (3) Not knowing what I wanted to do 0.0% 25.0% (1) 75.0% (3) Tight job market 25.0% (1) 25.0% (1) 50.0% (2) Lack of marketable skills 25.0% (1) 0.0% 75.0% (3) Lack of educational qualifications 25.0% (1) 25.0% (1) 50.0% (2) Reputation of Southeastern 0.0% 0.0% 100% (4) Lack of experience 0.0% 0.0% 100% (4) Lack of job search skills 0.0% 75.0% (3) 25.0% (1) Poor GPA 0.0% 0.0% 100% (4) Racial discrimination 0.0% 0.0% 100% (4) Gender discrimination 0.0% 0.0% 100% (4) Age discrimination 0.0% 0.0% 100% (4) Three of the respondents (37.5%) indicated their education was “Very Effective” in preparing them for employment or improving job performance, two (25.0%) indicated it was “Effective”, and one (12.5%) indicated it was “Ineffective.” Five (62.5%) of the respondents indicated that they are currently in their first full-time job since graduating from Southeastern and one (12.5%) is in his/her second full-time job. In regards to sources for learning about their first full-time job, one (12.5%) indicated from a parent or relative, one (12.5%) from a newspaper/trade publication, three (37.5%) from another student or friend, one (12.5%) already had the job, and one (12.5%) from internship, practicum, or student teaching. Of the six respondents who are currently employed full-time, five (83.3%) are employed in the state of Louisiana and one (16.7%) is employed out of state. Five (83.3%) are employed in K-12 education and one (16.7%) is employed in a service organization. When asked “If underemployment is defined as a condition in which your job requires lower levels of skill and training than those you acquired in college, would you say that you are currently underemployed”, four (66.7%) of the respondents felt they are not underemployed while two (33.3%) felt they are underemployed. When asked about satisfaction with their present employment, four (66.7%) of the respondents are “Well satisfied; would not consider leaving”; one (16.7%) is “Satisfied, but would consider more desirable employment”; and one (16.7%) “Dislikes employment, seeking or will seek other employment”. Three (50.0%) of the respondents are currently employed in the area of their Southeastern major, two (33.3%) are employed in an area related to their major, and one (16.7%) is employed in an area not related to her/his major because he/she has not obtained the required
Page 149
licensure/certification. One (16.7%) of the respondents indicated a salary range of $20,001-$25,000, three (50.0%) gave a salary range of $25,001-$30,000, and two (33.3%) indicated a range of $30,001-$40,000.
Professional Activities One (12.5%) of the respondents indicated licensure/certification is not available in his/her field. Four (50.0%) of the respondents do not currently hold licensure/certification and three (37.5%) do currently hold licensure/certification. Below are the licensure/certifications provided: Teaching Certification Provisional speech-language pathologist Speech therapy license State of LA Ancillary certificate, “Speech pathologist” LBESPA Three (75.0%) of those who do not currently hold licensure/certification, plan on obtaining it in the next twelve months. Two indicated teaching certification and one a Certificate of Clinical Competence. Four (50.0%) of the respondents are members of a professional organization, and three (37.5%) have attended a professional meeting in the past year.
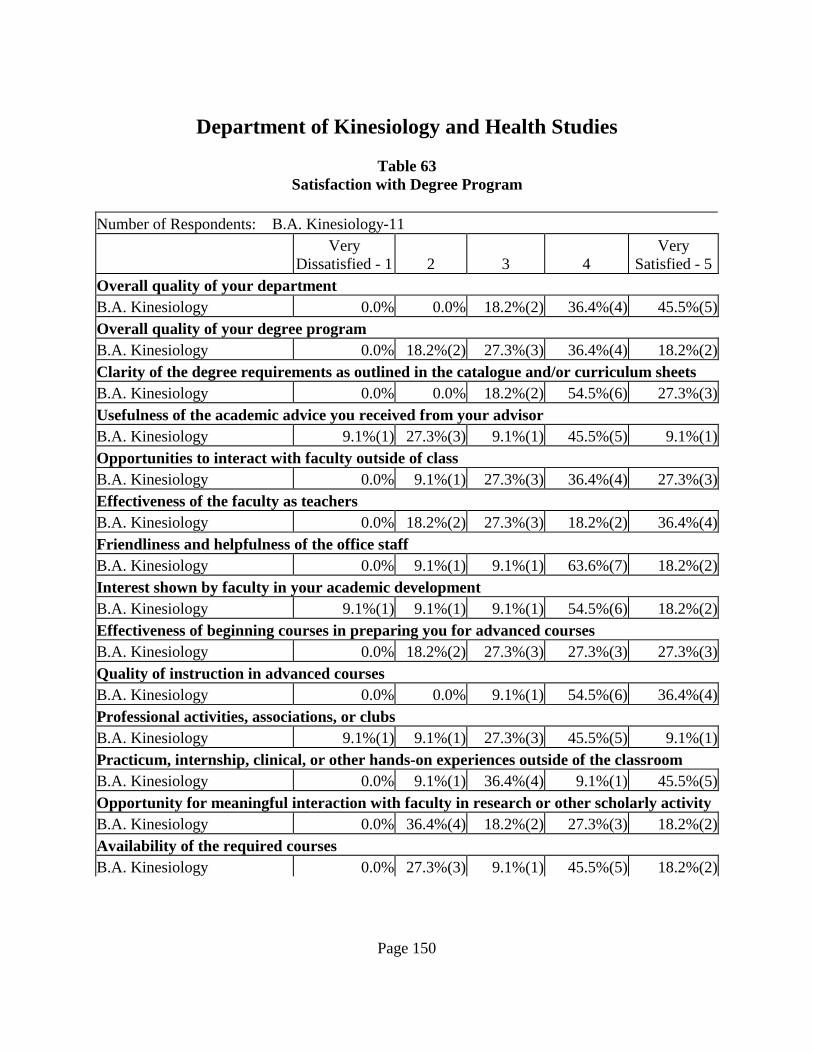
Page 150
Department of Kinesiology and Health Studies
Table 63 Satisfaction with Degree Program
Number of Respondents: B.A. Kinesiology-11
Very Dissatisfied - 1
2
3
4
Very Satisfied - 5
Overall quality of your department B.A. Kinesiology 0.0% 0.0% 18.2%(2) 36.4%(4) 45.5%(5)Overall quality of your degree program B.A. Kinesiology 0.0% 18.2%(2) 27.3%(3) 36.4%(4) 18.2%(2)Clarity of the degree requirements as outlined in the catalogue and/or curriculum sheets B.A. Kinesiology 0.0% 0.0% 18.2%(2) 54.5%(6) 27.3%(3)Usefulness of the academic advice you received from your advisor B.A. Kinesiology 9.1%(1) 27.3%(3) 9.1%(1) 45.5%(5) 9.1%(1)Opportunities to interact with faculty outside of class B.A. Kinesiology 0.0% 9.1%(1) 27.3%(3) 36.4%(4) 27.3%(3)Effectiveness of the faculty as teachers B.A. Kinesiology 0.0% 18.2%(2) 27.3%(3) 18.2%(2) 36.4%(4)Friendliness and helpfulness of the office staff B.A. Kinesiology 0.0% 9.1%(1) 9.1%(1) 63.6%(7) 18.2%(2)Interest shown by faculty in your academic development B.A. Kinesiology 9.1%(1) 9.1%(1) 9.1%(1) 54.5%(6) 18.2%(2)Effectiveness of beginning courses in preparing you for advanced courses B.A. Kinesiology 0.0% 18.2%(2) 27.3%(3) 27.3%(3) 27.3%(3)Quality of instruction in advanced courses B.A. Kinesiology 0.0% 0.0% 9.1%(1) 54.5%(6) 36.4%(4)Professional activities, associations, or clubs B.A. Kinesiology 9.1%(1) 9.1%(1) 27.3%(3) 45.5%(5) 9.1%(1)Practicum, internship, clinical, or other hands-on experiences outside of the classroom B.A. Kinesiology 0.0% 9.1%(1) 36.4%(4) 9.1%(1) 45.5%(5)Opportunity for meaningful interaction with faculty in research or other scholarly activityB.A. Kinesiology 0.0% 36.4%(4) 18.2%(2) 27.3%(3) 18.2%(2)Availability of the required courses B.A. Kinesiology 0.0% 27.3%(3) 9.1%(1) 45.5%(5) 18.2%(2)
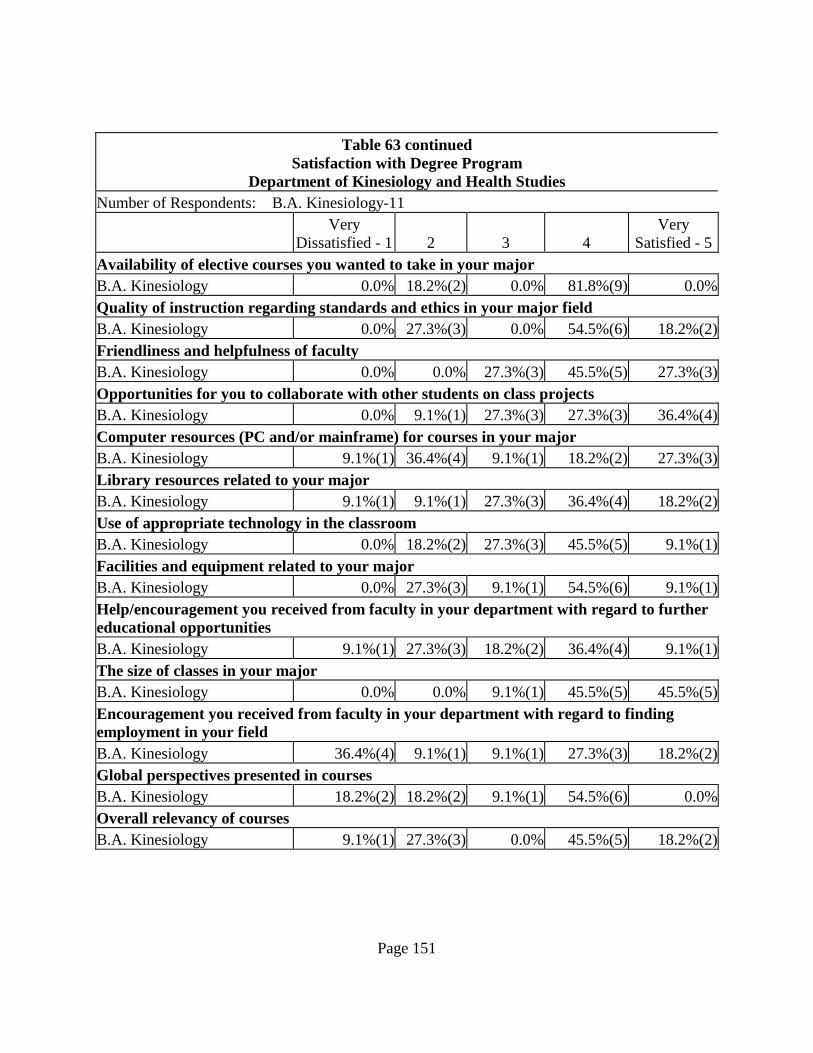
Page 151
Table 63 continued
Satisfaction with Degree Program Department of Kinesiology and Health Studies
Number of Respondents: B.A. Kinesiology-11
Very Dissatisfied - 1
2
3
4
Very Satisfied - 5
Availability of elective courses you wanted to take in your major B.A. Kinesiology 0.0% 18.2%(2) 0.0% 81.8%(9) 0.0%Quality of instruction regarding standards and ethics in your major field B.A. Kinesiology 0.0% 27.3%(3) 0.0% 54.5%(6) 18.2%(2)Friendliness and helpfulness of faculty B.A. Kinesiology 0.0% 0.0% 27.3%(3) 45.5%(5) 27.3%(3)Opportunities for you to collaborate with other students on class projects B.A. Kinesiology 0.0% 9.1%(1) 27.3%(3) 27.3%(3) 36.4%(4)Computer resources (PC and/or mainframe) for courses in your major B.A. Kinesiology 9.1%(1) 36.4%(4) 9.1%(1) 18.2%(2) 27.3%(3)Library resources related to your major B.A. Kinesiology 9.1%(1) 9.1%(1) 27.3%(3) 36.4%(4) 18.2%(2)Use of appropriate technology in the classroom B.A. Kinesiology 0.0% 18.2%(2) 27.3%(3) 45.5%(5) 9.1%(1)Facilities and equipment related to your major B.A. Kinesiology 0.0% 27.3%(3) 9.1%(1) 54.5%(6) 9.1%(1)Help/encouragement you received from faculty in your department with regard to further educational opportunities B.A. Kinesiology 9.1%(1) 27.3%(3) 18.2%(2) 36.4%(4) 9.1%(1)The size of classes in your major B.A. Kinesiology 0.0% 0.0% 9.1%(1) 45.5%(5) 45.5%(5)Encouragement you received from faculty in your department with regard to finding employment in your field B.A. Kinesiology 36.4%(4) 9.1%(1) 9.1%(1) 27.3%(3) 18.2%(2)Global perspectives presented in courses B.A. Kinesiology 18.2%(2) 18.2%(2) 9.1%(1) 54.5%(6) 0.0%Overall relevancy of courses B.A. Kinesiology 9.1%(1) 27.3%(3) 0.0% 45.5%(5) 18.2%(2)

Page 152
Table 63 continued
Satisfaction with Degree Program Department of Kinesiology and Health Studies
No Yes 2. Would you recommend Southeastern to someone interested in what you majored in? B.A. Kinesiology 27.3%(3) 72.7%(8) 3. If you had it to do over again, would you choose the same major?
B.A. Kinesiology 36.4%(4) 45.5%(5); 18.2%(2) Not at Southeastern
4. Did you participate in an internship, a practicum, a clinical experience, or student teaching as part of your degree requirements?
B.A. Kinesiology 9.1%(1) 90.9%(10) 6. Should a hands-on course be required in your program? B.A. Kinesiology 9.1%(1) 90.9%(10) When asked what benefits they received from hands-on experience, Kinesiology graduates had the following to say:
“Outside of SLU, I was treated like other students. I had more practice on helping athletes.”
“clinical knowledge, customer service”
“More things that I used today in my job, than what I received at SLU. There needs to be more hands on.”
“Application of knowledge.”
“Participation in the field allowed me to be certain this major was for me.”
“Chance to realize my potential before entering the field.”
“hands on, related with co-workers”
“Real life experiences”
Perceptions of Southeastern
B.A. Kinesiology None of the Kinesiology graduates participated in study-abroad/student exchange, but 72.7% (n=8) thought it would be a valuable experience. One (9.1%) of the respondents participated in the Honors program and was Somewhat Dissatisfied with the experience. Two (18.2%) of the

Page 153
respondents participated in a research program, both were Somewhat Satisfied with the experience.
Graduate/Professional Education Two (18.2%) of the respondents have completed degrees, one has a master’s and one has a second baccalaureate. One (9.1%) of the respondents plans to enroll in a degree program in the next 12 months and four (36.4%) are likely to enroll in a degree program in the future. Four (36.4%) of the respondents have no plans for further education. Of the seven respondents with plans for graduate education, four (57.1%) plan on obtaining a master’s, one (14.3%) plans on obtaining a doctorate, one (14.3%) plans on obtaining a professional degree, and one (14.3%) plans on obtaining a second bachelor’s degree. Both of the two individuals with graduate school experience indicated that Southeastern prepared them “Effectively” for further graduate/professional study. One (50.0%) respondent indicated that Southeastern prepared him/her “About the Same as Most” other students. One of the respondents indicated his/her degree program was “Very Closely Related” to her/his bachelor’s degree from Southeastern.
Employment Over eighty percent of the respondents (81.8%, n=9) are employed full-time, with one (9.1%) unemployed but seeking employment, and one (9.1%) respondent is unemployed and not seeking employment. Three (27.3%) of the respondents had full-time jobs before completing their degree, four (36.4%) accepted a position upon graduation, two (18.2%) respondents obtained a job 1-6 months after graduation, and two (18.2%) respondents obtained a job 7-12 months after graduation. The four respondents who did not have a job upon graduation faced a variety of problems in obtaining employment. Table 64 presents what were considered major problems, minor problems, or no problem.

Page 154
Table 64
Please indicate whether each of the following was a major problem, minor problem, or not a problem in obtaining employment after graduating from Southeastern with your Bachelors. Major Problem Minor Problem Not A Problem Limited to only one geographic area 0.0% 25.0% (1) 50.0% (2) Not knowing what I wanted to do 25.0% (1) 0.0% 50.0% (2) Tight job market 50.0% (2) 25.0% (1) 0.0% Lack of marketable skills 0.0% 75.0% (3) 0.0% Lack of educational qualifications 0.0% 0.0% 75.0% (3) Reputation of Southeastern 0.0% 25.0% (1) 50.0% (2) Lack of experience 50.0% (2) 0.0% 25.0% (1) Lack of job search skills 0.0% 50.0% (2) 25.0% (1) Poor GPA 0.0% 0.0% 75.0% (3) Racial discrimination 0.0% 0.0% 75.0% (3) Gender discrimination 0.0% 0.0% 75.0% (3) Age discrimination 0.0% 0.0% 75.0% (3) Seven of the respondents (63.6%) indicated their education was “Effective” in preparing them for employment or improving job performance, two (18.2%) indicated it was “Ineffective”, and one (9.1%) indicated it was “Very Ineffective.” Three (27.3%) of the respondents indicated that they are currently in their first full-time job since graduating from Southeastern, three (27.3%) are in their second full-time job, and three (27.3%) have had three or more full-time jobs. In regards to sources for learning about their first full-time job, one (9.1%) indicated faculty at Southeastern, one (9.1%) from a parent or relative, three (27.3%) were recruited by the employer, one (9.1%) already had the job, and three (27.3%) from internship, practicum, or student teaching. Of the nine respondents who are currently working full-time, seven (77.8%) are employed in the state of Louisiana and two (22.2%) are employed out of state. One respondent (11.1%) is employed in a service organization, one (11.1%) is employed in K-12 education, one (11.1%) is employed in a professional firm, one (11.1%) is self-employed, one (11.1%) is employed in government, and four (44.4%) are employed in business. When asked “If underemployment is defined as a condition in which your job requires lower levels of skill and training than those you acquired in college, would you say that you are currently underemployed”, eight (88.9%) respondents felt they are not underemployed, while one (11.1%) felt he/she is underemployed. When asked about satisfaction with their present employment, three (33.3%) of the respondents are “Well satisfied; would not consider leaving”; four (55.6%) are “Satisfied, but would consider more desirable employment”; and one (11.1%) “Dislikes employment; seeking or will seek other employment”.

Page 155
Four (44.4%) of the respondents are currently employed in the area of their Southeastern major, one (11.1%) is employed in an area related to his/her Southeastern major, and four (44.4%) are employed in an area not related to their Southeastern major. One of the four is employed out of the field because of better pay, two could not find a job they wanted in the field, and one would have to relocate for a job in the field. One (11.1%) of the respondents indicated a salary range of $20,001-$25,000, four (44.4%) gave a salary range of $25,001-$30,000, three (33.3%) gave a salary range of $30,001-$40,000, and one (11.1%) gave a salary range of over $50,000.
Professional Activities Two (18.2%) of the respondents indicated certification/licensure is not available in their field, four (36.4%) do not hold certification/licensure, and five (45.5%) hold licensure/certification. One is a licensed athletic trainer, one has LHEA PEC Insurance, one has APEX, ACE, AFFA, and one has a teaching certificate. None of those without certification/licensure plan on obtaining it within the next 12 months. Four (36.4%) of the respondents are members of a professional organization, and six (54.5%) have attended a professional meeting in the past year.

Page 156
School of Nursing
Table 65 Satisfaction with Degree Program
Number of Respondents: B.S. Nursing-28
Very Dissatisfied - 1
2
3
4
Very Satisfied - 5
Overall quality of your department B.S. Nursing 0.0% 7.1%(2) 10.7%(3) 46.4%(13) 32.1%(9) Overall quality of your degree program B.S. Nursing 3.6%(1) 3.6%(1) 10.7%(3) 50.0%(14) 28.6%(8) Clarity of the degree requirements as outlined in the catalogue and/or curriculum sheets B.S. Nursing 0.0% 0.0% 14.3%(4) 39.3%(11) 42.9%(12) Usefulness of the academic advice you received from your advisor B.S. Nursing 0.0% 10.7%(3) 32.1%(9) 32.1%(9) 21.4%(6) Opportunities to interact with faculty outside of class B.S. Nursing 0.0% 0.0% 25.0%(7) 39.3%(11) 32.1%(9) Effectiveness of the faculty as teachers B.S. Nursing 0.0% 7.1%(2) 28.6%(8) 42.9%(12) 17.9%(5) Friendliness and helpfulness of the office staff B.S. Nursing 0.0% 0.0% 14.3%(4) 50.0%(14) 32.1%(9) Interest shown by faculty in your academic development B.S. Nursing 0.0% 3.6%(1) 28.6%(8) 42.9%(12) 21.4%(6) Effectiveness of beginning courses in preparing you for advanced courses B.S. Nursing 0.0% 0.0% 42.9%(12) 35.7%(10) 17.9%(5) Quality of instruction in advanced courses B.S. Nursing 0.0% 7.1%(2) 21.4%(6) 50.0%(14) 14.3%(4) Professional activities, associations, or clubs B.S. Nursing 3.6%(1) 7.1%(2) 42.9%(12) 28.6%(8) 14.3%(4) Practicum, internship, clinical, or other hands-on experiences outside of the classroom B.S. Nursing 0.0% 10.7%(3) 21.4%(6) 42.9%(12) 21.4%(6) Opportunity for meaningful interaction with faculty in research or other scholarly activityB.S. Nursing 3.6%(1) 10.7%(3) 21.4%(6) 46.4%(13) 14.3%(4) Availability of the required courses B.S. Nursing 3.6%(1) 0.0% 32.1%(9) 21.4%(6) 39.3%(11)

Page 157
Table 65 continued
Satisfaction with Degree Program School of Nursing
Number of Respondents: B.S. Nursing-28
Very Dissatisfied - 1
2
3
4
Very Satisfied - 5
Availability of elective courses you wanted to take in your major B.S. Nursing 0.0% 0.0% 21.4%(6) 46.4%(13) 28.6%(8) Quality of instruction regarding standards and ethics in your major field B.S. Nursing 0.0% 7.1%(2) 14.3%(4) 42.9%(12) 32.1%(9)Friendliness and helpfulness of faculty B.S. Nursing 3.6%(1) 3.6%(1) 25.0%(7) 39.3%(11) 25.0%(7)Opportunities for you to collaborate with other students on class projects B.S. Nursing 3.6%(1) 0.0% 10.7%(3) 32.1%(9) 50.0%(14)Computer resources (PC and/or mainframe) for courses in your major B.S. Nursing 0.0% 0.0% 14.3% 50.0%(14) 32.1%(9)Library resources related to your major B.S. Nursing 0.0% 7.1%(2) 10.7%(3) 39.3%(11) 39.3%(11)Use of appropriate technology in the classroom B.S. Nursing 0.0% 3.6%(1) 14.3%(4) 53.6%(15) 25.0%(7)Facilities and equipment related to your major B.S. Nursing 0.0% 7.1%(2) 17.9%(5) 39.3%(11) 28.6%(8)Help/encouragement you received from faculty in your department with regard to further educational opportunities B.S. Nursing 3.6%(1) 0.0% 35.7%(10) 28.6%(8) 28.6%(8)The size of classes in your major B.S. Nursing 3.6%(1) 0.0% 14.3%(4) 35.7%(10) 42.9%(12)Encouragement you received from faculty in your department with regard to finding employment in your field B.S. Nursing 3.6%(1) 3.6%(1) 21.4%(6) 39.3%(11) 28.6%(8)Global perspectives presented in courses B.S. Nursing 0.0% 3.6%(1) 35.7%(10) 35.7%(10) 21.4%(6)Overall relevancy of courses B.S. Nursing 0.0% 0.0% 21.4%(6) 53.6%(15) 21.4%(6)

Page 158
Table 65 continued
Satisfaction with Degree Program School of Nursing
No Yes 2. Would you recommend Southeastern to someone interested in what you majored in? B.S. Nursing 14.3%(4) 82.1%(23) 3. If you had it to do over again, would you choose the same major?
B.S. Nursing 0.0% 82.1%(25);14.3%(4) Not at Southeastern
4. Did you participate in an internship, a practicum, a clinical experience, or student teaching as part of your degree requirements?
B.S. Nursing 3.6%(1) 89.3%(25) 6. Should a hands-on course be required in your program? B.S. Nursing 0.0% 89.3%(25) When asked what benefits they received from hands-on experience, Nursing graduates had the following to say:
“Able to learn more - effective by actually applying skills”
“Made me more prepared for profession at graduation”
“Hospital settings; patient, nurse and doctor interaction”
“This is a must in nursing. (Equipment) but needed more clinical.”
“Need to be in hospital clinical more and need less of projects”
“Confidence”
“Clinical helped with application of knowledge”
“Interactions with pts in real world situations ie hospitals, clinics, health education”
“Real life expectations”
“Internship- 3 months of hands-on experience with one-on- one orintation to unit, hands-on clinical skills allowed for me to become more competent and build the confidence I needed to start my nursing career.”
“Understanding of nursing in “real world” situations. It is not always ‘by the book:’”

Page 159
“It helped prepare me for my role in the work force.” “Helped me to become the RN I am today!”
“Needed more clinical experience”
“Confidence, proficiency, practice, retention, etc.”
“Data related to population served by social service agency. Experience in dealing with poverty and rural area concerns.”
“Introduced to work force, able to work with someone who had plenty years of experience.”
Perceptions of Southeastern
B.S. Nursing None of the Nursing graduates participated in the study-abroad/student exchange, but 78.6% (n=22) thought it would be a valuable experience. Seven (25.0%) of the respondents participated in the honors program. Two (28.6%) were Very Satisfied with the honors program, four (57.1%) were Somewhat Satisfied, and one (14.3%) was Somewhat Dissatisfied. Thirteen (46.4%) of the respondents participated in a research program. Four (30.8%) were Very Satisfied with the experience, seven (53.8%) were Somewhat Satisfied, and two (15.4%) were Very Dissatisfied.
Graduate/Professional Education Three (10.7%) of the respondents are currently enrolled in a degree program. Two (7.1%) respondents have taken classes but not enrolled in a degree program. One (3.3%) of the respondents plans to enroll in a degree program in the next 12 months, and twelve (42.9%) are likely to enroll in a degree program in the future. Ten (35.7%) of the respondents have no plans for further education. All eighteen of the respondents with plans for graduate plan on obtaining a master’s. Of the five individuals with graduate school experience, four (80.0%) respondents indicated that Southeastern prepared them “Effectively” for graduate/professional and one (20.0%) was prepared “Very Effectively”. Furthermore, one respondent (20.0%) indicated that Southeastern prepared her/him “Better than Most” other students and four (80.0%) indicated “About the Same as Most”. The three respondents who are currently enrolled in a degree program indicated it was “Very Closely Related” to their bachelor’s degree from Southeastern.
Employment Almost ninety percent of the respondents (89.3%, n=25) are employed full-time, with three (10.7%) employed part-time and satisfied with part-time employment. Ten (35.7%) of the respondents had a full-time job before completing their degree, four (14.3%) accepted a position

Page 160
upon graduation, ten (35.7%) respondents obtained a job 1-6 months after graduation, one (3.6%) respondent has never had a full-time job, but has looked for one, and one (3.6%) has never looked for a full-time job. The eleven respondents who did not have a job upon graduation faced a variety of problems in obtaining employment. Table 66 presents what were considered major problems, minor problems, or no problem.
Table 66 Please indicate whether each of the following was a major problem, minor problem, or not a problem in obtaining employment after graduating from Southeastern with your Bachelors. Major Problem Minor Problem Not A Problem Limited to only one geographic area 0.0% 18.2% (2) 72.7% (8) Not knowing what I wanted to do 0.0% 9.1% (1) 81.8% (9) Tight job market 27.3% (3) 27.3% (3) 36.4% (4) Lack of marketable skills 0.0% 9.1% (1) 81.8% (9) Lack of educational qualifications 0.0% 0.0% 90.9% (10) Reputation of Southeastern 0.0% 9.1% (1) 81.8% (9) Lack of experience 27.3% (3) 45.5% (5) 18.2% (2) Lack of job search skills 0.0% 9.1% (1) 81.8% (9) Poor GPA 0.0% 0.0% 90.9% (10) Racial discrimination 0.0% 0.0% 90.9% (10) Gender discrimination 0.0% 0.0% 90.9% (10) Age discrimination 0.0% 0.0% 90.9% (10) Seven of the respondents (29.6%) indicated their education was “Very Effective” in preparing them for employment or improving job performance, eight (33.3%) indicated it was “Effective”, and three (12.5%) indicated it was “Very Ineffective.” Eleven (45.8%) of the respondents indicated that they are currently in their first full-time job since graduating from Southeastern and eight (33.3%) are in their second full-time job. In regards to sources for learning about their first full-time job, three (12.5%) indicated faculty at Southeastern, one (4.2%) from another student or friend, one (4.2%) was recruited by the employer, one (4.2%) already had the job, and two (8.3%) from internship, practicum, or student teaching. One of the respondents employed full-time did not complete this section of the survey, so these results are based on twenty-four respondents. Twenty (83.3%) of the respondents are employed in the state of Louisiana and four (16.7%) are employed out of state. Twenty (83.3%) of the respondents are employed in a service organization, one (4.2%) in a business, one (4.2%) in a professional firm, and one (4.2%) is self-employed. When asked “If underemployment is defined as a condition in which your job requires lower levels of skill and training than those you acquired in college, would you say that you are currently underemployed”, twenty (83.3%)

Page 161
respondents felt they are not underemployed, while two (8.3%) felt they are underemployed. When asked about satisfaction with their present employment, sixteen (66.7%) of the respondents are “Well satisfied; would not consider leaving”; six (25.0%) are “Satisfied, but would consider more desirable employment”; and one (4.2%) “Dislikes employment; seeking or will seek other employment”. All twenty-four are currently employed in the area of their Southeastern major. One (4.2%) of the respondents indicated a salary range of $25,001-$30,000, seven (29.2%) gave a range of $30,001-$40,000, ten (41.7%) gave a range of $40,001-$50,000 and five (20.8%) indicated an annual salary over $50,000.
Professional Activities One (3.6%) of the respondents does not have licensure/certification but plans on obtaining Prenatal/Newborn Care Certification in the next twelve months. Twenty-seven (96.4%) currently hold certification/licensure as a registered nurse. Thirteen (46.4%) of the respondents are members of a professional organization, and fourteen (50.0%) have attended a professional meeting in the past year.
Special Questions All of the respondents completed the insert which contained questions specifically for Nursing alumni. The majority of the respondents (85.7%, n=24) reported that they work in a hospital, while four (14.3%) work in a clinical/outpatient setting, and one (3.6%) works as a travel nurse. When asked what their current speciality in nursing is, 10.7% (n=3) reported adult/gerontology, one (3.6%) reported psychiatric/mental health, six (21.4%) reported newborn/pediatrics, five (17.9%) reported women’s/perinatal, six (21.4%) reported surgery/operating room, four (14.3%) reported the ER, two (7.1%) reported dialysis, and one (3.6%) reported cardiology. The majority of the respondents (89.3%, n=25) indicated that the title of their nursing position is staff, while three (10.7%) reported an “other” title (they were Nurse Manager, Head Nurse, Psych Charge Nurse). Forty-two percent (35.7%, n=10) of the respondents belong to a professional organization, with two (20.0% of those who belong to a professional organization) belonging to ANA, one (10.0%) belonging to a Clinical Specialty Organization, five (50.0%) belonging to an Honorary Professional Association, and six (60.0%) belonging to some “other” organization (six indicated AORN, one indicated SLU Honor Society, and one indicated Association Pediatric Oncology Nurses, APON). One (3.6%) of the respondents currently holds a position of office in a professional organization. Five respondents (17.9%) have conducted and/or participated in professional research, but none have published in a professional nursing journal. The majority of respondents (64.3%, n=18) are satisfied with their preparation to collaborate with interdisciplinary health team members, while seven (25.0%) are very satisfied, one (3.6%) is dissatisfied, and two (7.1%) are very dissatisfied. The majority of respondent’s (57.1%, n=16)
Page 162
participated in 5 or more continuing education activities during the past year, while eleven (39.3%) participated in 2-4 activities, and one (3.6%) participated in 0-1 activities. Over half (53.6%, n=15) currently hold professional specialty certification in addition to Registered Nurse licensure and required certification. Below is a list of community service activities to which respondents have contributed within the last five years. ! High schools and middle schools in St. Tammany parish to teach about drug and tobacco
use. ! Educating teenagers about drug use. ! Baby Grand; Christmas family adoption; worked golf tournament for heart transplant
recipients ! Louisiana Hemophelia Foundation; Kids Kickin Cancer ! Relay for Life A quarter of the respondents (25.0%, n=7) do not plan on pursuing an advanced degree. Over half (57.1%, n=16) plan on pursuing a Nursing degree and 17.9% (n=5) plan on pursuing some “Other” degree. The “Other” degrees include: Undecided, business, education, MBA, MBA.


