12
UMAINE SOCIOLOGY ALUMNI SURVEY 2/19/2013 Final Results This report summarizes final results from the 2012 Online Survey of the University of Maine Sociology Alumni.
UMAINE SOCIOLOGY ALUMNI SURVEY
2/19/2013 Final Results
This report summarizes final results from the 2012 Online Survey of the
University of Maine Sociology Alumni.

UMaine Sociology Alumni Survey
Page 1
UMaine Sociology Alumni Survey F I N A L R E S U L T S
INTRODUCTION
In order to ensure academic departments are successful in achieving their goals and providing the most high quality education possible, it is necessary to obtain feedback from those who have been students within those departments. To this end, in the fall of 2012, the University of Maine Sociology Department conducted an online survey of its alumnus. The project was carried out as part of an applied “Survey Research Practicum” in which students assisted with the development, construction, dissemination, and analysis of the survey. The project was led by Michael Rocque, PhD, and Amy Blackstone, PhD, with assistance and input from the entire Sociology faculty/staff. The participating students were Linda Fogg, Mark Brunton, Jacob Gaudreau, Mazie Pierce, and Carmen Linden.
A similar survey is being done by the ASA bachelor’s and beyond project (http://www.asanet.org/research/current_research_projects.cfm#bachelors). Their survey is being used to measure the usefulness of the Sociology major and the graduates’ participation in the job market after graduation. The UMaine alumni survey also sought to measure success in the job market and usefulness of Sociology degrees as well, but our sample is of people who have already graduated, not those who graduated in 2012. We were interested in completing this survey to understand the opportunities a sociological major can produce in the job market. We were also interested in seeing people’s opinions of the department, and the usefulness of their degree. In this preliminary report, we describe the methods, survey instrument, and results that have been compiled to date.
Methods
Because of resource limitations, the University of Maine Sociology Department decided to conduct an online-only survey, with no compensation. This required access to alumni email addresses, which resulted in coverage error (not every alumni provides an email address and it is unknown the degree to which changes in email address are communicated to the University). The survey was constructed based upon a preliminary draft written by the UMaine Sociology faculty. This draft was revised and translated into an electronic survey software program (Qualtrics, http://www.qualtrics.com). The survey was completed in October of 2012, and disseminated by the UMaine Alumni Association (http://www.umainealumni.com/) using Constant Contact (http://search.constantcontact.com/index.jsp). An initial contact, indicating a survey would be sent in the near future, was sent on October 17, 2012. This precontact letter is included as Appendix A. The survey email was then sent on the 29th of October, 2012. The text of the invitation to the survey is included as Appendix B. Approximately 45 respondents completed the survey as a result of this initial invitation.
A follow up was sent, following the advice of Dillman, Smyth, and Christian (2009), in a different format (using the Qualtrics email technology) on November 11, 2012. This message (Appendix C), thanked those who completed the survey and reminded those who had not that they can still do so. As of January 14,
2013, 87 responses had been collected and are the subject of the analyses reported below. During the
UMaine Sociology Alumni Survey
Page 2
dissemination of the alumni survey, it was discovered that several email addresses on file were either not valid or no longer in use. In addition, one member of the sample asked to be removed for the list. Thus, 44 cases were removed from the final sample. This left an eligible sample of 326. Our response rate for this report, then is 27%.
DESCRIPTIVE RESULTS
Characteristics of Respondents: Gender Mazie Pierce
Our total sample resulted in 87 responses. Within the sample, 75.3% (64/85) are female and 25.6% (21/85) are male. There were two respondents who did not answer this question which results in the 2.3% (2/87) that is missing. Approximately 17.6% (15/85) of respondents completed another undergraduate degree besides their bachelor’s in Sociology. Of that 17.6%, 67% (10/15) were female and 33% (5/15) were male. Seventy percent (7/10) of the women with a second undergraduate degree completed it at the University of Maine while 80% (4/5) of men also completed their second undergraduate degree at UMaine. Currently 46.4% (39/84) of UMaine Sociology alumni are employed full time (full time defined as 30 hours per week) while approximately 53.6% (45/84) are not employed full time (this does not mean that they are unemployed). Of those employed full time, 72% (28/39) are female and 28% (11/39) are male. The most frequent industry characterizing the current job sociology alumni are employed in is healthcare and social assistance (21.1%). For females, education (n=5) and healthcare/social assistance (n=5) were the most frequent industries. For males, financial (n=3) and healthcare/social assistance (n=3) were the modal categories. When asked about the job that they found the most important that they had had over their entire career (or at least up to this point in their career), 15.6% (12/77) responded with “social work” or “case manager” with 92% (11/12) being female and 8% (1/12) being male. Thus, the most frequent job for alumni involved some sort of helping profession. While the respondents were students at the University of Maine, the average grade point average (GPA) was between a 2.6 and 3.6. Only 1.3% (1/76) had a GPA of 1.6-2.0 (a male). Of those with a GPA of 2.1-2.9, 6.6% (5/76) were females and 3.9% (3/76) were males; of those with a GPA of 2.6-3.0, 17.1% (13/76) were females and 6.6% (5/76) were males. In the 3.1-3.59 GPA range, 36.8% (28/76) of respondents were female and 5.3% (4/76) were male and in the 3.6-4.0 GPA range, 14.5% (11/76) of respondents were female and 7.9% (6/76) were male. See Table 1 for more information. As part of the survey, we asked respondents to rate their satisfaction with the sociology program. The results are shown in table 2. First, we asked, on a 7 point scale (very dissatisfied to very satisfied), how satisfied they were with the program. Nearly everyone (89.7% or 70/78) was at least “somewhat satisfied” with their Sociology education at UMaine. Of these respondents, 65.3% (51/78) were female while 24.4% (19/78) were male. Of those at “very dissatisfied, dissatisfied, or somewhat dissatisfied” (3.9% of respondents or 3/78), 2.6% (2/78) were female and 1.3% (1/78) were male. There were five females, or 6.5% (5/78), who felt neutral about their satisfaction with their UMaine Sociology education. We also asked respondents to rate the quality of education they received (from excellent=5 to poor=1). Again almost all of the respondents felt that the quality of their UMaine Sociology education was at least “good” at 91% (71/78). Of those respondents, 27.6% (16/58) females and 20% (4/20) males felt that their education was “excellent.” The modal response for this question was “very good” with 65.4%. No one responded that they felt that the quality of their UMaine Sociology education was “poor.”

UMaine Sociology Alumni Survey
Page 3
Table 1. GPA by Gender (N=76)
Female Male Total
GPA 1.0-1.59 0% (0/57) 0% (0/19) 0% (0/76)
1.6-2.0 0% (0/57) 5.3% (1/19) 1.3% (1/76)
2.1-2.59 8.8% (5/57) 15.8% (3/19) 10.5% (8/76)
2.6-3.0 22.8% (13/57) 26.3% (5/19) 23.7% (18/76)
3.1-3.59 49.1% (28/57) 21.1% (4/19) 42.1% (32/76)
3.6-4.0 19.3% (11/57) 31.6% (6/19) 22.4% (17/76)
Total 75% (57/76) 25% (19/76) 100% (76/76)
Table 2. Satisfaction of Sociology Education by Gender (N=78)
Female Male Total
Satisfaction At least “somewhat satisified”
87.9% (51/58) 95% (19/20) 89.7% (70/78)
“Neutral” 8.6% (5/58) 0% (0/20) 6.4% (5/78)
“Very dissatisfied, dissatisfied or somewhat dissatisfied”
3.4% (2/58) 5% (1/20) 3.8% (3/78)
Total 74.3% (58/78) 25.6% (20/78) 100% (78/78)
UMaine Sociology Alumni Survey
Page 4
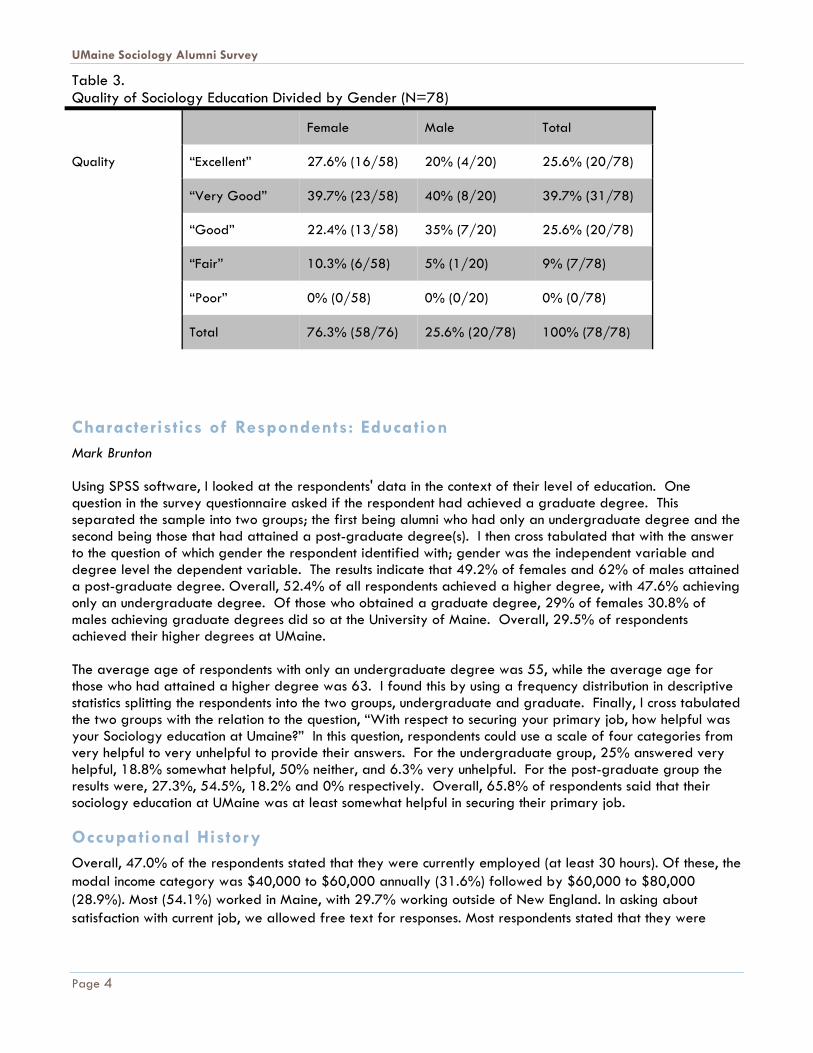
Table 3. Quality of Sociology Education Divided by Gender (N=78)
Female Male Total
Quality “Excellent” 27.6% (16/58) 20% (4/20) 25.6% (20/78)
“Very Good” 39.7% (23/58) 40% (8/20) 39.7% (31/78)
“Good” 22.4% (13/58) 35% (7/20) 25.6% (20/78)
“Fair” 10.3% (6/58) 5% (1/20) 9% (7/78)
“Poor” 0% (0/58) 0% (0/20) 0% (0/78)
Total 76.3% (58/76) 25.6% (20/78) 100% (78/78)
Characteristics of Respondents: Education Mark Brunton Using SPSS software, I looked at the respondents' data in the context of their level of education. One question in the survey questionnaire asked if the respondent had achieved a graduate degree. This separated the sample into two groups; the first being alumni who had only an undergraduate degree and the second being those that had attained a post-graduate degree(s). I then cross tabulated that with the answer to the question of which gender the respondent identified with; gender was the independent variable and degree level the dependent variable. The results indicate that 49.2% of females and 62% of males attained a post-graduate degree. Overall, 52.4% of all respondents achieved a higher degree, with 47.6% achieving only an undergraduate degree. Of those who obtained a graduate degree, 29% of females 30.8% of males achieving graduate degrees did so at the University of Maine. Overall, 29.5% of respondents achieved their higher degrees at UMaine. The average age of respondents with only an undergraduate degree was 55, while the average age for those who had attained a higher degree was 63. I found this by using a frequency distribution in descriptive statistics splitting the respondents into the two groups, undergraduate and graduate. Finally, I cross tabulated the two groups with the relation to the question, “With respect to securing your primary job, how helpful was your Sociology education at Umaine?” In this question, respondents could use a scale of four categories from very helpful to very unhelpful to provide their answers. For the undergraduate group, 25% answered very helpful, 18.8% somewhat helpful, 50% neither, and 6.3% very unhelpful. For the post-graduate group the results were, 27.3%, 54.5%, 18.2% and 0% respectively. Overall, 65.8% of respondents said that their sociology education at UMaine was at least somewhat helpful in securing their primary job.
Occupational History Overall, 47.0% of the respondents stated that they were currently employed (at least 30 hours). Of these, the modal income category was $40,000 to $60,000 annually (31.6%) followed by $60,000 to $80,000 (28.9%). Most (54.1%) worked in Maine, with 29.7% working outside of New England. In asking about satisfaction with current job, we allowed free text for responses. Most respondents stated that they were

UMaine Sociology Alumni Survey
Page 5
satisfied, with only 3 respondents stating that they were somewhat or not satisfied. On average, people currently employed worked just over 40 hours (median was also 40 hours).
We also asked the alumnus whether they had ever (since graduation) had a job that really fulfilled them. Over 90% of the respondents answered in the affirmative. Of the 36 respondents who said that they were satisfied with the Sociology education they received at UMaine, 33 said that they had a job that really fulfilled them. We then asked how long it took them, after graduation, to find this job. While the answers varied, the modal response was less than a year (37.5%). However, 31.9% stated that it took them 5 or more years to find the fulfilling job. Part of the reason that a good job took longer to find might have been because several respondents went to graduate school. Of those with a graduate degree, 37.5% said that it took 5 or more years to find a fulfilling job (compared to just 25% of those without a graduate degree).
Satisfaction with UMaine Sociology Education Linda Fogg
The survey included several questions regarding satisfaction with the UMaine Sociology education. First, respondents were asked how satisfied they were with their experience at UMaine. A total of 78 people had valid responses to this question, with 74.3% answering either Very Satisfied or Satisfied. Only one respondent answered that they were very dissatisfied with the education they received. With respect to the ratings of the quality of education received, 65.4% (of 78 respondents) answered that their education was Excellent or Very Good. Respondents rated their academic advising lower, with 46.2% stating that their advising was either Excellent or Very Good. Importantly, 68.2% of respondents stated that “if you could do it all over again” they would still have majored in Sociology.
Figure 1. Satisfaction with Education
0.0
10.0
20.0
30.0
40.0
50.0
Very dissatisfied
Somewhat dissatisfied
Neutral Somewhat satisfied
Satisfied Very satisfied
Perc
enta
ge
Satisfied with Education (N=78)

UMaine Sociology Alumni Survey
Page 6
Figure 2. Ratings of Quality of Education and Advising
Reasons for Majoring in Sociology and Applications of Education Carmen Linden
The question of why University of Maine Sociology Department alumni decided to major in sociology was explored through a matrix of questions allowing respondents to rank how different factors affected their decision to study sociology. Finding that the sociology major required fewer credits than other majors affected the respondents’ decisions to major in sociology the least. Only 4.3 percent of those who responded considered this statement to be very important and 88.4 percent of respondents considered it not important. The next least important factor to the respondents when choosing to major in sociology was that they had heard good things about the sociology department. Only 5.6 percent of respondents considered this to be very important when they were deciding on their major.
The factor that was most important to the respondents when choosing to major in sociology was that they found the concepts to be interesting. Fully 80.8 percent of respondents said that this factor was very important when choosing their major. The second most important factor for choosing to be a sociology major was that they enjoyed the first class in sociology that they experienced, with 61.1 percent of respondents considering this to be very important to their decision. For complete results showing the importance of all the factors measured for choosing sociology as a major, see figure x. Of the 44 respondents who answered that their first course interested them as a reason to major in Sociology, 79.5% of those people were also satisfied or very satisfied with their UMaine education in Sociology. This could mean that people who take a course in Sociology and enjoy it are also likely to major in it. These people believed that it was important to their decision to major in Sociology that they enjoyed their first course. Also using a matrix, the question of what skills the respondents felt they developed through studying sociology at the University of Maine was examined. Respondents were asked to rank, using a five point scale from strongly agree to strongly disagree whether, as part of their sociology major, they learned to do the factors listed. The skills the respondents felt they developed the most were to write sociological reports that non-sociologists could understand and to gather information to make an argument based on evidence. For the first,
0.0
5.0
10.0
15.0
20.0
25.0
30.0
35.0
40.0
45.0
Excellent Very Good
Good Fair Poor
Perc
enta
ge
Academic Advising and Quality of Education (N=78)
Academic Advising
Quality of Education

UMaine Sociology Alumni Survey
Page 7
22.9 and 44.3 percent of respondents answered strongly agree and agree, respectively. For the second, respondents answered 21.7 and 52.2 percent strongly agree and agree, respectively. Many also felt they were able to identify ethical issues in sociology thanks to their sociology degree, with 21.4 percent of respondents strongly agreeing that they could and 47.1 percent of respondents agreeing that they could.
The least number of respondents felt they became proficient using standard statistical software packages like SPSS, SAS or Strata to analyze data. Only 8.5 percent of respondents strongly agreed that they could use these software packages, while 53.5 percent strongly disagreed. Many respondents also disagreed that they became proficient in using computers to find information to develop a bibliography or a list of references within their studies in sociology. Only 12.7 percent of respondents strongly agreed that their studies helped them become proficient in these areas, while 47.9 percent strongly disagreed. See figure x for the full results of this analysis.

UMaine Sociology Alumni Survey
Page 8
Figure 3. reasons for majoring in sociology
0
10
20
30
40
50
60
70
80
90
100
Very Important
Somewhat Important
Not Important
Why Study Sociology?
PERCENT

UMaine Sociology Alumni Survey
Page 9
Figure 4. Skills Learned
0 20 40 60
Create a hypothesis with independent and dependent variables
Use computers to find information to develop a bibliography or a list of references
Use standard statistical software packages to analyze data
Evaluate strengths and weaknesses of different research methods
Gather information to make an argument based on evidence
Discuss percentages and tests of significance in a two variable table
Interpret the results of different types of data
Identify ethical issues in sociological research
Write a report from sociological information that can be understood by non-sociologists
Strongly DisagreeDisagree
Neither Agree Nor DisagreeAgree
Strongly Agree
Skills Learned as a Sociology Major
Percent

UMaine Sociology Alumni Survey
Page 10
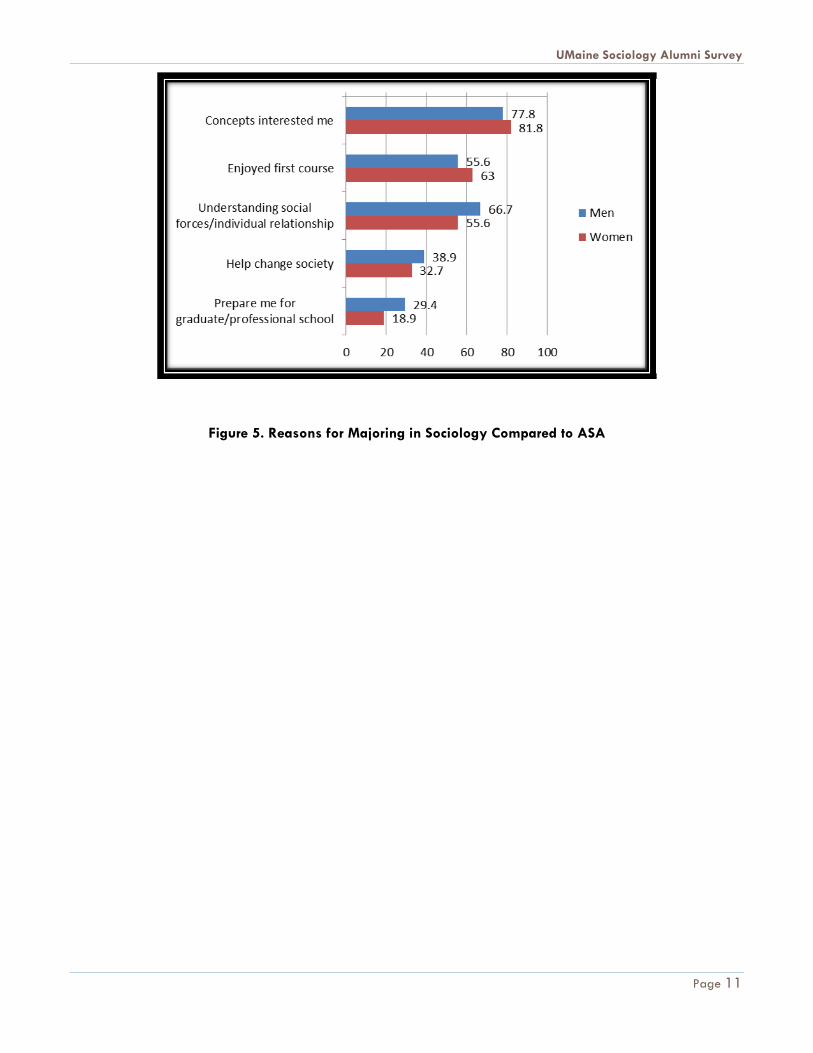
Comparison to the American Sociological Association’s Bachelor’s and Beyond Survey As mentioned above, the Sociology Alumni survey included a battery of items taken from the American Sociological Association’s (ASA) Bachelor’s and Beyond survey. This permits us to compare responses. Below, we examine the reasons for majoring in sociology, by gender. The first figure displays results from the ASA survey (conducted in 2005). As can be seen, there are similarities between the two samples. The largest percentage in each sample stated that they majored in sociology because the concepts interested them (the percentages indicate those who stated the reason was “very important”). “Preparing me for graduate school” was not important relatively for either sample.
However, there were differences as well between the two samples. For example, the second most important reason for majoring in sociology was that the respondents enjoyed their first course in the ASA samples, while it was understanding the relationship between the social world and individuals in the UMaine sample. in the ASA survey, a greater percentage of men felt that “concepts interested me” and “enjoyed the first course” were very important reasons for majoring in sociology; the opposite was true in the UMaine alumni survey. In addition, a greater percentage of UMaine alumnus felt that “help change society” was very important than felt sociology would help them “understand social forces”. The opposite was true in the ASA survey.
The largest difference between men and women for the ASA sample was with respect to “help change society” item, where there was a 12.5% difference, with men indicating this was a more important reason for majoring in sociology. For the UMaine sample, the largest difference was with respect to the “understand the relationship between society and individuals” items, where 11.1% more males thought this was very important compared to females.
UMaine Sociology Alumni Survey
Page 11
Figure 5. Reasons for Majoring in Sociology Compared to ASA


