73
Surveying the Surveys: Review of quantitative research findings on volunteering in Northern Ireland By Meta Zimmeck 2018
Surveying the Surveys: Review of
quantitative research findings on
volunteering in Northern Ireland
By Meta Zimmeck
2018
1
BACKGROUND
This report is one of a suite of reports commissioned by Volunteer Now as part of a legacy
project for Building Change Trust. The reports provide an overview of academic and statistical
research about volunteering in Northern Ireland from 1995 to date. They provide an evidence
base for organisations involving volunteers to plan their work and for government in supporting
volunteers.
INTRODUCTION
This report reviews the information produced by quantitative surveys of volunteering in
Northern Ireland with the aim of exploring trends and gaps – for volunteering generally,
volunteering at local council level and volunteering by persons belonging to the section 75
groups, those to whom under section 75 of the Northern Ireland Act 1998 public authorities
have a duty to promote equality of opportunity:
‘(a) between persons of different religious belief, political opinion, racial group, age,
marital status or sexual orientation;
(b) between men and women generally;
(c) between persons with a disability and persons without; and
(d) between persons with dependents and persons without’.
Due to limitations in available information, it does not deal with volunteering at local council
level and certain of the section 75 groups (persons with different political opinions and sexual
orientations) in this review. We have, however, prepared a detailed report of findings from the
Census 2011, which examines volunteering in greater detail, especially at local council level.
Set out below, mainly in schematic form, is an analysis of quantitative information on
volunteering overall and by the section 75 groups for which information is available. The
sources used are reports and data tables from the following sixteen surveys:
• National Surveys of Volunteering 1991 and 1997 (Volunteer Centre UK/Institute for
Volunteering Research)
• Continuous Household Surveys 1991-92, 2008-09, 2012-13 and 2013-14 (Northern
Ireland Statistics and Research Agency)
• Volunteering in Northern Ireland 1995, 2001, 2007 (Volunteer Development
Agency/Volunteer Now)
• Northern Ireland Sport and Physical Activity Survey 2009-10 (Sport Northern Ireland)
• Northern Ireland Census 2011 (Northern Ireland Statistics and Research Agency)
• Northern Ireland Omnibus Surveys 2012, 2013, 2014, 2015, 2016 (Northern Ireland
Statistics and Research Agency for clients in government departments).
The report also offers observations, based on this review of existing quantitative surveys,
about the collective weaknesses of this research and possible ways in which future research
might be carried out in order to achieve the best possible quality and usefulness. The report
considers emerging requirements for monitoring progress in implementing major programmes

2
in community development and planning by local councils and of the desirability of including
measures of volunteering in this monitoring.

3
CONTENTS
Page 4: A Critique of the quality and usefulness of existing quantitative information.
Page 8: Some suggestions for carrying out future quantitative research.
Page 10: Headline participation in volunteering in Northern Ireland.
Page 13: Headline participation in volunteering in England, Scotland and Wales: a
comparison.
Page 25: Volunteering by age.
Page 30: Volunteering by age and sex.
Page 34: Volunteering by disability status.
Page 37: Volunteering by ethnic group.
Page 39: Volunteering by religion or religion brought up in.
Page 44: Volunteering by marital/civil status.
Page 47: Volunteering by dependents.
Page 50: Appendix: Survey methodology.

4
1. A critique of the quality and usefulness of existing quantitative research Studies of volunteering may have two uses. The first is for the here and now, in order to
address immediate concerns, such as providing inputs to policy formation (e.g. consultations,
lobbying); monitoring performance against targets; and improving practical arrangements for
recruiting, training, managing and retaining volunteers. The second is for the future, in order
to gain and retain public recognition of the value of volunteering; to understand the processes
of volunteering, such as people’s propensity to volunteer in certain fields, activities and
locations and at certain times of their lives; and to take appropriate steps to support
volunteering in changing times.
Understanding of the shape and development of volunteering in the UK to a large extent has
been based on what has happened in England and Scotland, where substantial political
interest and consequential investment in research have delivered time series of high quality
information. What has happened in Northern Ireland and, to a greater extent, Wales has been
relatively poorly documented and therefore not taken into account. This means that what are
generally accepted as ‘norms’ for volunteering may not be as normative as advertised and
that they should be revised to reflect the experiences of all parts of the UK.
As can be seen from our analysis below, quantitative research on volunteering in Northern
Ireland has been patchy. Different providers have operated in silos, with different reasons for
carrying out this research, different expectations of how it is to be used, different methods of
carrying it out and different resources dedicated to it. In aggregate the result is less than
satisfactory. However, it should be noted that the jewel in the crown of Northern Ireland’s
research on volunteering is the Census 2011, which for the first time in the UK included a
question on volunteering and provides very high quality information about the demographics
of volunteering and, in particular, volunteering at local council level.
There are a number of reasons for problems with quantitative research on volunteering in
Northern Ireland. These include differences in:
Relative importance given to volunteering as a subject: In surveys profile and placement
matter for the quantity and quality of responses. A survey that is all about volunteering has an
advantage over questions dropped in at the end of an omnibus (after, say, questions on
recycling or pet ownership). The two National Surveys of Volunteering and the three surveys
of the Volunteer Development Agency/Volunteer Now were specialist surveys of volunteering;
while the other surveys contained modules of volunteering questions (and in the case of the
Census 2011 one volunteering question) in the midst of a range of questions on other subjects.
Types of volunteering studied – whether all (generic) volunteering, formal volunteering
(for organisations) or informal volunteering (for individuals): Each of these types has
value as a subject. However, their greatest value lies in togetherness, the flexibility to explore
both formal volunteering and informal volunteering, which have different activities, fields,
demographics, geographical dimensions and social outputs, and the capacity to combine
these by statistical means into all volunteering – that is, asking two questions to provide three
answers. At headline level some surveys (Census 2011; NI Omnibus surveys; Continuous
Household Surveys 2012-13 and 2013-14) focused on all volunteering and did not distinguish
formal volunteering or informal volunteering, although the NI Omnibus surveys unfortunately
5
managed to ask questions specific to both formal and informal volunteering without stating
that this was the case and without therefore enabling this information to be used with any
precision. Sport Northern Ireland’s survey captured all volunteering at headline level but also
some detailed information on formal volunteering. The two National Surveys of Volunteering,
the three surveys of Volunteer Development Agency/ Volunteer Now, Sport Northern Ireland’s
survey and the two early versions of the Continuous Household Survey (1991-92 and 2008-
09) focused on formal volunteering and in all cases but one also collected information on
informal volunteering.
Definition given to ‘volunteering’ as a subject: There is no agreement on what term should
be used – ‘helping’, ‘unpaid help’, ‘voluntary help’, ‘voluntary work’, or just ‘volunteering’, but
there is agreement that each of these terms is laden with assumptions and preconceptions
which may impact on the way respondents reply.1 There is also no industry-standard definition
of the content of ‘volunteering’ within the UK or indeed elsewhere, but good practice suggests
the inclusion of three elements – that is, that volunteering is unpaid (except for the
reimbursement of expenses); freely undertaken and by choice; and for the benefit of others
outside the immediate family – friends, neighbours, organisations, the community, animals
and the environment. The definition used by surveys of the Volunteer Development
Agency/Volunteer Now included all three elements. All the other surveys noted that
volunteering is unpaid; but the two National Surveys of Volunteering, the Census 2011, the
two later Continuous Household Surveys (2012-13 and 2013-14) and the Northern Ireland
Omnibus Surveys 2013-16 did not include an exception for the reimbursement of expenses.
The two National Surveys of Volunteering, the Continuous Household Survey 1991-92, Sport
Northern Ireland’s survey and the Census 2011 did not note that volunteering is freely given.
The Continuous Household Survey 1991-92, Sport Northern Ireland’s survey and the Census
2011 did not mention that volunteering provides benefit to others; and the two National
Surveys of Volunteering, the two later Continuous Household Surveys, the Census 2011 and
the Northern Ireland Omnibus surveys did not exclude providing benefit inter alia to immediate
family members.
1The report of the first VDA/VN survey (1995) acknowledged this baggage: ‘Throughout the survey questionnaire, the terms volunteering and volunteer were avoided, being substituted by terms such as unpaid work or help. This was so as to avoid confusion with respondents’ perceptions as to what constitutes volunteering.’
6
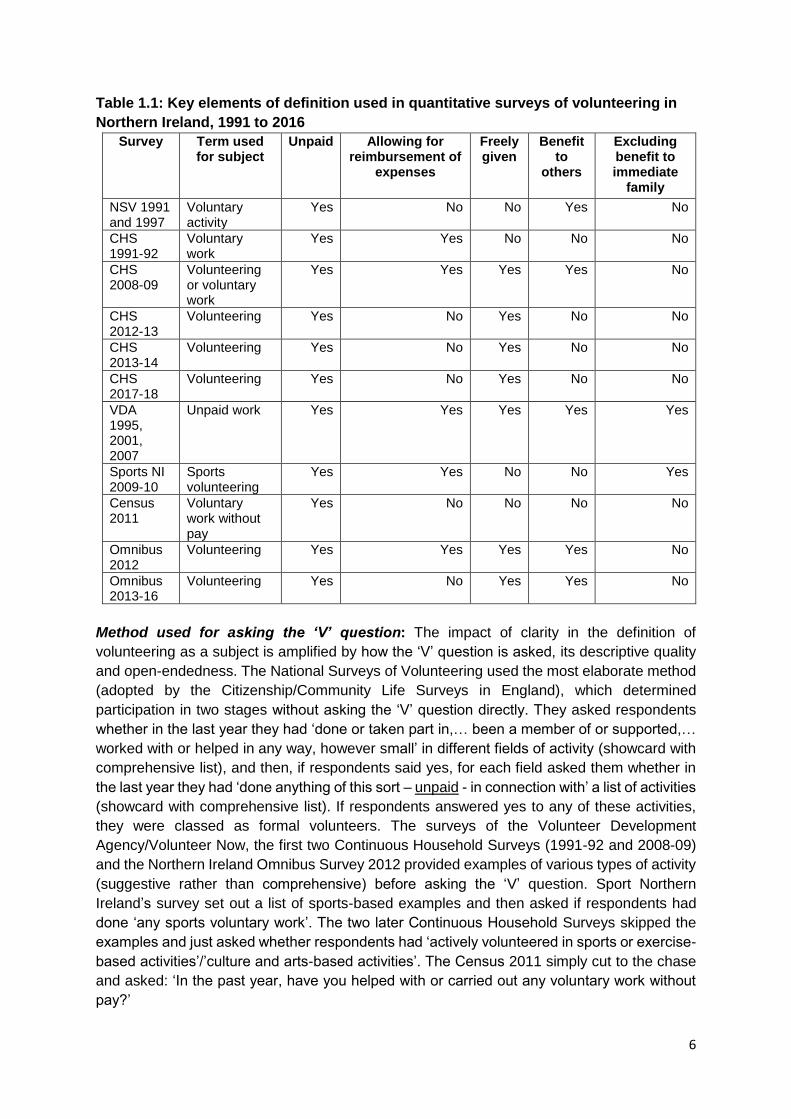
Table 1.1: Key elements of definition used in quantitative surveys of volunteering in
Northern Ireland, 1991 to 2016
Survey Term used for subject
Unpaid Allowing for reimbursement of
expenses
Freely given
Benefit to
others
Excluding benefit to immediate
family
NSV 1991 and 1997
Voluntary activity
Yes
No No Yes No
CHS 1991-92
Voluntary work
Yes Yes No No No
CHS 2008-09
Volunteering or voluntary work
Yes Yes Yes Yes No
CHS 2012-13
Volunteering Yes No Yes No No
CHS 2013-14
Volunteering Yes No Yes No No
CHS 2017-18
Volunteering Yes No Yes No No
VDA 1995, 2001, 2007
Unpaid work Yes Yes Yes Yes Yes
Sports NI 2009-10
Sports volunteering
Yes Yes No No Yes
Census 2011
Voluntary work without pay
Yes No No No No
Omnibus 2012
Volunteering Yes Yes Yes Yes No
Omnibus 2013-16
Volunteering Yes No Yes Yes No
Method used for asking the ‘V’ question: The impact of clarity in the definition of
volunteering as a subject is amplified by how the ‘V’ question is asked, its descriptive quality
and open-endedness. The National Surveys of Volunteering used the most elaborate method
(adopted by the Citizenship/Community Life Surveys in England), which determined
participation in two stages without asking the ‘V’ question directly. They asked respondents
whether in the last year they had ‘done or taken part in,… been a member of or supported,…
worked with or helped in any way, however small’ in different fields of activity (showcard with
comprehensive list), and then, if respondents said yes, for each field asked them whether in
the last year they had ‘done anything of this sort – unpaid - in connection with’ a list of activities
(showcard with comprehensive list). If respondents answered yes to any of these activities,
they were classed as formal volunteers. The surveys of the Volunteer Development
Agency/Volunteer Now, the first two Continuous Household Surveys (1991-92 and 2008-09)
and the Northern Ireland Omnibus Survey 2012 provided examples of various types of activity
(suggestive rather than comprehensive) before asking the ‘V’ question. Sport Northern
Ireland’s survey set out a list of sports-based examples and then asked if respondents had
done ‘any sports voluntary work’. The two later Continuous Household Surveys skipped the
examples and just asked whether respondents had ‘actively volunteered in sports or exercise-
based activities’/’culture and arts-based activities’. The Census 2011 simply cut to the chase
and asked: ‘In the past year, have you helped with or carried out any voluntary work without
pay?’
7
Number and representativeness of respondents achieved: The robustness of quantitative
information is directly related to respondents’ representativeness of the population as a whole
(as defined by various demographic and geographical factors) and the number of respondents
relative to the depth and complexity of the questions asked. Issues of representativeness are
managed by weighting (for unequal selection probabilities and differential non-response), and
those of robustness by significance testing, usually at 95%2 and designation of confidence
intervals. Most surveys, sadly, are constructed not to provide statistical robustness but to fit a
given budget (that is, the maximum number of respondents that are affordable), and there is
often a mismatch between aspiration, questions asked, and achievement, usable answers. In
the case of Northern Ireland the National Surveys of Volunteering had the smallest number of
respondents, who were of nil representativeness. The Census 2011 had the largest number
of respondents (the whole resident population aged 16 and over) who were of the greatest
possible representativeness. The other surveys had between 1,000 and 4,700 respondents.
These numbers are sufficiently robust for headline findings but for more complex analysis run
into problems of statistical viability.
Comparability: Comparability means consistently comparing like with like, and, as can be
seen from above and below, this is in short supply between surveys carried out by different
providers and within the runs of those surveys.
If ‘methodology is destiny’, then the destiny of quantitative research on volunteering in
Northern Ireland to date has been to engender a large degree of waste and confusion.
2This means that at 95% confidence level differences between, say,different age bands or different local councils are significant – that the differences between groups are actual differences and have not arisen by chance. The larger the confidence interval (+/-) around the 95% figure, the less precise the estimate is. In most studies only findings at 95% confidence level and with a minimum of 30 responses are presented in the text.
8
2. Some suggestions for carrying out future quantitative research
Despite the problems set out above, it may be possible, with the co-operation of stakeholders,
including local councils, to achieve a method of collecting high-quality quantitative information
on volunteering which will serve the purposes of those stakeholders and which can be done
without radical change or undue expense.
The main barriers to success have been lack of interest, co-ordination and resources or, more
particularly:
• Lack of agreement on the type(s) of volunteering studied – in particular, all volunteering
vs formal volunteering/informal volunteering
• Lack of a standardised definition of the subject
• Lack of co-ordination on the content of surveys
• Lack of agreed methods for gathering and presenting information
• Samples too small and unrepresentative (with the exception of the Census 2011) to
provide statistically significant information at local council level, for more complex
analysis and for most section 75 groups
• Discontinuities in timing – either long gaps or every year, the one too long and the
other probably too short to reflect any real change.
And therefore, in order to surmount these barriers and to be properly future-facing, quantitative
studies of volunteering should aim for comprehensiveness, comparability, perspective and
cost-effectiveness. They should:
• Have as their subjects both formal volunteering and informal volunteering and, by
extrapolation, all volunteering.
• Use a definition of volunteering which contains the three key elements – unpaid (except
for the reimbursement of expenses), freely undertaken and by choice; and for the
benefit of others outside (or in addition to) the immediate family.
• Endeavour to agree on standard questions and standard responses to questions and
avoid regularly changing the questions.
• Agree methods for gathering and presenting information – for example, using tables to
record all responses and text for significant responses, putting values on bar charts,
pie charts, etc. and always providing numbers of respondents.
• Use samples of a size and representativeness sufficient to produce robust results
• Carry out surveys at reasonable intervals to show development over time.
The greatest asset for in-depth understanding of volunteering is the Census 2011, and it is
hoped that a question or questions on volunteering will be included in 2021 – that the question
used in 2011, which is the acme of minimalism (‘In the past year, have you helped with or
carried out any voluntary work without pay?’) might be subdivided into ‘In the past year, have
you helped with or carried out any voluntary work for a group, club or organisation without
pay?’ and ‘In the past year, have you helped with or carried out any voluntary work for
individuals (not members of your own family) without pay?’ This would allow a distinction
between formal and informal volunteering but enable analysis by all volunteers and hence
ensure comparability with 2011.
9
Because ‘doing’ is better than ‘feeling’, local councils can use participation in volunteering as
a ‘hard’ indictor of community engagement rather than the more fashionable wellbeing
indicators3. It should be possible to concentrate resources on achieving the best and most
detailed outputs possible by timing research to fit in with the monitoring requirements of
programmes – e.g. before and after, in Years 1 and 3 of a three-year programme or in Years
1 and 5 of a five-year programme. A monitoring questionnaire should be developed nationally
for application locally – so that all local councils will be monitoring the same elements at the
same time. Sample sizes per local council for headline rates should not be less than 1,000;
questions should concentrate on generic issues of volunteering and not be individualised to
local councils (unless as extras); and ideally, questions (say, eight to ten in number) should
be included, in the form of a module, in local council omnibus surveys conducted to a national
standard.
It is recognised that from time to time volunteering specialists such as Volunteer Now may
wish to gather more detailed information on a wider range of issues and that provision should
be made to support periodic surveys which have sample sizes which are sufficiently large to
deliver statistically significant outputs. This information will add detail and nuance to the more
limited monitoring information and will enable a much fuller understanding of the fine texture
of volunteering and ways of encouraging and supporting it.
In sum:
• Census of population every 10 years; one all-in question or two questions, one of
formal volunteering and the other on informal volunteering
• Programme monitoring surveys in all local authority districts at, say three or five year
intervals (beginning and end of community development and planning programmes);
standardised questionnaire used locally with fit-for-purpose samples and standardised
methodology and reporting
• Specialist in-depth national surveys of volunteering from time to time which deliver
statistically significant outputs.
3‘There is strong evidence that volunteering powers wellbeing for individuals and communities. A volunteering indicator is therefore a relevant and appropriate way to measure and monitor wellbeing across Scotland. Volunteering participation is (explicitly or implicitly) a critical component of policy agendas focussing on public service delivery and communities now and for the foreseeable future.’ Helen Harper, Volunteering and Wellbeing: Scotland Performs: The case for a new volunteering indicator (Stirling: Volunteer Scotland, 2015), 8.
10
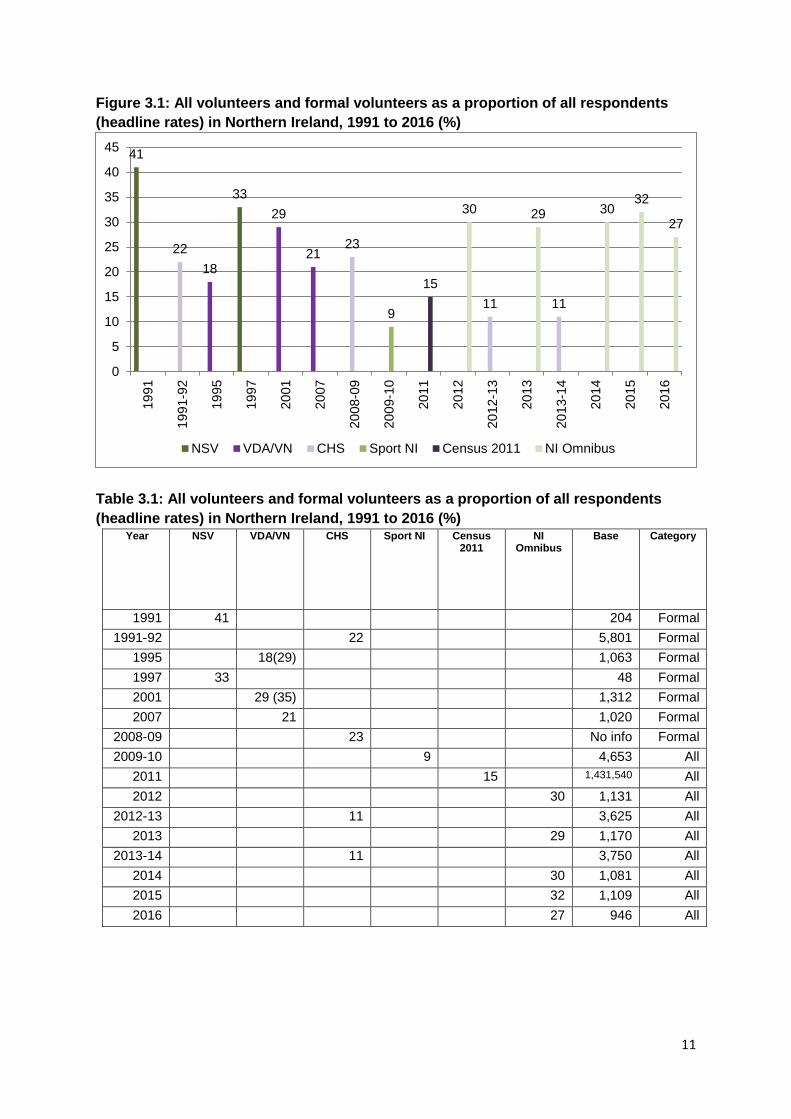
3. Headline participation in volunteering in Northern Ireland
Figures 3.1 and 3.2 and Tables 3.1 and 3.2, set out the headline participation rates for each
of the sixteen quantitative surveys of volunteering in Northern Ireland, and the Appendix sets
out descriptions of the methodologies used in these surveys.
There is no discernable trend, and many ups and downs. This volatility is unlikely to be a
reflection of any underlying reality but a reflection of inconsistencies in methodology.4
In the case of all volunteering and formal volunteering (expediently combined here for
analysis) and allowing for changes in questionnaires including variations in inclusion/
exclusion of certain activities in the first two surveys of the Voluntary Development
Agency/Volunteer Now5, and the low participation rates of the Census 2011 and the three
surveys of sports and arts and culture volunteering (Sport Northern Ireland’s survey and
Continuous Household Surveys 2012-13 and 2013-146) – it would seem that the headline
participation rates for all volunteering/formal volunteering in Northern Ireland have hovered –
with a possible dip between 2001 and 2012 but without any obvious trend – at around a quarter
to a third of the population.
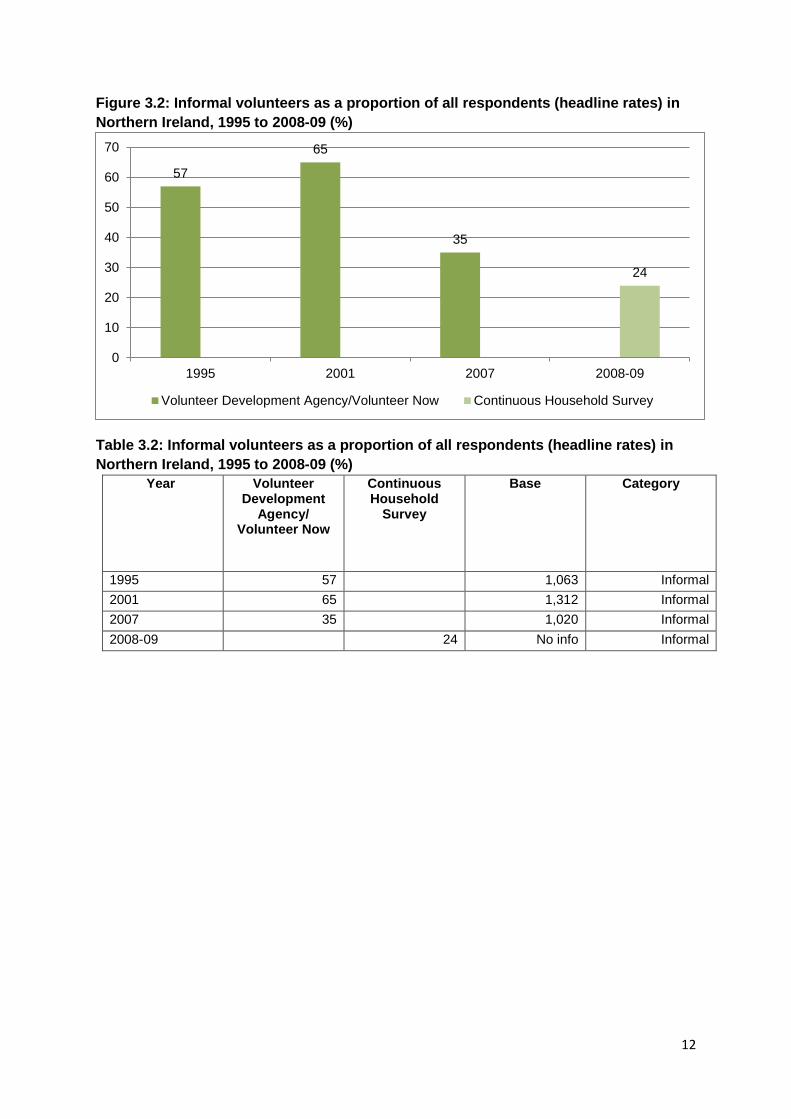
In the case of informal volunteering, allowing for the scarcity of information, it would seem that
the headline participation rate may have peaked in 2001 and fallen thereafter.
4See also: Peter Lynn, ‘Measuring Voluntary Activity’, Non-Profit Studies 1(2) (1997), 1-11; Roger Tarling, ‘Editorial: Statistics on the voluntary sector in the UK’, Journal of the Royal Statistical Society A, 163, Part 3 (2000), 255-61; Laura Staetsky and John Mohan, Individual voluntary participation in the United Kingdom: an overview of survey information (Third Sector Research Centre Working Paper No.6; Birmingham: Third Sector Research Centre, 2011); and John Mohan, Developmental trends in the British third sector: evidence on voluntary action by individuals; (TSI Working Paper Series No.14; Seventh Framework Programme; Brussels: Third Sector Impact, European Union, 2016). 5The 1995 report gave the headline rate for formal volunteering as 18% but noted ‘that 11% of respondents who said that they had not undertaken voluntary work were members of trades unions, professional and technical associations or social/ recreational clubs for which they had worked at some time (by holding office, helping run activities or by being involved in charitable activities). These respondents, while not recognising themselves as volunteers, nevertheless may be considered as formal volunteers, although it has not been possible for this survey to analyse their work. When members of this group are discussed in the report they will be referred to as “other volunteers”.’ The 2001 report stated 'that formal volunteering stood at 35% of the population. This figure was an aggregation of those individuals who stated they were formal volunteers and also those who were members of a committee, were involved in fundraising or running an activity for a trade union, club for social or recreation activities or a professional or technical association. When the responses to Question 1 on the 2001 survey are examined in isolation (formal volunteers), the number of formal volunteers is 29% of the population. For the sake of comparison, it is this figure which will be used throughout this report in order to analyse change over time.’ The 2007 survey had the same option of trade union/professional organisation as a field but the report did not set out any percentage. These alternative figures 29% and 35% suggest greater consistency in participation rates but make greater the contrast with the participation rate for 2007. 6The participation rates for these surveys may be relatively low but they are consistent.
11
Figure 3.1: All volunteers and formal volunteers as a proportion of all respondents
(headline rates) in Northern Ireland, 1991 to 2016 (%)
Table 3.1: All volunteers and formal volunteers as a proportion of all respondents
(headline rates) in Northern Ireland, 1991 to 2016 (%) Year NSV VDA/VN CHS Sport NI Census
2011 NI
Omnibus Base Category
1991 41 204 Formal
1991-92 22 5,801 Formal
1995 18(29) 1,063 Formal
1997 33 48 Formal
2001 29 (35) 1,312 Formal
2007 21 1,020 Formal
2008-09 23 No info Formal
2009-10 9 4,653 All
2011 15 1,431,540 All
2012 30 1,131 All
2012-13 11 3,625 All
2013 29 1,170 All
2013-14 11 3,750 All
2014 30 1,081 All
2015 32 1,109 All
2016 27 946 All
41
33
18
29
2122 23
11 119
15
30 29 3032
27
0
5
10
15
20
25
30
35
40
4519
91
19
91-9
2
19
95
19
97
20
01
20
07
20
08-0
9
20
09-1
0
20
11
20
12
20
12-1
3
20
13
20
13-1
4
20
14
20
15
20
16
NSV VDA/VN CHS Sport NI Census 2011 NI Omnibus
12
Figure 3.2: Informal volunteers as a proportion of all respondents (headline rates) in
Northern Ireland, 1995 to 2008-09 (%)
Table 3.2: Informal volunteers as a proportion of all respondents (headline rates) in
Northern Ireland, 1995 to 2008-09 (%)
Year Volunteer Development
Agency/ Volunteer Now
Continuous Household
Survey
Base Category
1995 57 1,063 Informal
2001 65 1,312 Informal
2007 35 1,020 Informal
2008-09 24 No info Informal
57
65
35
24
0
10
20
30
40
50
60
70
1995 2001 2007 2008-09
Volunteer Development Agency/Volunteer Now Continuous Household Survey
13
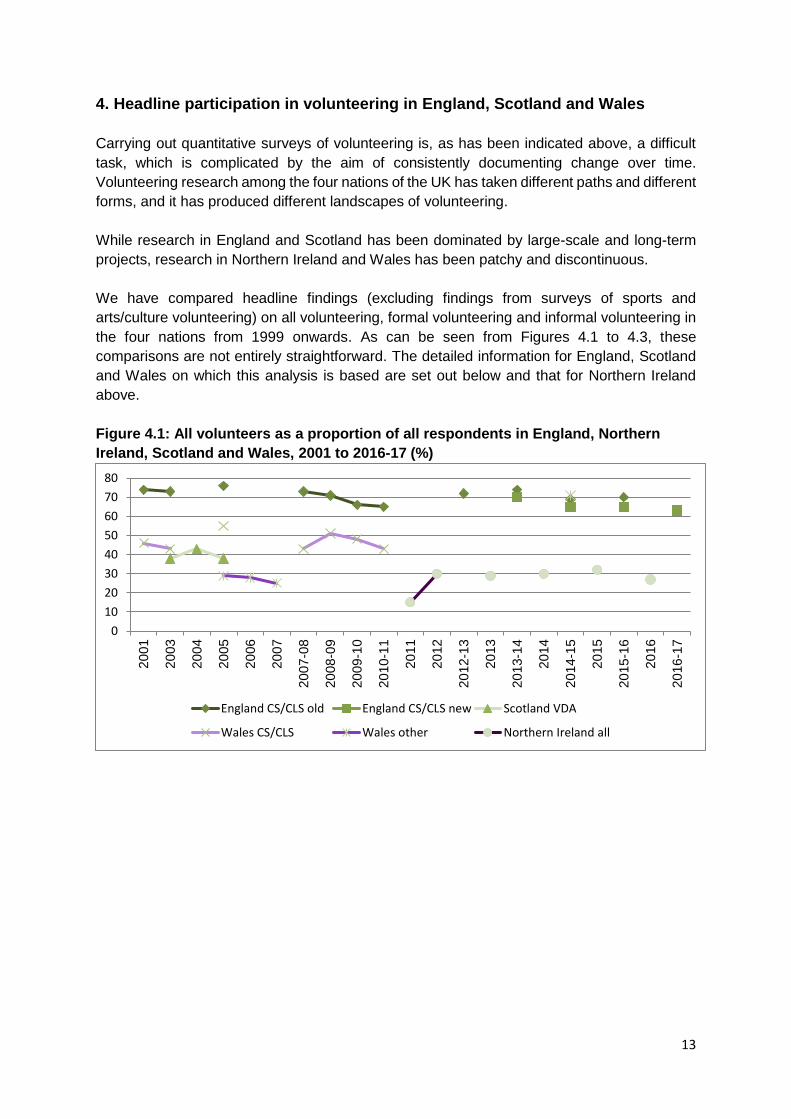
4. Headline participation in volunteering in England, Scotland and Wales
Carrying out quantitative surveys of volunteering is, as has been indicated above, a difficult
task, which is complicated by the aim of consistently documenting change over time.
Volunteering research among the four nations of the UK has taken different paths and different
forms, and it has produced different landscapes of volunteering.
While research in England and Scotland has been dominated by large-scale and long-term
projects, research in Northern Ireland and Wales has been patchy and discontinuous.
We have compared headline findings (excluding findings from surveys of sports and
arts/culture volunteering) on all volunteering, formal volunteering and informal volunteering in
the four nations from 1999 onwards. As can be seen from Figures 4.1 to 4.3, these
comparisons are not entirely straightforward. The detailed information for England, Scotland
and Wales on which this analysis is based are set out below and that for Northern Ireland
above.
Figure 4.1: All volunteers as a proportion of all respondents in England, Northern
Ireland, Scotland and Wales, 2001 to 2016-17 (%)
0
10
20
30
40
50
60
70
80
20
01
20
03
20
04
20
05
20
06
20
07
20
07-0
8
20
08-0
9
20
09-1
0
20
10-1
1
20
11
20
12
20
12-1
3
20
13
20
13-1
4
20
14
20
14-1
5
20
15
20
15-1
6
20
16
20
16-1
7
England CS/CLS old England CS/CLS new Scotland VDA
Wales CS/CLS Wales other Northern Ireland all
14
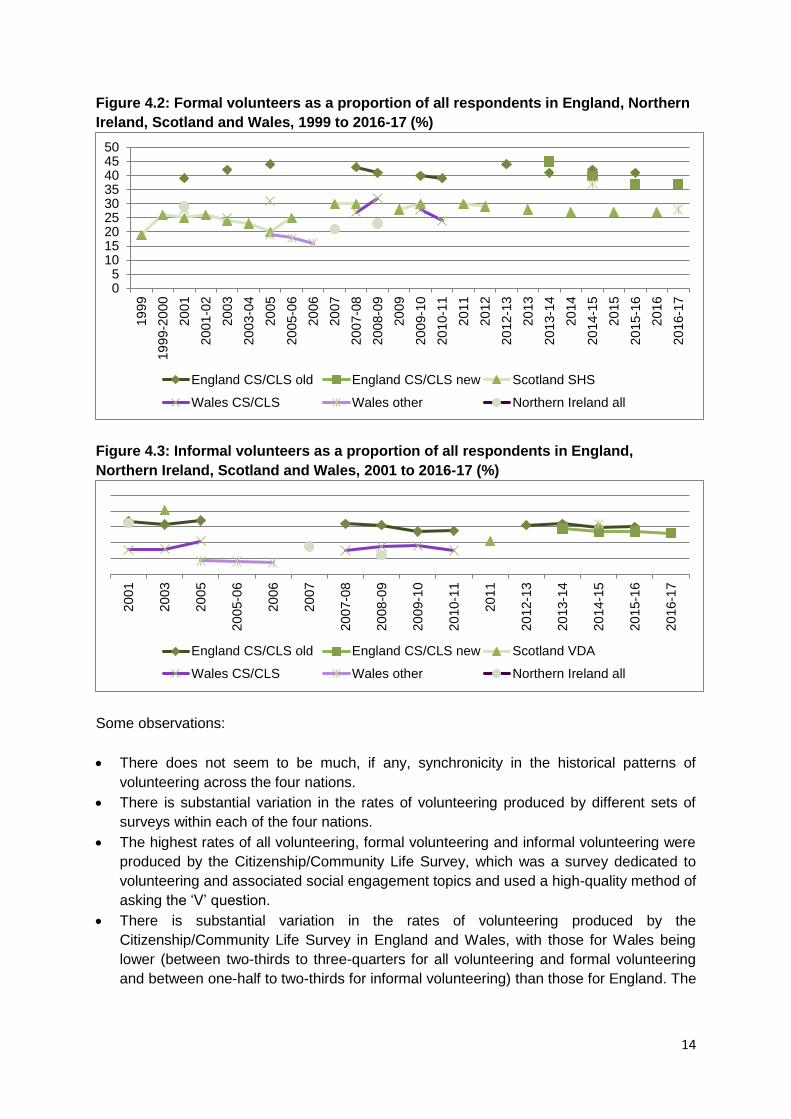
Figure 4.2: Formal volunteers as a proportion of all respondents in England, Northern
Ireland, Scotland and Wales, 1999 to 2016-17 (%)
Figure 4.3: Informal volunteers as a proportion of all respondents in England,
Northern Ireland, Scotland and Wales, 2001 to 2016-17 (%)
Some observations:
• There does not seem to be much, if any, synchronicity in the historical patterns of
volunteering across the four nations.
• There is substantial variation in the rates of volunteering produced by different sets of
surveys within each of the four nations.
• The highest rates of all volunteering, formal volunteering and informal volunteering were
produced by the Citizenship/Community Life Survey, which was a survey dedicated to
volunteering and associated social engagement topics and used a high-quality method of
asking the ‘V’ question.
• There is substantial variation in the rates of volunteering produced by the
Citizenship/Community Life Survey in England and Wales, with those for Wales being
lower (between two-thirds to three-quarters for all volunteering and formal volunteering
and between one-half to two-thirds for informal volunteering) than those for England. The
05
101520253035404550
19
99
19
99-2
000
20
01
20
01-0
2
20
03
20
03-0
4
20
05
20
05-0
6
20
06
20
07
20
07-0
8
20
08-0
9
20
09
20
09-1
0
20
10-1
1
20
11
20
12
20
12-1
3
20
13
20
13-1
4
20
14
20
14-1
5
20
15
20
15-1
6
20
16
20
16-1
7
England CS/CLS old England CS/CLS new Scotland SHS
Wales CS/CLS Wales other Northern Ireland all
20
01
20
03
20
05
20
05-0
6
20
06
20
07
20
07-0
8
20
08-0
9
20
09-1
0
20
10-1
1
20
11
20
12-1
3
20
13-1
4
20
14-1
5
20
15-1
6
20
16-1
7
England CS/CLS old England CS/CLS new Scotland VDA
Wales CS/CLS Wales other Northern Ireland all
15
consistency of the gaps between these national rates suggests that these differences were
real and not artifacts of research methodology.
• Rates of volunteering in Northern Ireland are, on the whole, of a similar magnitude to those
in Scotland.
• Rates of volunteering in sports and arts/cultural surveys are of a surprisingly similar
magnitude across England, Northern Ireland and Wales and throughout the period under
consideration.
Volunteering in England
In England there were four surveys that provided information on volunteering:
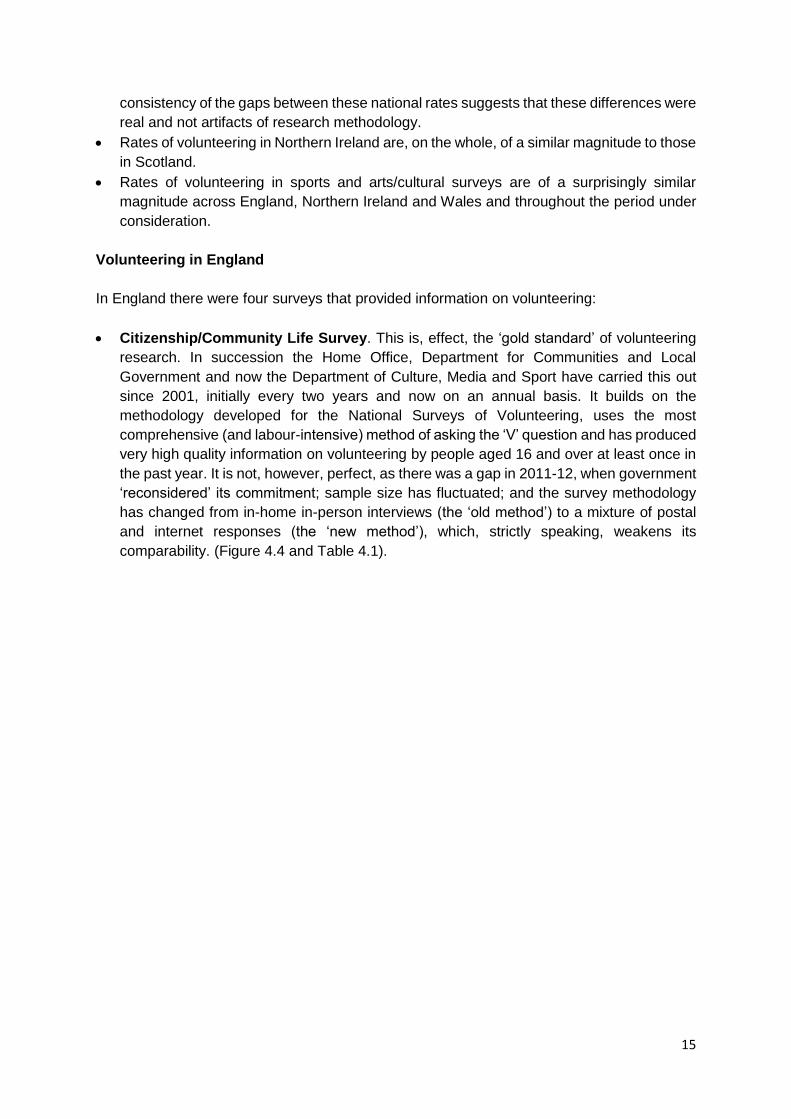
• Citizenship/Community Life Survey. This is, effect, the ‘gold standard’ of volunteering
research. In succession the Home Office, Department for Communities and Local
Government and now the Department of Culture, Media and Sport have carried this out
since 2001, initially every two years and now on an annual basis. It builds on the
methodology developed for the National Surveys of Volunteering, uses the most
comprehensive (and labour-intensive) method of asking the ‘V’ question and has produced
very high quality information on volunteering by people aged 16 and over at least once in
the past year. It is not, however, perfect, as there was a gap in 2011-12, when government
‘reconsidered’ its commitment; sample size has fluctuated; and the survey methodology
has changed from in-home in-person interviews (the ‘old method’) to a mixture of postal
and internet responses (the ‘new method’), which, strictly speaking, weakens its
comparability. (Figure 4.4 and Table 4.1).
16
Figure 4.4: All volunteers, formal volunteers and informal volunteers aged 16 and over
who volunteered in the last 12 months as a proportion of all respondents in England,
Citizenship/Community Life Survey, 2001 to 2016-17 (%)
Note: Both the ‘old method’ and the ‘new method’ were used in parallel in 2013-14 to 2015-16 and the ‘new method’ has been
used on its own since then.
Table 4.1: All volunteers, formal volunteers and informal volunteers aged 16 and over
who volunteered in the last 12 months as a proportion of all respondents in England,
Citizenship/ Community Life Survey, 2001 to 2016-17 (%)
Year All old method
All new method
Formal old
method
Formal new
method
Informal old
method
Informal new
method
Base old
method
Base new
method
2001 74 39 67 9,430
2003 73 42 63 8,920
2005 76 44 68 9,195
2007-08 73 43 64 8,804
2008-09 71 41 62 8,768
2009-10 66 40 54 8,712
2010-11 65 39 55 9,664
2012-13 72 44 62 6,915
2013-14 74 70 41 45 64 58 5,105 10,215
2014-15 69 65 42 40 59 54 2,022 2,323
2015-16 70 65 41 37 60 54 3,027 3,256
2016-17 63 37 52 10,256
• Taking Part: The National Survey of Culture, Leisure and Sport. The Department for
Culture, Media and Sport, in partnership with the Arts Council England, Historic England
and Sport England, has carried out the Taking Part Survey since 2005-06. This is a survey
0
10
20
30
40
50
60
70
8020
01
20
03
20
05
20
07-0
8
20
08-0
9
20
09-1
0
20
10-1
1
20
12-1
3
20
13-1
4
20
14-1
5
20
15-1
6
20
16-1
7
All old method All new method Formal old method
Formal new method Informal old method Informal new method
17
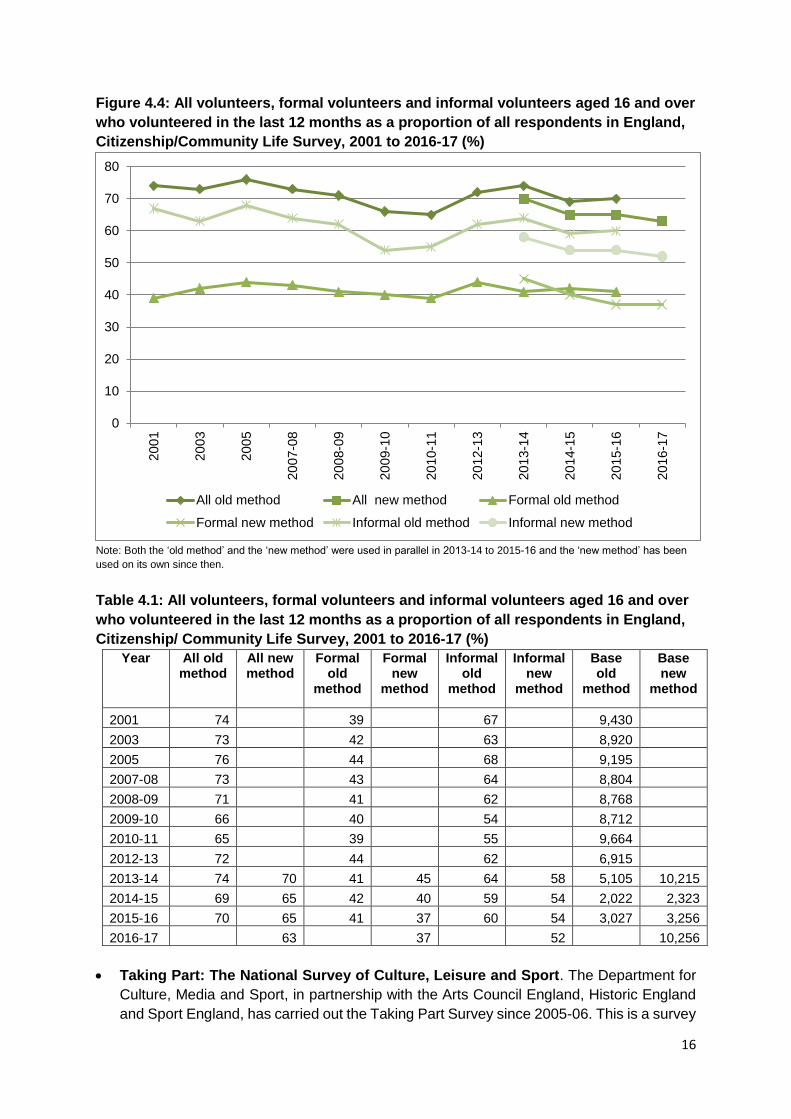
which focuses on participation, including volunteering, in the areas for which DCMS has
responsibility (arts, museums/galleries, heritage, libraries, archives and sport). It has
collected information on all volunteers aged 16 and over who volunteered at least once in
the last 12 months not only in DCMS’s specialist sectors but also in general. It asked
volunteering questions of half the sample of respondents in 2010-11, the full sample in
2011-12 and a cross-sectional sample from 2012-13 onwards. It is worth noting that its
headline figures for all volunteering, which should approximate those of the
Citizenship/Community Life Surveys, are substantially lower – about a third to a half of
those documented by the Citizenship/Community Life Surveys. This suggests that both
context and methodology play a part in influencing headline rates of participation (Figure
4.5 and Table 4.2).
Figure 4.5: All volunteers and all volunteers in DCMS sectors aged 16 and over who
volunteered in last 12 months as a proportion of all respondents in England, Taking
Part: The National Survey of Culture, Leisure and Sport, 2005-06 to 2016-17 (%).
Table 4.2: All volunteers and all volunteers in DCMS sectors aged 16 and over who
volunteered in last 12 months as a proportion of all respondents in England, Taking
Part: The National Survey of Culture, Leisure and Sport, 2005-06 to 2016-17
Year All volunteers All volunteers in DCMS sectors
Base
2005-06 24 7 28,072
2006-07 24 7 24,174
2007-08 24 7 25,720
2008-09 25 8 14,452
2010-11 24 8 14,102
2011-12 23 7 9,188
2012-13 26 9 9,838
2013-14 24 7 10,355
2014-15 24 8 9,812
2015-16 24 8 10,171
2016-17 33 10 9,352
0
5
10
15
20
25
30
35
20
05-0
6
20
06-0
7
20
07-0
8
20
08-0
9
20
10-1
1
20
11-1
2
20
12-1
3
20
13-1
4
20
14-1
5
20
15-1
6
20
16-1
7
All volunteers All volunteers in DCMS sectors
18
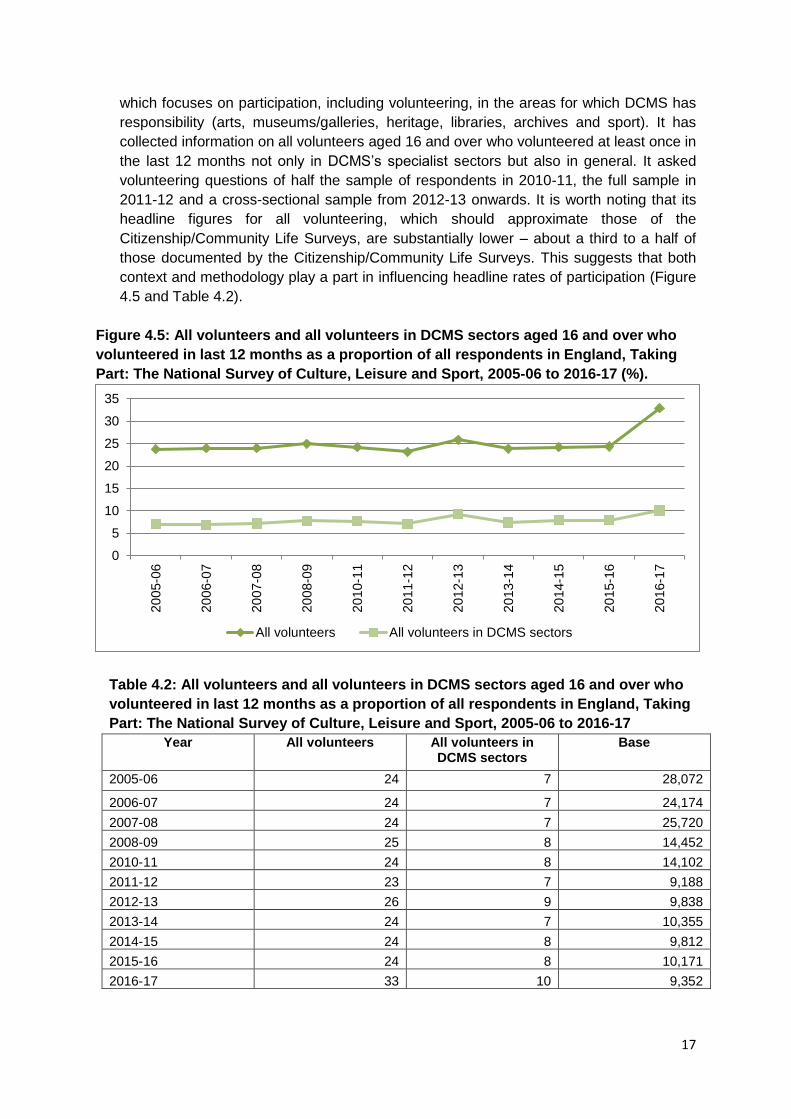
• Active People Survey. Sport England described this survey as the ‘most comprehensive
and authoritative picture of sports participation in England’ and carried it out from 2006-07
to 2015-16. It only included questions on all volunteering from 2010-11 onwards and after
the first of these surveys only asked the questions of half of the sample. Its time period for
volunteering (4 weeks) is not comparable with other volunteering research (Figure 4.6 and
Table 4.3).
Figure 4.6: All volunteers aged 16 and over who volunteered in the last four weeks as
a proportion of all respondents in England, Active People Survey, 2010-11 to 2015-16
Table 4.3: All volunteers aged 16 and over who volunteered in the last four weeks as a
proportion of all respondents in England, Active People Survey, 2010-11 to 2015-16
Year All volunteers Base
2010-11 14 162,146
2011-12 14 82,034
2012-13 12 78,471
2013-14 13 59,512
2014-15 13 40,504
2015-16 13 39,240
• Active Lives Survey. Sport England replaced the Active People Survey with this survey
from 2016-17 with the intention of monitoring progress under government’s Sporting
Future Strategy and Sport England’s own Towards an Active Nation Strategy. Like the
Citizenship Survey/Community Life Survey it uses a new methodology, ‘postal-pushed’
collection of information by a web-based survey. It provides information on people aged
16 and over who volunteered formally at least twice in the past year (not comparable with
other volunteering research) in support of sport/physical activity. It found that 15% of
respondents did so (sample N = 142,087).
14 14
12
13 13 13
0
1
2
3
4
5
6
7
8
9
10
11
12
13
14
15
2010-11 2011-12 2012-13 2013-14 2014-15 2015-16
19
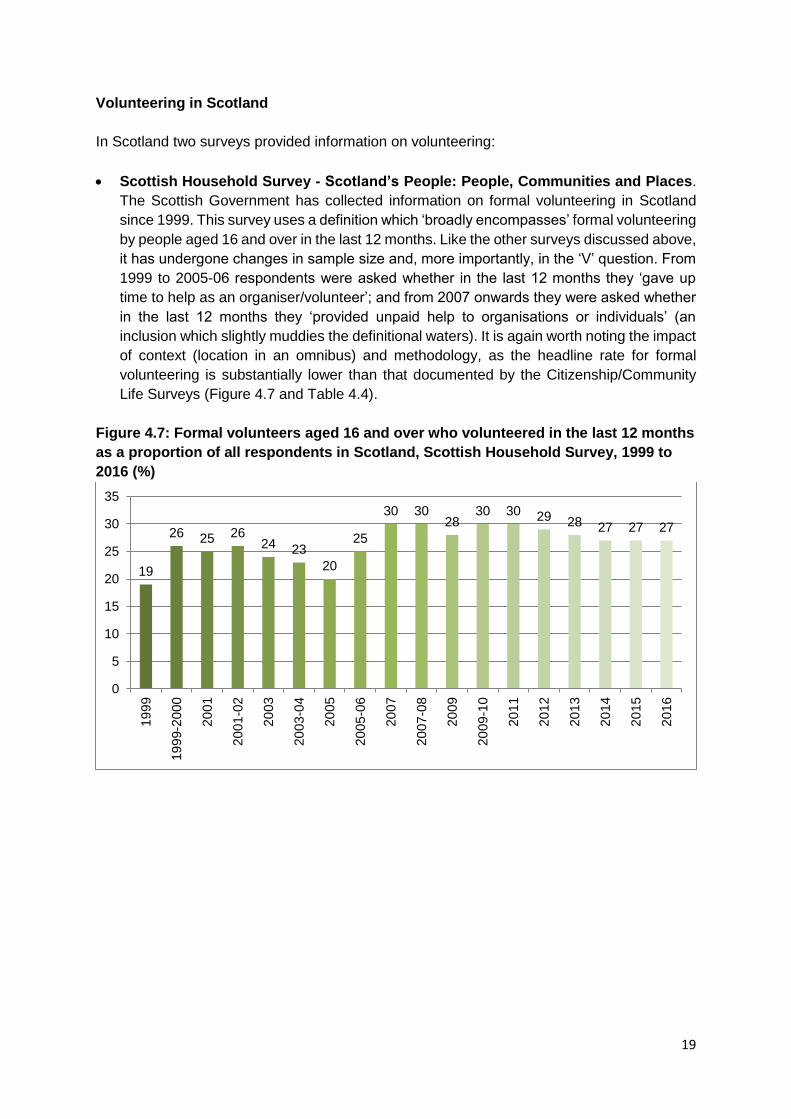
Volunteering in Scotland
In Scotland two surveys provided information on volunteering:
• Scottish Household Survey - Scotland’s People: People, Communities and Places.
The Scottish Government has collected information on formal volunteering in Scotland
since 1999. This survey uses a definition which ‘broadly encompasses’ formal volunteering
by people aged 16 and over in the last 12 months. Like the other surveys discussed above,
it has undergone changes in sample size and, more importantly, in the ‘V’ question. From
1999 to 2005-06 respondents were asked whether in the last 12 months they ‘gave up
time to help as an organiser/volunteer’; and from 2007 onwards they were asked whether
in the last 12 months they ‘provided unpaid help to organisations or individuals’ (an
inclusion which slightly muddies the definitional waters). It is again worth noting the impact
of context (location in an omnibus) and methodology, as the headline rate for formal
volunteering is substantially lower than that documented by the Citizenship/Community
Life Surveys (Figure 4.7 and Table 4.4).
Figure 4.7: Formal volunteers aged 16 and over who volunteered in the last 12 months
as a proportion of all respondents in Scotland, Scottish Household Survey, 1999 to
2016 (%)
19
26 25 2624 23
20
25
30 3028
30 30 29 28 27 27 27
0
5
10
15
20
25
30
35
19
99
19
99-2
000
20
01
20
01-0
2
20
03
20
03-0
4
20
05
20
05-0
6
20
07
20
07-0
8
20
09
20
09-1
0
20
11
20
12
20
13
20
14
20
15
20
16
20
Table 4.4: Formal volunteers in the last 12 months as a proportion of all respondents
in Scotland, Scottish Household Survey, 1999 to 2016 (%).
Year Formal volunteers Base
1999 19 13,788
1999-2000 26 14,554
2001 25 14,635
2001-02 26 28,667
2003 24 13,925
2003-04 23 28,671
2005 20 10,157
2005-06 25 7,079
2007 30 6,333
2007-08 30 12,533
2009 28 6,784
2009-10 30 12,420
2011 30 6,428
2012 29 9,890
2013 28 9,920
2014 27 9,800
2015 27 9,410
2016 27 9,640
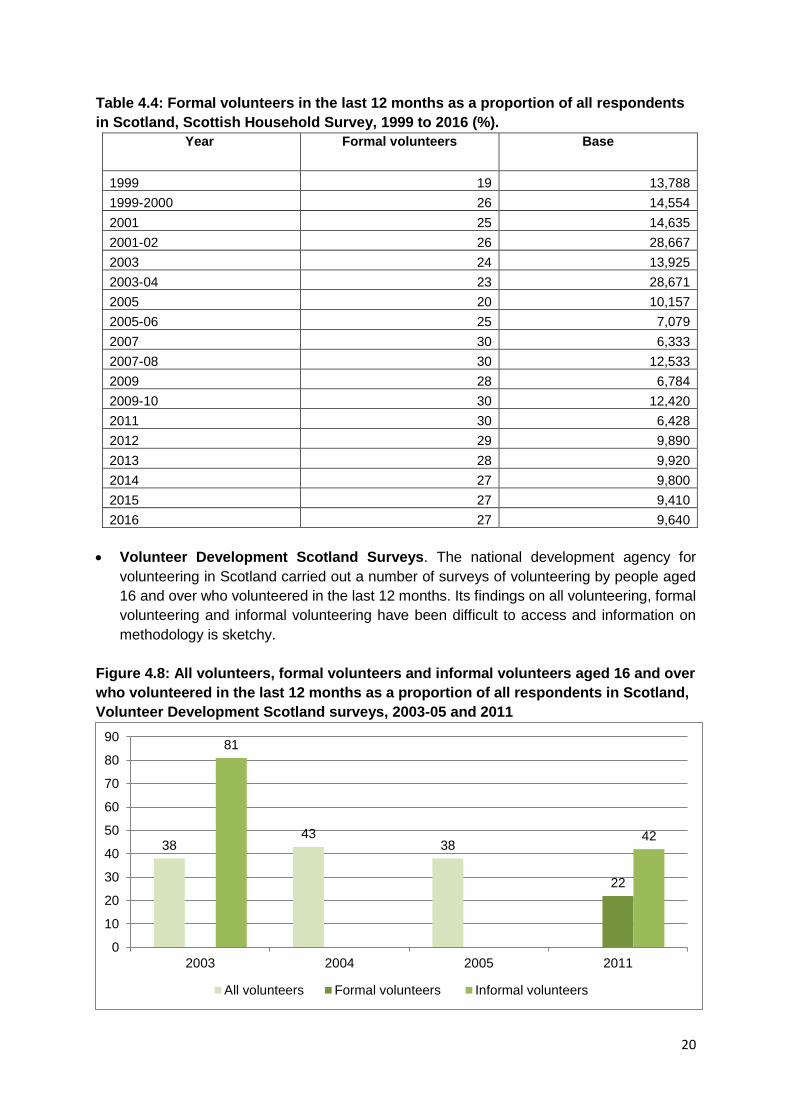
• Volunteer Development Scotland Surveys. The national development agency for
volunteering in Scotland carried out a number of surveys of volunteering by people aged
16 and over who volunteered in the last 12 months. Its findings on all volunteering, formal
volunteering and informal volunteering have been difficult to access and information on
methodology is sketchy.
Figure 4.8: All volunteers, formal volunteers and informal volunteers aged 16 and over
who volunteered in the last 12 months as a proportion of all respondents in Scotland,
Volunteer Development Scotland surveys, 2003-05 and 2011
3843
38
22
81
42
0
10
20
30
40
50
60
70
80
90
2003 2004 2005 2011
All volunteers Formal volunteers Informal volunteers
21
Table 4.5: All volunteers, formal volunteers and informal volunteers aged 16 and over
in the last 12 months as a proportion of all respondents in Scotland, Volunteer
Development Scotland surveys, 2003-05 and 2011
Year All volunteers Formal volunteers
Informal volunteers
Base
2003 38 81 No information
2004 43 No information
2005 38 No information
2011 22 42 1,033
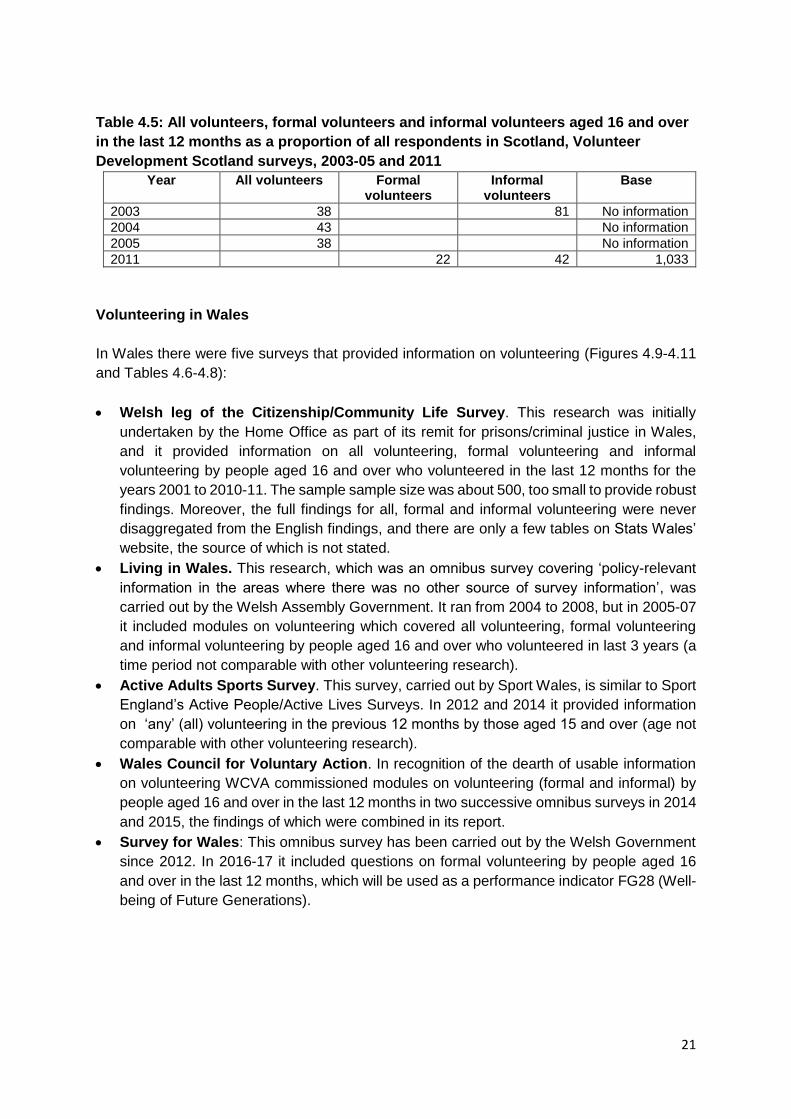
Volunteering in Wales
In Wales there were five surveys that provided information on volunteering (Figures 4.9-4.11
and Tables 4.6-4.8):
• Welsh leg of the Citizenship/Community Life Survey. This research was initially
undertaken by the Home Office as part of its remit for prisons/criminal justice in Wales,
and it provided information on all volunteering, formal volunteering and informal
volunteering by people aged 16 and over who volunteered in the last 12 months for the
years 2001 to 2010-11. The sample sample size was about 500, too small to provide robust
findings. Moreover, the full findings for all, formal and informal volunteering were never
disaggregated from the English findings, and there are only a few tables on Stats Wales’
website, the source of which is not stated.
• Living in Wales. This research, which was an omnibus survey covering ‘policy-relevant
information in the areas where there was no other source of survey information’, was
carried out by the Welsh Assembly Government. It ran from 2004 to 2008, but in 2005-07
it included modules on volunteering which covered all volunteering, formal volunteering
and informal volunteering by people aged 16 and over who volunteered in last 3 years (a
time period not comparable with other volunteering research).
• Active Adults Sports Survey. This survey, carried out by Sport Wales, is similar to Sport
England’s Active People/Active Lives Surveys. In 2012 and 2014 it provided information
on ‘any’ (all) volunteering in the previous 12 months by those aged 15 and over (age not
comparable with other volunteering research).
• Wales Council for Voluntary Action. In recognition of the dearth of usable information
on volunteering WCVA commissioned modules on volunteering (formal and informal) by
people aged 16 and over in the last 12 months in two successive omnibus surveys in 2014
and 2015, the findings of which were combined in its report.
• Survey for Wales: This omnibus survey has been carried out by the Welsh Government
since 2012. In 2016-17 it included questions on formal volunteering by people aged 16
and over in the last 12 months, which will be used as a performance indicator FG28 (Well-
being of Future Generations).
22
Figure 4.9: All volunteers as a proportion of all respondents in Wales, 2001 to 2016-17
(%)
Table 4.6: All volunteers as a proportion of all respondents in Wales, 2001 to 2016-17
(%)
Year Wales CS/CLS
Living in Wales
Active Adults
(Sports)
WCVA Base
2001 46 DK
2003 43 DK
2005 55 29 7,786
2006 28 7,443
2007 25 ca.7,500
2007-08 43 DK
2008-09 51 DK
2009-10 48 513
2010-11 43 566
2012 10 13,143
2014 9 8,156
2014-15 71 2,034
2016-17 10,499
4643
55
43
5148
43
29 2825
10 9
71
0
10
20
30
40
50
60
70
8020
01
20
03
20
05
20
06
20
07
20
07-0
8
20
08-0
9
20
09-1
0
20
10-1
1
20
12
20
14
20
14-1
5
Wales CS/CLS Living in Wales Active Adults WCVA
23
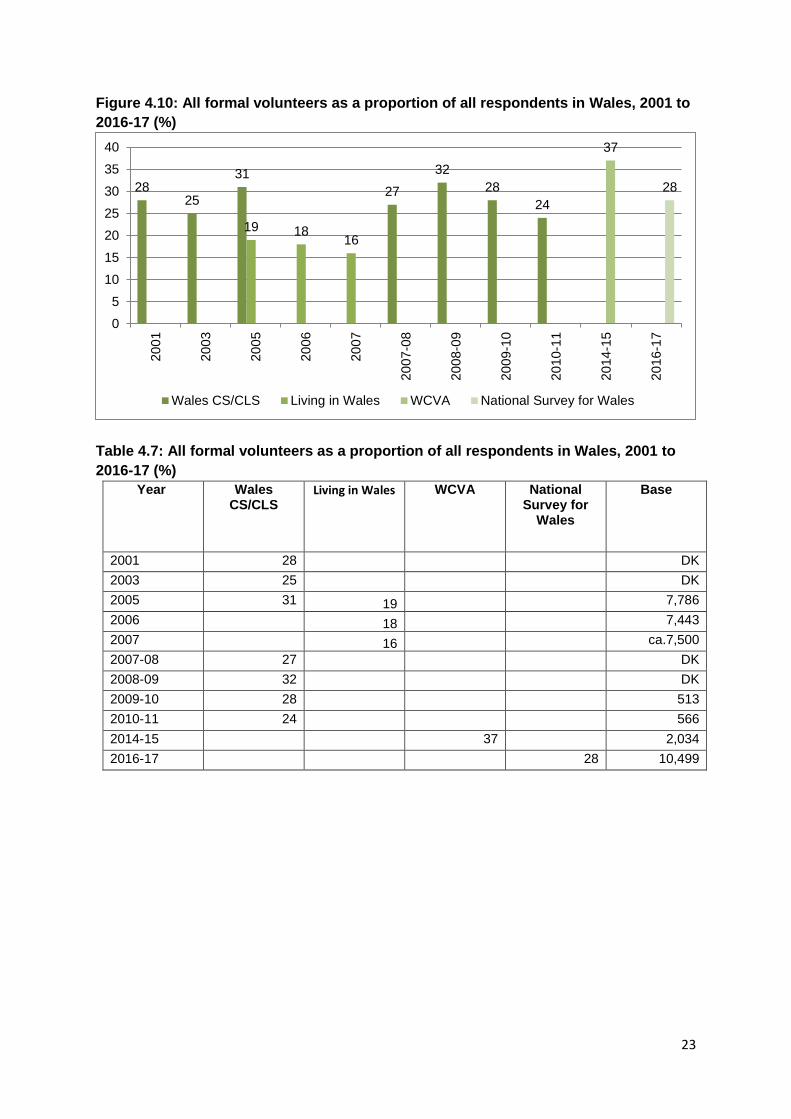
Figure 4.10: All formal volunteers as a proportion of all respondents in Wales, 2001 to
2016-17 (%)
Table 4.7: All formal volunteers as a proportion of all respondents in Wales, 2001 to
2016-17 (%)
Year Wales CS/CLS
Living in Wales WCVA National Survey for
Wales
Base
2001 28 DK
2003 25 DK
2005 31 19 7,786
2006 18 7,443
2007 16 ca.7,500
2007-08 27 DK
2008-09 32 DK
2009-10 28 513
2010-11 24 566
2014-15 37 2,034
2016-17 28 10,499
2825
31
27
32
28
24
19 1816
37
28
0
5
10
15
20
25
30
35
4020
01
20
03
20
05
20
06
20
07
20
07-0
8
20
08-0
9
20
09-1
0
20
10-1
1
20
14-1
5
20
16-1
7
Wales CS/CLS Living in Wales WCVA National Survey for Wales
24
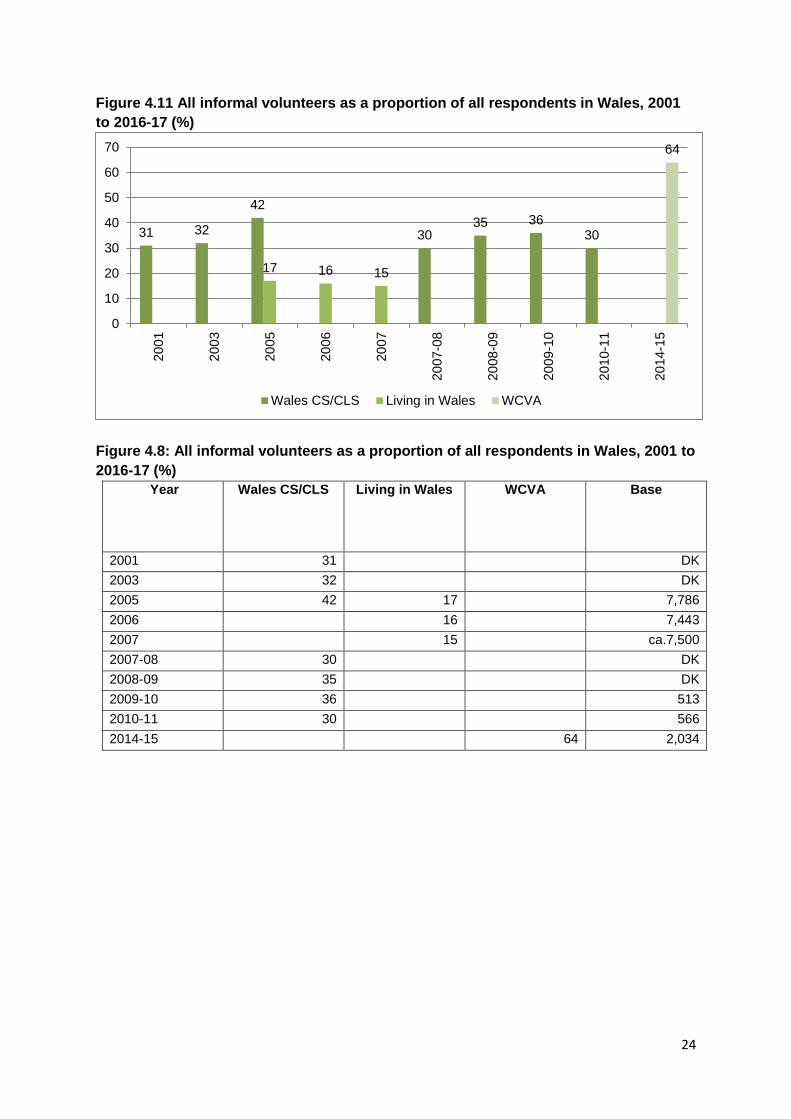
Figure 4.11 All informal volunteers as a proportion of all respondents in Wales, 2001
to 2016-17 (%)
Figure 4.8: All informal volunteers as a proportion of all respondents in Wales, 2001 to
2016-17 (%)
Year Wales CS/CLS Living in Wales WCVA Base
2001 31 DK
2003 32 DK
2005 42 17 7,786
2006 16 7,443
2007 15 ca.7,500
2007-08 30 DK
2008-09 35 DK
2009-10 36 513
2010-11 30 566
2014-15 64 2,034
31 32
42
3035 36
30
17 16 15
64
0
10
20
30
40
50
60
7020
01
20
03
20
05
20
06
20
07
20
07-0
8
20
08-0
9
20
09-1
0
20
10-1
1
20
14-1
5
Wales CS/CLS Living in Wales WCVA
25
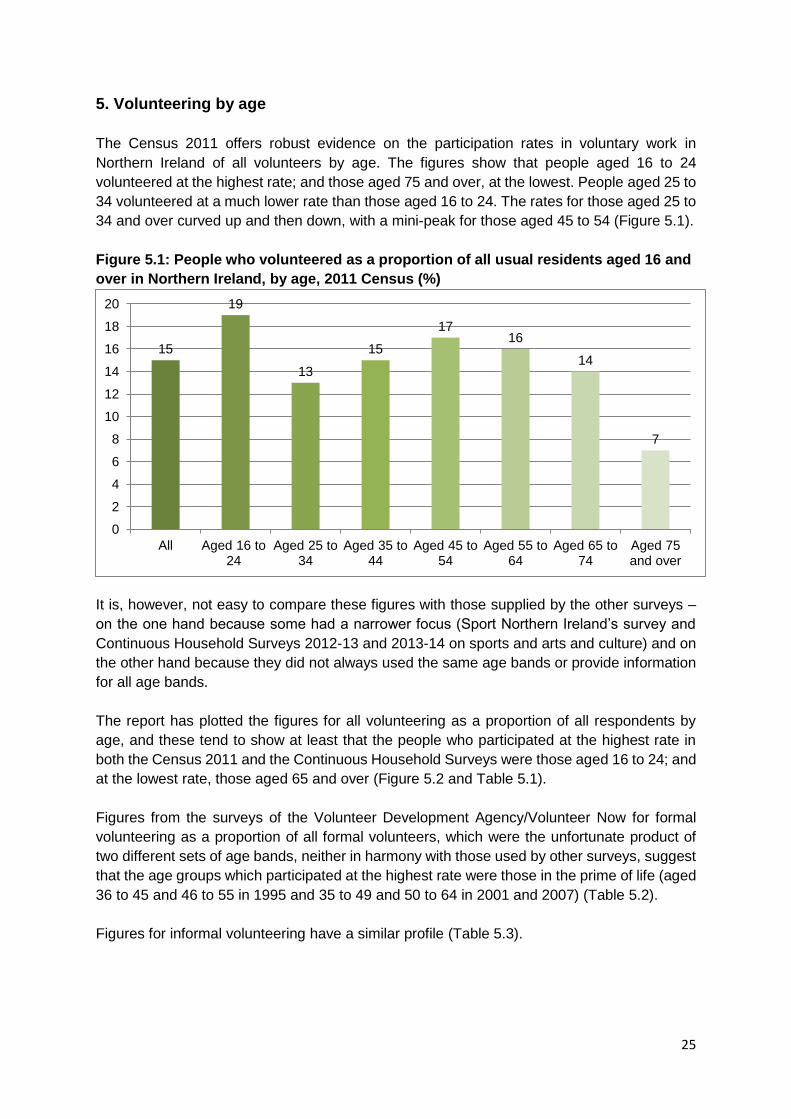
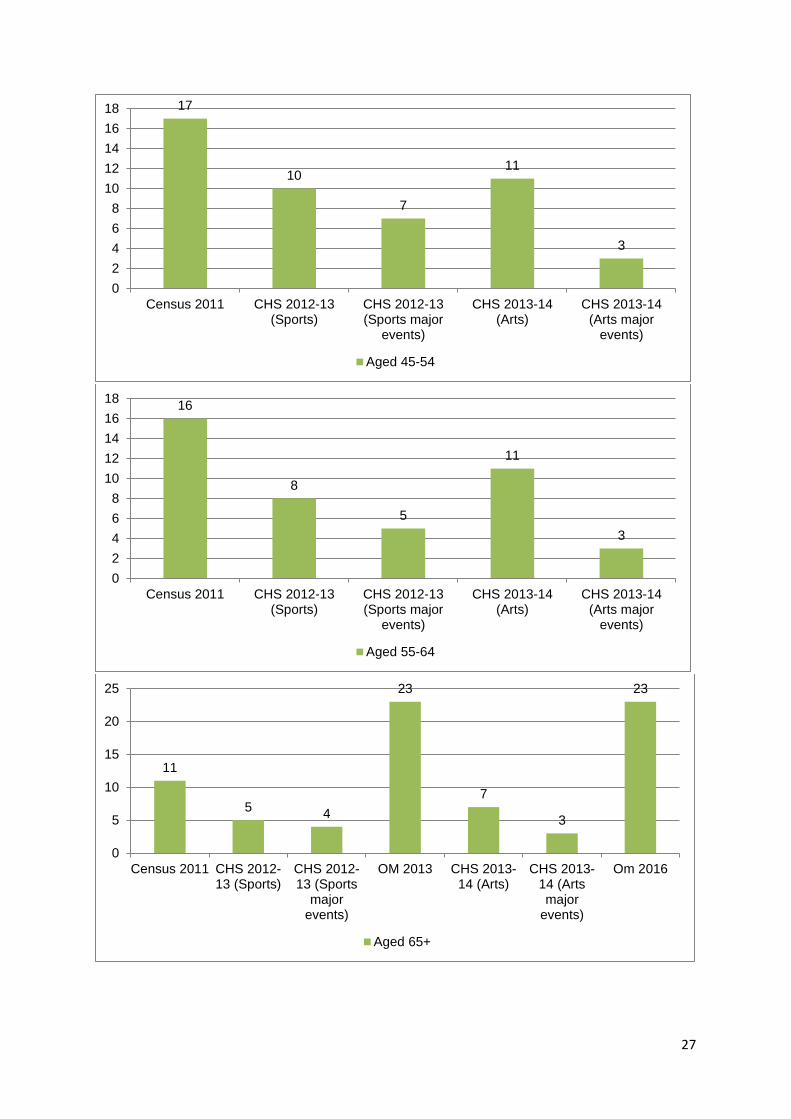
5. Volunteering by age
The Census 2011 offers robust evidence on the participation rates in voluntary work in
Northern Ireland of all volunteers by age. The figures show that people aged 16 to 24
volunteered at the highest rate; and those aged 75 and over, at the lowest. People aged 25 to
34 volunteered at a much lower rate than those aged 16 to 24. The rates for those aged 25 to
34 and over curved up and then down, with a mini-peak for those aged 45 to 54 (Figure 5.1).
Figure 5.1: People who volunteered as a proportion of all usual residents aged 16 and
over in Northern Ireland, by age, 2011 Census (%)
It is, however, not easy to compare these figures with those supplied by the other surveys –
on the one hand because some had a narrower focus (Sport Northern Ireland’s survey and
Continuous Household Surveys 2012-13 and 2013-14 on sports and arts and culture) and on
the other hand because they did not always used the same age bands or provide information
for all age bands.
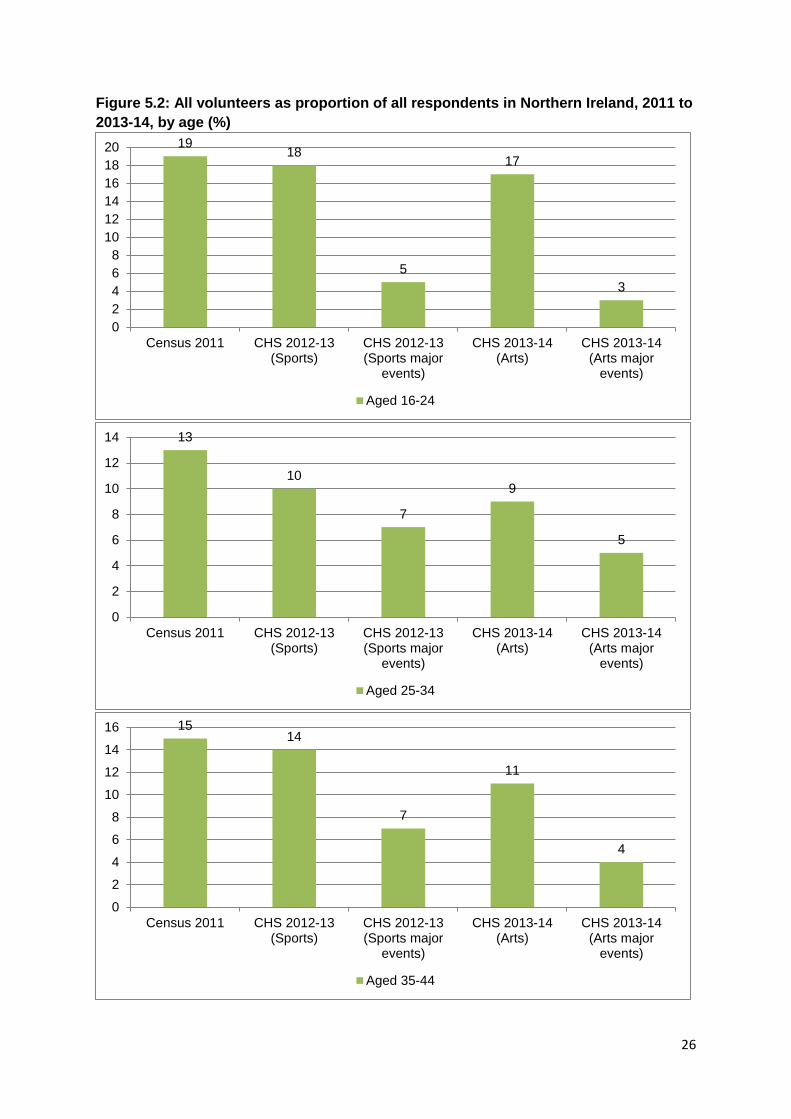
The report has plotted the figures for all volunteering as a proportion of all respondents by
age, and these tend to show at least that the people who participated at the highest rate in
both the Census 2011 and the Continuous Household Surveys were those aged 16 to 24; and
at the lowest rate, those aged 65 and over (Figure 5.2 and Table 5.1).
Figures from the surveys of the Volunteer Development Agency/Volunteer Now for formal
volunteering as a proportion of all formal volunteers, which were the unfortunate product of
two different sets of age bands, neither in harmony with those used by other surveys, suggest
that the age groups which participated at the highest rate were those in the prime of life (aged
36 to 45 and 46 to 55 in 1995 and 35 to 49 and 50 to 64 in 2001 and 2007) (Table 5.2).
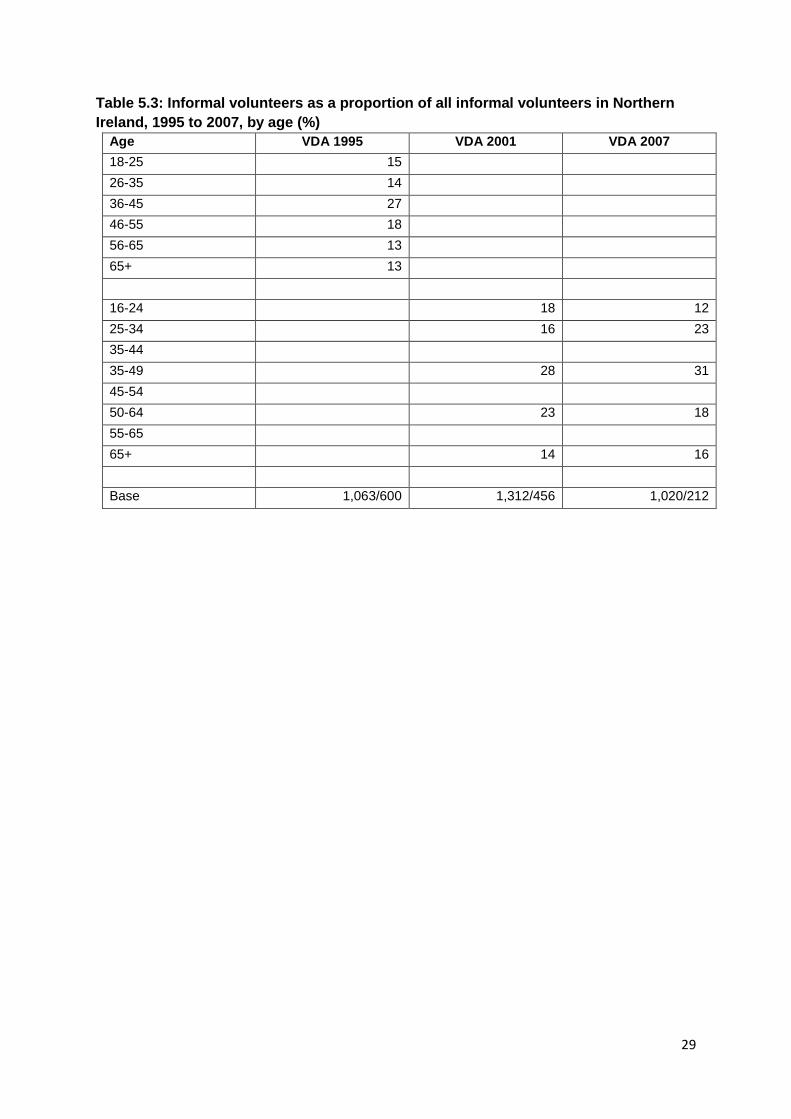
Figures for informal volunteering have a similar profile (Table 5.3).
15
19
13
15
1716
14
7
0
2
4
6
8
10
12
14
16
18
20
All Aged 16 to 24
Aged 25 to 34
Aged 35 to 44
Aged 45 to 54
Aged 55 to 64
Aged 65 to 74
Aged 75 and over
26
Figure 5.2: All volunteers as proportion of all respondents in Northern Ireland, 2011 to
2013-14, by age (%)
1918
5
17
3
0
2
4
6
8
10
12
14
16
18
20
Census 2011 CHS 2012-13(Sports)
CHS 2012-13(Sports major
events)
CHS 2013-14(Arts)
CHS 2013-14(Arts major
events)
Aged 16-24
13
10
7
9
5
0
2
4
6
8
10
12
14
Census 2011 CHS 2012-13(Sports)
CHS 2012-13(Sports major
events)
CHS 2013-14(Arts)
CHS 2013-14(Arts major
events)
Aged 25-34
1514
7
11
4
0
2
4
6
8
10
12
14
16
Census 2011 CHS 2012-13(Sports)
CHS 2012-13(Sports major
events)
CHS 2013-14(Arts)
CHS 2013-14(Arts major
events)
Aged 35-44
27
17
10
7
11
3
0
2
4
6
8
10
12
14
16
18
Census 2011 CHS 2012-13(Sports)
CHS 2012-13(Sports major
events)
CHS 2013-14(Arts)
CHS 2013-14(Arts major
events)
Aged 45-54
16
8
5
11
3
0
2
4
6
8
10
12
14
16
18
Census 2011 CHS 2012-13(Sports)
CHS 2012-13(Sports major
events)
CHS 2013-14(Arts)
CHS 2013-14(Arts major
events)
Aged 55-64
11
54
23
7
3
23
0
5
10
15
20
25
Census 2011 CHS 2012-13 (Sports)
CHS 2012-13 (Sports
majorevents)
OM 2013 CHS 2013-14 (Arts)
CHS 2013-14 (Artsmajor
events)
Om 2016
Aged 65+

28
Table 5.1: All volunteers as proportion of all respondents in Northern Ireland, 2009-10
to 2016, by age (%)
Age Sport NI 2009-10
Census 2011
CHS 2012-13 (Sports)
CHS 2012-13 (Sports major
events)
CHS 2013-14 (Arts)
CHS 2013-14
(Arts major
events)
Om 2013
Om 2016
16-29 9
30-49 12
50+ 5
16-24 19 18 5 17 3
25-34 13 10 7 9 5
35-44 15 14 7 11 4
45-54 17 10 7 11 3
55-65 16 8 5 11 3
65+ 11 5 4 7 3
16-24 35 29
65 + 23 23
Base 4,653 1,431,540 3,625 3,625 3,750 3,750 1,170 945
Table 5.2: Formal volunteers as a proportion of all formal volunteers in Northern
Ireland, 1995 to 2007, by age (%)
Age VDA 1995 VDA 2001 VDA 2007
18-25 15
26-35 14
36-45 27
46-55 18
56-65 13
65+ 13
16-24 18 15
25-34 16 16
35-44
35-49 28 34
45-54
50-64 23 18
55-65
65+ 14 17
Base 1,063/194 1,312/456 1,020/212
29
Table 5.3: Informal volunteers as a proportion of all informal volunteers in Northern
Ireland, 1995 to 2007, by age (%)
Age VDA 1995 VDA 2001 VDA 2007
18-25 15
26-35 14
36-45 27
46-55 18
56-65 13
65+ 13
16-24 18 12
25-34 16 23
35-44
35-49 28 31
45-54
50-64 23 18
55-65
65+ 14 16
Base 1,063/600 1,312/456 1,020/212
30
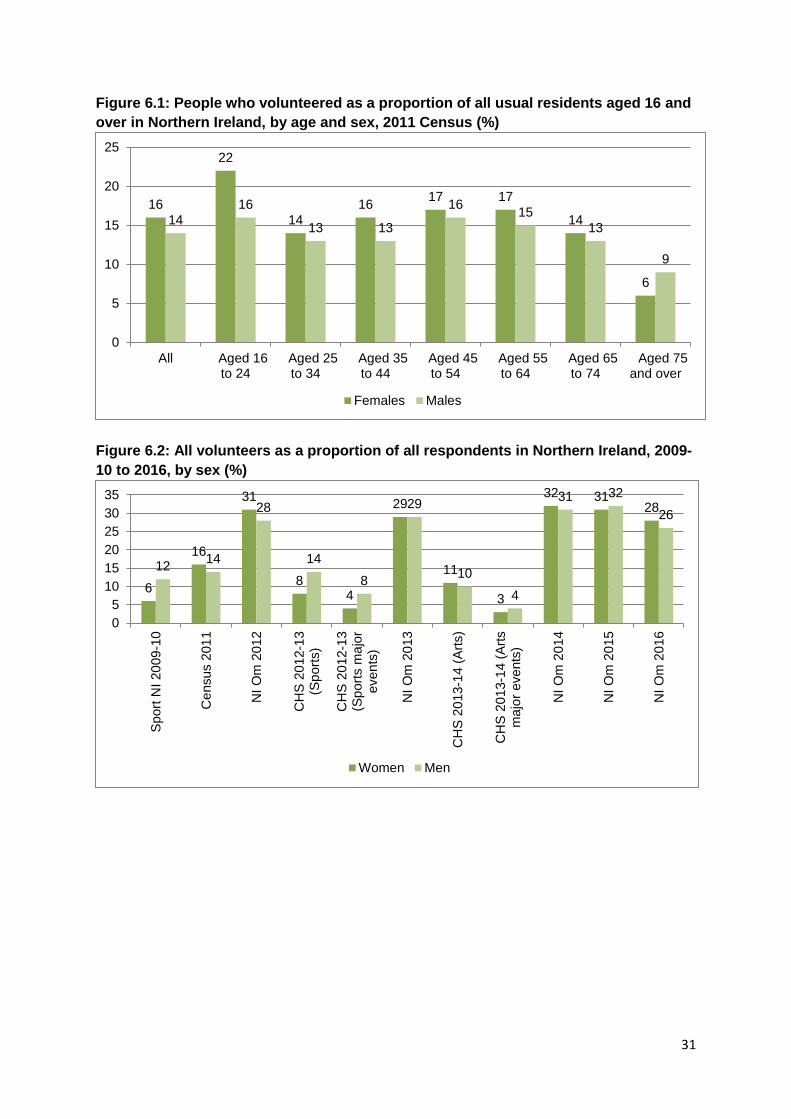
6. Volunteering by age and sex
These figures also show that there were differences in women’s and men’s participation rates
by age, (Figures 6.1 and 6.2).
There have been some difficulties in comparing women’s and men’s rates of participation in
volunteering due to the different ways the information was presented (women and men as a
proportion of all respondents or as a proportion of all volunteers/formal volunteers/informal
volunteers). For the sake of comparability we have shown women’s and men’s participation
as a proportion of all respondents, which has involved some recalculations of figures set out
in the first two reports of the Volunteer Development Agency/Volunteer Now.
For all volunteers the most reliable figures are those from the Census 2011, which show that
16% of women and 14% of men volunteered, just about equal. There were, however,
differences in the rates of participation by age and sex which were slight, except, perhaps, for
those aged 16-24 (Figure 6.1). Figures from the Northern Ireland Omnibus surveys show that
women’s and men’s rates of participation were just about equal (except perhaps for 2012) and
stable. Figures from Sport Northern Ireland’s survey and the Continuous Household Surveys
2012-13 and 2013-14 show that men volunteered at a higher rate than women in the field of
sports but at an equal rate in the field of arts and culture (Figures 6.1 and 6.2 and Table 6.1)
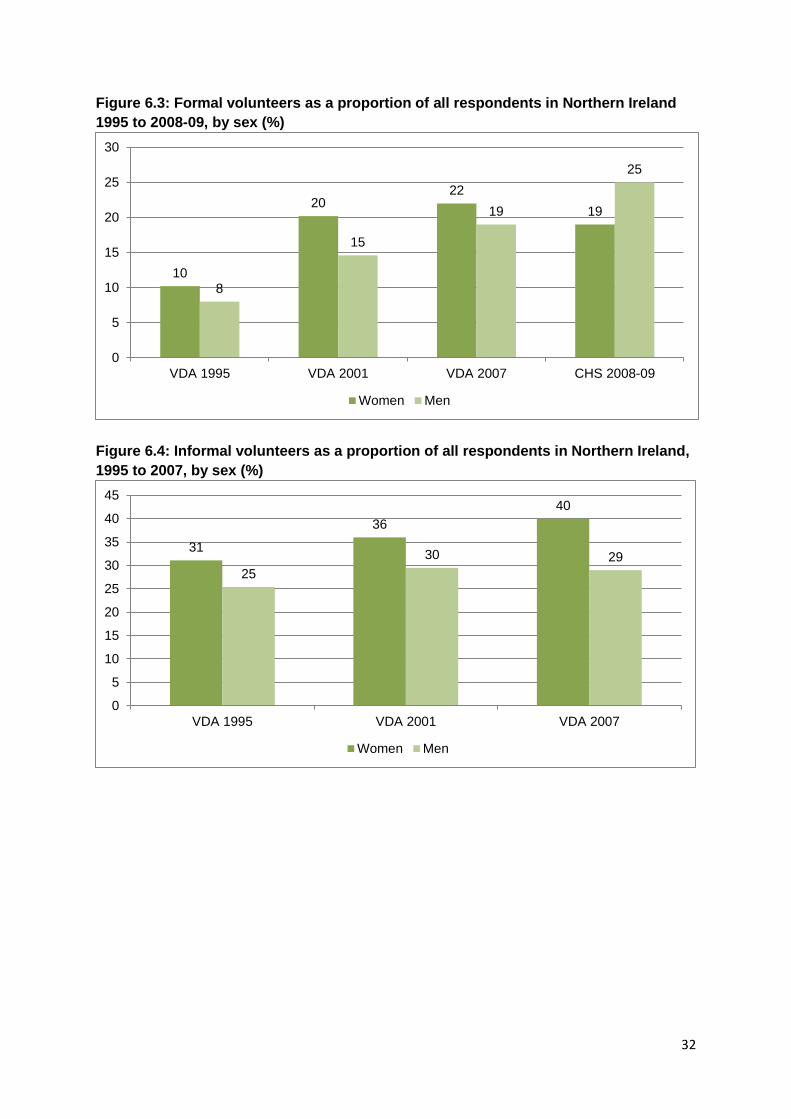
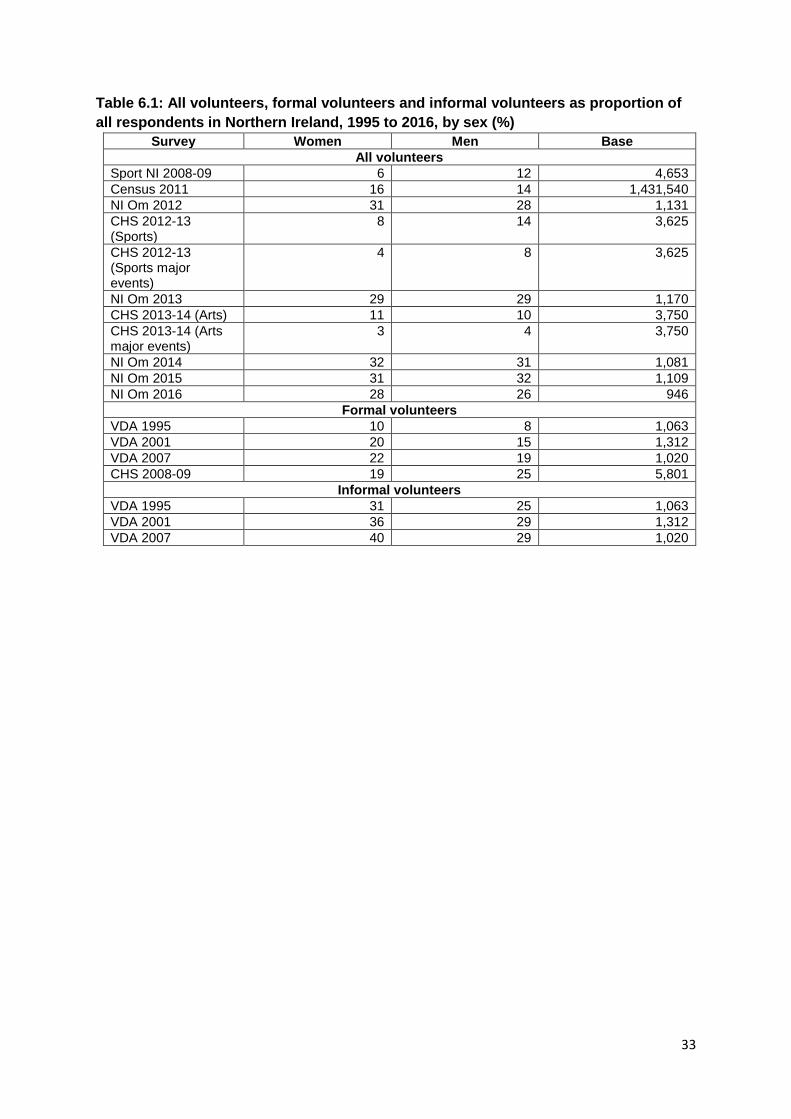
For formal volunteers figures from the surveys of the Volunteer Development Agency/
Volunteer Now show that women participated at a higher rate than men and that this was
increasing (women accounted for 61% of formal volunteers in 2007). The figures from the
Continuous Household Survey 2008-09 (about which we have only limited information)
suggest otherwise (Figure 6.3 and Table 6.1).
For informal volunteers figures from the surveys of the Volunteer Development Agency/
Volunteer Now show an even greater – and increasing – rate of participation by women (who
accounted for 65% of informal volunteers in 2007) (Figure 6.4 and Table 6.1).
31
Figure 6.1: People who volunteered as a proportion of all usual residents aged 16 and
over in Northern Ireland, by age and sex, 2011 Census (%)
Figure 6.2: All volunteers as a proportion of all respondents in Northern Ireland, 2009-
10 to 2016, by sex (%)
16
22
14
1617 17
14
6
14
16
13 13
1615
13
9
0
5
10
15
20
25
All Aged 16to 24
Aged 25to 34
Aged 35to 44
Aged 45to 54
Aged 55to 64
Aged 65to 74
Aged 75and over
Females Males
6
16
31
84
29
11
3
32 3128
1214
28
14
8
29
10
4
31 32
26
0
5
10
15
20
25
30
35
Sport
NI 20
09-1
0
Ce
nsus 2
01
1
NI
Om
20
12
CH
S 2
012-1
3(S
port
s)
CH
S 2
012-1
3(S
port
s m
ajo
reven
ts)
NI
Om
20
13
CH
S 2
013-1
4 (
Art
s)
CH
S 2
013-1
4 (
Art
sm
ajo
r events
)
NI
Om
20
14
NI
Om
20
15
NI
Om
20
16
Women Men
32
Figure 6.3: Formal volunteers as a proportion of all respondents in Northern Ireland
1995 to 2008-09, by sex (%)
Figure 6.4: Informal volunteers as a proportion of all respondents in Northern Ireland,
1995 to 2007, by sex (%)
10
2022
19
8
15
19
25
0
5
10
15
20
25
30
VDA 1995 VDA 2001 VDA 2007 CHS 2008-09
Women Men
31
36
40
25
30 29
0
5
10
15
20
25
30
35
40
45
VDA 1995 VDA 2001 VDA 2007
Women Men
33
Table 6.1: All volunteers, formal volunteers and informal volunteers as proportion of
all respondents in Northern Ireland, 1995 to 2016, by sex (%)
Survey Women Men Base
All volunteers
Sport NI 2008-09 6 12 4,653
Census 2011 16 14 1,431,540
NI Om 2012 31 28 1,131
CHS 2012-13 (Sports)
8 14 3,625
CHS 2012-13 (Sports major events)
4 8 3,625
NI Om 2013 29 29 1,170
CHS 2013-14 (Arts) 11 10 3,750
CHS 2013-14 (Arts major events)
3 4 3,750
NI Om 2014 32 31 1,081
NI Om 2015 31 32 1,109
NI Om 2016 28 26 946
Formal volunteers
VDA 1995 10 8 1,063
VDA 2001 20 15 1,312
VDA 2007 22 19 1,020
CHS 2008-09 19 25 5,801
Informal volunteers
VDA 1995 31 25 1,063
VDA 2001 36 29 1,312
VDA 2007 40 29 1,020

34
7. Volunteering by disability status
Figures from the Census 2011 show that people in very good health had the highest rate of
volunteering; those in very bad health, the lowest rate; and there was a clear downward trend
between these end points on the scale (Figure 7.1). They also show that, as with general
health, there was a clear correlation between the limitation (or not) of day-to-day activities and
rates of volunteering. People who had no limitations had the highest rate, followed by those
who were limited ‘a little’ and then, with the lowest rate, those who were limited ‘a lot’ (Figure
7.2).
Figure 7.1: People who volunteered as a proportion of all usual residents aged 16 and
over in Northern Ireland, by general health, 2011 Census (%)
Figure 7.2: People who volunteered as a proportion of all usual residents aged 16 and
over in Northern Ireland, by limitation of day-to-day activities, 2011 Census (%)
15
19
16
9
5
3
0
2
4
6
8
10
12
14
16
18
20
All Very goodhealth
Good health Fair health Bad health Very badhealth
15
17
14
5
0
2
4
6
8
10
12
14
16
18
All Day-to-day activitiesnot limited
Day-to-day activitieslimited a little
Day-to-day activitieslimited a lot
35
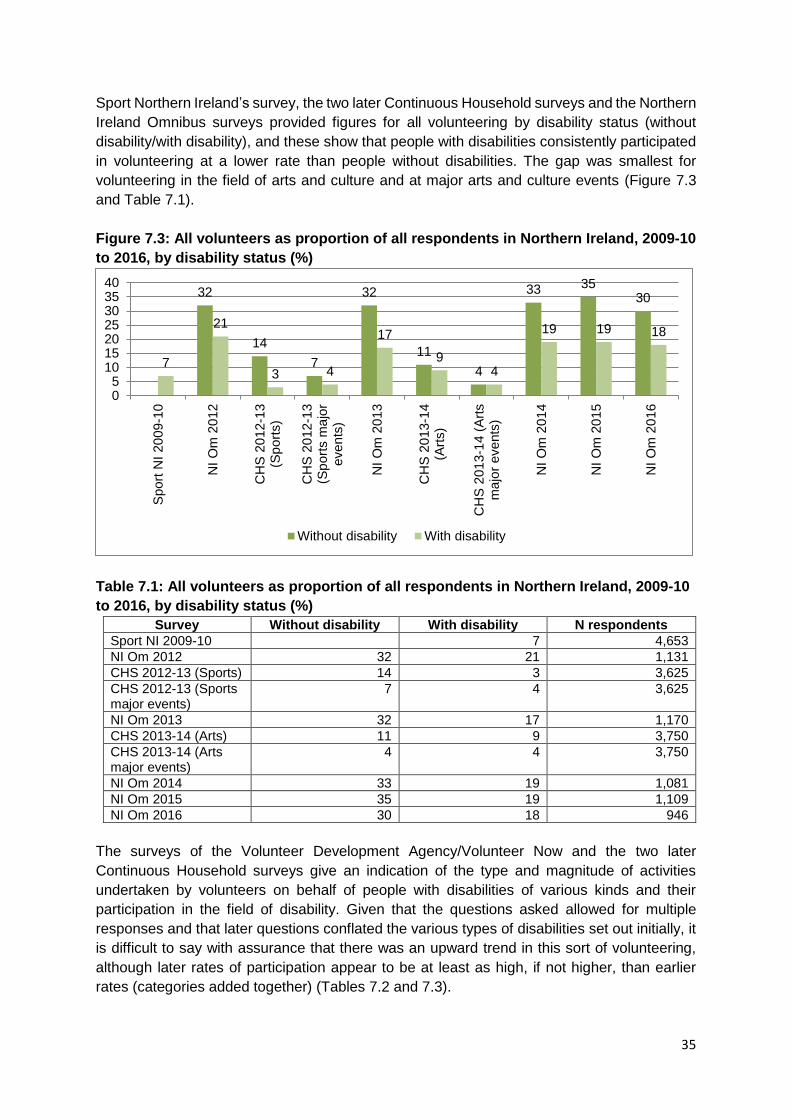
Sport Northern Ireland’s survey, the two later Continuous Household surveys and the Northern
Ireland Omnibus surveys provided figures for all volunteering by disability status (without
disability/with disability), and these show that people with disabilities consistently participated
in volunteering at a lower rate than people without disabilities. The gap was smallest for
volunteering in the field of arts and culture and at major arts and culture events (Figure 7.3
and Table 7.1).
Figure 7.3: All volunteers as proportion of all respondents in Northern Ireland, 2009-10
to 2016, by disability status (%)
Table 7.1: All volunteers as proportion of all respondents in Northern Ireland, 2009-10
to 2016, by disability status (%)
Survey Without disability With disability N respondents
Sport NI 2009-10 7 4,653
NI Om 2012 32 21 1,131
CHS 2012-13 (Sports) 14 3 3,625
CHS 2012-13 (Sports major events)
7 4 3,625
NI Om 2013 32 17 1,170
CHS 2013-14 (Arts) 11 9 3,750
CHS 2013-14 (Arts major events)
4 4 3,750
NI Om 2014 33 19 1,081
NI Om 2015 35 19 1,109
NI Om 2016 30 18 946
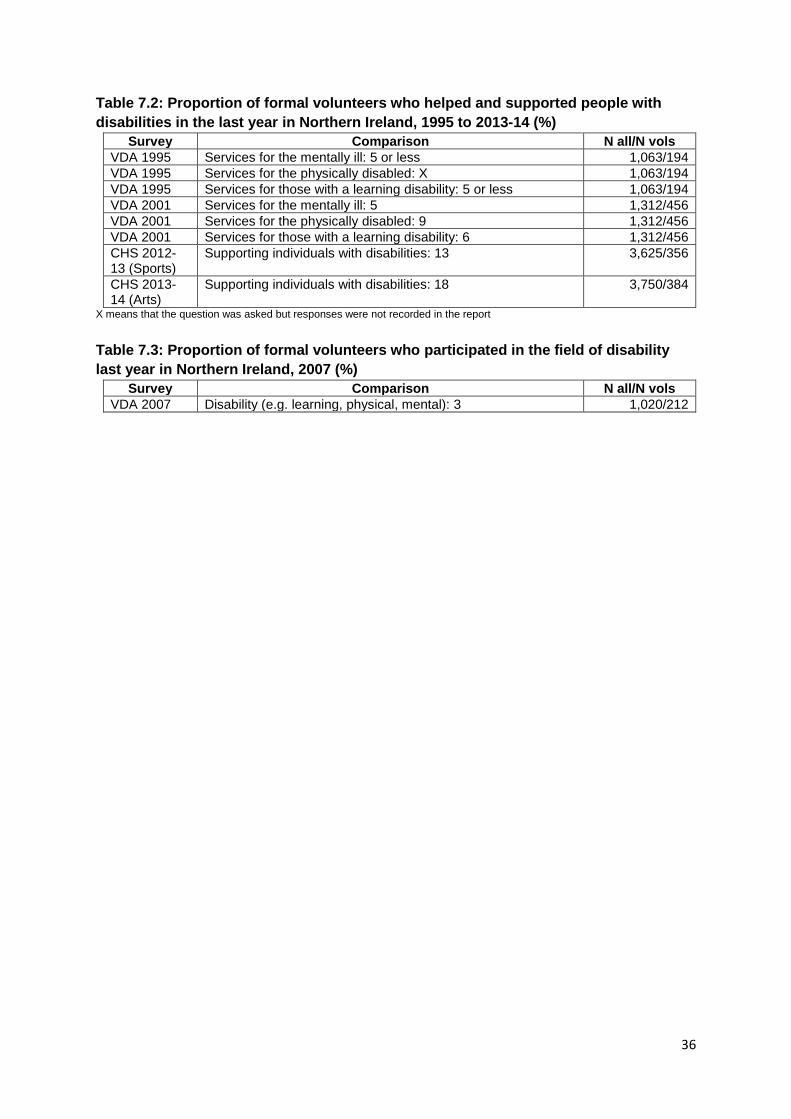
The surveys of the Volunteer Development Agency/Volunteer Now and the two later
Continuous Household surveys give an indication of the type and magnitude of activities
undertaken by volunteers on behalf of people with disabilities of various kinds and their
participation in the field of disability. Given that the questions asked allowed for multiple
responses and that later questions conflated the various types of disabilities set out initially, it
is difficult to say with assurance that there was an upward trend in this sort of volunteering,
although later rates of participation appear to be at least as high, if not higher, than earlier
rates (categories added together) (Tables 7.2 and 7.3).
32
14
7
32
11
4
33 3530
7
21
3 4
17
94
19 19 18
05
10152025303540
Sport
NI 20
09-1
0
NI
Om
20
12
CH
S 2
012-1
3(S
port
s)
CH
S 2
012-1
3(S
port
s m
ajo
reven
ts)
NI
Om
20
13
CH
S 2
013-1
4(A
rts)
CH
S 2
013-1
4 (
Art
sm
ajo
r events
)
NI
Om
20
14
NI
Om
20
15
NI
Om
20
16
Without disability With disability
36
Table 7.2: Proportion of formal volunteers who helped and supported people with
disabilities in the last year in Northern Ireland, 1995 to 2013-14 (%)
Survey Comparison N all/N vols
VDA 1995 Services for the mentally ill: 5 or less 1,063/194
VDA 1995 Services for the physically disabled: X 1,063/194
VDA 1995 Services for those with a learning disability: 5 or less 1,063/194
VDA 2001 Services for the mentally ill: 5 1,312/456
VDA 2001 Services for the physically disabled: 9 1,312/456
VDA 2001 Services for those with a learning disability: 6 1,312/456
CHS 2012-13 (Sports)
Supporting individuals with disabilities: 13 3,625/356
CHS 2013-14 (Arts)
Supporting individuals with disabilities: 18 3,750/384
X means that the question was asked but responses were not recorded in the report
Table 7.3: Proportion of formal volunteers who participated in the field of disability
last year in Northern Ireland, 2007 (%)
Survey Comparison N all/N vols
VDA 2007 Disability (e.g. learning, physical, mental): 3 1,020/212
37
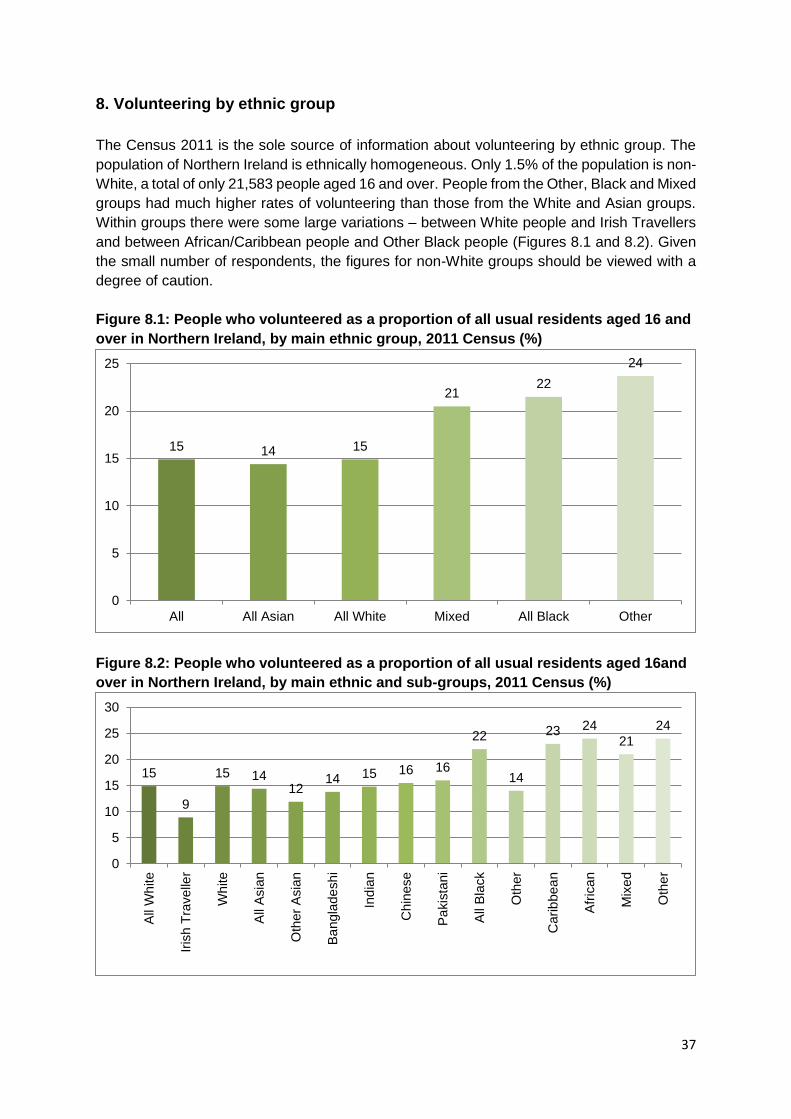
8. Volunteering by ethnic group
The Census 2011 is the sole source of information about volunteering by ethnic group. The
population of Northern Ireland is ethnically homogeneous. Only 1.5% of the population is non-
White, a total of only 21,583 people aged 16 and over. People from the Other, Black and Mixed
groups had much higher rates of volunteering than those from the White and Asian groups.
Within groups there were some large variations – between White people and Irish Travellers
and between African/Caribbean people and Other Black people (Figures 8.1 and 8.2). Given
the small number of respondents, the figures for non-White groups should be viewed with a
degree of caution.
Figure 8.1: People who volunteered as a proportion of all usual residents aged 16 and
over in Northern Ireland, by main ethnic group, 2011 Census (%)
Figure 8.2: People who volunteered as a proportion of all usual residents aged 16and
over in Northern Ireland, by main ethnic and sub-groups, 2011 Census (%)
15 14 15
2122
24
0
5
10
15
20
25
All All Asian All White Mixed All Black Other
15
9
15 1412
14 15 16 16
22
14
23 24
21
24
0
5
10
15
20
25
30
All
Wh
ite
Iris
h T
ravelle
r
Wh
ite
All
Asia
n
Oth
er
Asia
n
Ba
ngla
de
sh
i
Ind
ian
Chin
ese
Pa
kis
tani
All
Bla
ck
Oth
er
Carib
bea
n
Afr
ica
n
Mix
ed
Oth
er
38
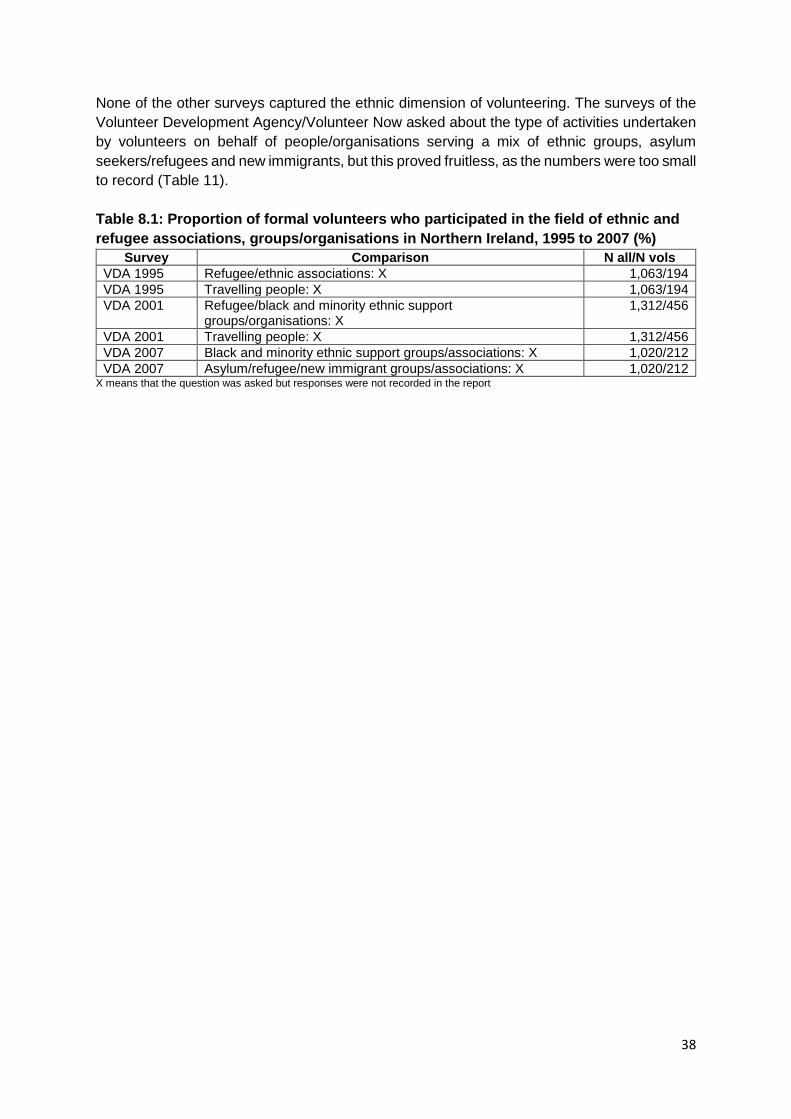
None of the other surveys captured the ethnic dimension of volunteering. The surveys of the
Volunteer Development Agency/Volunteer Now asked about the type of activities undertaken
by volunteers on behalf of people/organisations serving a mix of ethnic groups, asylum
seekers/refugees and new immigrants, but this proved fruitless, as the numbers were too small
to record (Table 11).
Table 8.1: Proportion of formal volunteers who participated in the field of ethnic and
refugee associations, groups/organisations in Northern Ireland, 1995 to 2007 (%)
Survey Comparison N all/N vols
VDA 1995 Refugee/ethnic associations: X 1,063/194
VDA 1995 Travelling people: X 1,063/194
VDA 2001 Refugee/black and minority ethnic support groups/organisations: X
1,312/456
VDA 2001 Travelling people: X 1,312/456
VDA 2007 Black and minority ethnic support groups/associations: X 1,020/212
VDA 2007 Asylum/refugee/new immigrant groups/associations: X 1,020/212 X means that the question was asked but responses were not recorded in the report
39
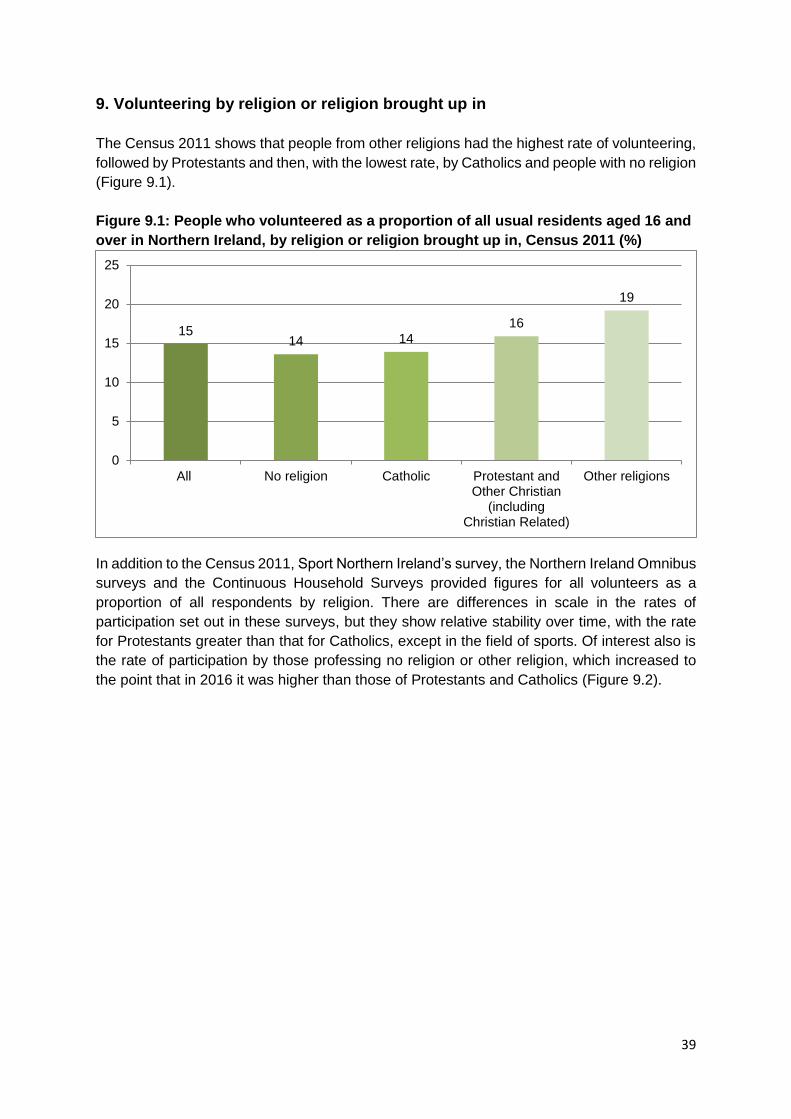
9. Volunteering by religion or religion brought up in
The Census 2011 shows that people from other religions had the highest rate of volunteering,
followed by Protestants and then, with the lowest rate, by Catholics and people with no religion
(Figure 9.1).
Figure 9.1: People who volunteered as a proportion of all usual residents aged 16 and
over in Northern Ireland, by religion or religion brought up in, Census 2011 (%)
In addition to the Census 2011, Sport Northern Ireland’s survey, the Northern Ireland Omnibus
surveys and the Continuous Household Surveys provided figures for all volunteers as a
proportion of all respondents by religion. There are differences in scale in the rates of
participation set out in these surveys, but they show relative stability over time, with the rate
for Protestants greater than that for Catholics, except in the field of sports. Of interest also is
the rate of participation by those professing no religion or other religion, which increased to
the point that in 2016 it was higher than those of Protestants and Catholics (Figure 9.2).
1514 14
16
19
0
5
10
15
20
25
All No religion Catholic Protestant andOther Christian
(includingChristian Related)
Other religions

40
Figure 9.2: All volunteers as proportion of all respondents in Northern Ireland, 2009-10
to 2016, by religion (%)
The surveys of the Volunteer Development Agency/Volunteer Now show changes in the rates
at which Protestants and Catholics volunteered both formally and informally. The figures
suggest that, while Protestants volunteered at a rate substantially higher than Catholics, this
rate was declining, while that of Catholics was increasing (Figures 9.3 and 9.4).
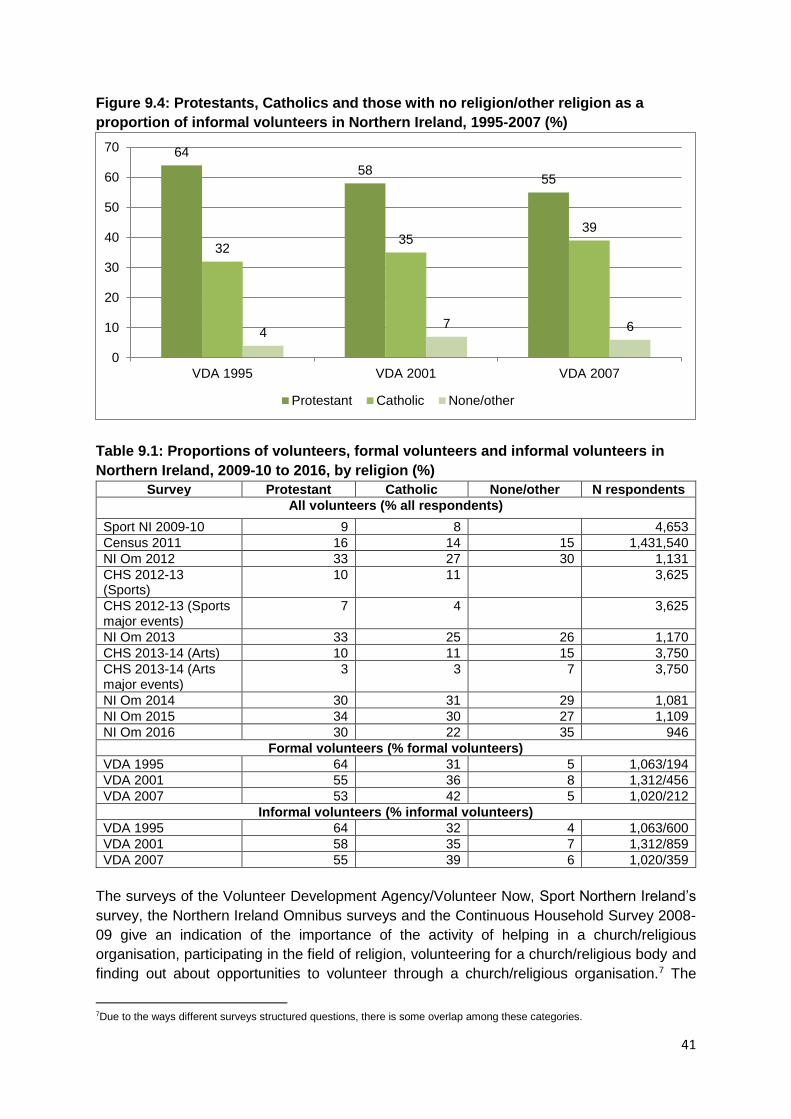
Figure 9.3: Protestants, Catholics and those with no religion/other religion as a
proportion of formal volunteers in Northern Ireland, 1995 to 2007 (%)
64
55 53
3136
42
58
5
0
10
20
30
40
50
60
70
VDA 1995 VDA 2001 VDA 2007
Protestant Catholic None/other
9
16
33
107
33
10
3
30
34
30
8
14
27
11
4
25
11
3
31 30
22
15
26
15
7
2927
35
0
5
10
15
20
25
30
35
40
Sport
NI 20
09-1
0
Ce
nsus 2
01
1
NI
Om
20
12
CH
S 2
012-1
3(S
port
s)
CH
S 2
012-1
3(S
port
s m
ajo
reven
ts)
NI
Om
20
13
CH
S 2
013-1
4 (
Art
s)
CH
S 2
013-1
4 (
Art
sm
ajo
r events
)
NI
Om
20
14
NI
Om
20
15
NI
Om
20
16
Protestant Catholic None/other
41
Figure 9.4: Protestants, Catholics and those with no religion/other religion as a
proportion of informal volunteers in Northern Ireland, 1995-2007 (%)
Table 9.1: Proportions of volunteers, formal volunteers and informal volunteers in
Northern Ireland, 2009-10 to 2016, by religion (%)
Survey Protestant Catholic None/other N respondents
All volunteers (% all respondents)
Sport NI 2009-10 9 8 4,653
Census 2011 16 14 15 1,431,540
NI Om 2012 33 27 30 1,131
CHS 2012-13 (Sports)
10 11 3,625
CHS 2012-13 (Sports major events)
7 4 3,625
NI Om 2013 33 25 26 1,170
CHS 2013-14 (Arts) 10 11 15 3,750
CHS 2013-14 (Arts major events)
3 3 7 3,750
NI Om 2014 30 31 29 1,081
NI Om 2015 34 30 27 1,109
NI Om 2016 30 22 35 946
Formal volunteers (% formal volunteers)
VDA 1995 64 31 5 1,063/194
VDA 2001 55 36 8 1,312/456
VDA 2007 53 42 5 1,020/212
Informal volunteers (% informal volunteers)
VDA 1995 64 32 4 1,063/600
VDA 2001 58 35 7 1,312/859
VDA 2007 55 39 6 1,020/359
The surveys of the Volunteer Development Agency/Volunteer Now, Sport Northern Ireland’s
survey, the Northern Ireland Omnibus surveys and the Continuous Household Survey 2008-
09 give an indication of the importance of the activity of helping in a church/religious
organisation, participating in the field of religion, volunteering for a church/religious body and
finding out about opportunities to volunteer through a church/religious organisation.7 The
7Due to the ways different surveys structured questions, there is some overlap among these categories.
64
5855
3235
39
47 6
0
10
20
30
40
50
60
70
VDA 1995 VDA 2001 VDA 2007
Protestant Catholic None/other
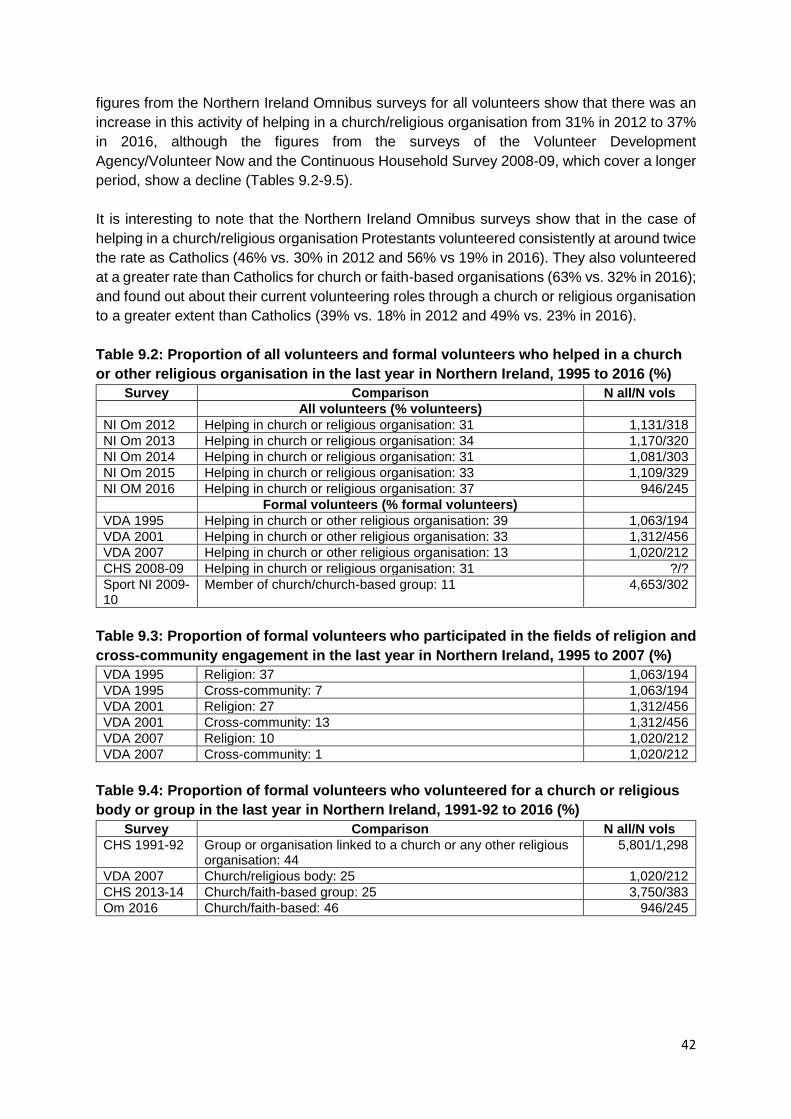
42
figures from the Northern Ireland Omnibus surveys for all volunteers show that there was an
increase in this activity of helping in a church/religious organisation from 31% in 2012 to 37%
in 2016, although the figures from the surveys of the Volunteer Development
Agency/Volunteer Now and the Continuous Household Survey 2008-09, which cover a longer
period, show a decline (Tables 9.2-9.5).
It is interesting to note that the Northern Ireland Omnibus surveys show that in the case of
helping in a church/religious organisation Protestants volunteered consistently at around twice
the rate as Catholics (46% vs. 30% in 2012 and 56% vs 19% in 2016). They also volunteered
at a greater rate than Catholics for church or faith-based organisations (63% vs. 32% in 2016);
and found out about their current volunteering roles through a church or religious organisation
to a greater extent than Catholics (39% vs. 18% in 2012 and 49% vs. 23% in 2016).
Table 9.2: Proportion of all volunteers and formal volunteers who helped in a church
or other religious organisation in the last year in Northern Ireland, 1995 to 2016 (%)
Survey Comparison N all/N vols
All volunteers (% volunteers)
NI Om 2012 Helping in church or religious organisation: 31 1,131/318
NI Om 2013 Helping in church or religious organisation: 34 1,170/320
NI Om 2014 Helping in church or religious organisation: 31 1,081/303
NI Om 2015 Helping in church or religious organisation: 33 1,109/329
NI OM 2016 Helping in church or religious organisation: 37 946/245
Formal volunteers (% formal volunteers)
VDA 1995 Helping in church or other religious organisation: 39 1,063/194
VDA 2001 Helping in church or other religious organisation: 33 1,312/456
VDA 2007 Helping in church or other religious organisation: 13 1,020/212
CHS 2008-09 Helping in church or religious organisation: 31 ?/?
Sport NI 2009-10
Member of church/church-based group: 11 4,653/302
Table 9.3: Proportion of formal volunteers who participated in the fields of religion and
cross-community engagement in the last year in Northern Ireland, 1995 to 2007 (%)
VDA 1995 Religion: 37 1,063/194
VDA 1995 Cross-community: 7 1,063/194
VDA 2001 Religion: 27 1,312/456
VDA 2001 Cross-community: 13 1,312/456
VDA 2007 Religion: 10 1,020/212
VDA 2007 Cross-community: 1 1,020/212
Table 9.4: Proportion of formal volunteers who volunteered for a church or religious
body or group in the last year in Northern Ireland, 1991-92 to 2016 (%)
Survey Comparison N all/N vols
CHS 1991-92 Group or organisation linked to a church or any other religious organisation: 44
5,801/1,298
VDA 2007 Church/religious body: 25 1,020/212
CHS 2013-14 Church/faith-based group: 25 3,750/383
Om 2016 Church/faith-based: 46 946/245

43
Table 9.5: Proportion of all volunteers and formal volunteers who found out about
their present volunteering roles through a church or religious organisation in
Northern Ireland, 1995 to 2016 (%)
Survey Comparison N all/N vols
All volunteers (% volunteers)
Om 2012 Through a church or religious organisation: 27 1,131/318
Om 2013 Through a church or religious organisation: 37 1,170/320
Om 2014 Through a church or religious organisation: 27
Om 2015 Through a church or religious organisation:32 1,081/303
Om 2016 Through a church or religious organisation: 35 1,109/329
Formal volunteers (% formal volunteers) 946/245
VDA 1995 Through a church or religious organisation: 28 1,063/194
VDA 2001 Through a church or religious organisation: 22 1,312/456
VDA 2007 Through a church or religious organisation: 15 1,020/212
CHS 2013-14 (Sports)
Church/faith-based group: 22 3,750/384
44
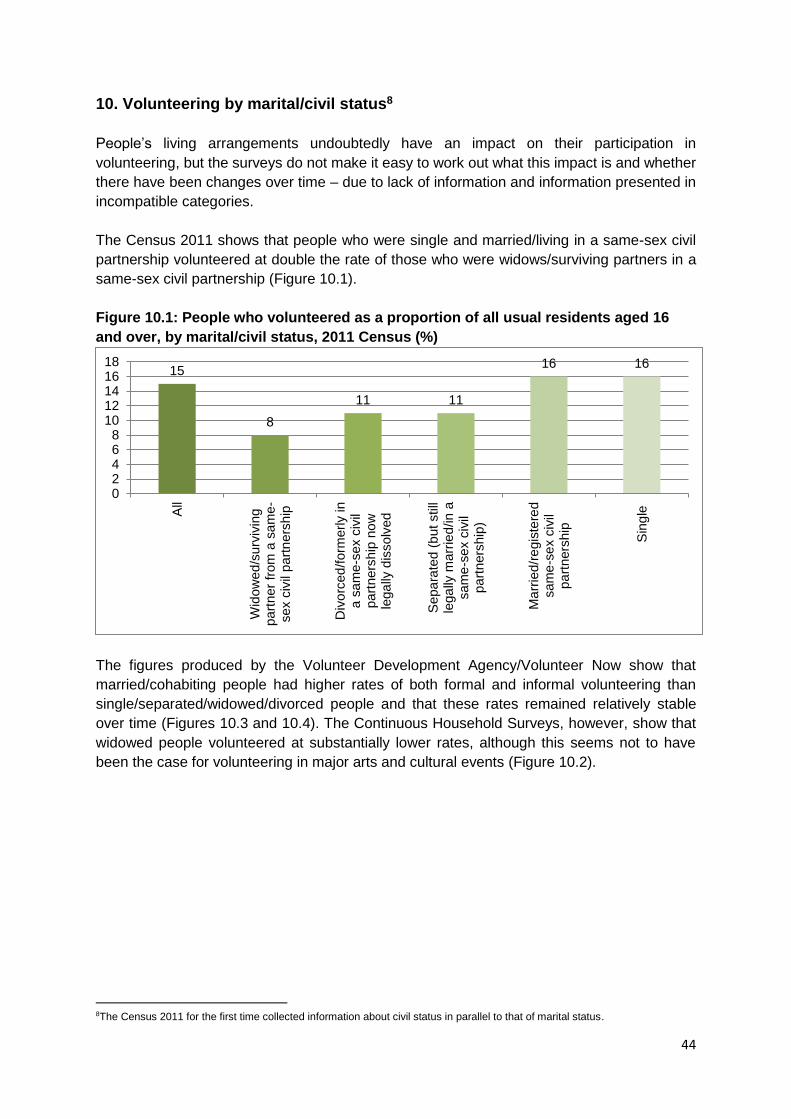
10. Volunteering by marital/civil status8
People’s living arrangements undoubtedly have an impact on their participation in
volunteering, but the surveys do not make it easy to work out what this impact is and whether
there have been changes over time – due to lack of information and information presented in
incompatible categories.
The Census 2011 shows that people who were single and married/living in a same-sex civil
partnership volunteered at double the rate of those who were widows/surviving partners in a
same-sex civil partnership (Figure 10.1).
Figure 10.1: People who volunteered as a proportion of all usual residents aged 16
and over, by marital/civil status, 2011 Census (%)
The figures produced by the Volunteer Development Agency/Volunteer Now show that
married/cohabiting people had higher rates of both formal and informal volunteering than
single/separated/widowed/divorced people and that these rates remained relatively stable
over time (Figures 10.3 and 10.4). The Continuous Household Surveys, however, show that
widowed people volunteered at substantially lower rates, although this seems not to have
been the case for volunteering in major arts and cultural events (Figure 10.2).
8The Census 2011 for the first time collected information about civil status in parallel to that of marital status.
15
8
11 11
16 16
02468
1012141618
All
Wid
ow
ed
/surv
ivin
gpa
rtner
from
a s
am
e-
sex c
ivil
pa
rtn
ers
hip
Div
orc
ed
/form
erly in
a s
am
e-s
ex c
ivil
pa
rtners
hip
no
wle
ga
lly d
issolv
ed
Sepa
rate
d (
but still
lega
lly m
arr
ied
/in
asam
e-s
ex c
ivil
pa
rtners
hip
)
Ma
rrie
d/r
egis
tere
dsam
e-s
ex c
ivil
pa
rtners
hip
Sin
gle
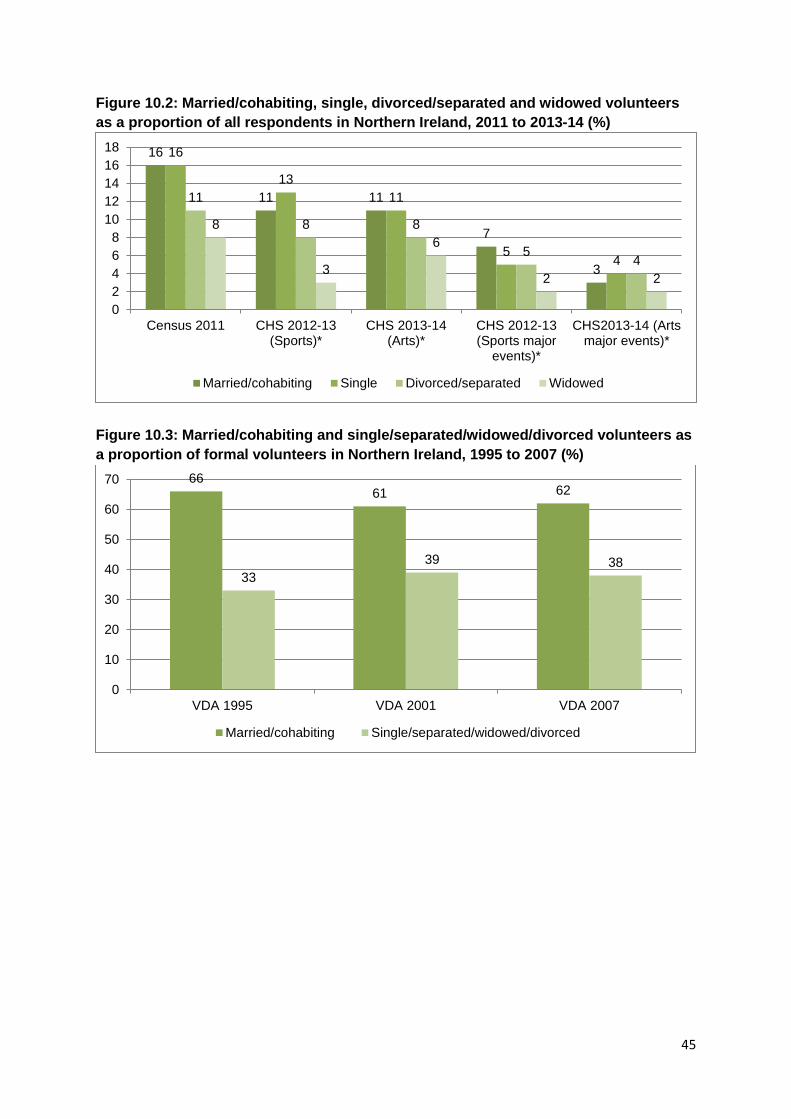
45
Figure 10.2: Married/cohabiting, single, divorced/separated and widowed volunteers
as a proportion of all respondents in Northern Ireland, 2011 to 2013-14 (%)
Figure 10.3: Married/cohabiting and single/separated/widowed/divorced volunteers as
a proportion of formal volunteers in Northern Ireland, 1995 to 2007 (%)
16
11 11
7
3
16
13
11
54
11
8 8
54
8
3
6
2 2
0
2
4
6
8
10
12
14
16
18
Census 2011 CHS 2012-13(Sports)*
CHS 2013-14(Arts)*
CHS 2012-13(Sports major
events)*
CHS2013-14 (Artsmajor events)*
Married/cohabiting Single Divorced/separated Widowed
6661 62
33
39 38
0
10
20
30
40
50
60
70
VDA 1995 VDA 2001 VDA 2007
Married/cohabiting Single/separated/widowed/divorced
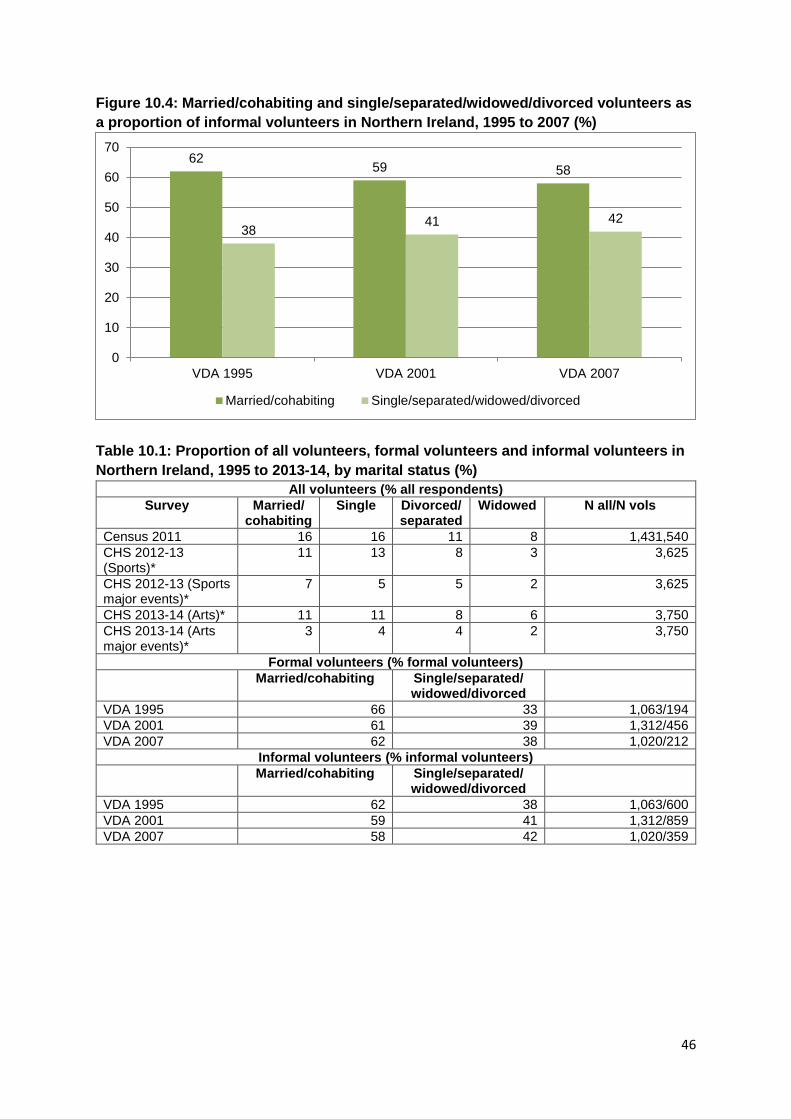
46
Figure 10.4: Married/cohabiting and single/separated/widowed/divorced volunteers as
a proportion of informal volunteers in Northern Ireland, 1995 to 2007 (%)
Table 10.1: Proportion of all volunteers, formal volunteers and informal volunteers in
Northern Ireland, 1995 to 2013-14, by marital status (%)
All volunteers (% all respondents)
Survey Married/ cohabiting
Single Divorced/ separated
Widowed N all/N vols
Census 2011 16 16 11 8 1,431,540
CHS 2012-13 (Sports)*
11 13 8 3 3,625
CHS 2012-13 (Sports major events)*
7 5 5 2 3,625
CHS 2013-14 (Arts)* 11 11 8 6 3,750
CHS 2013-14 (Arts major events)*
3 4 4 2 3,750
Formal volunteers (% formal volunteers)
Married/cohabiting Single/separated/ widowed/divorced
VDA 1995 66 33 1,063/194
VDA 2001 61 39 1,312/456
VDA 2007 62 38 1,020/212
Informal volunteers (% informal volunteers)
Married/cohabiting Single/separated/ widowed/divorced
VDA 1995 62 38 1,063/600
VDA 2001 59 41 1,312/859
VDA 2007 58 42 1,020/359
6259 58
3841 42
0
10
20
30
40
50
60
70
VDA 1995 VDA 2001 VDA 2007
Married/cohabiting Single/separated/widowed/divorced
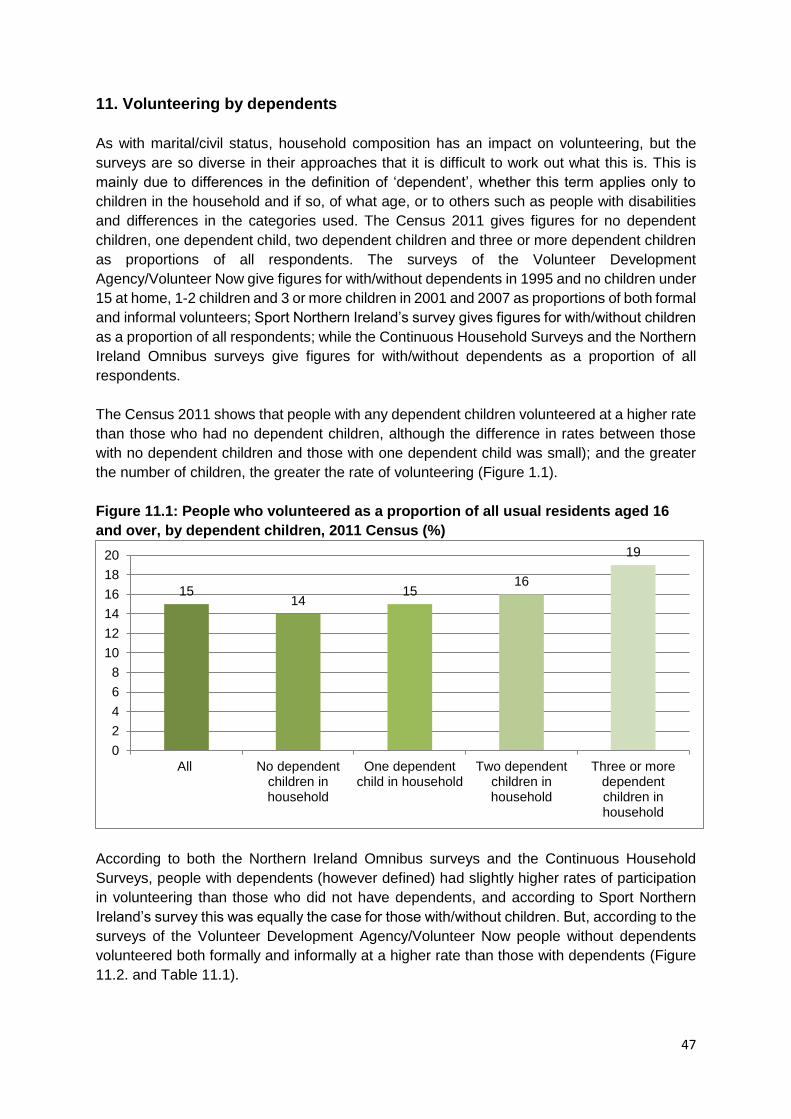
47
11. Volunteering by dependents
As with marital/civil status, household composition has an impact on volunteering, but the
surveys are so diverse in their approaches that it is difficult to work out what this is. This is
mainly due to differences in the definition of ‘dependent’, whether this term applies only to
children in the household and if so, of what age, or to others such as people with disabilities
and differences in the categories used. The Census 2011 gives figures for no dependent
children, one dependent child, two dependent children and three or more dependent children
as proportions of all respondents. The surveys of the Volunteer Development
Agency/Volunteer Now give figures for with/without dependents in 1995 and no children under
15 at home, 1-2 children and 3 or more children in 2001 and 2007 as proportions of both formal
and informal volunteers; Sport Northern Ireland’s survey gives figures for with/without children
as a proportion of all respondents; while the Continuous Household Surveys and the Northern
Ireland Omnibus surveys give figures for with/without dependents as a proportion of all
respondents.
The Census 2011 shows that people with any dependent children volunteered at a higher rate
than those who had no dependent children, although the difference in rates between those
with no dependent children and those with one dependent child was small); and the greater
the number of children, the greater the rate of volunteering (Figure 1.1).
Figure 11.1: People who volunteered as a proportion of all usual residents aged 16
and over, by dependent children, 2011 Census (%)
According to both the Northern Ireland Omnibus surveys and the Continuous Household
Surveys, people with dependents (however defined) had slightly higher rates of participation
in volunteering than those who did not have dependents, and according to Sport Northern
Ireland’s survey this was equally the case for those with/without children. But, according to the
surveys of the Volunteer Development Agency/Volunteer Now people without dependents
volunteered both formally and informally at a higher rate than those with dependents (Figure
11.2. and Table 11.1).
1514
1516
19
0
2
4
6
8
10
12
14
16
18
20
All No dependentchildren inhousehold
One dependentchild in household
Two dependentchildren inhousehold
Three or moredependentchildren inhousehold
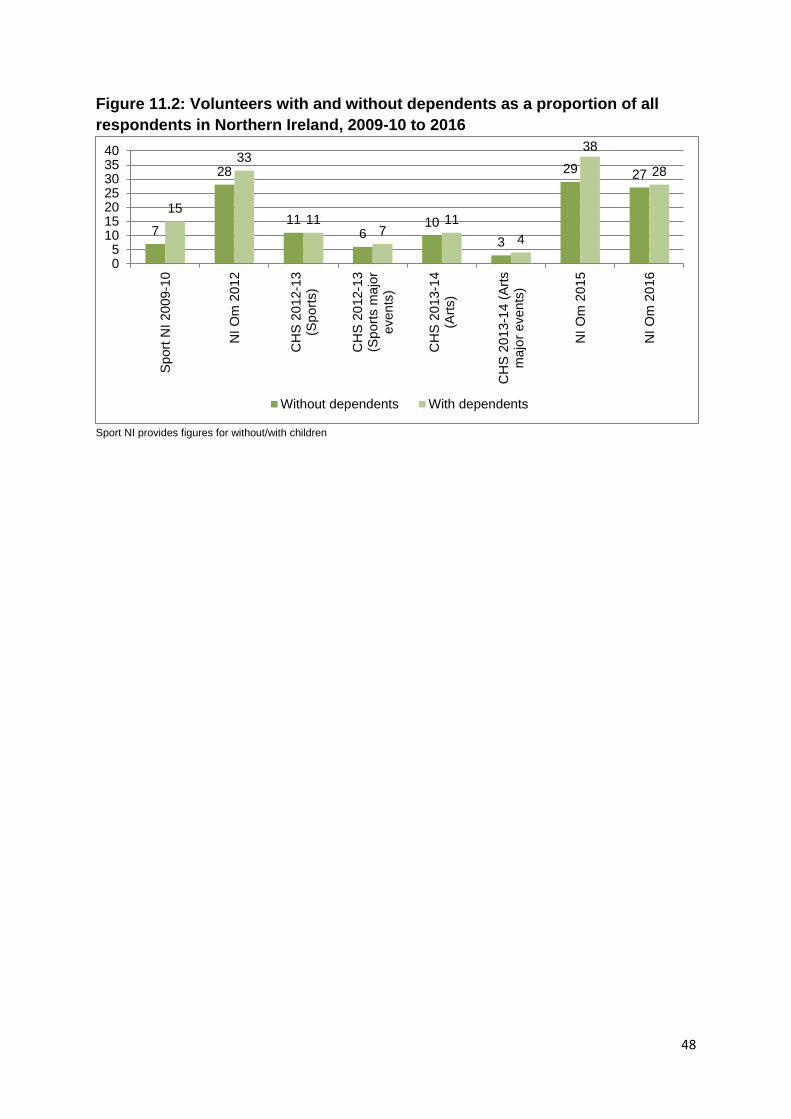
48
Figure 11.2: Volunteers with and without dependents as a proportion of all
respondents in Northern Ireland, 2009-10 to 2016
Sport NI provides figures for without/with children
7
28
116
10
3
29 27
15
33
117
11
4
38
28
05
10152025303540
Sport
NI 20
09-1
0
NI
Om
20
12
CH
S 2
012-1
3(S
port
s)
CH
S 2
012-1
3(S
port
s m
ajo
reven
ts)
CH
S 2
013-1
4(A
rts)
CH
S 2
013-1
4 (
Art
sm
ajo
r events
)
NI
Om
20
15
NI
Om
20
16
Without dependents With dependents
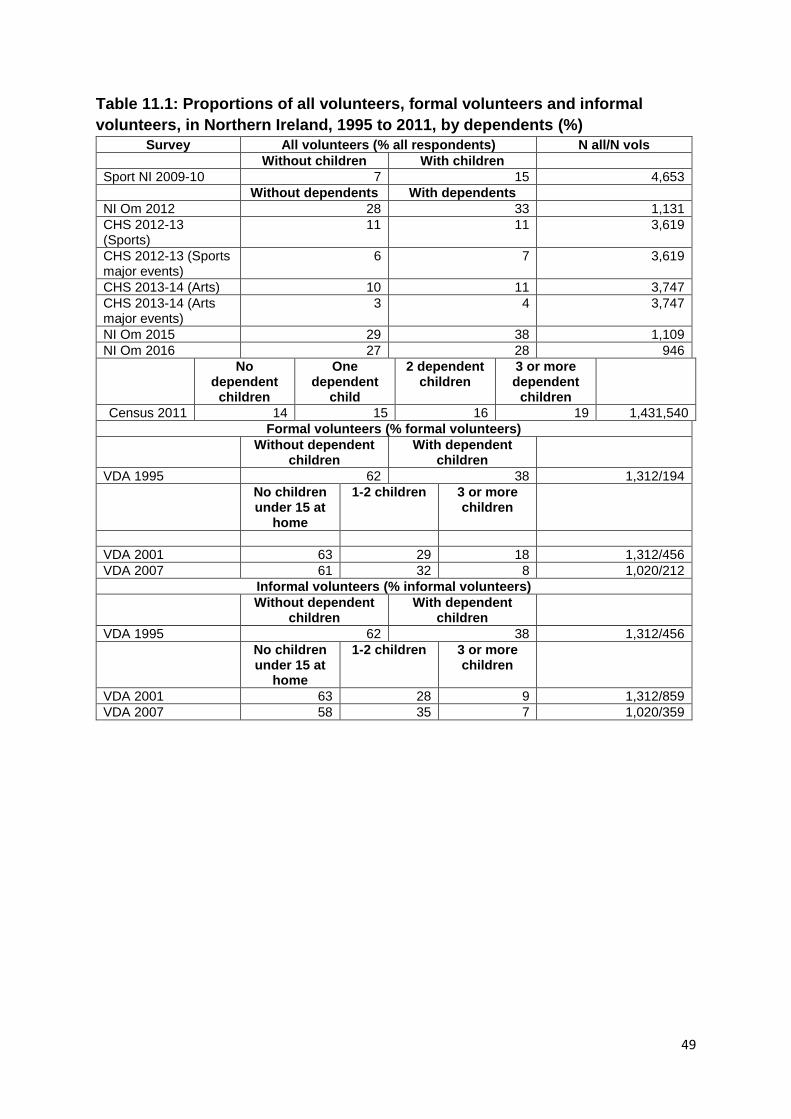
49
Table 11.1: Proportions of all volunteers, formal volunteers and informal
volunteers, in Northern Ireland, 1995 to 2011, by dependents (%)
Survey All volunteers (% all respondents) N all/N vols
Without children With children
Sport NI 2009-10 7 15 4,653
Without dependents With dependents
NI Om 2012 28 33 1,131
CHS 2012-13 (Sports)
11 11 3,619
CHS 2012-13 (Sports major events)
6 7 3,619
CHS 2013-14 (Arts) 10 11 3,747
CHS 2013-14 (Arts major events)
3 4 3,747
NI Om 2015 29 38 1,109
NI Om 2016 27 28 946
No dependent
children
One dependent
child
2 dependent children
3 or more dependent
children
Census 2011 14 15 16 19 1,431,540
Formal volunteers (% formal volunteers)
Without dependent children
With dependent children
VDA 1995 62 38 1,312/194
No children under 15 at
home
1-2 children 3 or more children
VDA 2001 63 29 18 1,312/456
VDA 2007 61 32 8 1,020/212
Informal volunteers (% informal volunteers)
Without dependent children
With dependent children
VDA 1995 62 38 1,312/456
No children under 15 at
home
1-2 children 3 or more children
VDA 2001 63 28 9 1,312/859
VDA 2007 58 35 7 1,020/359
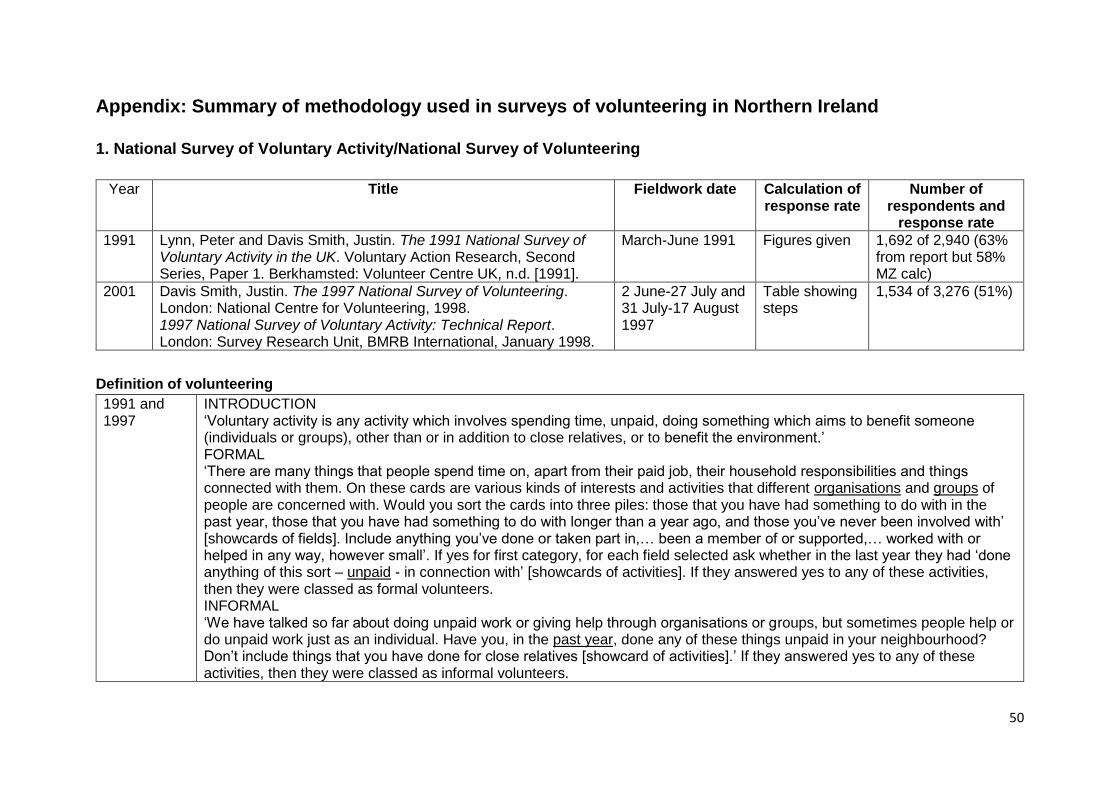
50
Appendix: Summary of methodology used in surveys of volunteering in Northern Ireland
1. National Survey of Voluntary Activity/National Survey of Volunteering
Year Title Fieldwork date Calculation of response rate
Number of respondents and
response rate
1991 Lynn, Peter and Davis Smith, Justin. The 1991 National Survey of Voluntary Activity in the UK. Voluntary Action Research, Second Series, Paper 1. Berkhamsted: Volunteer Centre UK, n.d. [1991].
March-June 1991 Figures given 1,692 of 2,940 (63% from report but 58% MZ calc)
2001 Davis Smith, Justin. The 1997 National Survey of Volunteering. London: National Centre for Volunteering, 1998. 1997 National Survey of Voluntary Activity: Technical Report. London: Survey Research Unit, BMRB International, January 1998.
2 June-27 July and 31 July-17 August 1997
Table showing steps
1,534 of 3,276 (51%)
Definition of volunteering
1991 and 1997
INTRODUCTION ‘Voluntary activity is any activity which involves spending time, unpaid, doing something which aims to benefit someone (individuals or groups), other than or in addition to close relatives, or to benefit the environment.’ FORMAL ‘There are many things that people spend time on, apart from their paid job, their household responsibilities and things connected with them. On these cards are various kinds of interests and activities that different organisations and groups of people are concerned with. Would you sort the cards into three piles: those that you have had something to do with in the past year, those that you have had something to do with longer than a year ago, and those you’ve never been involved with’ [showcards of fields]. Include anything you’ve done or taken part in,… been a member of or supported,… worked with or helped in any way, however small’. If yes for first category, for each field selected ask whether in the last year they had ‘done anything of this sort – unpaid - in connection with’ [showcards of activities]. If they answered yes to any of these activities, then they were classed as formal volunteers. INFORMAL ‘We have talked so far about doing unpaid work or giving help through organisations or groups, but sometimes people help or do unpaid work just as an individual. Have you, in the past year, done any of these things unpaid in your neighbourhood? Don’t include things that you have done for close relatives [showcard of activities].’ If they answered yes to any of these activities, then they were classed as informal volunteers.
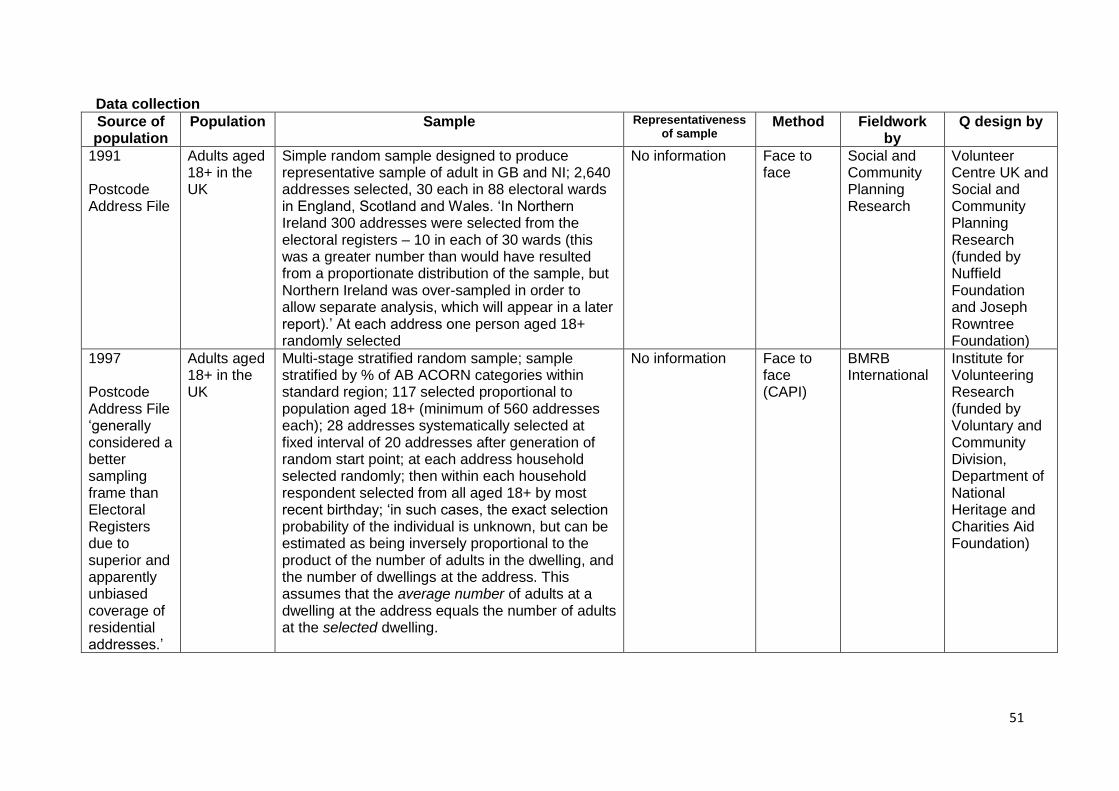
51
Data collection
Source of population
Population Sample Representativeness of sample
Method Fieldwork by
Q design by
1991 Postcode Address File
Adults aged 18+ in the UK
Simple random sample designed to produce representative sample of adult in GB and NI; 2,640 addresses selected, 30 each in 88 electoral wards in England, Scotland and Wales. ‘In Northern Ireland 300 addresses were selected from the electoral registers – 10 in each of 30 wards (this was a greater number than would have resulted from a proportionate distribution of the sample, but Northern Ireland was over-sampled in order to allow separate analysis, which will appear in a later report).’ At each address one person aged 18+ randomly selected
No information Face to face
Social and Community Planning Research
Volunteer Centre UK and Social and Community Planning Research (funded by Nuffield Foundation and Joseph Rowntree Foundation)
1997 Postcode Address File ‘generally considered a better sampling frame than Electoral Registers due to superior and apparently unbiased coverage of residential addresses.’
Adults aged 18+ in the UK
Multi-stage stratified random sample; sample stratified by % of AB ACORN categories within standard region; 117 selected proportional to population aged 18+ (minimum of 560 addresses each); 28 addresses systematically selected at fixed interval of 20 addresses after generation of random start point; at each address household selected randomly; then within each household respondent selected from all aged 18+ by most recent birthday; ‘in such cases, the exact selection probability of the individual is unknown, but can be estimated as being inversely proportional to the product of the number of adults in the dwelling, and the number of dwellings at the address. This assumes that the average number of adults at a dwelling at the address equals the number of adults at the selected dwelling.
No information Face to face (CAPI)
BMRB International
Institute for Volunteering Research (funded by Voluntary and Community Division, Department of National Heritage and Charities Aid Foundation)
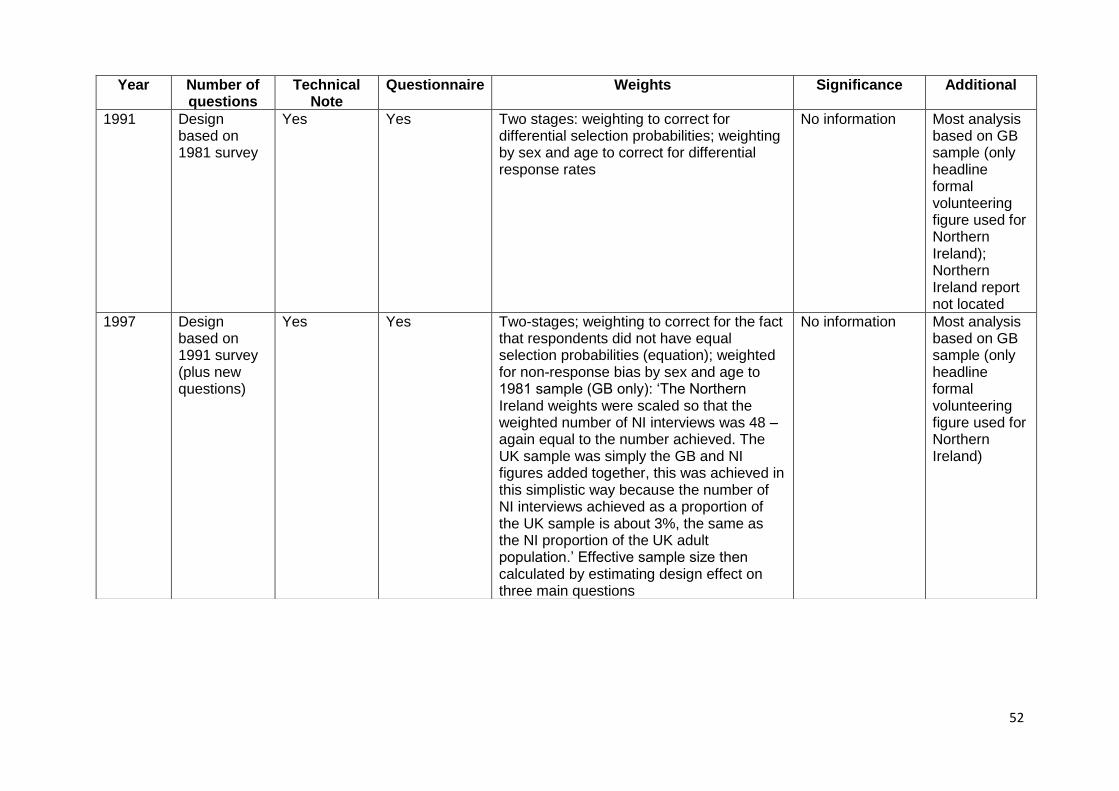
52
Year Number of questions
Technical Note
Questionnaire Weights Significance Additional
1991 Design based on 1981 survey
Yes Yes Two stages: weighting to correct for differential selection probabilities; weighting by sex and age to correct for differential response rates
No information Most analysis based on GB sample (only headline formal volunteering figure used for Northern Ireland); Northern Ireland report not located
1997 Design based on 1991 survey (plus new questions)
Yes Yes Two-stages; weighting to correct for the fact that respondents did not have equal selection probabilities (equation); weighted for non-response bias by sex and age to 1981 sample (GB only): ‘The Northern Ireland weights were scaled so that the weighted number of NI interviews was 48 – again equal to the number achieved. The UK sample was simply the GB and NI figures added together, this was achieved in this simplistic way because the number of NI interviews achieved as a proportion of the UK sample is about 3%, the same as the NI proportion of the UK adult population.’ Effective sample size then calculated by estimating design effect on three main questions
No information Most analysis based on GB sample (only headline formal volunteering figure used for Northern Ireland)
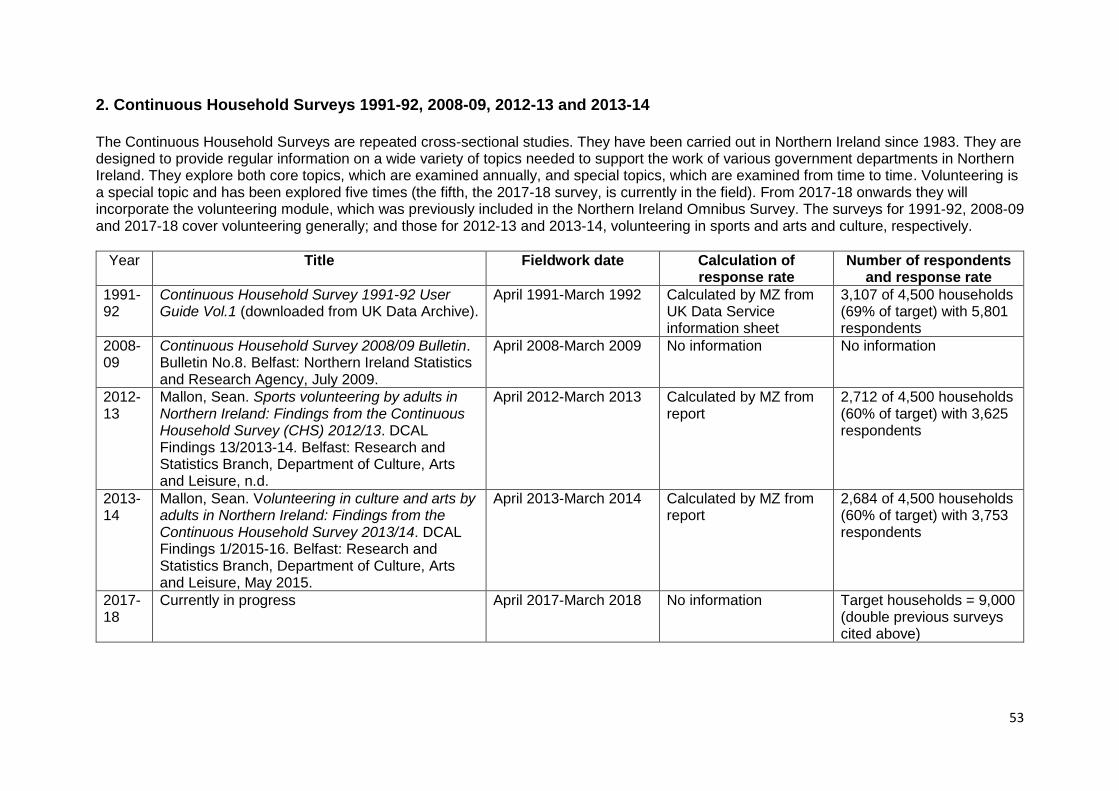
53
2. Continuous Household Surveys 1991-92, 2008-09, 2012-13 and 2013-14 The Continuous Household Surveys are repeated cross-sectional studies. They have been carried out in Northern Ireland since 1983. They are designed to provide regular information on a wide variety of topics needed to support the work of various government departments in Northern Ireland. They explore both core topics, which are examined annually, and special topics, which are examined from time to time. Volunteering is a special topic and has been explored five times (the fifth, the 2017-18 survey, is currently in the field). From 2017-18 onwards they will incorporate the volunteering module, which was previously included in the Northern Ireland Omnibus Survey. The surveys for 1991-92, 2008-09 and 2017-18 cover volunteering generally; and those for 2012-13 and 2013-14, volunteering in sports and arts and culture, respectively.
Year Title Fieldwork date Calculation of response rate
Number of respondents and response rate
1991-92
Continuous Household Survey 1991-92 User Guide Vol.1 (downloaded from UK Data Archive).
April 1991-March 1992 Calculated by MZ from UK Data Service information sheet
3,107 of 4,500 households (69% of target) with 5,801 respondents
2008-09
Continuous Household Survey 2008/09 Bulletin. Bulletin No.8. Belfast: Northern Ireland Statistics and Research Agency, July 2009.
April 2008-March 2009 No information No information
2012-13
Mallon, Sean. Sports volunteering by adults in Northern Ireland: Findings from the Continuous Household Survey (CHS) 2012/13. DCAL Findings 13/2013-14. Belfast: Research and Statistics Branch, Department of Culture, Arts and Leisure, n.d.
April 2012-March 2013 Calculated by MZ from report
2,712 of 4,500 households (60% of target) with 3,625 respondents
2013-14
Mallon, Sean. Volunteering in culture and arts by adults in Northern Ireland: Findings from the Continuous Household Survey 2013/14. DCAL Findings 1/2015-16. Belfast: Research and Statistics Branch, Department of Culture, Arts and Leisure, May 2015.
April 2013-March 2014 Calculated by MZ from report
2,684 of 4,500 households (60% of target) with 3,753 respondents
2017-18
Currently in progress April 2017-March 2018 No information Target households = 9,000 (double previous surveys cited above)
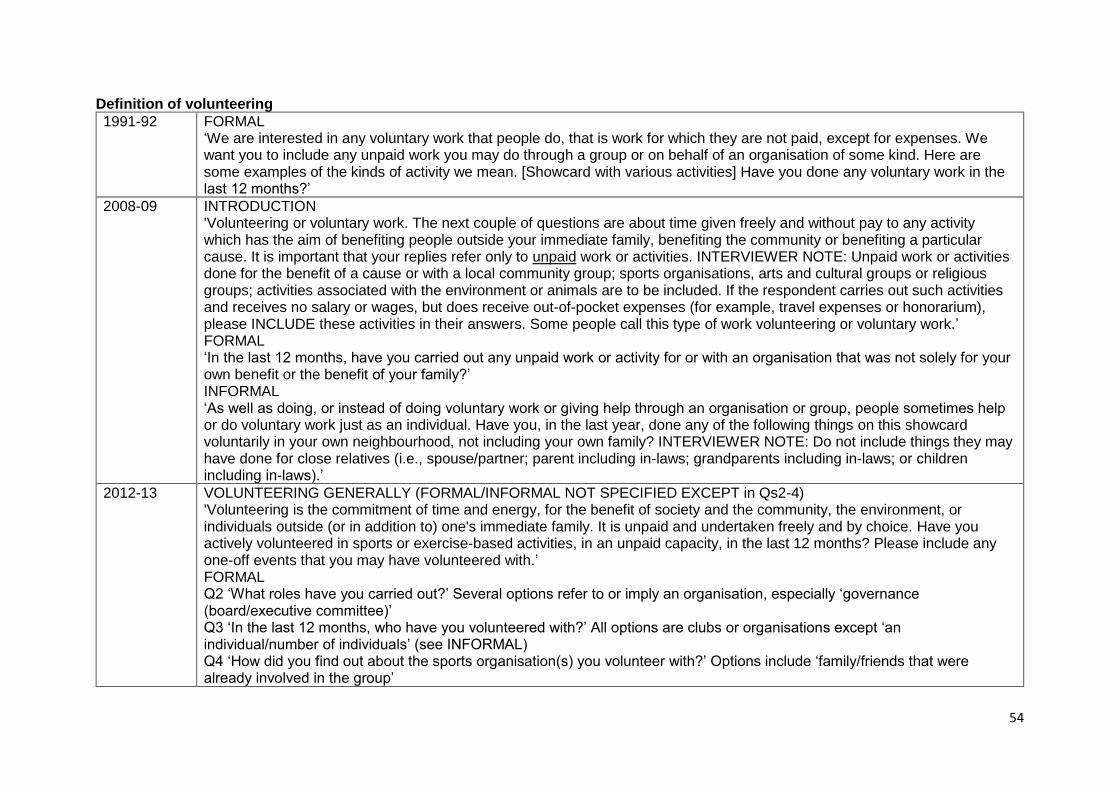
54
Definition of volunteering
1991-92 FORMAL ‘We are interested in any voluntary work that people do, that is work for which they are not paid, except for expenses. We want you to include any unpaid work you may do through a group or on behalf of an organisation of some kind. Here are some examples of the kinds of activity we mean. [Showcard with various activities] Have you done any voluntary work in the last 12 months?’
2008-09 INTRODUCTION 'Volunteering or voluntary work. The next couple of questions are about time given freely and without pay to any activity which has the aim of benefiting people outside your immediate family, benefiting the community or benefiting a particular cause. It is important that your replies refer only to unpaid work or activities. INTERVIEWER NOTE: Unpaid work or activities done for the benefit of a cause or with a local community group; sports organisations, arts and cultural groups or religious groups; activities associated with the environment or animals are to be included. If the respondent carries out such activities and receives no salary or wages, but does receive out-of-pocket expenses (for example, travel expenses or honorarium), please INCLUDE these activities in their answers. Some people call this type of work volunteering or voluntary work.’ FORMAL ‘In the last 12 months, have you carried out any unpaid work or activity for or with an organisation that was not solely for your own benefit or the benefit of your family?’ INFORMAL ‘As well as doing, or instead of doing voluntary work or giving help through an organisation or group, people sometimes help or do voluntary work just as an individual. Have you, in the last year, done any of the following things on this showcard voluntarily in your own neighbourhood, not including your own family? INTERVIEWER NOTE: Do not include things they may have done for close relatives (i.e., spouse/partner; parent including in-laws; grandparents including in-laws; or children including in-laws).’
2012-13 VOLUNTEERING GENERALLY (FORMAL/INFORMAL NOT SPECIFIED EXCEPT in Qs2-4) 'Volunteering is the commitment of time and energy, for the benefit of society and the community, the environment, or individuals outside (or in addition to) one's immediate family. It is unpaid and undertaken freely and by choice. Have you actively volunteered in sports or exercise-based activities, in an unpaid capacity, in the last 12 months? Please include any one-off events that you may have volunteered with.’ FORMAL Q2 ‘What roles have you carried out?’ Several options refer to or imply an organisation, especially ‘governance (board/executive committee)’ Q3 ‘In the last 12 months, who have you volunteered with?’ All options are clubs or organisations except ‘an individual/number of individuals’ (see INFORMAL) Q4 ‘How did you find out about the sports organisation(s) you volunteer with?’ Options include ‘family/friends that were already involved in the group’
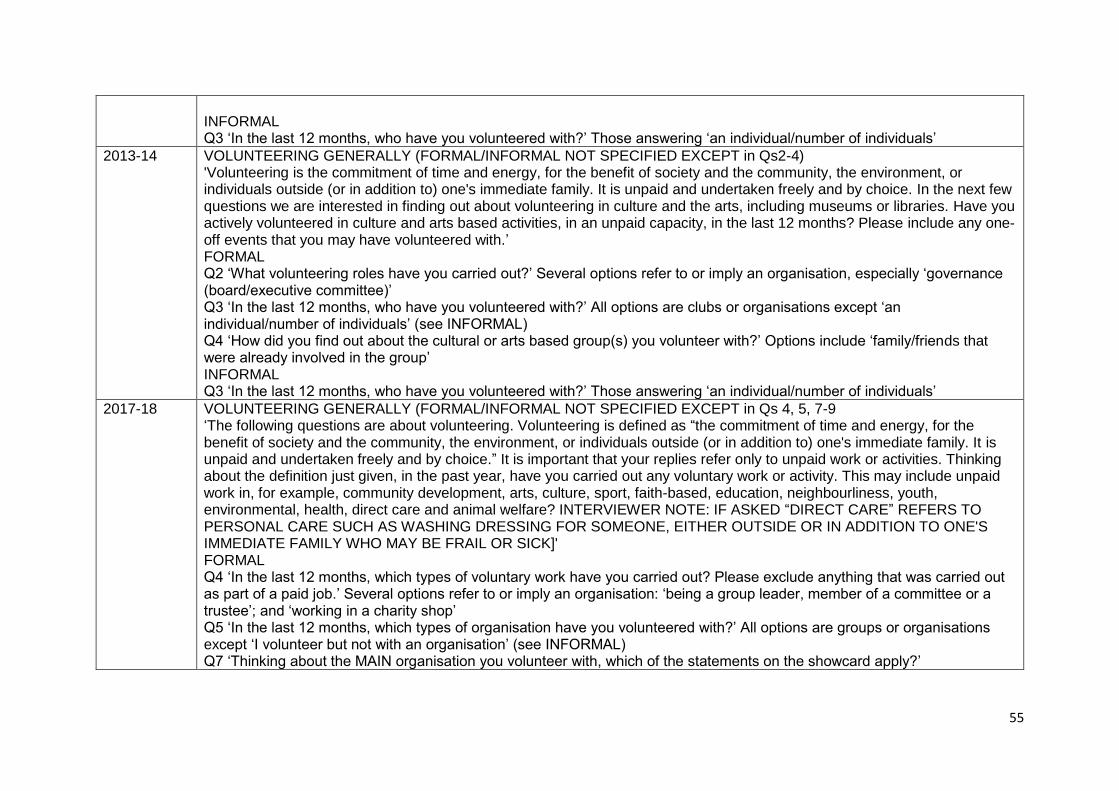
55
INFORMAL Q3 ‘In the last 12 months, who have you volunteered with?’ Those answering ‘an individual/number of individuals’
2013-14 VOLUNTEERING GENERALLY (FORMAL/INFORMAL NOT SPECIFIED EXCEPT in Qs2-4) 'Volunteering is the commitment of time and energy, for the benefit of society and the community, the environment, or individuals outside (or in addition to) one's immediate family. It is unpaid and undertaken freely and by choice. In the next few questions we are interested in finding out about volunteering in culture and the arts, including museums or libraries. Have you actively volunteered in culture and arts based activities, in an unpaid capacity, in the last 12 months? Please include any one-off events that you may have volunteered with.’ FORMAL Q2 ‘What volunteering roles have you carried out?’ Several options refer to or imply an organisation, especially ‘governance (board/executive committee)’ Q3 ‘In the last 12 months, who have you volunteered with?’ All options are clubs or organisations except ‘an individual/number of individuals’ (see INFORMAL) Q4 ‘How did you find out about the cultural or arts based group(s) you volunteer with?’ Options include ‘family/friends that were already involved in the group’ INFORMAL Q3 ‘In the last 12 months, who have you volunteered with?’ Those answering ‘an individual/number of individuals’
2017-18 VOLUNTEERING GENERALLY (FORMAL/INFORMAL NOT SPECIFIED EXCEPT in Qs 4, 5, 7-9 ‘The following questions are about volunteering. Volunteering is defined as “the commitment of time and energy, for the benefit of society and the community, the environment, or individuals outside (or in addition to) one's immediate family. It is unpaid and undertaken freely and by choice.” It is important that your replies refer only to unpaid work or activities. Thinking about the definition just given, in the past year, have you carried out any voluntary work or activity. This may include unpaid work in, for example, community development, arts, culture, sport, faith-based, education, neighbourliness, youth, environmental, health, direct care and animal welfare? INTERVIEWER NOTE: IF ASKED “DIRECT CARE” REFERS TO PERSONAL CARE SUCH AS WASHING DRESSING FOR SOMEONE, EITHER OUTSIDE OR IN ADDITION TO ONE'S IMMEDIATE FAMILY WHO MAY BE FRAIL OR SICK]' FORMAL Q4 ‘In the last 12 months, which types of voluntary work have you carried out? Please exclude anything that was carried out as part of a paid job.’ Several options refer to or imply an organisation: ‘being a group leader, member of a committee or a trustee’; and ‘working in a charity shop’ Q5 ‘In the last 12 months, which types of organisation have you volunteered with?’ All options are groups or organisations except ‘I volunteer but not with an organisation’ (see INFORMAL) Q7 ‘Thinking about the MAIN organisation you volunteer with, which of the statements on the showcard apply?’
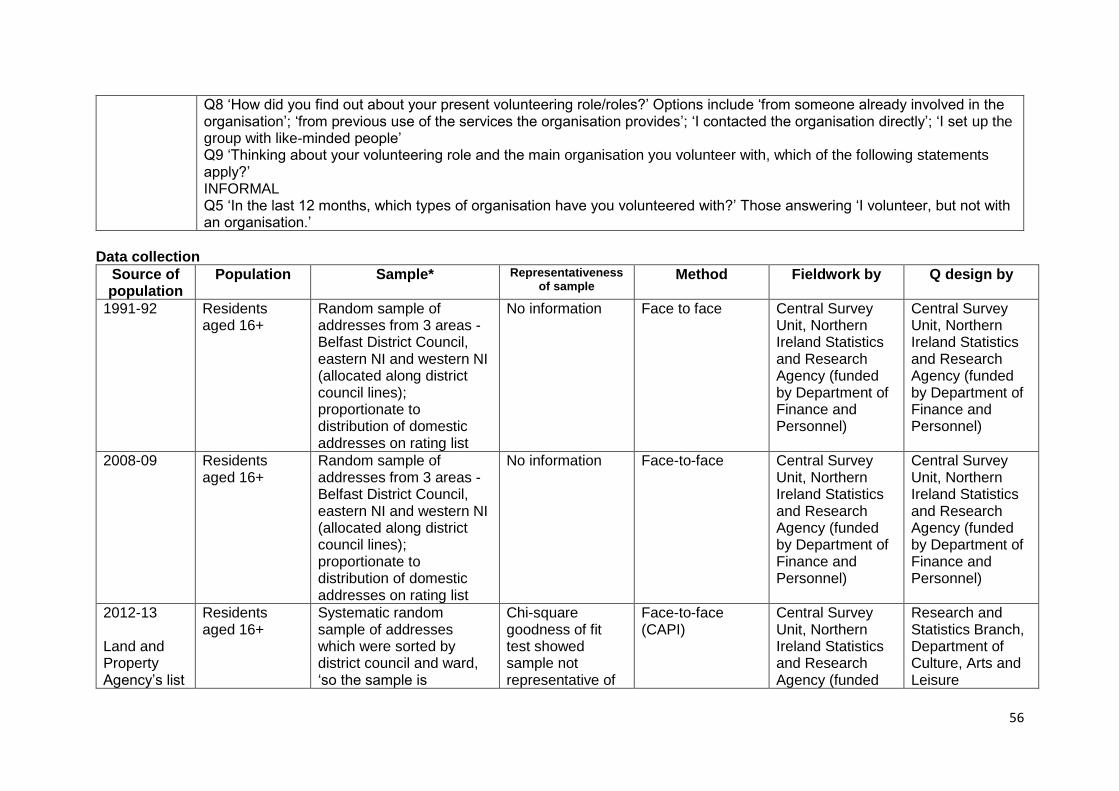
56
Q8 ‘How did you find out about your present volunteering role/roles?’ Options include ‘from someone already involved in the organisation’; ‘from previous use of the services the organisation provides’; ‘I contacted the organisation directly’; ‘I set up the group with like-minded people’ Q9 ‘Thinking about your volunteering role and the main organisation you volunteer with, which of the following statements apply?’ INFORMAL Q5 ‘In the last 12 months, which types of organisation have you volunteered with?’ Those answering ‘I volunteer, but not with an organisation.’
Data collection
Source of population
Population Sample* Representativeness of sample
Method Fieldwork by Q design by
1991-92
Residents aged 16+
Random sample of addresses from 3 areas - Belfast District Council, eastern NI and western NI (allocated along district council lines); proportionate to distribution of domestic addresses on rating list
No information Face to face Central Survey Unit, Northern Ireland Statistics and Research Agency (funded by Department of Finance and Personnel)
Central Survey Unit, Northern Ireland Statistics and Research Agency (funded by Department of Finance and Personnel)
2008-09
Residents aged 16+
Random sample of addresses from 3 areas - Belfast District Council, eastern NI and western NI (allocated along district council lines); proportionate to distribution of domestic addresses on rating list
No information Face-to-face Central Survey Unit, Northern Ireland Statistics and Research Agency (funded by Department of Finance and Personnel)
Central Survey Unit, Northern Ireland Statistics and Research Agency (funded by Department of Finance and Personnel)
2012-13 Land and Property Agency’s list
Residents aged 16+
Systematic random sample of addresses which were sorted by district council and ward, ‘so the sample is
Chi-square goodness of fit test showed sample not representative of
Face-to-face (CAPI)
Central Survey Unit, Northern Ireland Statistics and Research Agency (funded
Research and Statistics Branch, Department of Culture, Arts and Leisure
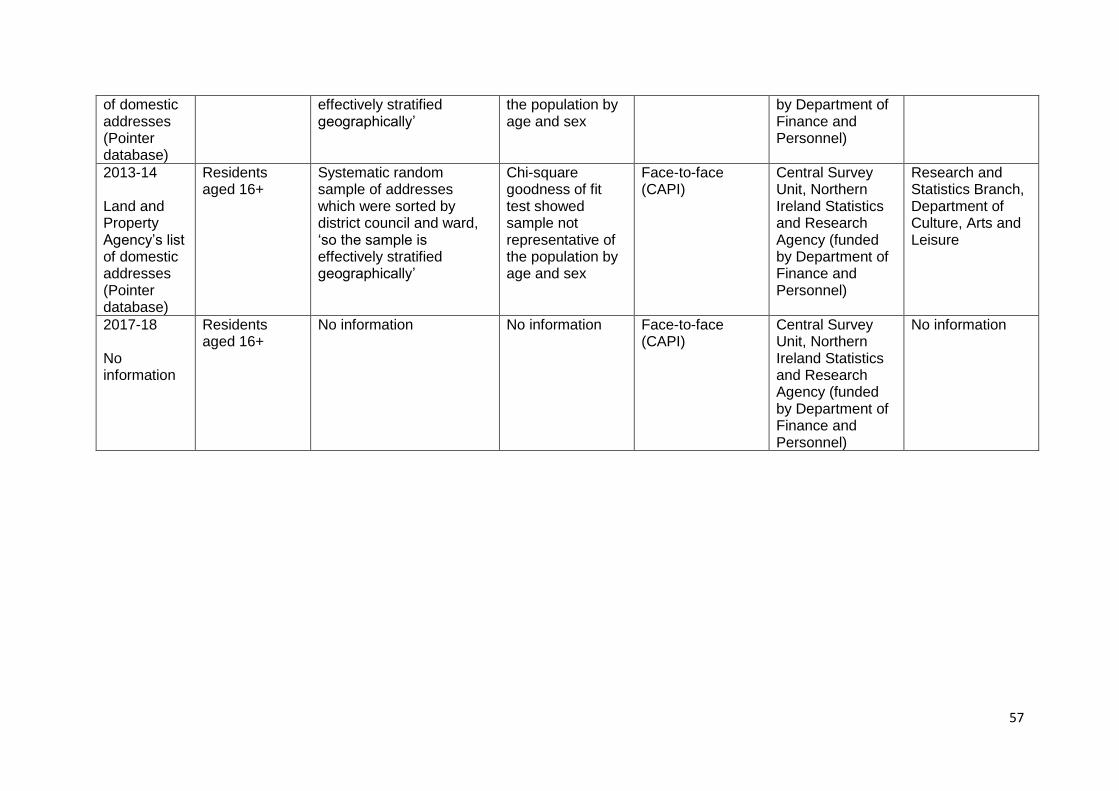
57
of domestic addresses (Pointer database)
effectively stratified geographically’
the population by age and sex
by Department of Finance and Personnel)
2013-14 Land and Property Agency’s list of domestic addresses (Pointer database)
Residents aged 16+
Systematic random sample of addresses which were sorted by district council and ward, ‘so the sample is effectively stratified geographically’
Chi-square goodness of fit test showed sample not representative of the population by age and sex
Face-to-face (CAPI)
Central Survey Unit, Northern Ireland Statistics and Research Agency (funded by Department of Finance and Personnel)
Research and Statistics Branch, Department of Culture, Arts and Leisure
2017-18 No information
Residents aged 16+
No information No information Face-to-face (CAPI)
Central Survey Unit, Northern Ireland Statistics and Research Agency (funded by Department of Finance and Personnel)
No information

58
Year Number of questions
Technical Note
Questionnaire Weights Significance Additional
1991-92 5 No Yes No weighting No testing; raw counts
No report; no tables; results in back section of questionnaire in User Guide (!)
2008-09 No information
No Yes No weighting No information Sketchy report in bulletin; no tables
2012-13 10 Yes Yes Weighted for non-response and by age, sex and sex/age; weightings as above applied to data from previous years from 2007-08
95% for comparisons set out in text
Uses updated definition of disability as per Equality Act 2010: ‘Do you have any physical or mental health conditions or illnesses lasting or expected to last for 12 months or more? Does your condition or illness/do any of your conditions or illnesses reduce your ability to carry out day-today activities?’
2013-14 10 Yes Yes Weighted for non-response and by age, sex and sex/age
95% for comparisons set out in text
2017-18 9 No Yes No information No information
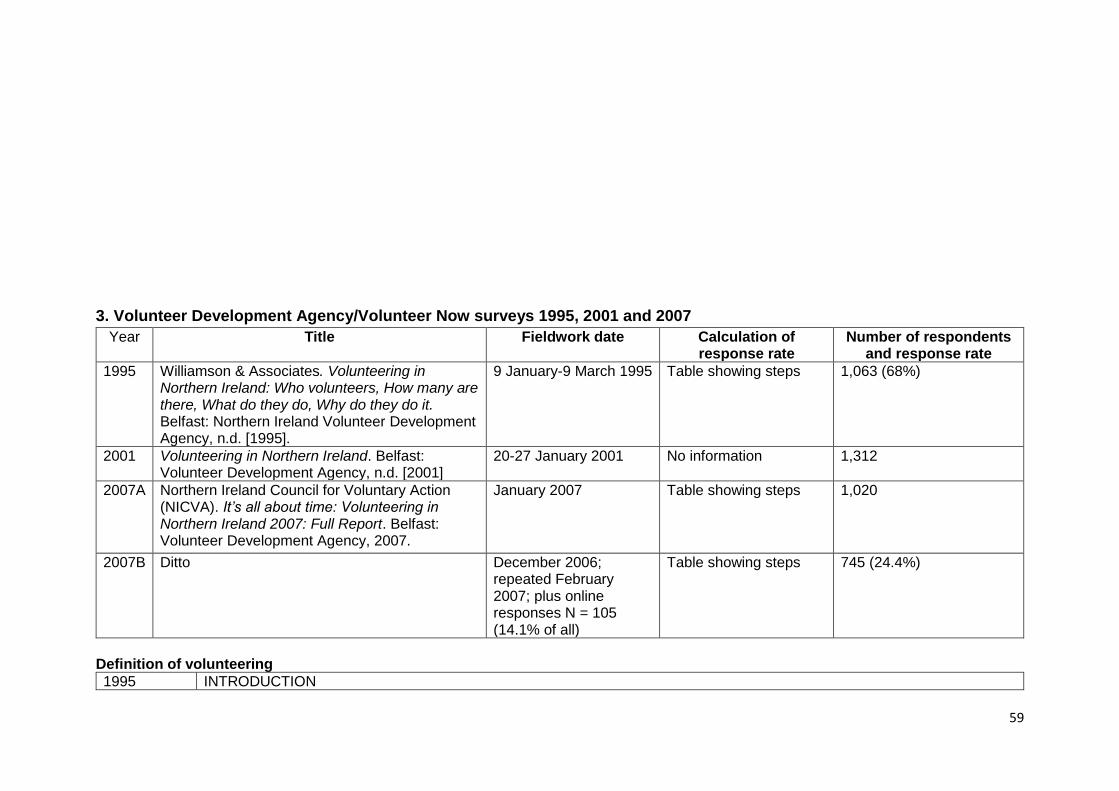
59
3. Volunteer Development Agency/Volunteer Now surveys 1995, 2001 and 2007
Year Title Fieldwork date Calculation of response rate
Number of respondents and response rate
1995 Williamson & Associates. Volunteering in Northern Ireland: Who volunteers, How many are there, What do they do, Why do they do it. Belfast: Northern Ireland Volunteer Development Agency, n.d. [1995].
9 January-9 March 1995 Table showing steps 1,063 (68%)
2001 Volunteering in Northern Ireland. Belfast: Volunteer Development Agency, n.d. [2001]
20-27 January 2001 No information 1,312
2007A Northern Ireland Council for Voluntary Action (NICVA). It’s all about time: Volunteering in Northern Ireland 2007: Full Report. Belfast: Volunteer Development Agency, 2007.
January 2007 Table showing steps 1,020
2007B Ditto December 2006; repeated February 2007; plus online responses N = 105 (14.1% of all)
Table showing steps 745 (24.4%)
Definition of volunteering
1995 INTRODUCTION
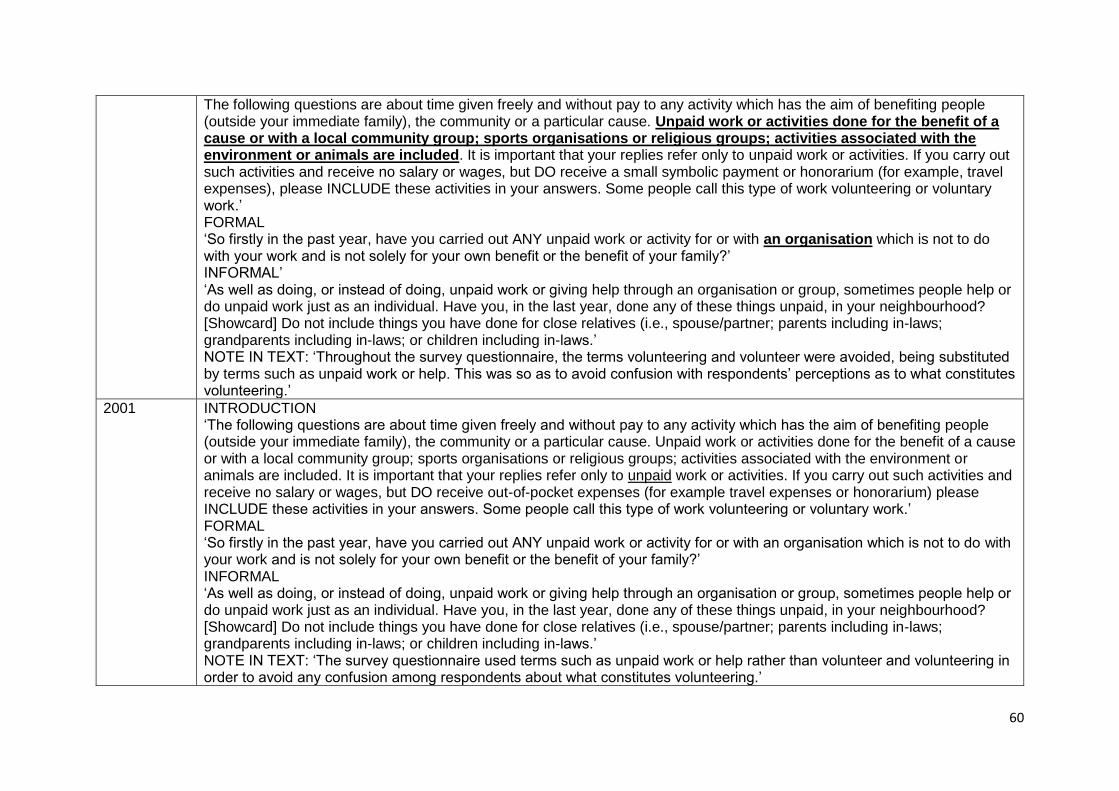
60
The following questions are about time given freely and without pay to any activity which has the aim of benefiting people (outside your immediate family), the community or a particular cause. Unpaid work or activities done for the benefit of a cause or with a local community group; sports organisations or religious groups; activities associated with the environment or animals are included. It is important that your replies refer only to unpaid work or activities. If you carry out such activities and receive no salary or wages, but DO receive a small symbolic payment or honorarium (for example, travel expenses), please INCLUDE these activities in your answers. Some people call this type of work volunteering or voluntary work.’ FORMAL ‘So firstly in the past year, have you carried out ANY unpaid work or activity for or with an organisation which is not to do with your work and is not solely for your own benefit or the benefit of your family?’ INFORMAL’ ‘As well as doing, or instead of doing, unpaid work or giving help through an organisation or group, sometimes people help or do unpaid work just as an individual. Have you, in the last year, done any of these things unpaid, in your neighbourhood? [Showcard] Do not include things you have done for close relatives (i.e., spouse/partner; parents including in-laws; grandparents including in-laws; or children including in-laws.’ NOTE IN TEXT: ‘Throughout the survey questionnaire, the terms volunteering and volunteer were avoided, being substituted by terms such as unpaid work or help. This was so as to avoid confusion with respondents’ perceptions as to what constitutes volunteering.’
2001 INTRODUCTION ‘The following questions are about time given freely and without pay to any activity which has the aim of benefiting people (outside your immediate family), the community or a particular cause. Unpaid work or activities done for the benefit of a cause or with a local community group; sports organisations or religious groups; activities associated with the environment or animals are included. It is important that your replies refer only to unpaid work or activities. If you carry out such activities and receive no salary or wages, but DO receive out-of-pocket expenses (for example travel expenses or honorarium) please INCLUDE these activities in your answers. Some people call this type of work volunteering or voluntary work.’ FORMAL ‘So firstly in the past year, have you carried out ANY unpaid work or activity for or with an organisation which is not to do with your work and is not solely for your own benefit or the benefit of your family?’ INFORMAL ‘As well as doing, or instead of doing, unpaid work or giving help through an organisation or group, sometimes people help or do unpaid work just as an individual. Have you, in the last year, done any of these things unpaid, in your neighbourhood? [Showcard] Do not include things you have done for close relatives (i.e., spouse/partner; parents including in-laws; grandparents including in-laws; or children including in-laws.’ NOTE IN TEXT: ‘The survey questionnaire used terms such as unpaid work or help rather than volunteer and volunteering in order to avoid any confusion among respondents about what constitutes volunteering.’
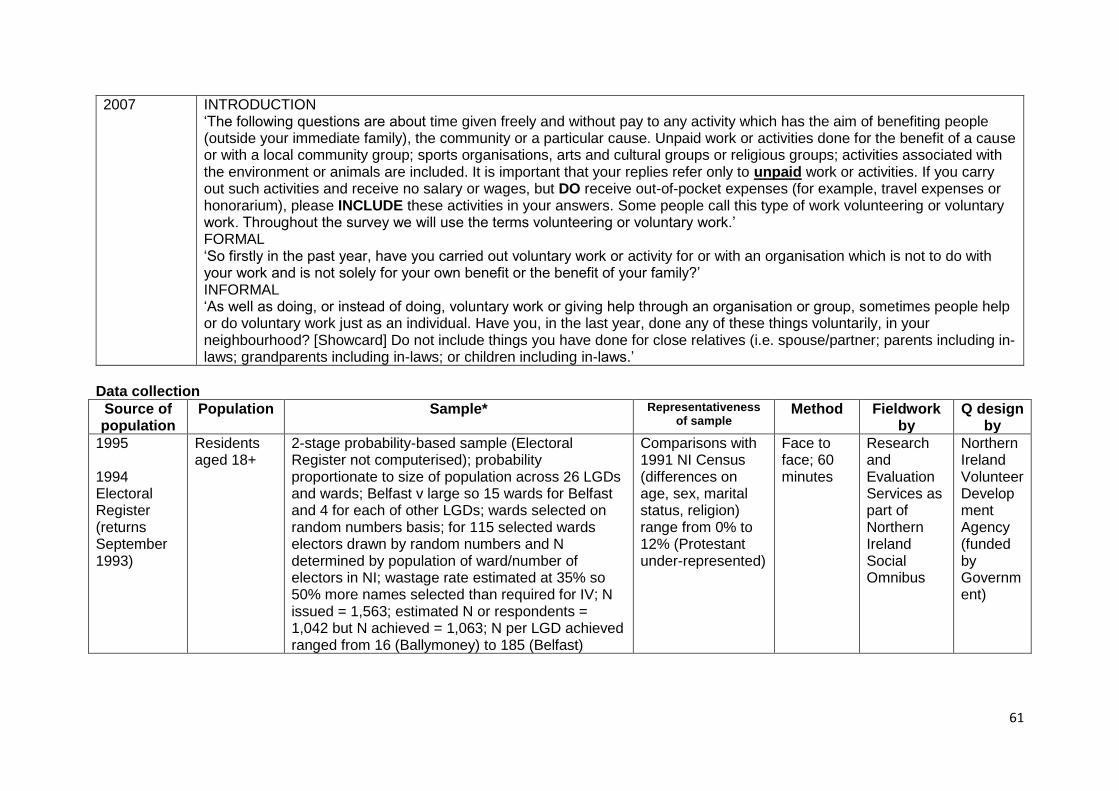
61
2007 INTRODUCTION ‘The following questions are about time given freely and without pay to any activity which has the aim of benefiting people (outside your immediate family), the community or a particular cause. Unpaid work or activities done for the benefit of a cause or with a local community group; sports organisations, arts and cultural groups or religious groups; activities associated with the environment or animals are included. It is important that your replies refer only to unpaid work or activities. If you carry out such activities and receive no salary or wages, but DO receive out-of-pocket expenses (for example, travel expenses or honorarium), please INCLUDE these activities in your answers. Some people call this type of work volunteering or voluntary work. Throughout the survey we will use the terms volunteering or voluntary work.’ FORMAL ‘So firstly in the past year, have you carried out voluntary work or activity for or with an organisation which is not to do with your work and is not solely for your own benefit or the benefit of your family?’ INFORMAL ‘As well as doing, or instead of doing, voluntary work or giving help through an organisation or group, sometimes people help or do voluntary work just as an individual. Have you, in the last year, done any of these things voluntarily, in your neighbourhood? [Showcard] Do not include things you have done for close relatives (i.e. spouse/partner; parents including in-laws; grandparents including in-laws; or children including in-laws.’
Data collection
Source of population
Population Sample* Representativeness of sample
Method Fieldwork by
Q design by
1995 1994 Electoral Register (returns September 1993)
Residents aged 18+
2-stage probability-based sample (Electoral Register not computerised); probability proportionate to size of population across 26 LGDs and wards; Belfast v large so 15 wards for Belfast and 4 for each of other LGDs; wards selected on random numbers basis; for 115 selected wards electors drawn by random numbers and N determined by population of ward/number of electors in NI; wastage rate estimated at 35% so 50% more names selected than required for IV; N issued = 1,563; estimated N or respondents = 1,042 but N achieved = 1,063; N per LGD achieved ranged from 16 (Ballymoney) to 185 (Belfast)
Comparisons with 1991 NI Census (differences on age, sex, marital status, religion) range from 0% to 12% (Protestant under-represented)
Face to face; 60 minutes
Research and Evaluation Services as part of Northern Ireland Social Omnibus
Northern Ireland Volunteer Development Agency (funded by Government)

62
2001 No information
Residents aged 16+
2-stage stratification – regional segmentation into 13 areas (grouping of LGDs); and urban/rural classification based on electoral density; wards then clustered into points of equal electoral density (wards contiguous, exclusively urban/rural, broadly homogeneous in population structure); points randomly selected with probability proportional to population within each of 13 areas; then quota sample for sex, age and socio-economic class; 4 basic regions: Belfast City, North (mainly Antrim and northern part of Greater Belfast), South (mainly Down, Armagh and southern part of Greater Belfast) and West (mainly Londonderry, Tyrone and Fermanagh)
Comparisons with 1991 NI Census (differences on age, sex, marital status and religion range from 0% to 5%)
Face-to-face
Social Research Division, Ulster Marketing Services as part of Northern Ireland Omnibus
Volunteer Development Agency (funded by Voluntary Activity Unit, Department for Social Development)
2007A Residents aged 16+
Quota based on gender, age, socio-economic group and working status (religion monitored)
Comparisons with 2001 NI Census (differences on age, sex, marital status, religion) range +/- 6%)
Face-to-face (CAPI)
Northern Ireland Council for Voluntary Action (NICVA) and Millward Brown Ulster (fieldwork) as part of Millward Brown Ulster Omnibus
Volunteer Development Agency (funded by Voluntary and Community Unit, Department for Social Development)
2007B Organisations likely to involve volunteers
Sample compiled from databases of VDA, NICVA, Northern Ireland Sports Forum and governing bodies of major denominations; N issued = 3,045, included 2,553 voluntary and community organisations, 24 statutory organisations, 376
No information Postal survey
NICVA Based on Volunteering in Organisations report 2001
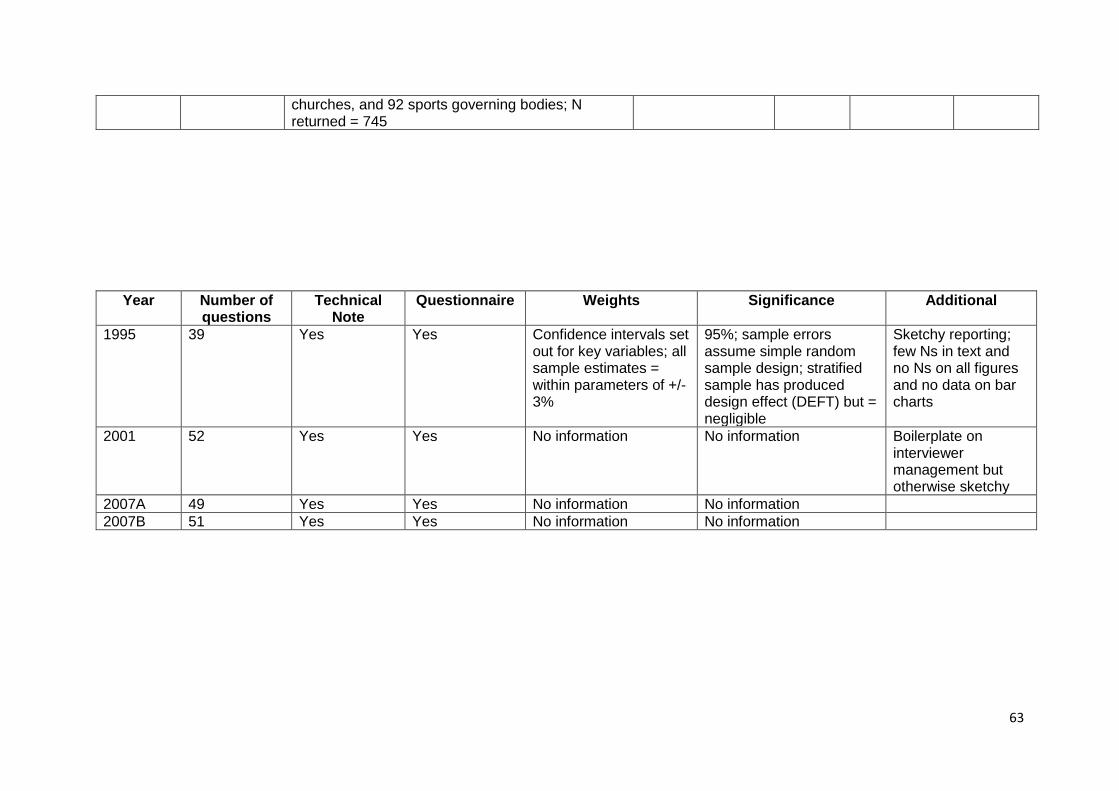
63
Year Number of questions
Technical Note
Questionnaire Weights Significance Additional
1995 39 Yes Yes Confidence intervals set out for key variables; all sample estimates = within parameters of +/-3%
95%; sample errors assume simple random sample design; stratified sample has produced design effect (DEFT) but = negligible
Sketchy reporting; few Ns in text and no Ns on all figures and no data on bar charts
2001 52 Yes Yes No information No information Boilerplate on interviewer management but otherwise sketchy
2007A 49 Yes Yes No information No information
2007B 51 Yes Yes No information No information
churches, and 92 sports governing bodies; N returned = 745
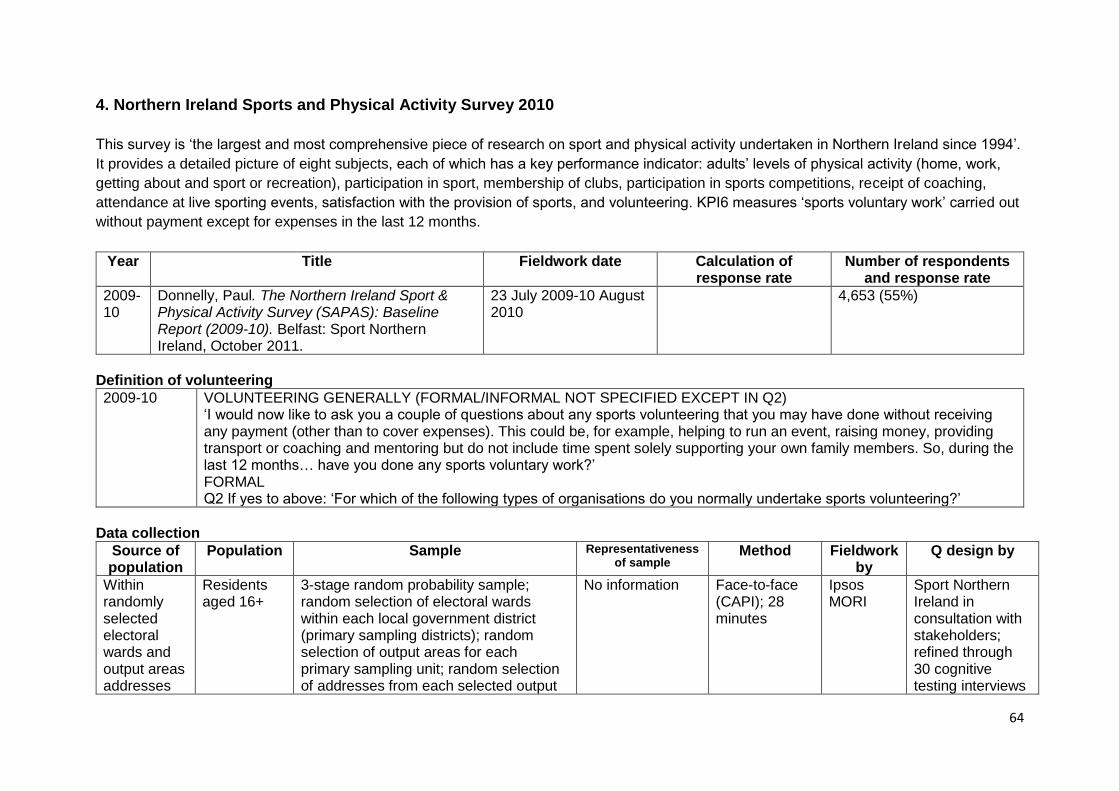
64
4. Northern Ireland Sports and Physical Activity Survey 2010
This survey is ‘the largest and most comprehensive piece of research on sport and physical activity undertaken in Northern Ireland since 1994’.
It provides a detailed picture of eight subjects, each of which has a key performance indicator: adults’ levels of physical activity (home, work,
getting about and sport or recreation), participation in sport, membership of clubs, participation in sports competitions, receipt of coaching,
attendance at live sporting events, satisfaction with the provision of sports, and volunteering. KPI6 measures ‘sports voluntary work’ carried out
without payment except for expenses in the last 12 months.
Year Title Fieldwork date Calculation of response rate
Number of respondents and response rate
2009-10
Donnelly, Paul. The Northern Ireland Sport & Physical Activity Survey (SAPAS): Baseline Report (2009-10). Belfast: Sport Northern Ireland, October 2011.
23 July 2009-10 August 2010
4,653 (55%)
Definition of volunteering
2009-10 VOLUNTEERING GENERALLY (FORMAL/INFORMAL NOT SPECIFIED EXCEPT IN Q2) ‘I would now like to ask you a couple of questions about any sports volunteering that you may have done without receiving any payment (other than to cover expenses). This could be, for example, helping to run an event, raising money, providing transport or coaching and mentoring but do not include time spent solely supporting your own family members. So, during the last 12 months… have you done any sports voluntary work?’ FORMAL Q2 If yes to above: ‘For which of the following types of organisations do you normally undertake sports volunteering?’
Data collection
Source of population
Population Sample Representativeness of sample
Method Fieldwork by
Q design by
Within randomly selected electoral wards and output areas addresses
Residents aged 16+
3-stage random probability sample; random selection of electoral wards within each local government district (primary sampling districts); random selection of output areas for each primary sampling unit; random selection of addresses from each selected output
No information Face-to-face (CAPI); 28 minutes
Ipsos MORI
Sport Northern Ireland in consultation with stakeholders; refined through 30 cognitive testing interviews
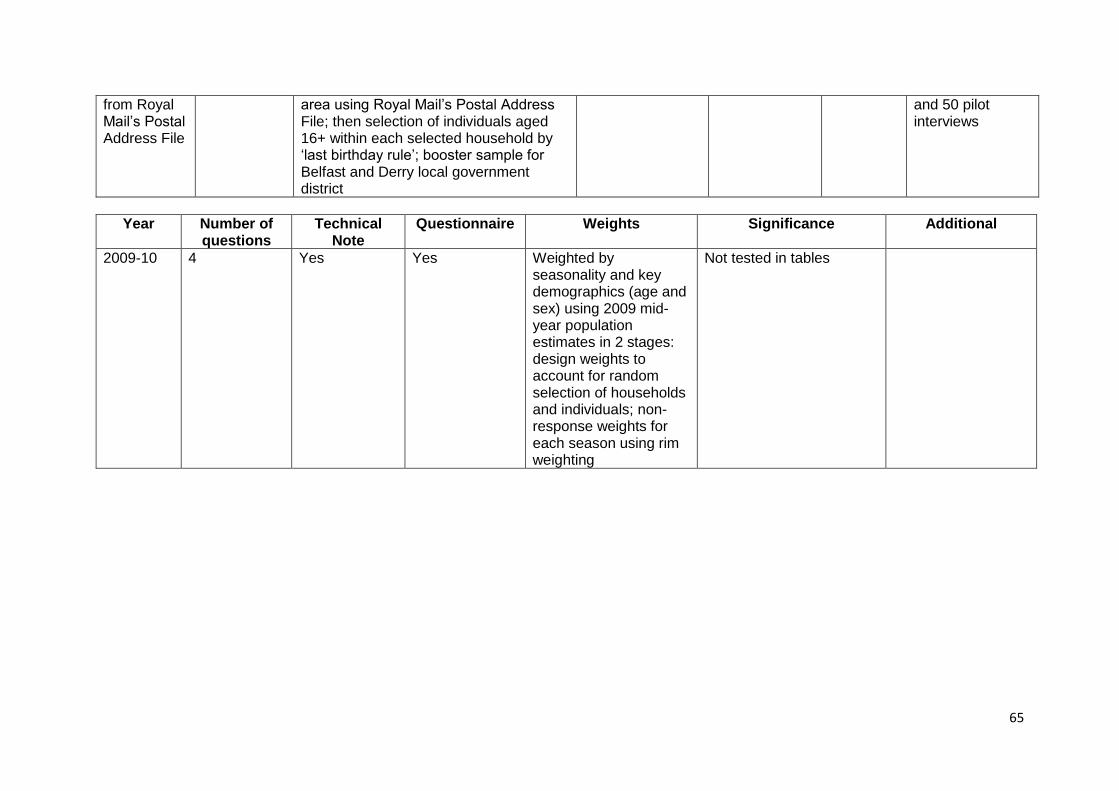
65
from Royal Mail’s Postal Address File
area using Royal Mail’s Postal Address File; then selection of individuals aged 16+ within each selected household by ‘last birthday rule’; booster sample for Belfast and Derry local government district
and 50 pilot interviews
Year Number of questions
Technical Note
Questionnaire Weights Significance Additional
2009-10 4 Yes Yes Weighted by seasonality and key demographics (age and sex) using 2009 mid-year population estimates in 2 stages: design weights to account for random selection of households and individuals; non-response weights for each season using rim weighting
Not tested in tables
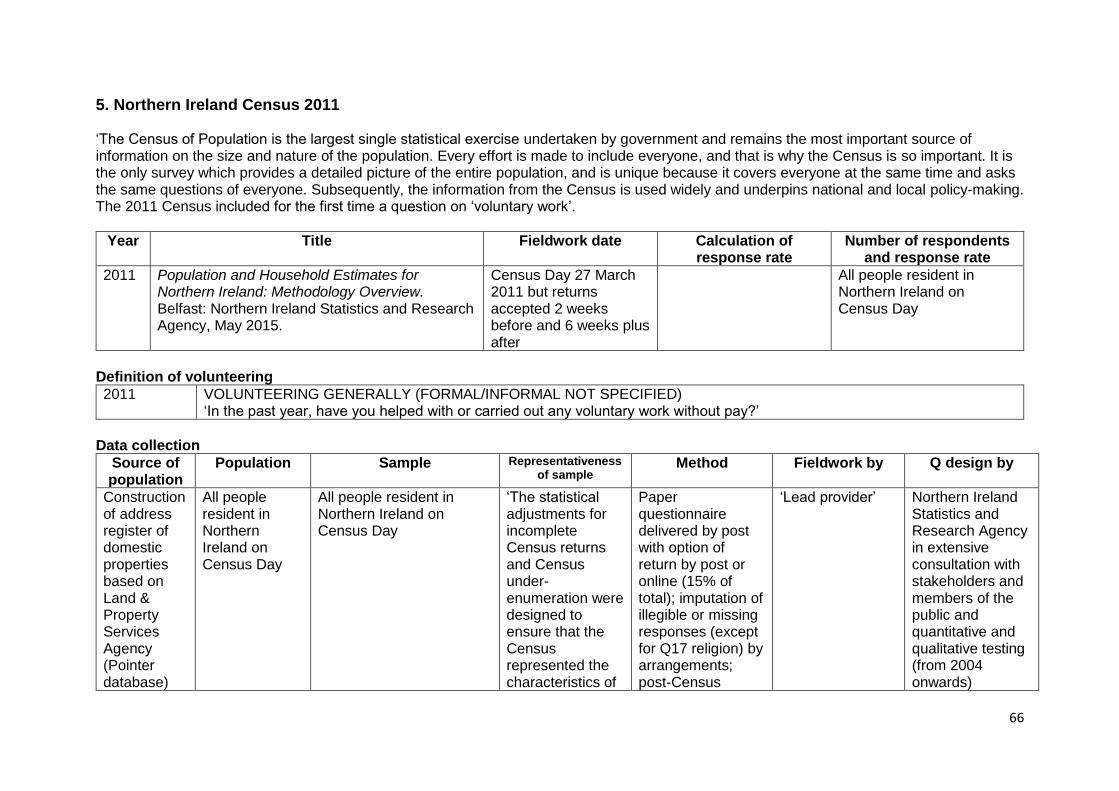
66
5. Northern Ireland Census 2011 ‘The Census of Population is the largest single statistical exercise undertaken by government and remains the most important source of information on the size and nature of the population. Every effort is made to include everyone, and that is why the Census is so important. It is the only survey which provides a detailed picture of the entire population, and is unique because it covers everyone at the same time and asks the same questions of everyone. Subsequently, the information from the Census is used widely and underpins national and local policy-making. The 2011 Census included for the first time a question on ‘voluntary work’.
Year Title Fieldwork date Calculation of response rate
Number of respondents and response rate
2011 Population and Household Estimates for Northern Ireland: Methodology Overview. Belfast: Northern Ireland Statistics and Research Agency, May 2015.
Census Day 27 March 2011 but returns accepted 2 weeks before and 6 weeks plus after
All people resident in Northern Ireland on Census Day
Definition of volunteering
2011 VOLUNTEERING GENERALLY (FORMAL/INFORMAL NOT SPECIFIED) ‘In the past year, have you helped with or carried out any voluntary work without pay?’
Data collection
Source of population
Population Sample Representativeness of sample
Method Fieldwork by Q design by
Construction of address register of domestic properties based on Land & Property Services Agency (Pointer database)
All people resident in Northern Ireland on Census Day
All people resident in Northern Ireland on Census Day
‘The statistical adjustments for incomplete Census returns and Census under-enumeration were designed to ensure that the Census represented the characteristics of
Paper questionnaire delivered by post with option of return by post or online (15% of total); imputation of illegible or missing responses (except for Q17 religion) by arrangements; post-Census
‘Lead provider’ Northern Ireland Statistics and Research Agency in extensive consultation with stakeholders and members of the public and quantitative and qualitative testing (from 2004 onwards)
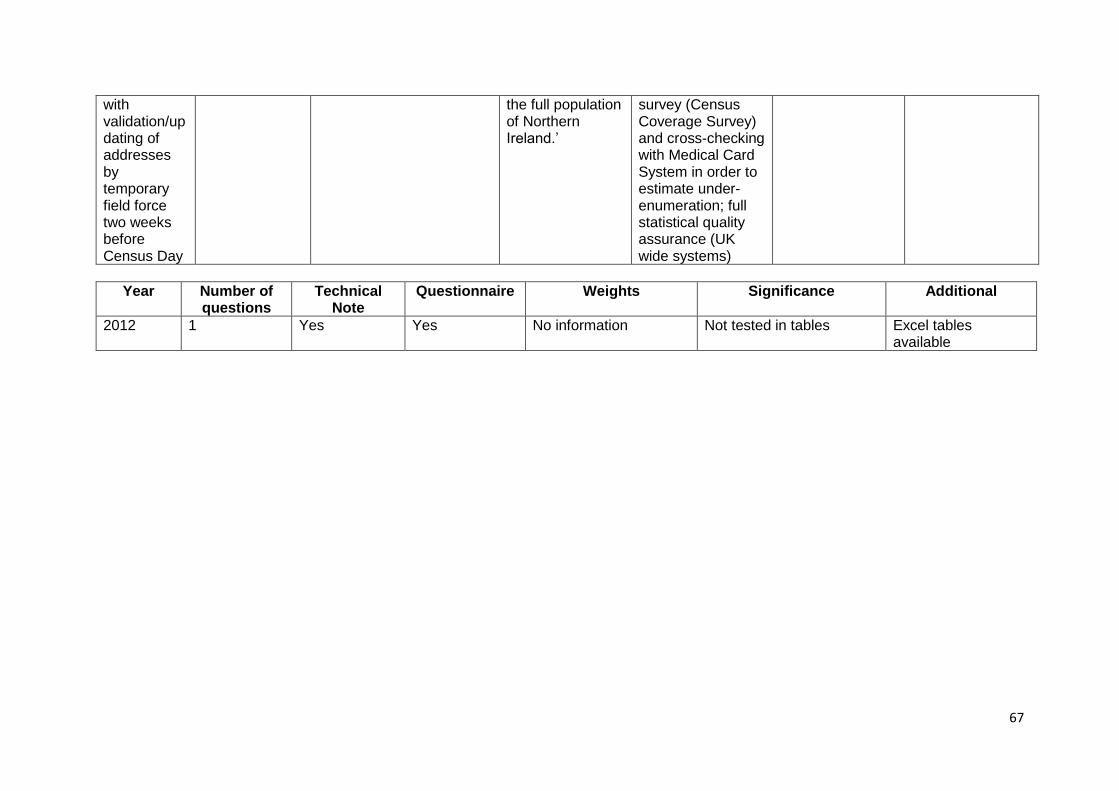
67
with validation/updating of addresses by temporary field force two weeks before Census Day
the full population of Northern Ireland.’
survey (Census Coverage Survey) and cross-checking with Medical Card System in order to estimate under-enumeration; full statistical quality assurance (UK wide systems)
Year Number of questions
Technical Note
Questionnaire Weights Significance Additional
2012 1 Yes Yes No information Not tested in tables Excel tables available
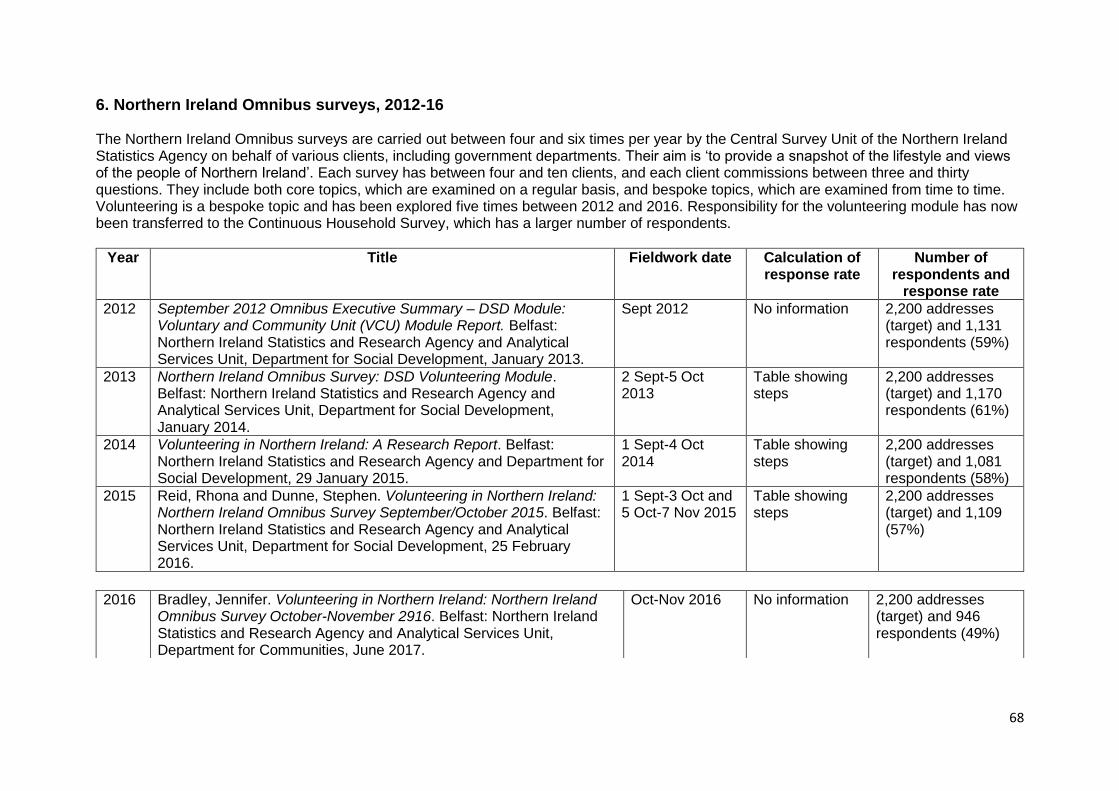
68
6. Northern Ireland Omnibus surveys, 2012-16 The Northern Ireland Omnibus surveys are carried out between four and six times per year by the Central Survey Unit of the Northern Ireland Statistics Agency on behalf of various clients, including government departments. Their aim is ‘to provide a snapshot of the lifestyle and views of the people of Northern Ireland’. Each survey has between four and ten clients, and each client commissions between three and thirty questions. They include both core topics, which are examined on a regular basis, and bespoke topics, which are examined from time to time. Volunteering is a bespoke topic and has been explored five times between 2012 and 2016. Responsibility for the volunteering module has now been transferred to the Continuous Household Survey, which has a larger number of respondents.
Year Title Fieldwork date Calculation of response rate
Number of respondents and
response rate
2012 September 2012 Omnibus Executive Summary – DSD Module: Voluntary and Community Unit (VCU) Module Report. Belfast: Northern Ireland Statistics and Research Agency and Analytical Services Unit, Department for Social Development, January 2013.
Sept 2012 No information 2,200 addresses (target) and 1,131 respondents (59%)
2013 Northern Ireland Omnibus Survey: DSD Volunteering Module. Belfast: Northern Ireland Statistics and Research Agency and Analytical Services Unit, Department for Social Development, January 2014.
2 Sept-5 Oct 2013
Table showing steps
2,200 addresses (target) and 1,170 respondents (61%)
2014 Volunteering in Northern Ireland: A Research Report. Belfast: Northern Ireland Statistics and Research Agency and Department for Social Development, 29 January 2015.
1 Sept-4 Oct 2014
Table showing steps
2,200 addresses (target) and 1,081 respondents (58%)
2015 Reid, Rhona and Dunne, Stephen. Volunteering in Northern Ireland: Northern Ireland Omnibus Survey September/October 2015. Belfast: Northern Ireland Statistics and Research Agency and Analytical Services Unit, Department for Social Development, 25 February 2016.
1 Sept-3 Oct and 5 Oct-7 Nov 2015
Table showing steps
2,200 addresses (target) and 1,109 (57%)
2016 Bradley, Jennifer. Volunteering in Northern Ireland: Northern Ireland Omnibus Survey October-November 2916. Belfast: Northern Ireland Statistics and Research Agency and Analytical Services Unit, Department for Communities, June 2017.
Oct-Nov 2016 No information 2,200 addresses (target) and 946 respondents (49%)
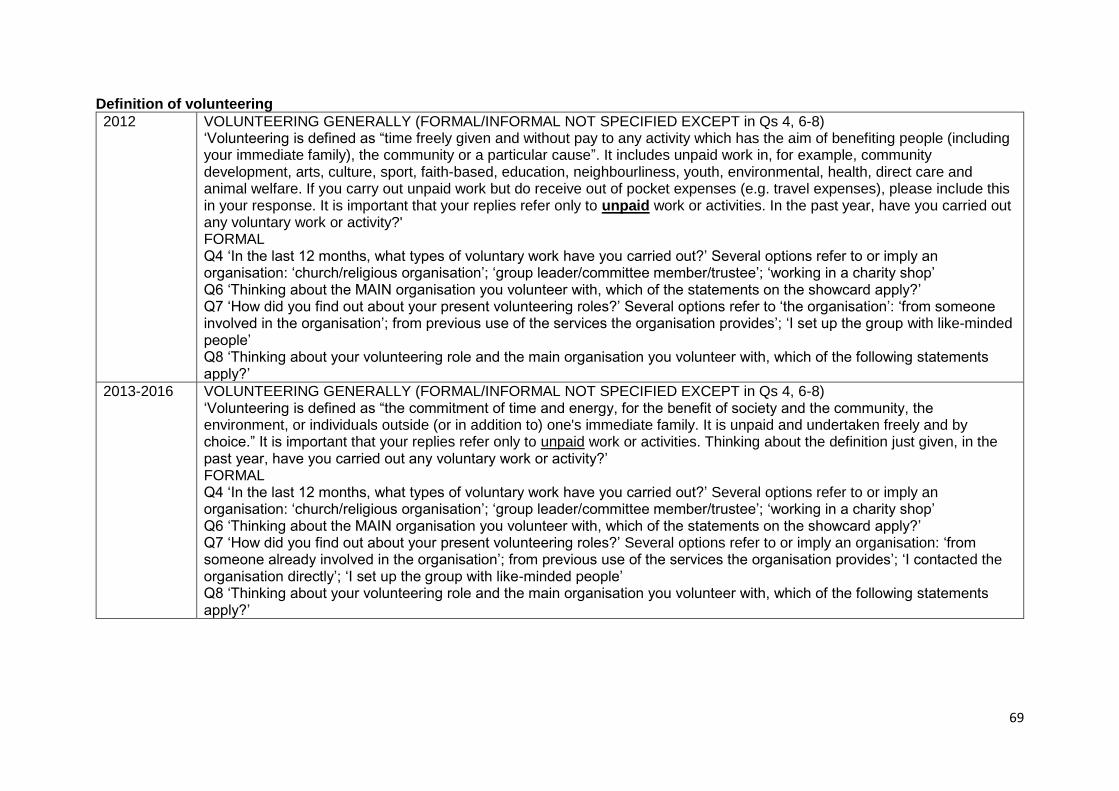
69
Definition of volunteering
2012 VOLUNTEERING GENERALLY (FORMAL/INFORMAL NOT SPECIFIED EXCEPT in Qs 4, 6-8) ‘Volunteering is defined as “time freely given and without pay to any activity which has the aim of benefiting people (including your immediate family), the community or a particular cause”. It includes unpaid work in, for example, community development, arts, culture, sport, faith-based, education, neighbourliness, youth, environmental, health, direct care and animal welfare. If you carry out unpaid work but do receive out of pocket expenses (e.g. travel expenses), please include this in your response. It is important that your replies refer only to unpaid work or activities. In the past year, have you carried out any voluntary work or activity?' FORMAL Q4 ‘In the last 12 months, what types of voluntary work have you carried out?’ Several options refer to or imply an organisation: ‘church/religious organisation’; ‘group leader/committee member/trustee’; ‘working in a charity shop’ Q6 ‘Thinking about the MAIN organisation you volunteer with, which of the statements on the showcard apply?’ Q7 ‘How did you find out about your present volunteering roles?’ Several options refer to ‘the organisation’: ‘from someone involved in the organisation’; from previous use of the services the organisation provides’; ‘I set up the group with like-minded people’ Q8 ‘Thinking about your volunteering role and the main organisation you volunteer with, which of the following statements apply?’
2013-2016 VOLUNTEERING GENERALLY (FORMAL/INFORMAL NOT SPECIFIED EXCEPT in Qs 4, 6-8) ‘Volunteering is defined as “the commitment of time and energy, for the benefit of society and the community, the environment, or individuals outside (or in addition to) one's immediate family. It is unpaid and undertaken freely and by choice.” It is important that your replies refer only to unpaid work or activities. Thinking about the definition just given, in the past year, have you carried out any voluntary work or activity?’ FORMAL Q4 ‘In the last 12 months, what types of voluntary work have you carried out?’ Several options refer to or imply an organisation: ‘church/religious organisation’; ‘group leader/committee member/trustee’; ‘working in a charity shop’ Q6 ‘Thinking about the MAIN organisation you volunteer with, which of the statements on the showcard apply?’ Q7 ‘How did you find out about your present volunteering roles?’ Several options refer to or imply an organisation: ‘from someone already involved in the organisation’; from previous use of the services the organisation provides’; ‘I contacted the organisation directly’; ‘I set up the group with like-minded people’ Q8 ‘Thinking about your volunteering role and the main organisation you volunteer with, which of the following statements apply?’
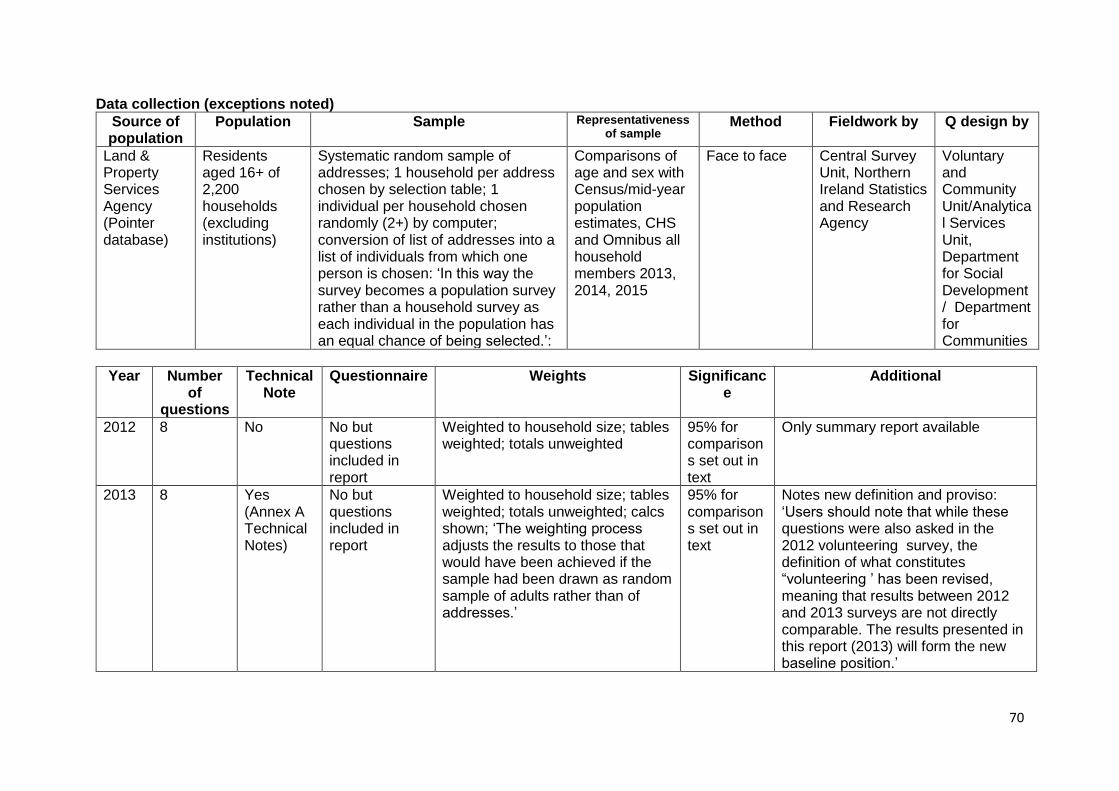
70
Data collection (exceptions noted)
Source of population
Population Sample Representativeness of sample
Method Fieldwork by Q design by
Land & Property Services Agency (Pointer database)
Residents aged 16+ of 2,200 households (excluding institutions)
Systematic random sample of addresses; 1 household per address chosen by selection table; 1 individual per household chosen randomly (2+) by computer; conversion of list of addresses into a list of individuals from which one person is chosen: ‘In this way the survey becomes a population survey rather than a household survey as each individual in the population has an equal chance of being selected.’:
Comparisons of age and sex with Census/mid-year population estimates, CHS and Omnibus all household members 2013, 2014, 2015
Face to face Central Survey Unit, Northern Ireland Statistics and Research Agency
Voluntary and Community Unit/Analytical Services Unit, Department for Social Development/ Department for Communities
Year Number of
questions
Technical Note
Questionnaire Weights Significance
Additional
2012 8 No No but questions included in report
Weighted to household size; tables weighted; totals unweighted
95% for comparisons set out in text
Only summary report available
2013 8 Yes (Annex A Technical Notes)
No but questions included in report
Weighted to household size; tables weighted; totals unweighted; calcs shown; ‘The weighting process adjusts the results to those that would have been achieved if the sample had been drawn as random sample of adults rather than of addresses.’
95% for comparisons set out in text
Notes new definition and proviso: ‘Users should note that while these questions were also asked in the 2012 volunteering survey, the definition of what constitutes “volunteering ’ has been revised, meaning that results between 2012 and 2013 surveys are not directly comparable. The results presented in this report (2013) will form the new baseline position.’
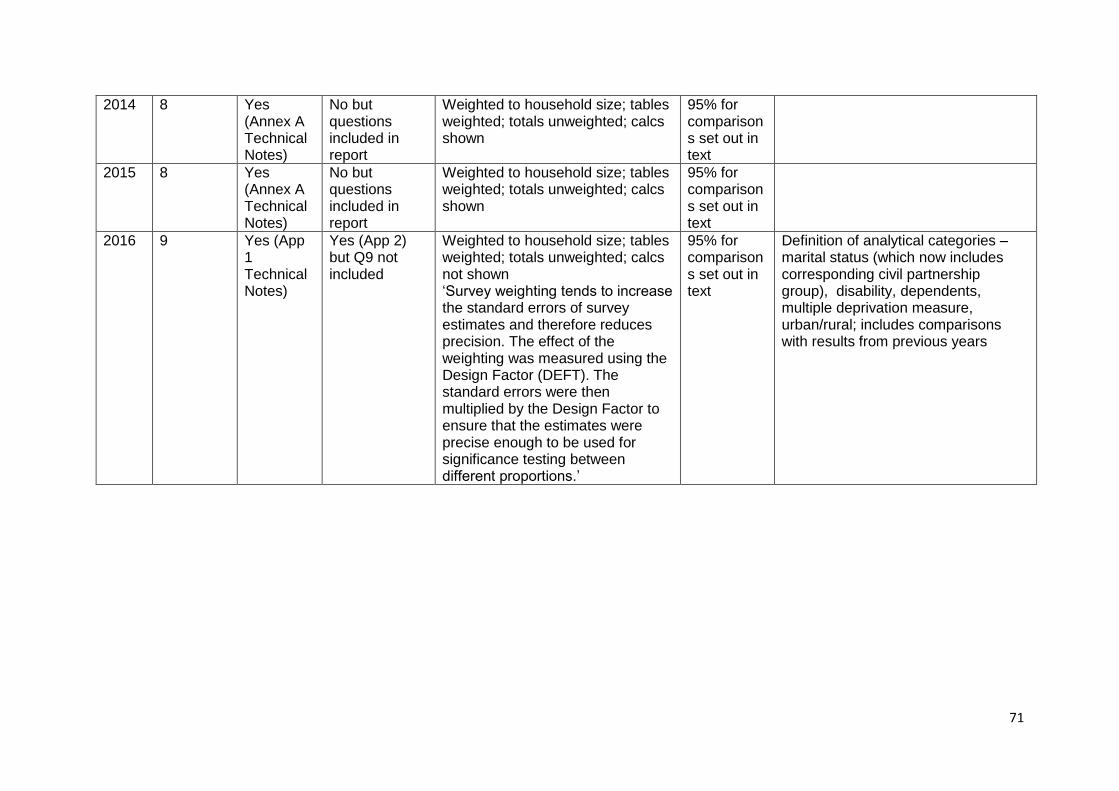
71
2014 8 Yes (Annex A Technical Notes)
No but questions included in report
Weighted to household size; tables weighted; totals unweighted; calcs shown
95% for comparisons set out in text
2015 8 Yes (Annex A Technical Notes)
No but questions included in report
Weighted to household size; tables weighted; totals unweighted; calcs shown
95% for comparisons set out in text
2016 9 Yes (App 1 Technical Notes)
Yes (App 2) but Q9 not included
Weighted to household size; tables weighted; totals unweighted; calcs not shown ‘Survey weighting tends to increase the standard errors of survey estimates and therefore reduces precision. The effect of the weighting was measured using the Design Factor (DEFT). The standard errors were then multiplied by the Design Factor to ensure that the estimates were precise enough to be used for significance testing between different proportions.’
95% for comparisons set out in text
Definition of analytical categories – marital status (which now includes corresponding civil partnership group), disability, dependents, multiple deprivation measure, urban/rural; includes comparisons with results from previous years
72
Volunteer Now would like to thank Colin Rochester and Meta Zimmeck for their work on
these reports. We would also like to acknowledge the support or our funders Building
Change Trust. Volunteer Now would also like to thank the Research Advisory Panel for their
assistance with these reports.
For more information on any of the contents please contact [email protected]
Volunteer Now delivers services across Northern Ireland. We have offices in Belfast, Broughshane, Enniskillen
and Newry. Registered Office: Skainos Centre, 239 Newtownards Road, Belfast, BT4 1AF. Charity registration
No. NIC101309. Company Limited by Guarantee No. NI602399. Registered in Northern Ireland.
© Volunteer Now 2018.


