Susceptibility Weighted MRI Sagar Buch 1 , E. Mark Haacke 2 1 The MRI Institute for Biomedical Research (Canada) 2 Department of Radiology, Wayne State University 4 th International Workshop on MRI Phase Contrast & Quantitative Susceptibility Mapping Medical University Of Graz, Austria
Transcript
Susceptibility Weighted MRI
Sagar Buch1 E Mark Haacke2
1The MRI Institute for Biomedical Research (Canada)2Department of Radiology Wayne State University
4th International Workshop on MRI Phase Contrast amp Quantitative Susceptibility MappingMedical University Of Graz Austria
Acknowledgements
Yongsheng Chen PhDSaifeng Liu PhD
Dongmei Wu PhDYu-Chung Norman Cheng PhD
Jaladhar Neelavalli PhDZhifeng Kou PhD David Utriainen BS
Sean Sethi MS
Magnetic Susceptibility
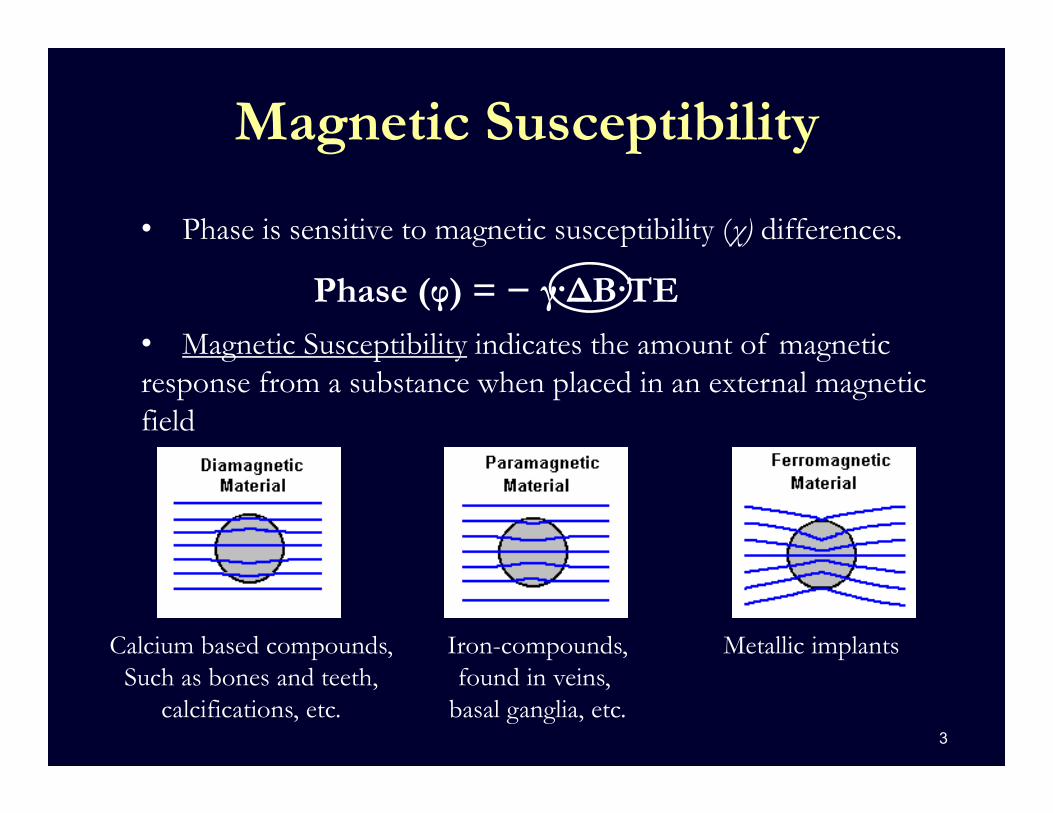
bull Phase is sensitive to magnetic susceptibility (χ) differences
bull Magnetic Susceptibility indicates the amount of magnetic response from a substance when placed in an external magnetic field
Metallic implantsCalcium based compoundsSuch as bones and teeth
calcifications etc
Iron-compoundsfound in veins
basal ganglia etc3
Phase (φ) = minus γΔBTE
B0
Δ
Δ lowast
MR Phase Behavior
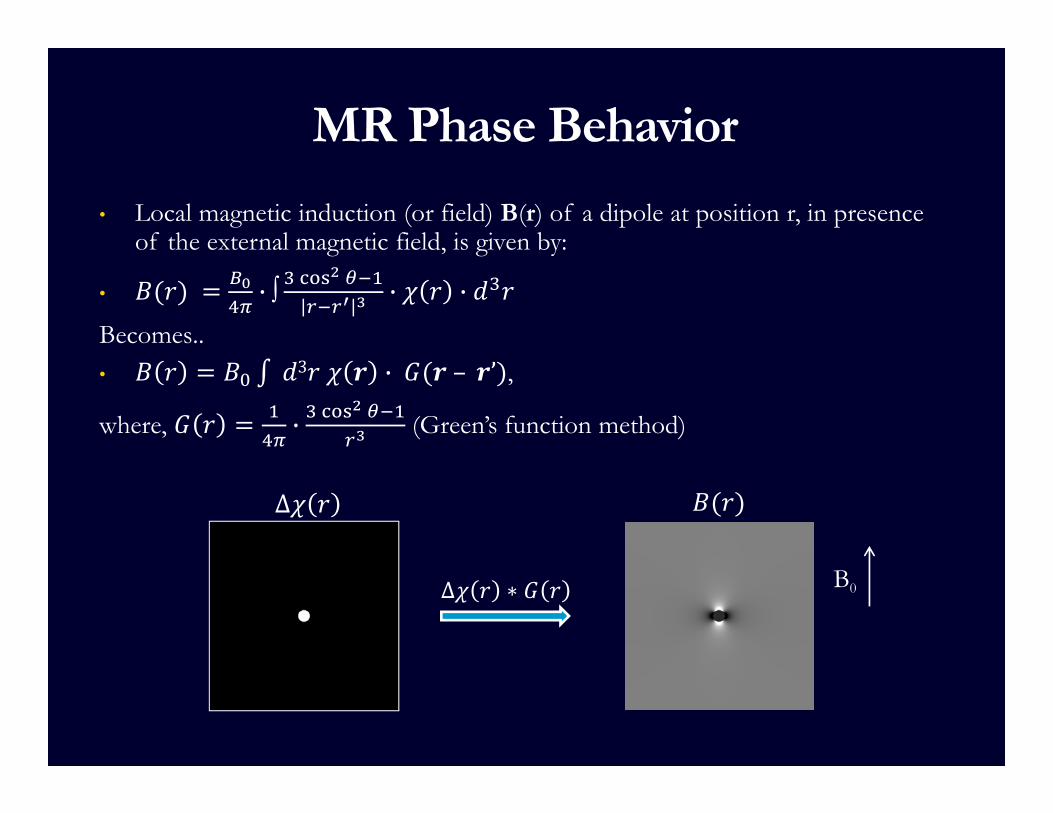
bull Local magnetic induction (or field) B(r) of a dipole at position r in presence of the external magnetic field is given by
bull middot int middot middotBecomesbull 3 middot ndash rsquo
where middot (Greenrsquos function method)
5
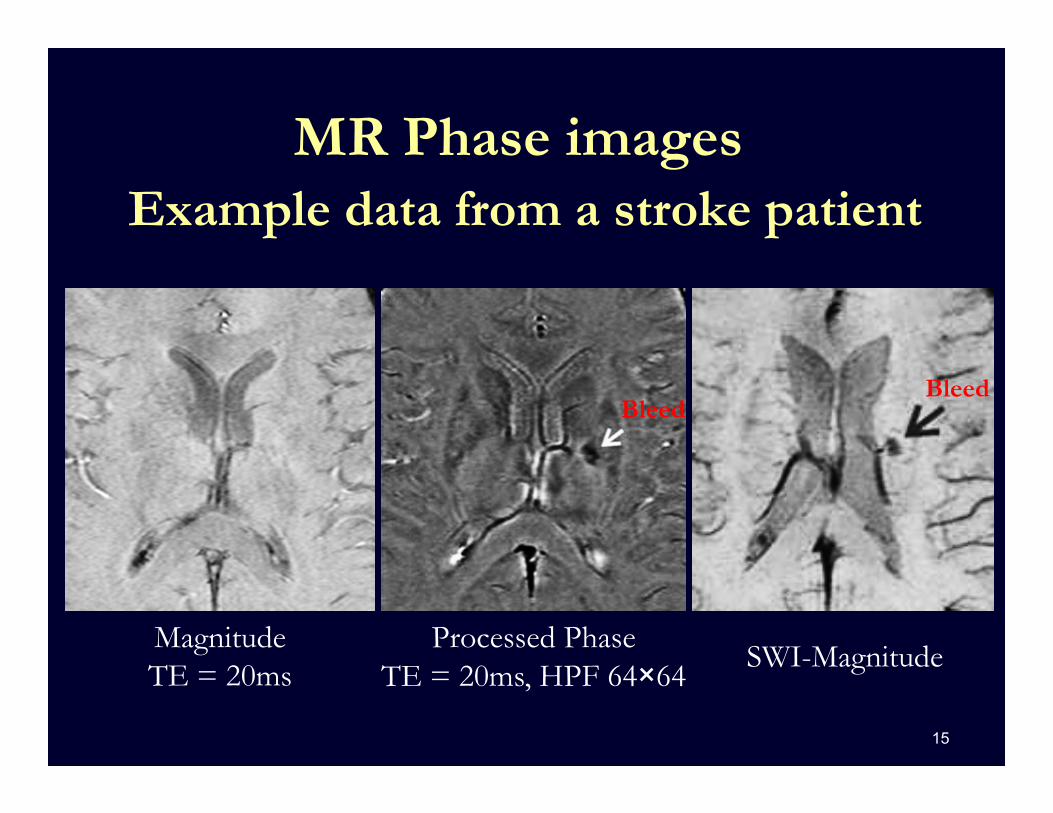
MR Phase imagesExample data from a stroke patient
MagnitudeTE = 20ms
Processed PhaseTE = 20ms HPF 64times64
Bleed
Susceptibility Artifacts in MRI Each pixel in the MR image can be represented by a
complex number Raw phase images may have aliasing caused from
background field inhomogeneities
MagnitudeTE = 15ms
Original Phase
TE = 15ms
6
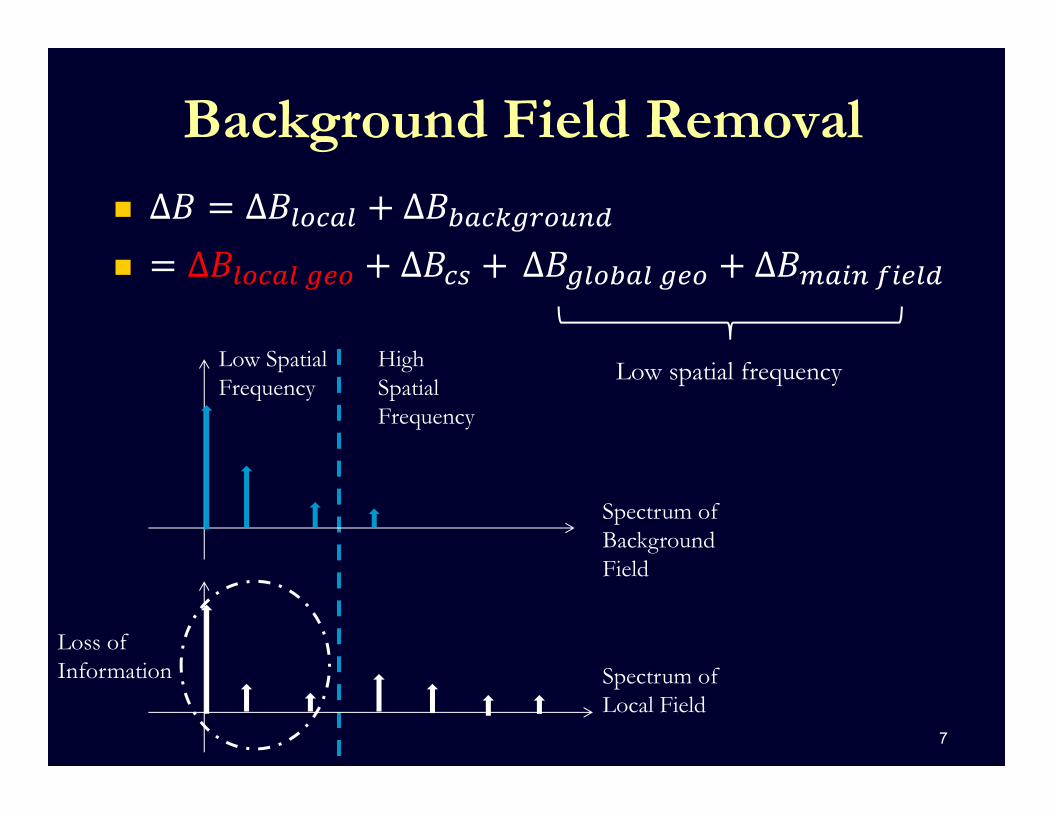
Low spatial frequencyLow Spatial Frequency
High Spatial Frequency
Background Field Removal
Spectrum of BackgroundField
Spectrum of Local Field
Loss of Information
7
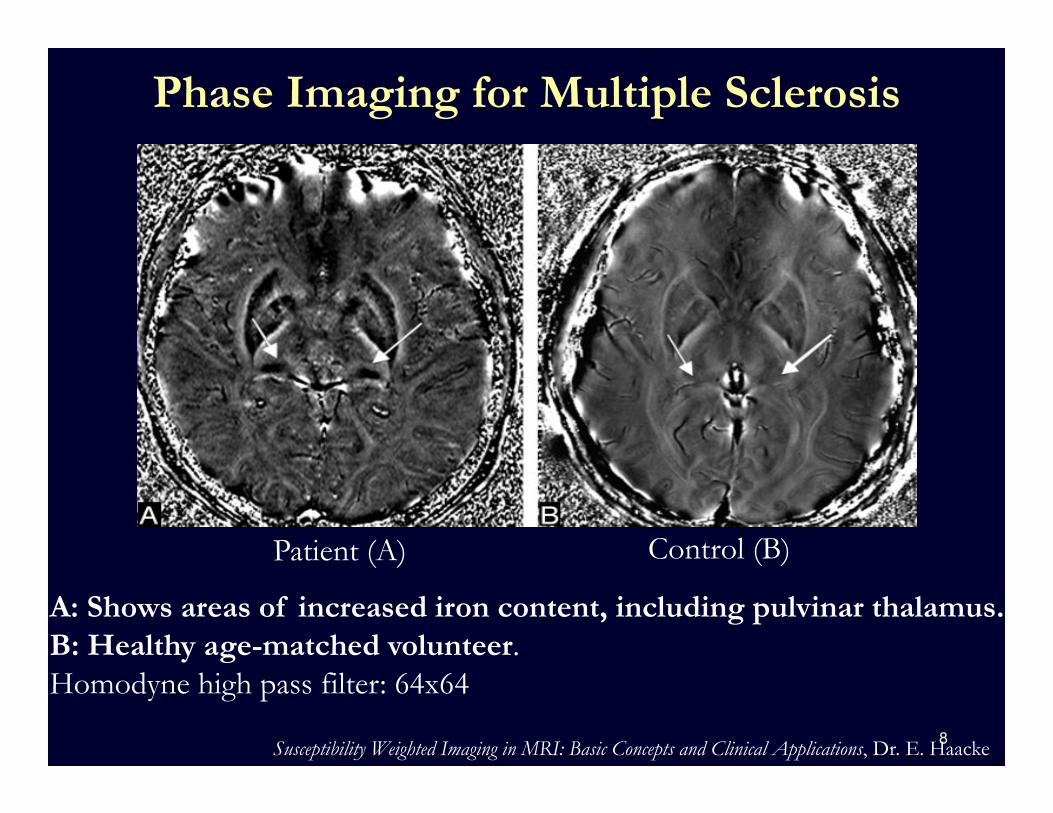
A Shows areas of increased iron content including pulvinar thalamus B Healthy age-matched volunteer Homodyne high pass filter 64x64
Phase Imaging for Multiple Sclerosis
Susceptibility Weighted Imaging in MRI Basic Concepts and Clinical Applications Dr E Haacke8
Control (B)Patient (A)
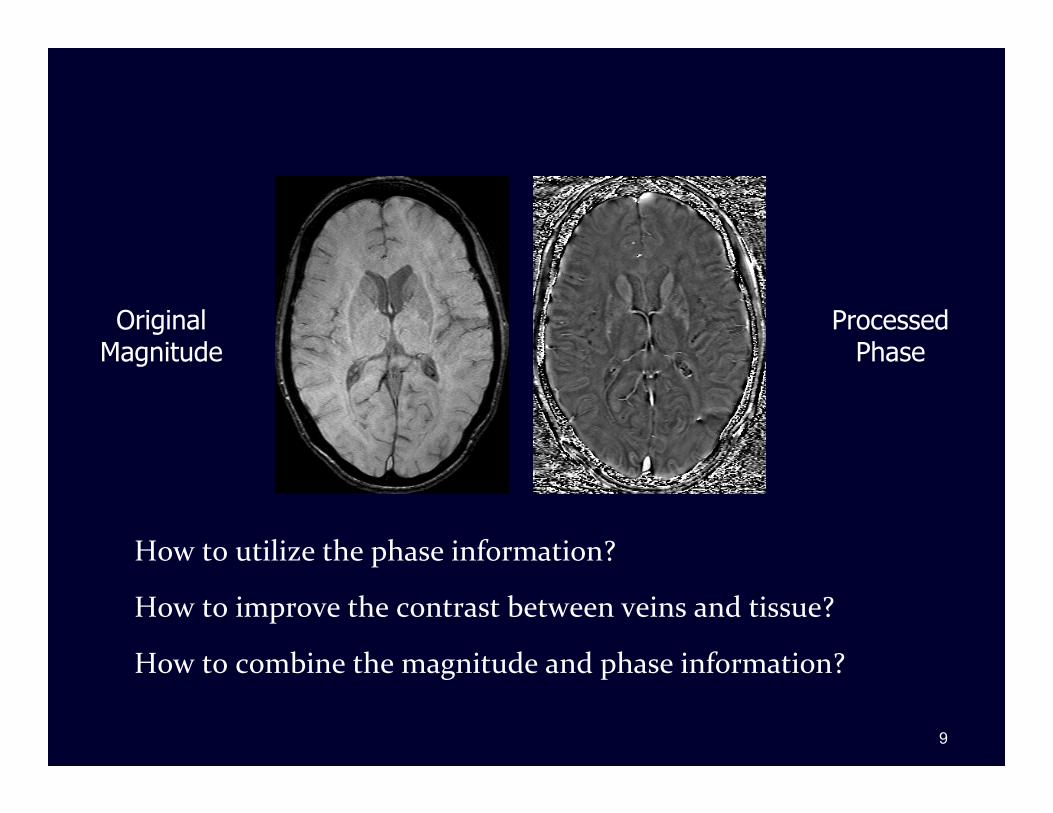
How to utilize the phase information
How to improve the contrast between veins and tissue
How to combine the magnitude and phase information
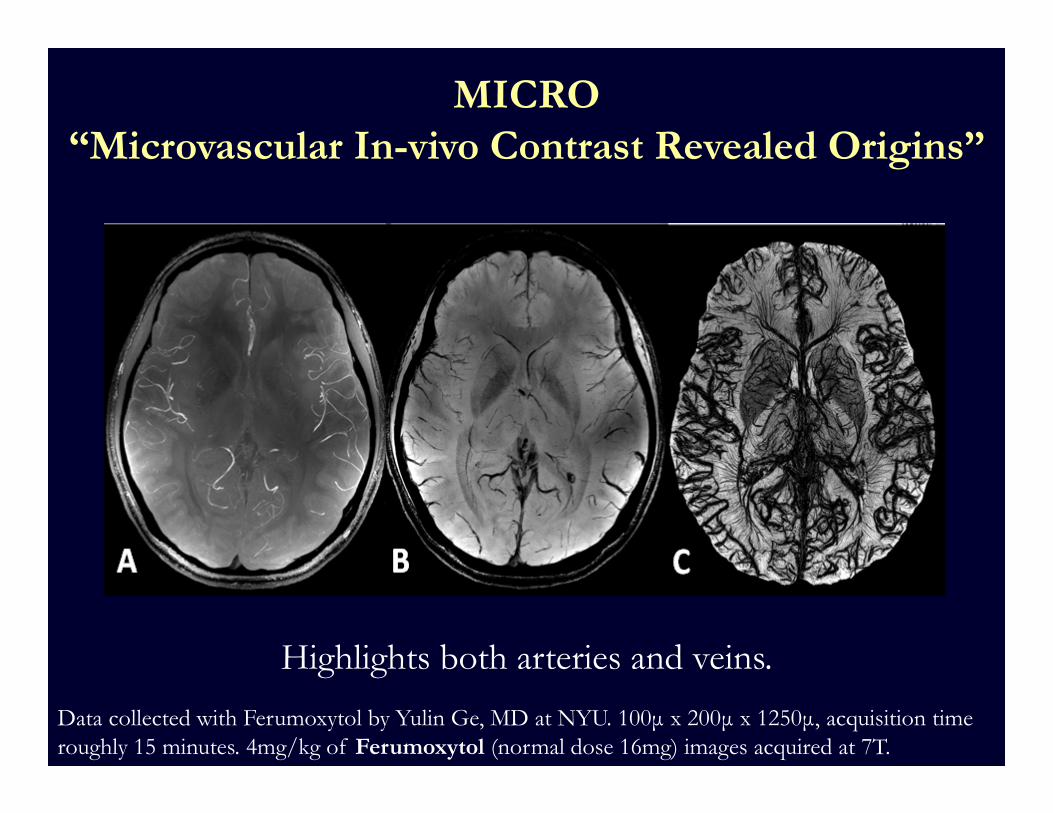
Data collected with Ferumoxytol by Yulin Ge MD at NYU 100μ x 200μ x 1250μ acquisition time roughly 15 minutes 4mgkg of Ferumoxytol (normal dose 16mg) images acquired at 7T
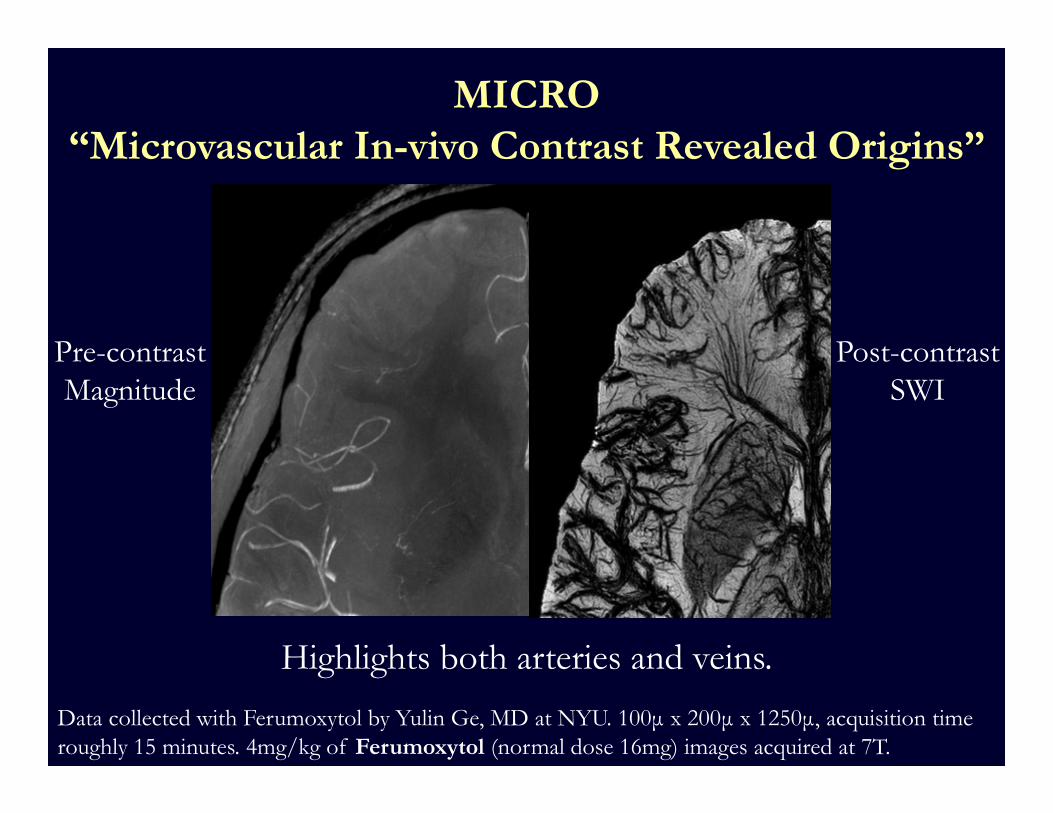
Data collected with Ferumoxytol by Yulin Ge MD at NYU 100μ x 200μ x 1250μ acquisition time roughly 15 minutes 4mgkg of Ferumoxytol (normal dose 16mg) images acquired at 7T
Highlights both arteries and veins
Pre-contrastMagnitude
Post-contrastSWI
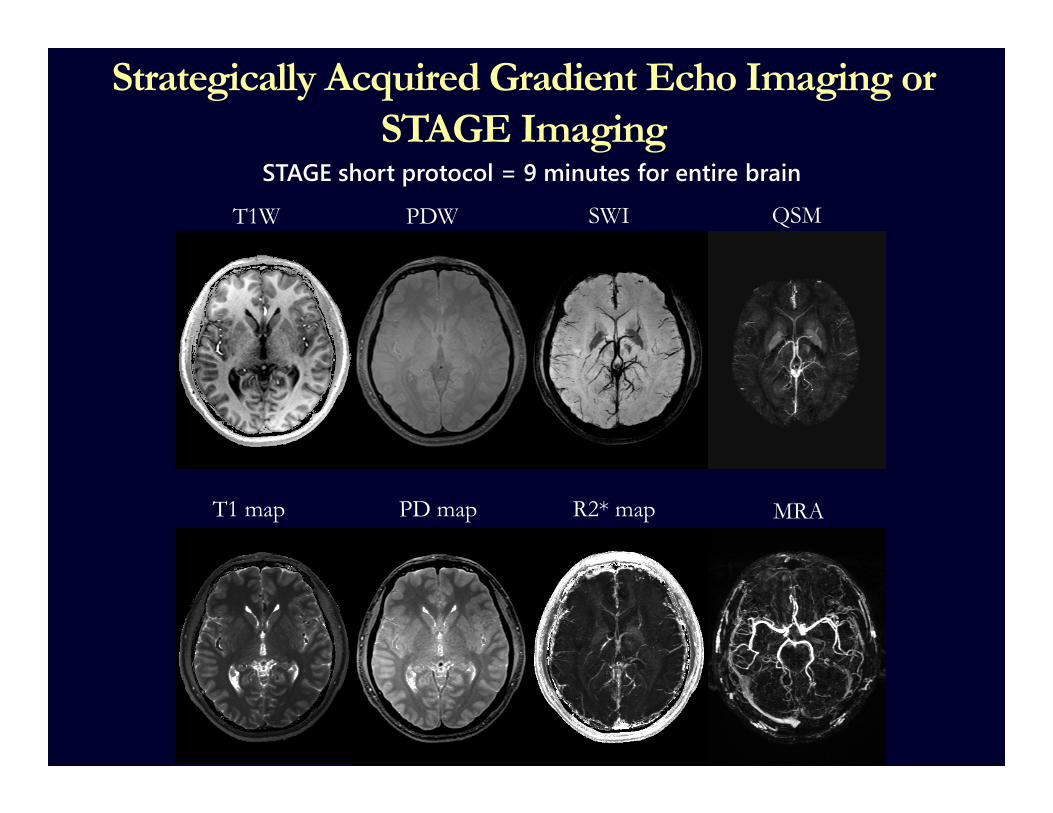
STAGE short protocol = 9 minutes for entire brain
Strategically Acquired Gradient Echo Imaging or STAGE Imaging
T1W PDW SWI QSM
T1 map PD map R2 map MRA
STAGE short protocol = 9 minutes for entire brain Add T2DWI = 3 minutes
Strategically Acquired Gradient Echo Imaging or STAGE Imaging
T1W PDW SWI QSM
T1 map PD map R2 map MRA
T2W
ADC map
Acknowledgements
Yongsheng Chen PhDSaifeng Liu PhD
Dongmei Wu PhDYu-Chung Norman Cheng PhD
Jaladhar Neelavalli PhDZhifeng Kou PhD David Utriainen BS
Sean Sethi MS
Magnetic Susceptibility
bull Phase is sensitive to magnetic susceptibility (χ) differences
bull Magnetic Susceptibility indicates the amount of magnetic response from a substance when placed in an external magnetic field
Metallic implantsCalcium based compoundsSuch as bones and teeth
calcifications etc
Iron-compoundsfound in veins
basal ganglia etc3
Phase (φ) = minus γΔBTE
B0
Δ
Δ lowast
MR Phase Behavior
bull Local magnetic induction (or field) B(r) of a dipole at position r in presence of the external magnetic field is given by
bull middot int middot middotBecomesbull 3 middot ndash rsquo
where middot (Greenrsquos function method)
5
MR Phase imagesExample data from a stroke patient
MagnitudeTE = 20ms
Processed PhaseTE = 20ms HPF 64times64
Bleed
Susceptibility Artifacts in MRI Each pixel in the MR image can be represented by a
complex number Raw phase images may have aliasing caused from
background field inhomogeneities
MagnitudeTE = 15ms
Original Phase
TE = 15ms
6
Low spatial frequencyLow Spatial Frequency
High Spatial Frequency
Background Field Removal
Spectrum of BackgroundField
Spectrum of Local Field
Loss of Information
7
A Shows areas of increased iron content including pulvinar thalamus B Healthy age-matched volunteer Homodyne high pass filter 64x64
Phase Imaging for Multiple Sclerosis
Susceptibility Weighted Imaging in MRI Basic Concepts and Clinical Applications Dr E Haacke8
Control (B)Patient (A)
How to utilize the phase information
How to improve the contrast between veins and tissue
How to combine the magnitude and phase information
Data collected with Ferumoxytol by Yulin Ge MD at NYU 100μ x 200μ x 1250μ acquisition time roughly 15 minutes 4mgkg of Ferumoxytol (normal dose 16mg) images acquired at 7T
Data collected with Ferumoxytol by Yulin Ge MD at NYU 100μ x 200μ x 1250μ acquisition time roughly 15 minutes 4mgkg of Ferumoxytol (normal dose 16mg) images acquired at 7T
Highlights both arteries and veins
Pre-contrastMagnitude
Post-contrastSWI
STAGE short protocol = 9 minutes for entire brain
Strategically Acquired Gradient Echo Imaging or STAGE Imaging
T1W PDW SWI QSM
T1 map PD map R2 map MRA
STAGE short protocol = 9 minutes for entire brain Add T2DWI = 3 minutes
Strategically Acquired Gradient Echo Imaging or STAGE Imaging
T1W PDW SWI QSM
T1 map PD map R2 map MRA
T2W
ADC map
How to utilize the phase information
How to improve the contrast between veins and tissue
How to combine the magnitude and phase information
Data collected with Ferumoxytol by Yulin Ge MD at NYU 100μ x 200μ x 1250μ acquisition time roughly 15 minutes 4mgkg of Ferumoxytol (normal dose 16mg) images acquired at 7T
Data collected with Ferumoxytol by Yulin Ge MD at NYU 100μ x 200μ x 1250μ acquisition time roughly 15 minutes 4mgkg of Ferumoxytol (normal dose 16mg) images acquired at 7T
Highlights both arteries and veins
Pre-contrastMagnitude
Post-contrastSWI
STAGE short protocol = 9 minutes for entire brain
Strategically Acquired Gradient Echo Imaging or STAGE Imaging
T1W PDW SWI QSM
T1 map PD map R2 map MRA
STAGE short protocol = 9 minutes for entire brain Add T2DWI = 3 minutes
Strategically Acquired Gradient Echo Imaging or STAGE Imaging
Data collected with Ferumoxytol by Yulin Ge MD at NYU 100μ x 200μ x 1250μ acquisition time roughly 15 minutes 4mgkg of Ferumoxytol (normal dose 16mg) images acquired at 7T
Data collected with Ferumoxytol by Yulin Ge MD at NYU 100μ x 200μ x 1250μ acquisition time roughly 15 minutes 4mgkg of Ferumoxytol (normal dose 16mg) images acquired at 7T
Highlights both arteries and veins
Pre-contrastMagnitude
Post-contrastSWI
STAGE short protocol = 9 minutes for entire brain
Strategically Acquired Gradient Echo Imaging or STAGE Imaging
T1W PDW SWI QSM
T1 map PD map R2 map MRA
STAGE short protocol = 9 minutes for entire brain Add T2DWI = 3 minutes
Strategically Acquired Gradient Echo Imaging or STAGE Imaging
T1W PDW SWI QSM
T1 map PD map R2 map MRA
T2W
ADC map
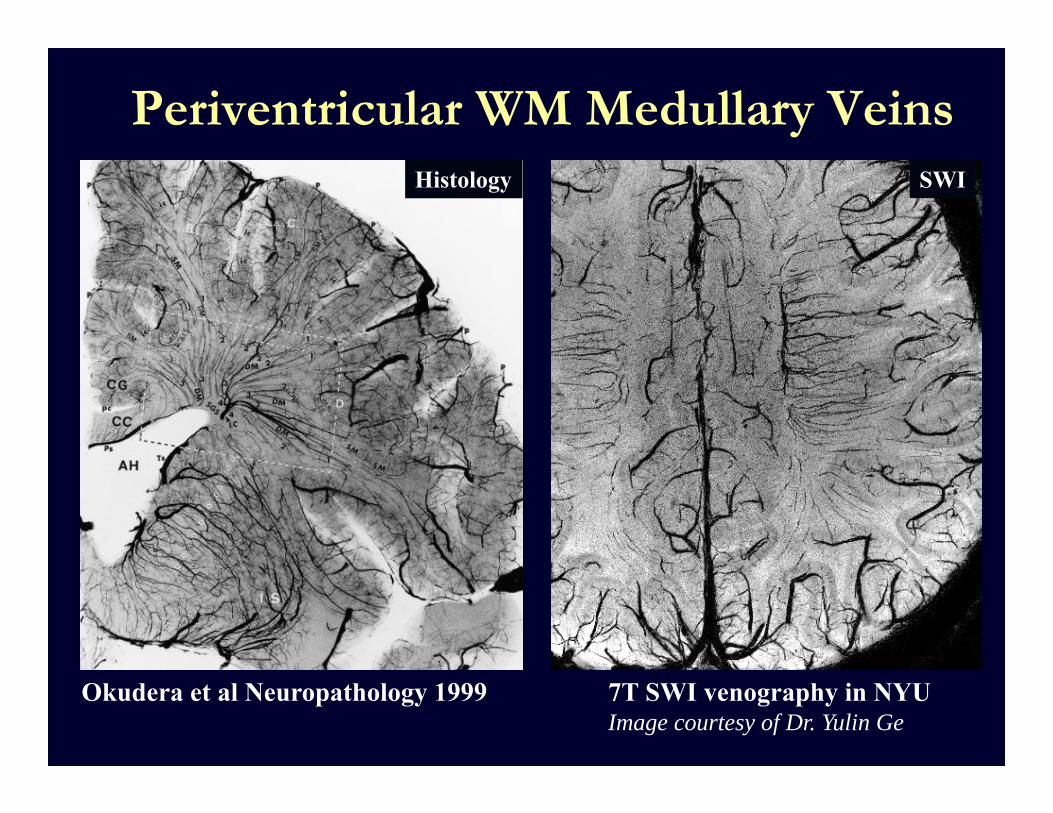
Periventricular WM Medullary Veins Histology
Okudera et al Neuropathology 1999
SWI
7T SWI venography in NYUImage courtesy of Dr Yulin Ge
Data collected with Ferumoxytol by Yulin Ge MD at NYU 100μ x 200μ x 1250μ acquisition time roughly 15 minutes 4mgkg of Ferumoxytol (normal dose 16mg) images acquired at 7T
Data collected with Ferumoxytol by Yulin Ge MD at NYU 100μ x 200μ x 1250μ acquisition time roughly 15 minutes 4mgkg of Ferumoxytol (normal dose 16mg) images acquired at 7T
Highlights both arteries and veins
Pre-contrastMagnitude
Post-contrastSWI
STAGE short protocol = 9 minutes for entire brain
Strategically Acquired Gradient Echo Imaging or STAGE Imaging
T1W PDW SWI QSM
T1 map PD map R2 map MRA
STAGE short protocol = 9 minutes for entire brain Add T2DWI = 3 minutes
Strategically Acquired Gradient Echo Imaging or STAGE Imaging
Data collected with Ferumoxytol by Yulin Ge MD at NYU 100μ x 200μ x 1250μ acquisition time roughly 15 minutes 4mgkg of Ferumoxytol (normal dose 16mg) images acquired at 7T
Data collected with Ferumoxytol by Yulin Ge MD at NYU 100μ x 200μ x 1250μ acquisition time roughly 15 minutes 4mgkg of Ferumoxytol (normal dose 16mg) images acquired at 7T
Highlights both arteries and veins
Pre-contrastMagnitude
Post-contrastSWI
STAGE short protocol = 9 minutes for entire brain
Strategically Acquired Gradient Echo Imaging or STAGE Imaging
T1W PDW SWI QSM
T1 map PD map R2 map MRA
STAGE short protocol = 9 minutes for entire brain Add T2DWI = 3 minutes
Strategically Acquired Gradient Echo Imaging or STAGE Imaging
T1W PDW SWI QSM
T1 map PD map R2 map MRA
T2W
ADC map
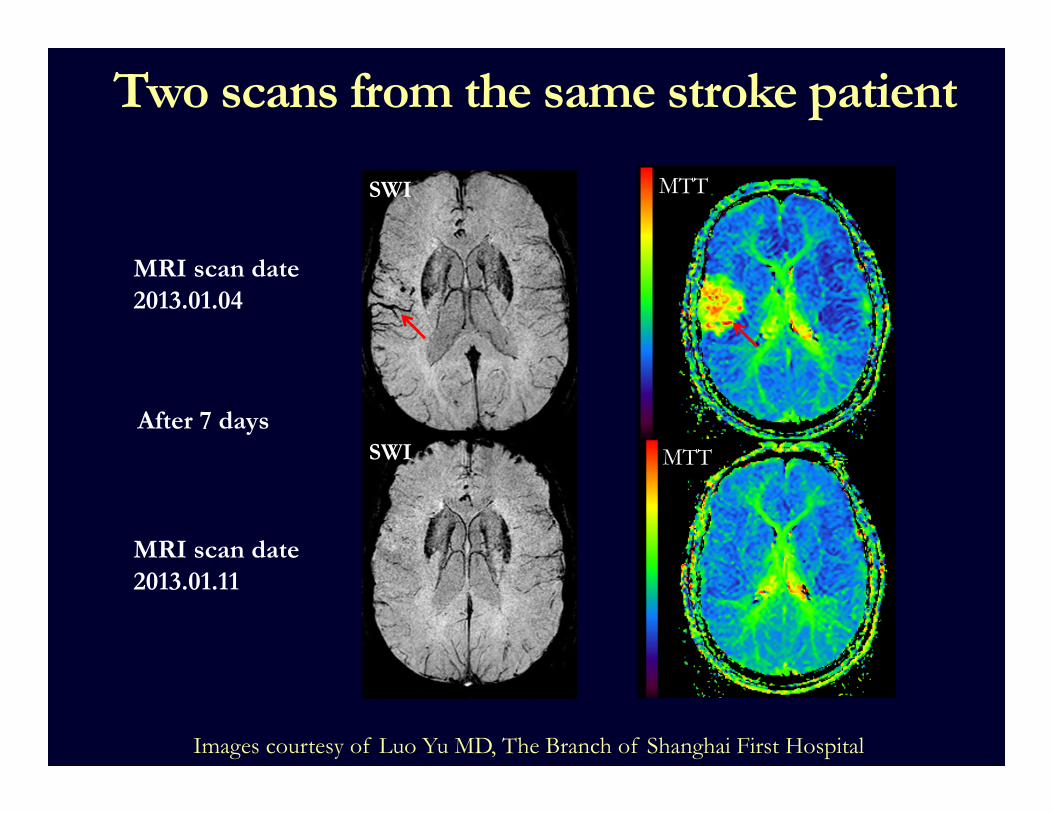
MRI scan date 20130104
MRI scan date 20130111
Two scans from the same stroke patient
MTT
SWI
SWI
MTT
Images courtesy of Luo Yu MD The Branch of Shanghai First Hospital
After 7 days
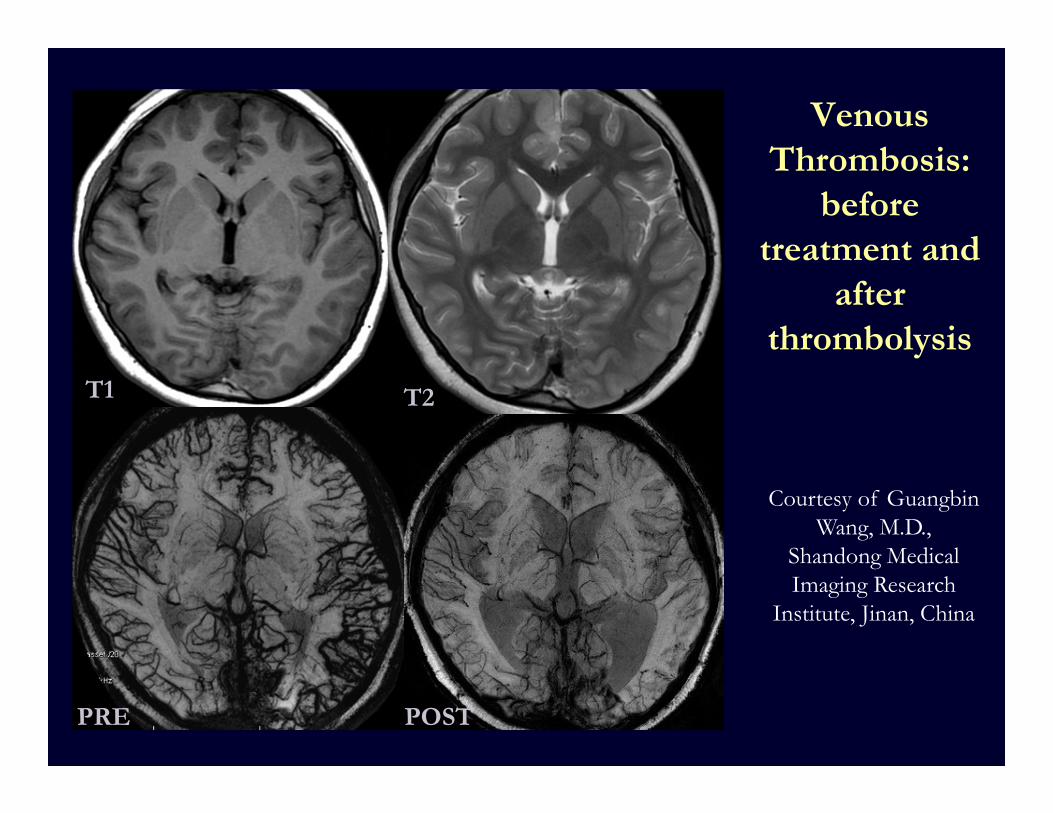
Venous Thrombosis
before treatment and
after thrombolysis
Courtesy of GuangbinWang MD
Shandong Medical Imaging Research
Institute Jinan China
T1 T2
PRE POST
Sturge Weber Syndrome
Post Gd 3D T1 SWI (no contrast agent)
Czabo Juhasz Yang Xuan and Dr E Haacke Wayne State University
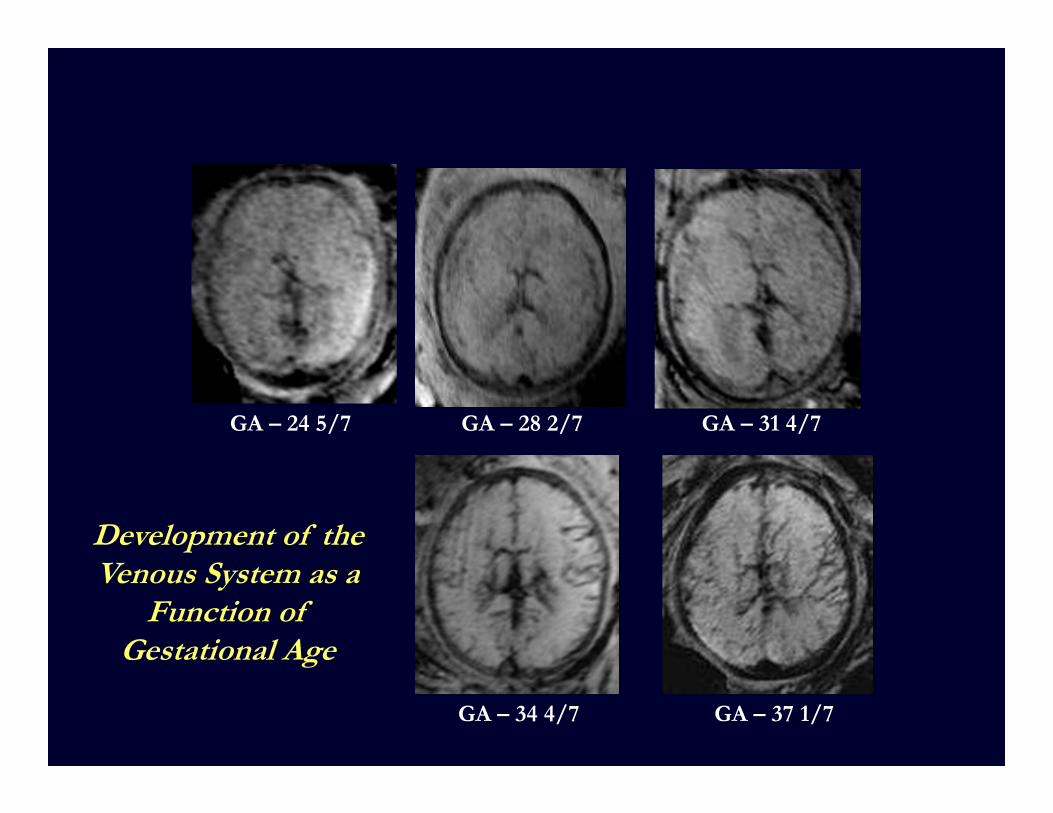
Development of the Venous System as a
Function of Gestational Age
GA ndash 34 47 GA ndash 37 17
GA ndash 31 47GA ndash 28 27GA ndash 24 57
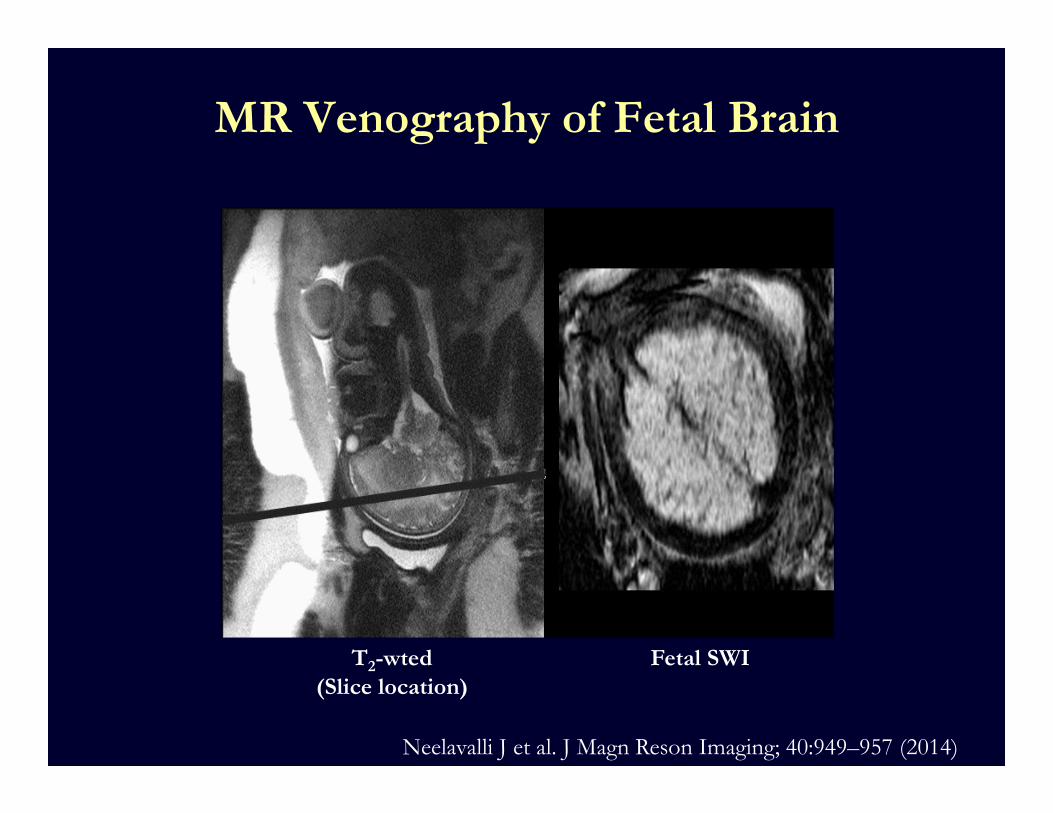
Fetal SWIT2-wted(Slice location)
MR Venography of Fetal Brain
Neelavalli J et al J Magn Reson Imaging 40949ndash957 (2014)
Recent Advances
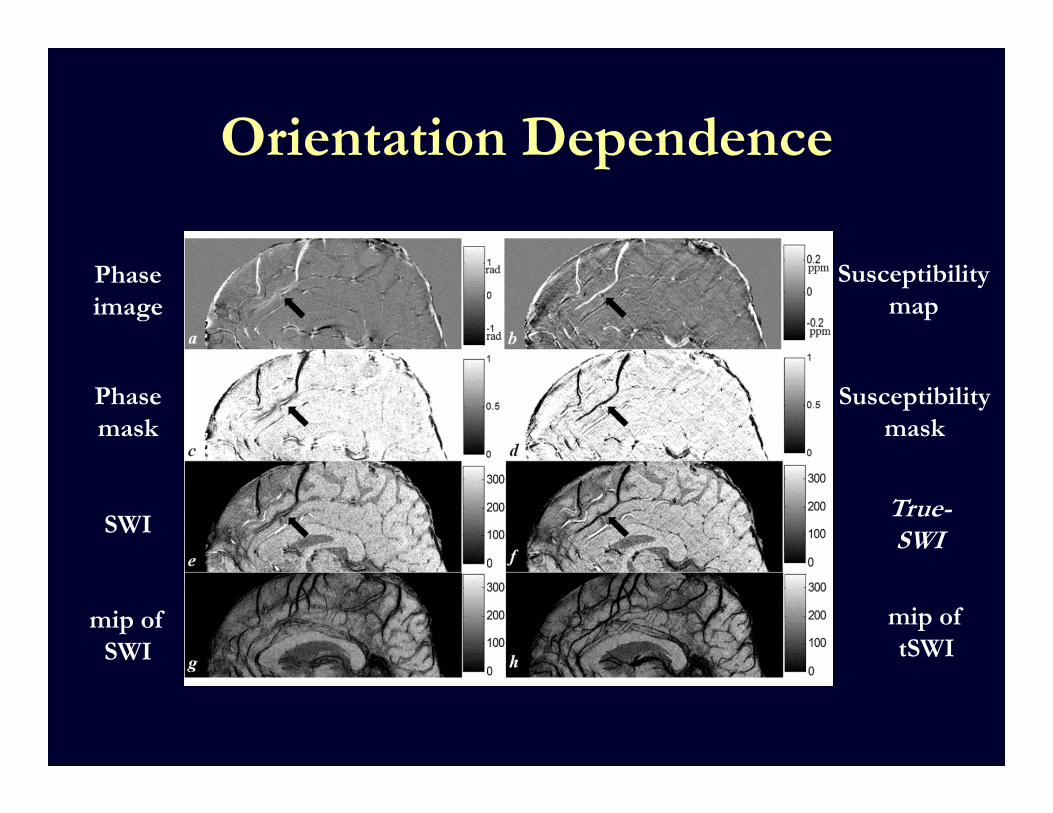
Orientation Dependence
26
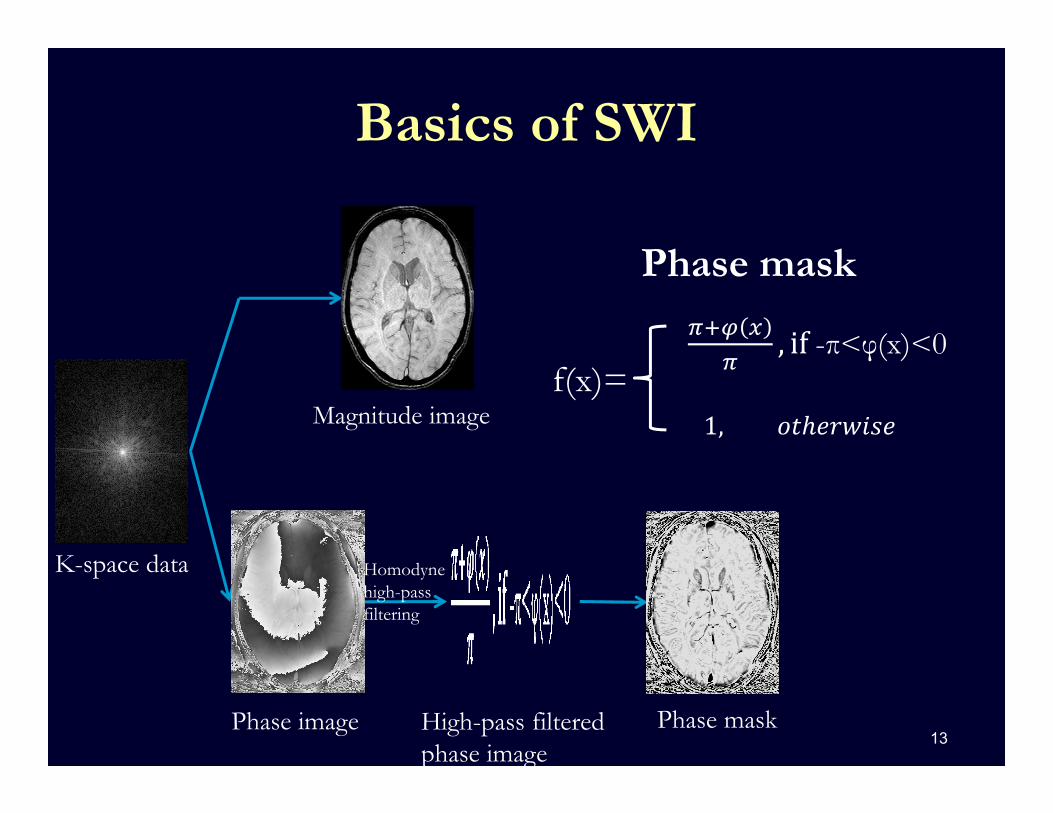
Phase image
Phase mask
SWI
mip of SWI
Orientation Dependence
Susceptibility map
Phase image
Phase mask
Susceptibility mask
SWITrue-SWI
mip of SWI
mip of tSWI
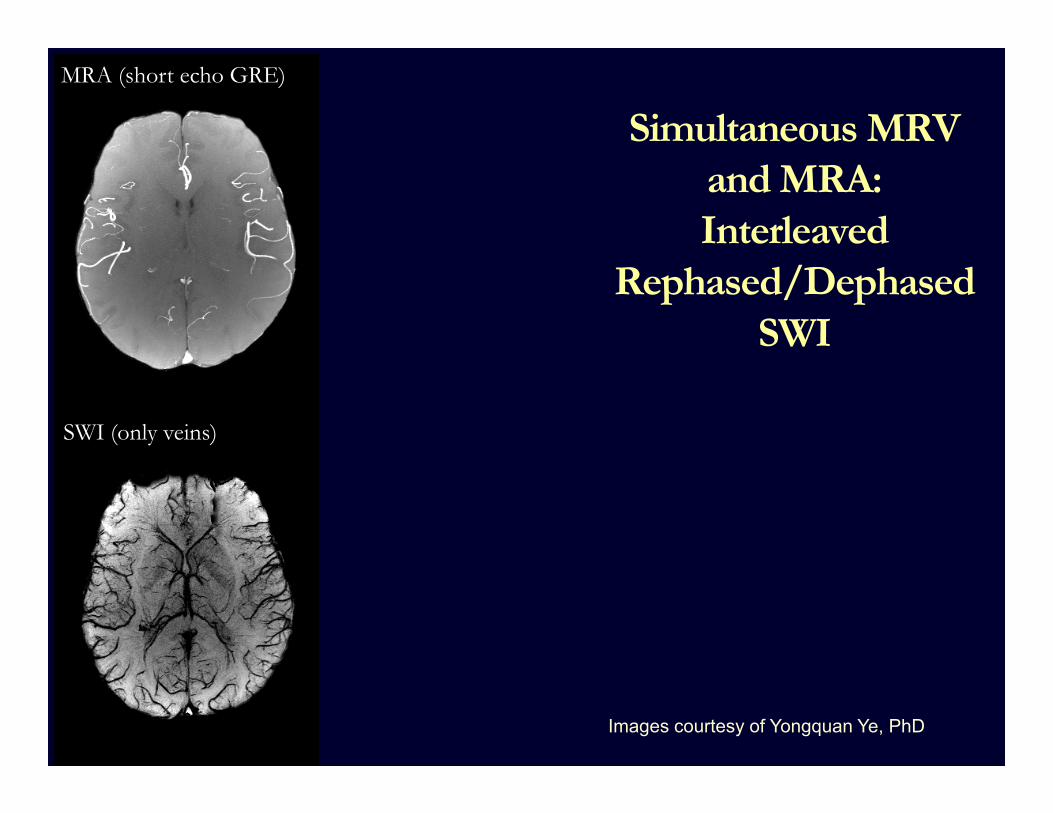
SWI (only veins)
Images courtesy of Yongquan Ye PhD
Simultaneous MRV and MRAInterleaved
RephasedDephasedSWI
MRA (short echo GRE)
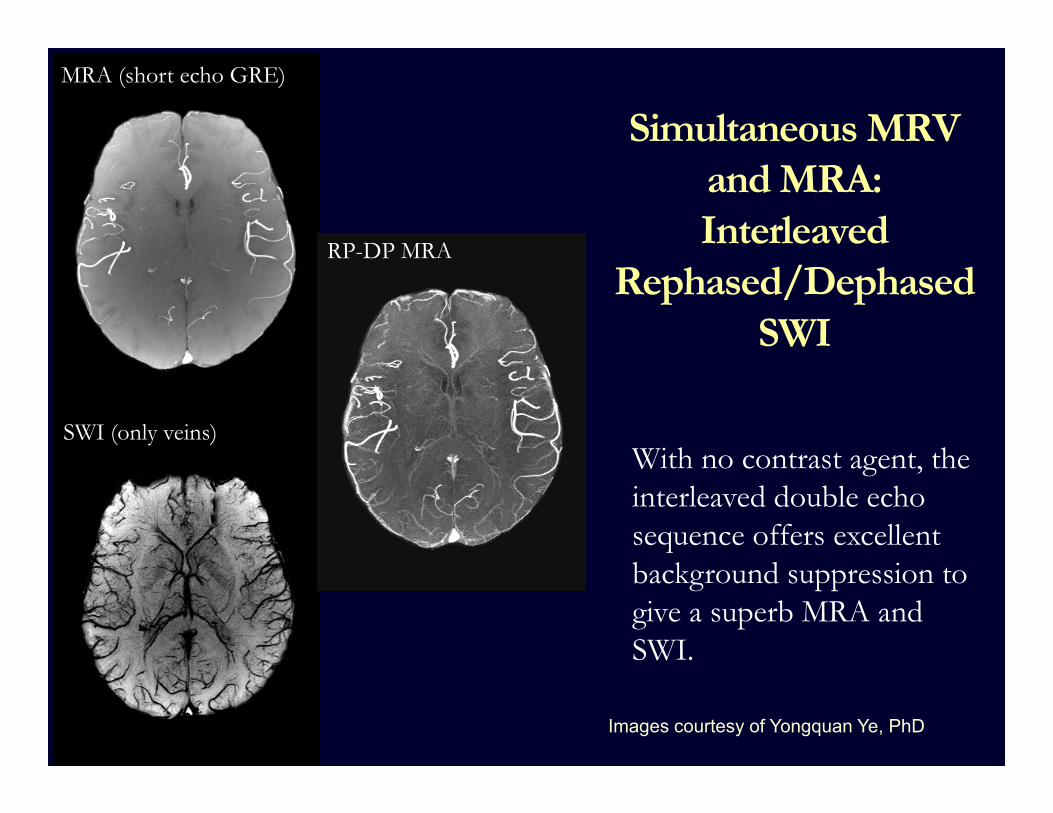
Simultaneous MRV and MRAInterleaved
RephasedDephasedSWI
MRA (short echo GRE)
SWI (only veins)With no contrast agent the interleaved double echo sequence offers excellent background suppression to give a superb MRA and SWI
Images courtesy of Yongquan Ye PhD
RP-DP MRA
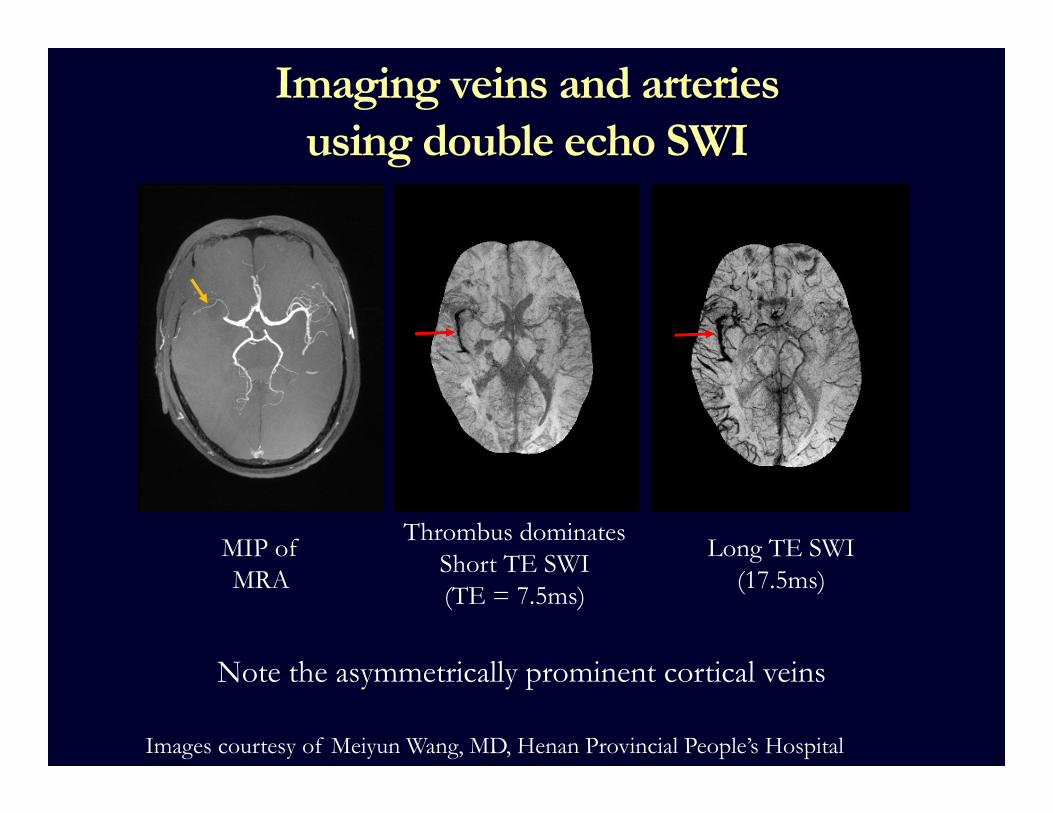
Imaging veins and arteries using double echo SWI
Thrombus dominates Short TE SWI (TE = 75ms)
Note the asymmetrically prominent cortical veins
MIP of MRA
Long TE SWI (175ms)
Images courtesy of Meiyun Wang MD Henan Provincial Peoplersquos Hospital
Data collected with Ferumoxytol by Yulin Ge MD at NYU 100μ x 200μ x 1250μ acquisition time roughly 15 minutes 4mgkg of Ferumoxytol (normal dose 16mg) images acquired at 7T
Data collected with Ferumoxytol by Yulin Ge MD at NYU 100μ x 200μ x 1250μ acquisition time roughly 15 minutes 4mgkg of Ferumoxytol (normal dose 16mg) images acquired at 7T
Highlights both arteries and veins
Pre-contrastMagnitude
Post-contrastSWI
STAGE short protocol = 9 minutes for entire brain
Strategically Acquired Gradient Echo Imaging or STAGE Imaging
T1W PDW SWI QSM
T1 map PD map R2 map MRA
STAGE short protocol = 9 minutes for entire brain Add T2DWI = 3 minutes
Strategically Acquired Gradient Echo Imaging or STAGE Imaging
T1W PDW SWI QSM
T1 map PD map R2 map MRA
T2W
ADC map
Venous Thrombosis
before treatment and
after thrombolysis
Courtesy of GuangbinWang MD
Shandong Medical Imaging Research
Institute Jinan China
T1 T2
PRE POST
Sturge Weber Syndrome
Post Gd 3D T1 SWI (no contrast agent)
Czabo Juhasz Yang Xuan and Dr E Haacke Wayne State University
Development of the Venous System as a
Function of Gestational Age
GA ndash 34 47 GA ndash 37 17
GA ndash 31 47GA ndash 28 27GA ndash 24 57
Fetal SWIT2-wted(Slice location)
MR Venography of Fetal Brain
Neelavalli J et al J Magn Reson Imaging 40949ndash957 (2014)
Recent Advances
Orientation Dependence
26
Phase image
Phase mask
SWI
mip of SWI
Orientation Dependence
Susceptibility map
Phase image
Phase mask
Susceptibility mask
SWITrue-SWI
mip of SWI
mip of tSWI
SWI (only veins)
Images courtesy of Yongquan Ye PhD
Simultaneous MRV and MRAInterleaved
RephasedDephasedSWI
MRA (short echo GRE)
Simultaneous MRV and MRAInterleaved
RephasedDephasedSWI
MRA (short echo GRE)
SWI (only veins)With no contrast agent the interleaved double echo sequence offers excellent background suppression to give a superb MRA and SWI
Images courtesy of Yongquan Ye PhD
RP-DP MRA
Imaging veins and arteries using double echo SWI
Thrombus dominates Short TE SWI (TE = 75ms)
Note the asymmetrically prominent cortical veins
MIP of MRA
Long TE SWI (175ms)
Images courtesy of Meiyun Wang MD Henan Provincial Peoplersquos Hospital
Data collected with Ferumoxytol by Yulin Ge MD at NYU 100μ x 200μ x 1250μ acquisition time roughly 15 minutes 4mgkg of Ferumoxytol (normal dose 16mg) images acquired at 7T
Data collected with Ferumoxytol by Yulin Ge MD at NYU 100μ x 200μ x 1250μ acquisition time roughly 15 minutes 4mgkg of Ferumoxytol (normal dose 16mg) images acquired at 7T
Highlights both arteries and veins
Pre-contrastMagnitude
Post-contrastSWI
STAGE short protocol = 9 minutes for entire brain
Strategically Acquired Gradient Echo Imaging or STAGE Imaging
T1W PDW SWI QSM
T1 map PD map R2 map MRA
STAGE short protocol = 9 minutes for entire brain Add T2DWI = 3 minutes
Strategically Acquired Gradient Echo Imaging or STAGE Imaging
T1W PDW SWI QSM
T1 map PD map R2 map MRA
T2W
ADC map
Orientation Dependence
Susceptibility map
Phase image
Phase mask
Susceptibility mask
SWITrue-SWI
mip of SWI
mip of tSWI
SWI (only veins)
Images courtesy of Yongquan Ye PhD
Simultaneous MRV and MRAInterleaved
RephasedDephasedSWI
MRA (short echo GRE)
Simultaneous MRV and MRAInterleaved
RephasedDephasedSWI
MRA (short echo GRE)
SWI (only veins)With no contrast agent the interleaved double echo sequence offers excellent background suppression to give a superb MRA and SWI
Images courtesy of Yongquan Ye PhD
RP-DP MRA
Imaging veins and arteries using double echo SWI
Thrombus dominates Short TE SWI (TE = 75ms)
Note the asymmetrically prominent cortical veins
MIP of MRA
Long TE SWI (175ms)
Images courtesy of Meiyun Wang MD Henan Provincial Peoplersquos Hospital
Data collected with Ferumoxytol by Yulin Ge MD at NYU 100μ x 200μ x 1250μ acquisition time roughly 15 minutes 4mgkg of Ferumoxytol (normal dose 16mg) images acquired at 7T
Data collected with Ferumoxytol by Yulin Ge MD at NYU 100μ x 200μ x 1250μ acquisition time roughly 15 minutes 4mgkg of Ferumoxytol (normal dose 16mg) images acquired at 7T
Highlights both arteries and veins
Pre-contrastMagnitude
Post-contrastSWI
STAGE short protocol = 9 minutes for entire brain
Strategically Acquired Gradient Echo Imaging or STAGE Imaging
T1W PDW SWI QSM
T1 map PD map R2 map MRA
STAGE short protocol = 9 minutes for entire brain Add T2DWI = 3 minutes
Strategically Acquired Gradient Echo Imaging or STAGE Imaging
T1W PDW SWI QSM
T1 map PD map R2 map MRA
T2W
ADC map
Imaging veins and arteries using double echo SWI
Thrombus dominates Short TE SWI (TE = 75ms)
Note the asymmetrically prominent cortical veins
MIP of MRA
Long TE SWI (175ms)
Images courtesy of Meiyun Wang MD Henan Provincial Peoplersquos Hospital
Data collected with Ferumoxytol by Yulin Ge MD at NYU 100μ x 200μ x 1250μ acquisition time roughly 15 minutes 4mgkg of Ferumoxytol (normal dose 16mg) images acquired at 7T
Data collected with Ferumoxytol by Yulin Ge MD at NYU 100μ x 200μ x 1250μ acquisition time roughly 15 minutes 4mgkg of Ferumoxytol (normal dose 16mg) images acquired at 7T
Highlights both arteries and veins
Pre-contrastMagnitude
Post-contrastSWI
STAGE short protocol = 9 minutes for entire brain
Strategically Acquired Gradient Echo Imaging or STAGE Imaging
T1W PDW SWI QSM
T1 map PD map R2 map MRA
STAGE short protocol = 9 minutes for entire brain Add T2DWI = 3 minutes
Strategically Acquired Gradient Echo Imaging or STAGE Imaging
Data collected with Ferumoxytol by Yulin Ge MD at NYU 100μ x 200μ x 1250μ acquisition time roughly 15 minutes 4mgkg of Ferumoxytol (normal dose 16mg) images acquired at 7T
Data collected with Ferumoxytol by Yulin Ge MD at NYU 100μ x 200μ x 1250μ acquisition time roughly 15 minutes 4mgkg of Ferumoxytol (normal dose 16mg) images acquired at 7T
Highlights both arteries and veins
Pre-contrastMagnitude
Post-contrastSWI
STAGE short protocol = 9 minutes for entire brain
Strategically Acquired Gradient Echo Imaging or STAGE Imaging
T1W PDW SWI QSM
T1 map PD map R2 map MRA
STAGE short protocol = 9 minutes for entire brain Add T2DWI = 3 minutes
Strategically Acquired Gradient Echo Imaging or STAGE Imaging
Data collected with Ferumoxytol by Yulin Ge MD at NYU 100μ x 200μ x 1250μ acquisition time roughly 15 minutes 4mgkg of Ferumoxytol (normal dose 16mg) images acquired at 7T
Highlights both arteries and veins
Pre-contrastMagnitude
Post-contrastSWI
STAGE short protocol = 9 minutes for entire brain
Strategically Acquired Gradient Echo Imaging or STAGE Imaging
T1W PDW SWI QSM
T1 map PD map R2 map MRA
STAGE short protocol = 9 minutes for entire brain Add T2DWI = 3 minutes
Strategically Acquired Gradient Echo Imaging or STAGE Imaging
T1W PDW SWI QSM
T1 map PD map R2 map MRA
T2W
ADC map
STAGE short protocol = 9 minutes for entire brain Add T2DWI = 3 minutes
Strategically Acquired Gradient Echo Imaging or STAGE Imaging