Sustainable Data Evolution Technology (SDET) for Power Grid Optimization Ruisheng Diao, Ph.D., P.E. Team Lead/Staff Research Engineer Pacific Northwest National Laboratory June 29 th , 2017 presented by
Transcript
Sustainable Data Evolution Technology (SDET) for Power Grid Optimization
Ruisheng Diao, Ph.D., P.E.Team Lead/Staff Research EngineerPacific Northwest National LaboratoryJune 29th, 2017
presented by
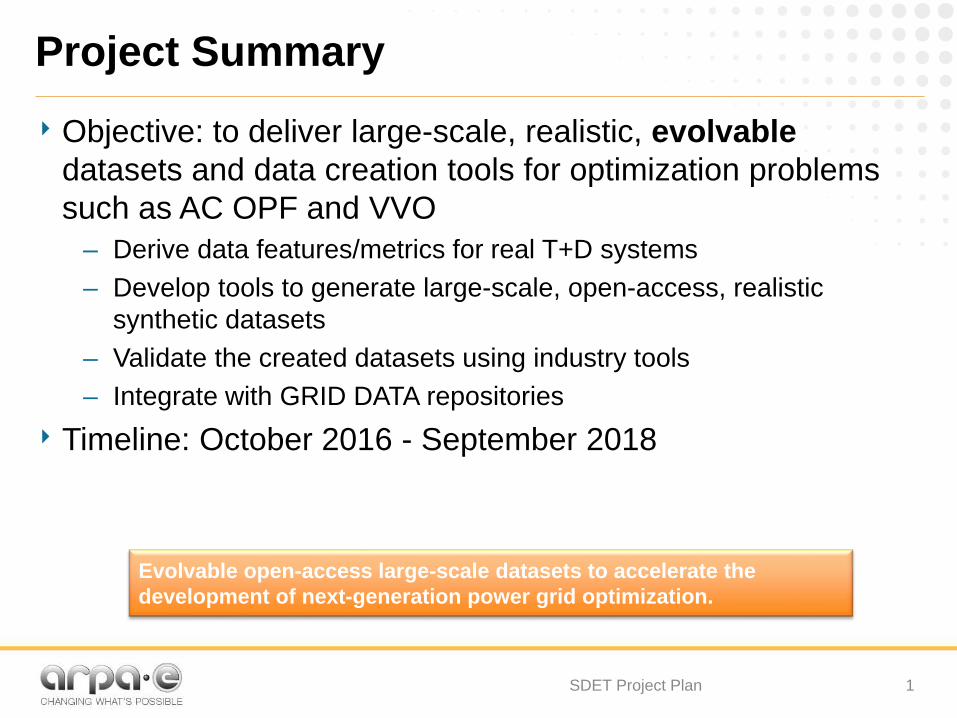
Project Summary
‣ Objective: to deliver large-scale, realistic, evolvabledatasets and data creation tools for optimization problems such as AC OPF and VVO
– Derive data features/metrics for real T+D systems– Develop tools to generate large-scale, open-access, realistic
synthetic datasets– Validate the created datasets using industry tools– Integrate with GRID DATA repositories
‣ Timeline: October 2016 - September 2018
1SDET Project Plan
Evolvable open-access large-scale datasets to accelerate the development of next-generation power grid optimization.
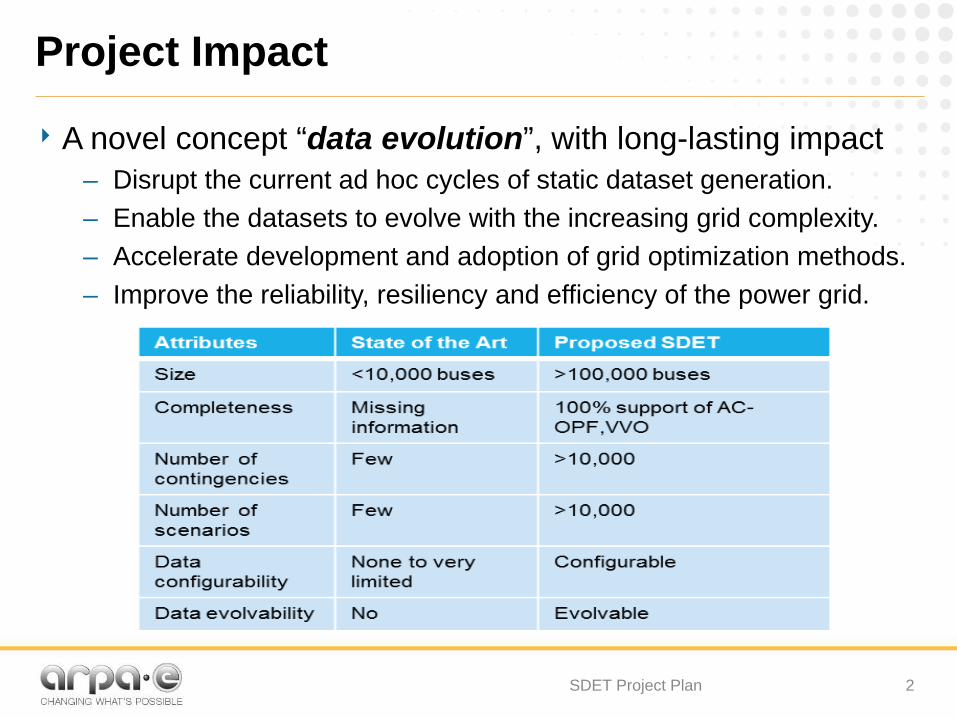
Project Impact
‣ A novel concept “data evolution”, with long-lasting impact – Disrupt the current ad hoc cycles of static dataset generation. – Enable the datasets to evolve with the increasing grid complexity.– Accelerate development and adoption of grid optimization methods.– Improve the reliability, resiliency and efficiency of the power grid.
2SDET Project Plan
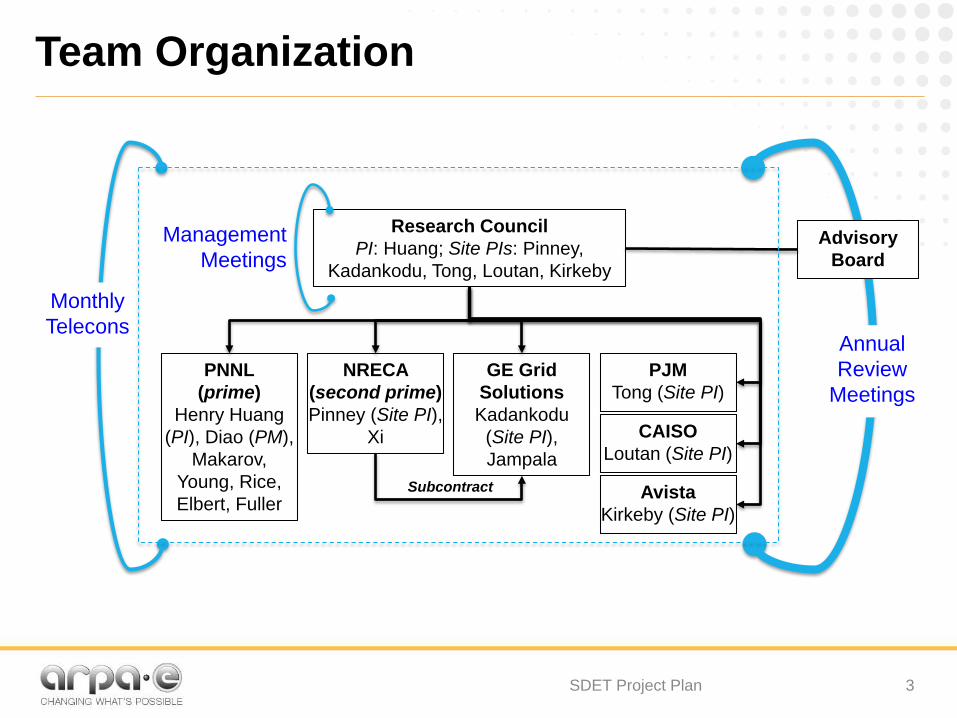
Team Organization
3SDET Project Plan
PNNL(prime)
Henry Huang (PI), Diao (PM),
Makarov, Young, Rice, Elbert, Fuller
NRECA (second prime)Pinney (Site PI),
Xi
GE Grid SolutionsKadankodu
(Site PI), Jampala
Advisory Board
Research CouncilPI: Huang; Site PIs: Pinney,
Kadankodu, Tong, Loutan, Kirkeby
Management Meetings
Monthly Telecons
Annual Review
Meetings
Subcontract
PJMTong (Site PI)
AvistaKirkeby (Site PI)
CAISOLoutan (Site PI)
Capabilities, Facilities, Equipment, Information
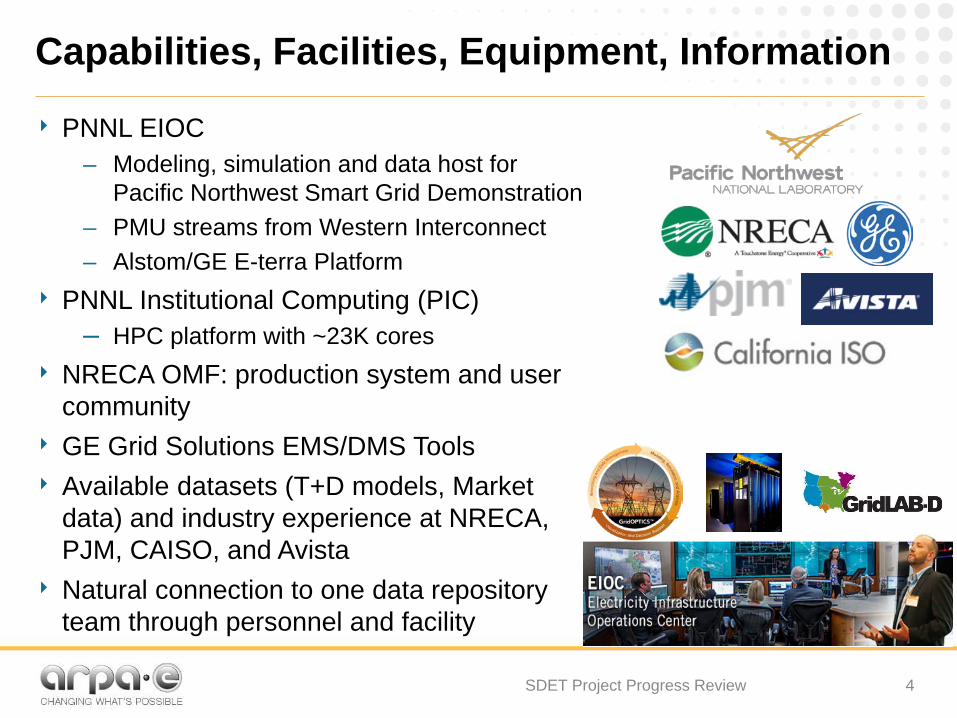
‣ PNNL EIOC– Modeling, simulation and data host for
Pacific Northwest Smart Grid Demonstration– PMU streams from Western Interconnect– Alstom/GE E-terra Platform
‣ PNNL Institutional Computing (PIC)– HPC platform with ~23K cores
‣ NRECA OMF: production system and user community
‣ GE Grid Solutions EMS/DMS Tools‣ Available datasets (T+D models, Market
data) and industry experience at NRECA, PJM, CAISO, and Avista
‣ Natural connection to one data repository team through personnel and facility
4SDET Project Progress Review
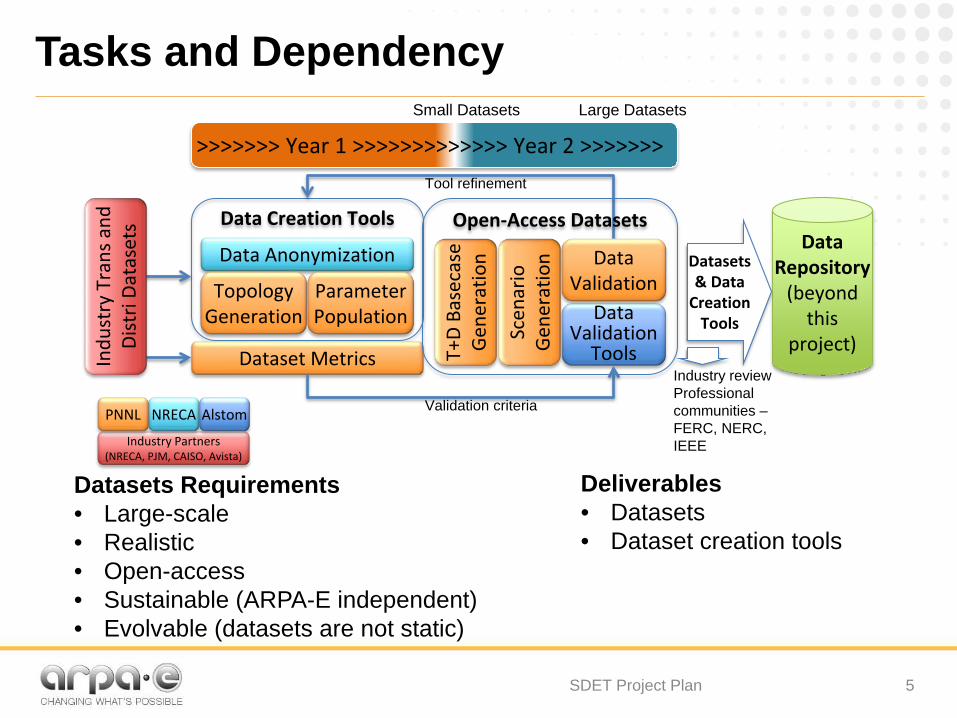
Data Creation Tools
Data Anonymization
Topology Generation
Parameter Population
Dataset Metrics T+D
Base
case
Ge
nera
tion
Scen
ario
Ge
nera
tion
Data Validation
Tools
Data Repository
(beyond this
project)
Indu
stry
Tra
ns a
nd
Dist
riDa
tase
ts Open-Access Datasets
Datasets & Data
Creation Tools
>>>>>>> Year 1 >>>>>>>>>>>>> Year 2 >>>>>>>
Small Datasets Large Datasets
Industry Partners (NRECA, PJM, CAISO, Avista)
NRECA AlstomPNNL
Data Validation
Industry reviewProfessional communities –FERC, NERC, IEEE
Validation criteria
Tool refinement
Tasks and Dependency
5
Datasets Requirements• Large-scale• Realistic• Open-access• Sustainable (ARPA-E independent)• Evolvable (datasets are not static)
Deliverables • Datasets • Dataset creation tools
SDET Project Plan
Proposed Technologies‣ Development of Data Creation Tools
– Develop metrics for topology, parameter, composition, consistency of real-world datasets
– Topology generation: graph theory based algorithms– Parameter population: deterministic and probabilistic
approaches– Data anonymization
‣ Generation and validation of open-access datasets– Base cases of small-scale and large-scale models– Time-series scenarios– Three-level validation: component, system and
application
6SDET Project Plan
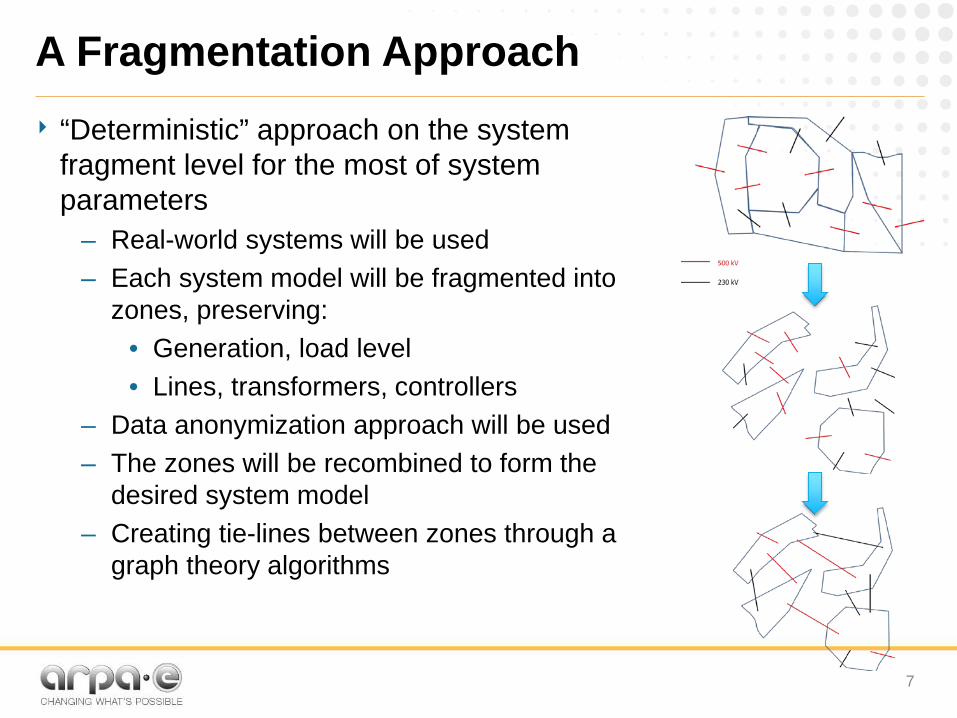
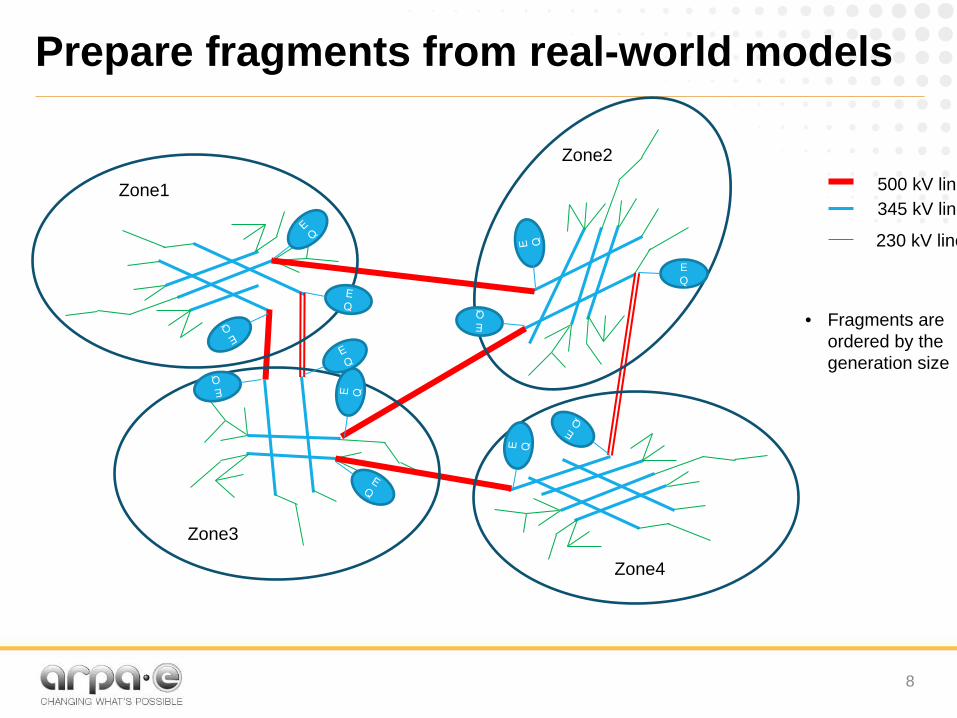
A Fragmentation Approach‣ “Deterministic” approach on the system
fragment level for the most of system parameters
– Real-world systems will be used– Each system model will be fragmented into
– Data anonymization approach will be used– The zones will be recombined to form the
desired system model– Creating tie-lines between zones through a
graph theory algorithms
7
Prepare fragments from real-world models
8
500 kV line345 kV line
230 kV line
Zone1
Zone2
Zone3
Zone4
EQ
• Fragments are ordered by the generation size
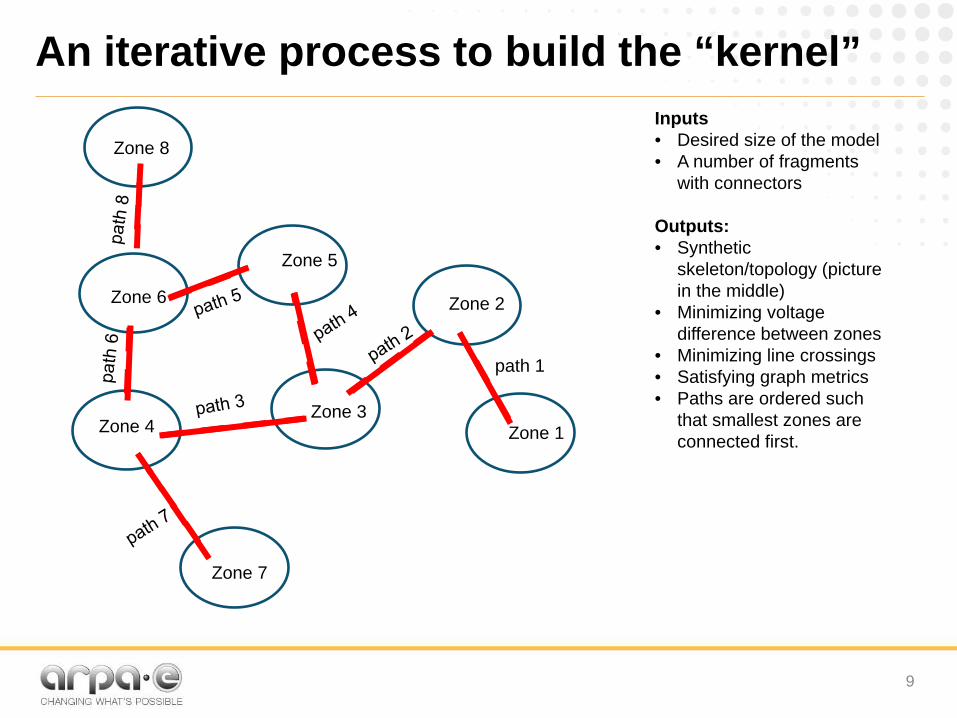
An iterative process to build the “kernel”
9
path 1
Zone 1
Zone 2
Zone 3Zone 4
Zone 5
Zone 6
Zone 7
Zone 8Inputs• Desired size of the model• A number of fragments
with connectors
Outputs:• Synthetic
skeleton/topology (picture in the middle)
• Minimizing voltage difference between zones
• Minimizing line crossings• Satisfying graph metrics• Paths are ordered such
that smallest zones are connected first.
Creating Key Grid Information
‣ A “probabilistic” approach for – Production cost/market bid data– Variable resources– Random factors added to the system load
‣ Distribution System Model Creation for VVO– Real-world feeder models and data will be collected– Applying a data anonymization approach
10
Metrics for measuring realism‣ Graph-theoretic metrics
– Degree distribution• The degree of a node is the number of connections it has to other nodes • Degree distribution is the probability distribution of these degrees over the whole
network– Average shortest path length
• A path between two vertices (or nodes) such that the sum of the weights (number of edges in a path) of its constituent edges is minimized
• Average number of branches between 2 buses– Diameter
• The longest shortest path between any pair of vertices• The max number of branches between 2 buses (is a function of system size)
– Average clustering coefficient• Ratio of actual edges between its neighbors to all possible edges• Clustering coefficient tells how well the graph nodes are connected with each other
‣ Power grid parameter metrics– Based on real-world characteristics, we will use the following typical statistical
measures: 1) Mean value; 2) Standard deviation (STD); 3) Min value, and 4) Max value
11
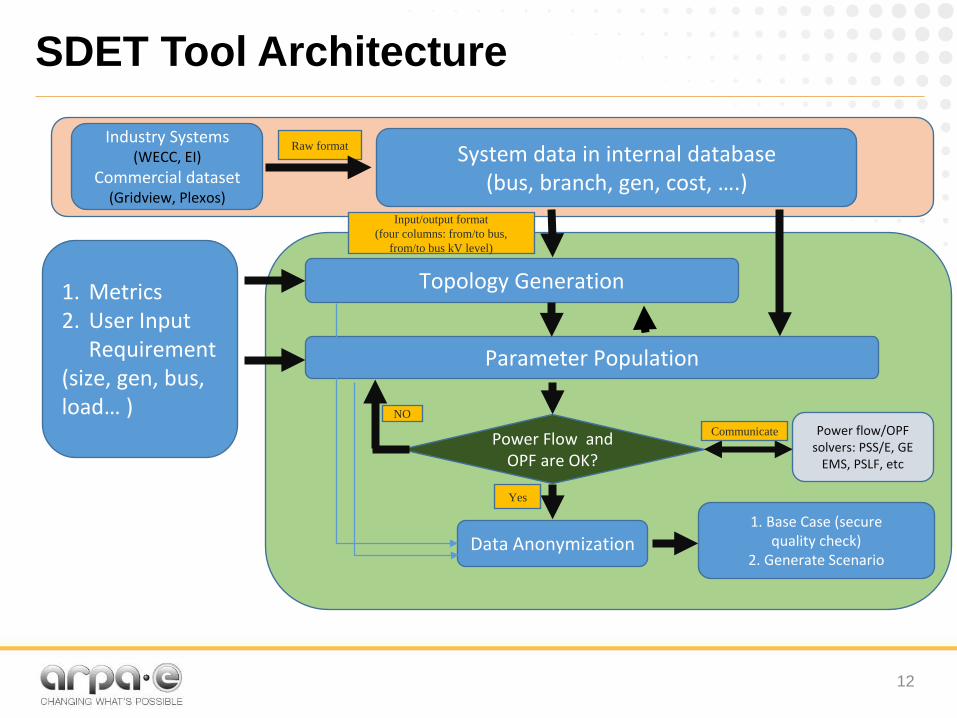
SDET Tool Architecture
12
Raw formatIndustry Systems(WECC, EI)
Commercial dataset (Gridview, Plexos)
System data in internal database (bus, branch, gen, cost, ….)
Topology Generation
Parameter Population
Data Anonymization
1. Metrics 2. User Input
Requirement(size, gen, bus, load… )
Power flow/OPF solvers: PSS/E, GE
EMS, PSLF, etc
1. Base Case (securequality check)
2. Generate Scenario
Input/output format(four columns: from/to bus,
from/to bus kV level)
Power Flow and OPF are OK?
NO
Yes
Communicate
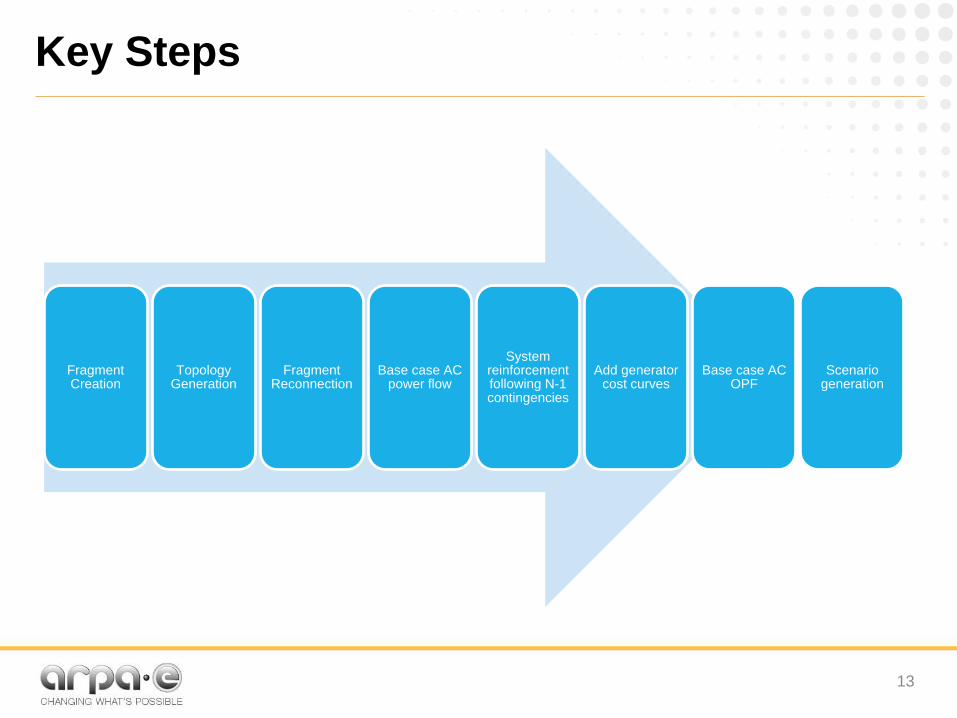
Key Steps
13
Fragment Creation
Topology Generation
Fragment Reconnection
Base case AC power flow
System reinforcement following N-1 contingencies
Add generator cost curves
Base case AC OPF
Scenario generation
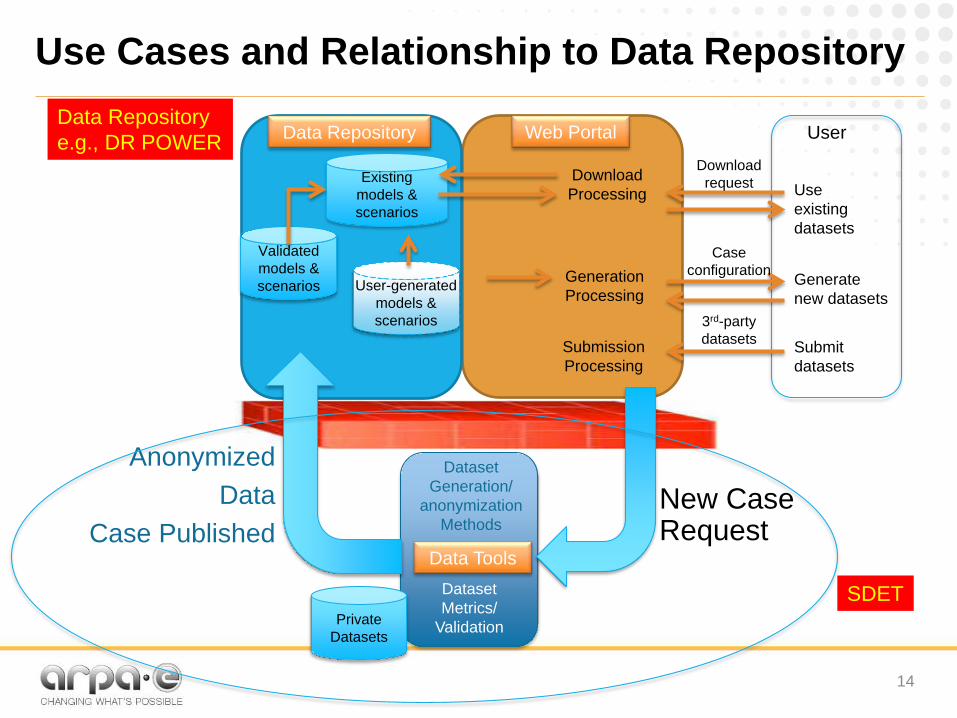
Use Cases and Relationship to Data Repository
14
New Case Request
Data Tools
Web PortalData Repository
Download Processing
Generation Processing
User
Use existing datasets
Generate new datasets
Submit datasets
Submission Processing
Validated models & scenarios User-generated
models & scenarios
Existing models & scenarios
Dataset Generation/
anonymization Methods
Dataset Metrics/
Validation
Download request
Case configuration
3rd-party datasets
Private Datasets
Data Repositorye.g., DR POWER
AnonymizedData
Case Published
SDET
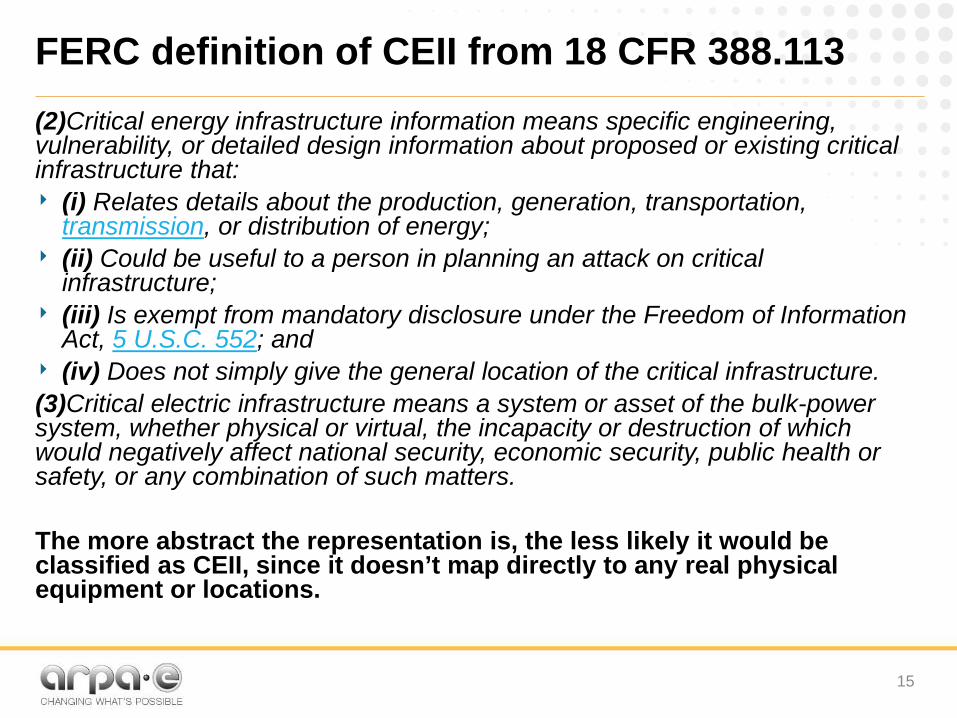
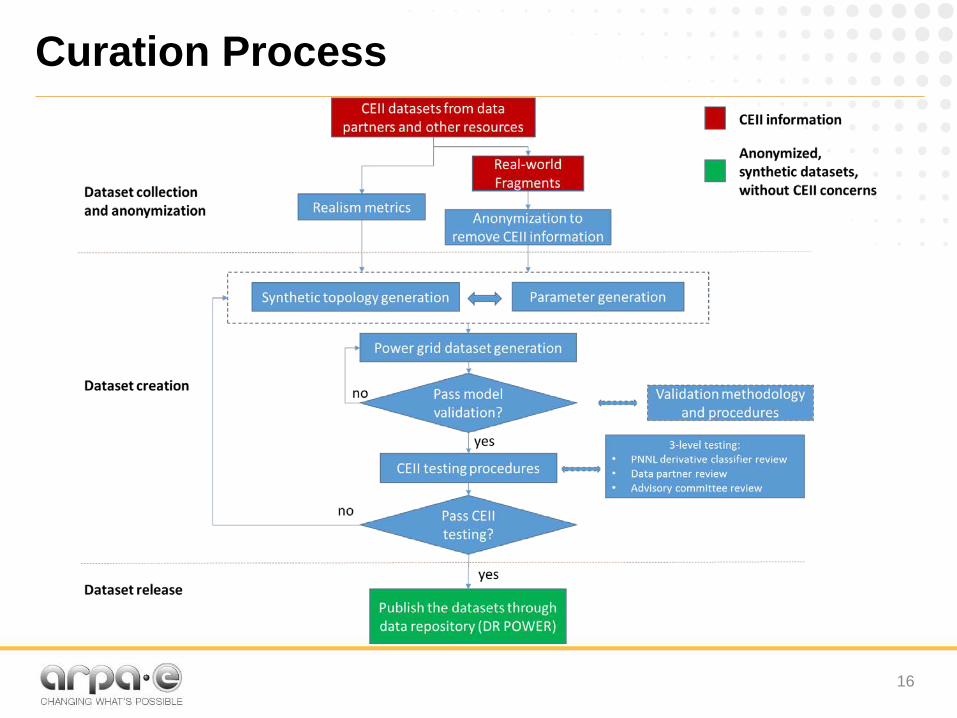
FERC definition of CEII from 18 CFR 388.113(2)Critical energy infrastructure information means specific engineering, vulnerability, or detailed design information about proposed or existing critical infrastructure that: ‣ (i) Relates details about the production, generation, transportation,
transmission, or distribution of energy; ‣ (ii) Could be useful to a person in planning an attack on critical
infrastructure; ‣ (iii) Is exempt from mandatory disclosure under the Freedom of Information
Act, 5 U.S.C. 552; and ‣ (iv) Does not simply give the general location of the critical infrastructure. (3)Critical electric infrastructure means a system or asset of the bulk-power system, whether physical or virtual, the incapacity or destruction of which would negatively affect national security, economic security, public health or safety, or any combination of such matters.
The more abstract the representation is, the less likely it would be classified as CEII, since it doesn’t map directly to any real physical equipment or locations.
– SDET framework in C++– PTI file parser, v33– Fragment creation code in python– Topology creation code– Fragment reconnection– Validation module through PSSE– Creation of the generator cost curves
‣ A few power system models with ~500 buses– Good convergence– Meeting metrics requirements
‣ A few power system models with ~3000 buses– Good convergence– Meeting metrics requirements
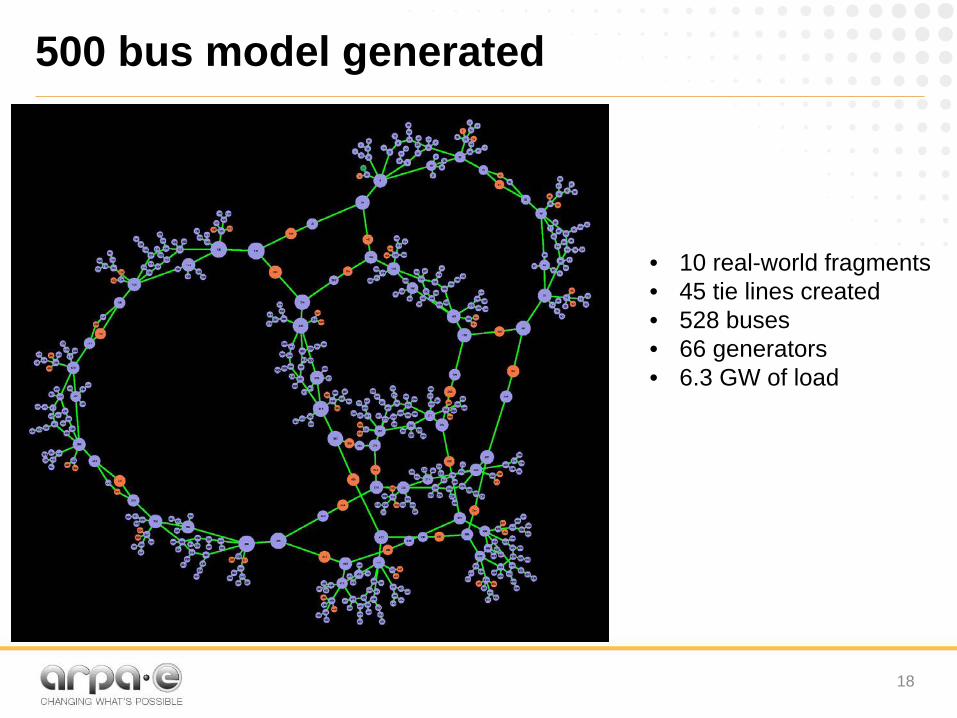
500 bus model generated
18
• 10 real-world fragments• 45 tie lines created• 528 buses• 66 generators• 6.3 GW of load
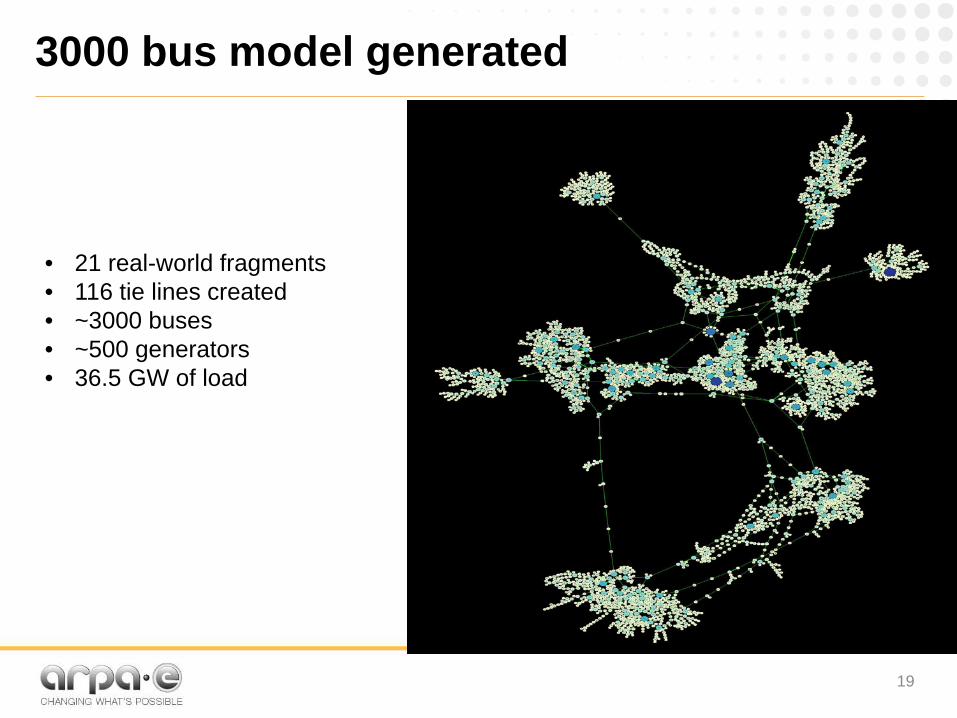
3000 bus model generated
19
• 21 real-world fragments• 116 tie lines created• ~3000 buses• ~500 generators• 36.5 GW of load
Technology to Market and Outreach‣ T2M Strategy
– Expected products: datasets and data tools– Transition facilities: EIOC and PIC– Training and workshops– Tool adoption: offer datasets and tools to GRID DATA
data repository– Community engagement: e.g. IEEE PES, PSERC,
CURENT, FERC, Power Globe, power industry, etc.‣ Intellectual Property
– New software tools to be generated, protected by BSD-style open-source licenses
– Potential patents
20SDET Project Plan
Conclusions
‣ Making datasets evolving is important to keep up with grid development and enable technology advancement
‣ Delivering datasets is important, but delivering data creation tools can enable data evolution
– Topology generation tool– Parameter population tool– Data anonymization tool
‣ Datasets and data creation tools are to be shared through GRID DATA repositories and professional communities