Page 1
Sustaining Small and Medium Enterprises through Financial Service Utilization: Does
Financial Literacy Matter?
Jacob Nunoo
Department of Economics, University of Cape Coast, Ghana
[email protected]
and
Francis Kwaw Andoh,
Department of Economics, University of Cape Coast, Ghana
[email protected]
Selected Paper prepared for presentation at the Agricultural & Applied
Economics Association’s 2012 AAEA Annual Meeting, Seattle, Washington,
August 12-14, 2012.
Copyright 2012 by Nunoo, Jacob and Andoh, Francis Kwaw. All rights reserved. Readers may
make verbatim copies of this document for non-commercial purposes by any means, provided
this copyright notice appears on all such copies.
Page 2
ABSTRACT
Promoting a dynamic operating environment for Small Medium scale enterprises (SMEs) is seen
as a priority amongst economic development goals, in both developed and emerging economies.
SMEs are a primary driver for job creation and GDP growth. They greatly contribute to
economic diversification and social stability and they play an important role for private sector
development.
It must be emphasized, that the utilization of these financial products does not only promote the
growth of the SMEs themselves but also their active participation in the financial services market
leads to financial development which is widely recognized as an important determinant of
economic growth and also recognized as important for enhancing the social and economic
impact of the financial sector.
In the past, SMEs, particularly, in developing countries, lacked access to financial products and
services. The SME market was perceived by banks as risky, costly, and difficult to serve.
However, with the advances in information and communications technology, the cost differential
of serving poor customers has fallen and banks now perceive significant opportunities in the
SME sector. Survey data from multiple studies show that banks have begun to target SMEs as a
profitable segment. For example, a recent survey of 91 banks in 45developed and developing
countries – Bank Financing for SMEs around the World – found that these banks
overwhelmingly perceived the SME sector as a large market with good prospects. There exists
an array of financial products - microcredit, savings, and loans, insurance, mutual funds, etc. – in
both the formal and informal sectors in Ghana. Opportunities to utilize these financial services
are now plentiful than about a decade ago. However, available studies have shown that about
44% of Ghanaians are financially excluded and have/use no financial products. This paper uses a
direct measure of financial knowledge to empirically investigate the linkage between financial
literacy and utilization of financial services by SMEs. However, since people’s level of
knowledge can improve through utilization of financial service, we establish a bi-causality
problem. In the analysis, two equations were estimated: (1) financial literacy level, and (2)
utilization of financial service which includes financial literacy as an endogenous variable. The
equation determining the level of financial literacy was estimated using the OLS while the
equation for the utilisation of financial service was estimated using logistic regression. The IV
method was used to correct for the problem of endogeneity.
Page 3
Overall, the results show that there was modest level of financial literacy among small and
medium entrepreneurs in Ghana. Moreover, it was discovered that the better and more
financially literate entrepreneurs were more likely to utilize financial service. The most
commonly utilized financial service was operating a bank account. This has important policy
implication. Finally, the instrument for financial literacy, recipient of financial education, also
had positive relationship with utilization of financial service.
Introduction/background
In both developed and emerging economies, promoting a favourable environment for the
development of Small and Medium scale enterprises (SMEs) is seen as critical. SMEs are a
primary driver for job creation and GDP growth. They greatly contribute to economic
diversification and social stability and also play an important role for private sector development.
In Ghana, the SME sector is recognized as one of the key sectors in the economy which has the
potential of helping achieve the ‘Stimulating and Growth for Development and Job Creation’
agenda of the government. Most businesses in Ghana fall within the category of micro, small and
medium enterprises, with the potential of employing close to 70 percent of the Ghanaian labour
force. SMEs, thus, can be said to be the linchpin in efforts towards socio-economic development
and the attainment of the millennium development goals (MDGs) especially in developing
economies such as Ghana. Despite these benefits, the tremendous potentials of SMEs have not
been fully realized.
In the past, the problems of SMEs, particularly, in developing countries, was blamed on lacked
access to financial products and services. This phenomenon led to an extensive research on the
supply of funds with substantial attention on bottle necks constraining the supply of banking and
financial services. The results of most of these research revealed that, the SME market was
perceived by banks and financial institution as risky, costly, and difficult to serve ( see? ).
With the advances in information and communication technology, the cost differential of serving
poor customers has fallen (United Nations, 2006) and financial institutions now perceive
significant opportunities in the SME sector. Survey data from multiple studies show that banks
have begun to target SMEs as a profitable segment. For example, a recent survey of 91 banks in
45 developed and developing countries – Bank Financing for SMEs around the World – found
Page 4
that these banks overwhelmingly perceived the SME sector as a large market with good
prospects (Beck, Demirgüç-Kunt, and Pería, 2008). Following the changing perception about the
SME sector, several products and services being developed by both existing and newly
established financial institutions are mostly designed to meet the needs of SMEs. The evidence
that several informal savings, credit, and insurance markets have emerged and functioning
reasonably well in emerging markets (see for example, Besley, Coate, and Loury (1993), and
Townsend (1994) prove the point that the availability (supply) of financial services is really not
the issue now. Opportunities to utilize these financial services are now plentiful than about a
decade ago.
If supply is not a problem then what explains SMEs lack of finance? We argue that, to
completely deal with this issue, the intricacies of the determinants of the demand for a financial
service by SMEs should be much well understood especially in developing countries.
One trend that emerges from the literature concerning low utilization of financial services as well
as lack of participation in the financial market by both household and firms is the role of
financial literacy. Existing studies indicate that financial illiteracy is widespread and people lack
knowledge of even the most basic economic principles (Lusardi and Mitchell (2006, 2007a,b),
National Council on Economic Education (NCEE, 2005), and Hilgert and Hogarth (2002).
Findings of widespread illiteracy are also reported in studies on smaller samples or specific
groups of the population (Agnew and Szykman (2005), Bernheim (1995, 1998), Mandell (2004),
and Moore (2003)). Lusardi and Mitchell (2006) found that financial illiteracy is widespread and
is particularly acute among specific groups of the population, such as women, the elderly, and
those with low education. Agarwal, Driscoll, Gabaix and Laibson (2007) further show that
financial mistakes are prevalent among the young and the elderly, who display the lowest level
of financial knowledge and cognitive ability. Again a study by the OECD (2005) and the work
by Lusardi and Mitchell (2007b) which review the evidence on financial literacy across countries
show that financial illiteracy is a common feature in many other developed countries, including
European countries, Australia, and Japan. These findings are confirmed in the work of Christelis,
Jappelli and Padula (2006), which uses micro data from European countries finds that most
respondents in Europe score low on financial numeracy and literacy scales.
Page 5
Given the increased complexity of day-to-day financial transactions, the evidence of illiteracy
does not only raise important questions for policy but also has implications for household and
firm financial behaviour. Bernheim (1995, 1998) point out that most households cannot perform
very simple calculations and thus lack the basic financial knowledge. He also observed that the
saving behaviour of these households is dominated by crude rules of thumb. Abubakr (2009)
observedthat firm’s financial resource endowment is a vital determinant of firm growth and that
firm’s inability to meet financial demands is mainly caused by market imperfection that triggers
due to information asymmetry.
Consequently, financial literacy has attracted increasing attention in both the developed and
developing world due to its role in financial decison. For example, in January 2008, the United
States government set up a President’s Advisory Council on Financial Literacy. The council was
tasked to promote programmes that would improve financial education at all levels of the
economy. This was to improve access to and utilisation of financial services. In the developing
world, the Indonesian government declared 2008 as “the year of financial education” with a
stated goal of improving access to and use of financial services by increasing financial literacy.
Similarly, in India, the Reserve Bank of India launched an initiative in 2007 to establish
Financial Literacy and Credit Counselling Centres throughout the country which would offer free
financial education and counselling to urban and rural populations. In Ghana, the financial
literacy week celebrated each year proves the recognition the government of Ghana accords
financial literacy. The critical questions that need to be answered are: Do owners of SMEs posses
enough level of financial literacy? Does the level of financial literacy significantly esxplain their
demand for financial service?
While many studies have provided documentary evidence suggesting that financial literacy
education is effective, there is surprisingly little rigorous, academic evidence. With the exception
of Cole, Sampson, and Zia (2009), which used two surveys from two of the most populous
countries in the world (Indonesia and India), to show that financial literacy is an important
predictor of financial behaviour in the developing world, we are aware of no completed study
testing the significance of financial literacy in utilising basic financial services particularly in
sub-Saharan Africa and for that matter Ghana. This paper aspires to fill in this gap by providing
Page 6
an empirical analysis of the relationship between financial literacy and utilization of available
financial services by SMEs in Ghana. Specifically, the paper empirically identifies the channels
through which financial knowledge translate into financial decision making. In this way the
paper contributes to the literature by analyzing the role of financial literacy in addressing the
problem of voluntary financial exclusion of small businesses in Ghana. In some ways, our
analysis takes a different perspective from previous research. Unlike previous studies which
concentrated on households and individuals, this study focus on SMEs.
Moreover, our work improves substantially upon previous studies by recognizing the problem of
endogeneity which has not been adequately addressed. Up to date, few studies have addressed
the issue of endogeneity in a convincing manner. Utilize financial service may increase their
financial knowledge through experience. This potential reverse causality create endogeneity
problem.
We also consider the study to be ingenious because it is the first of its kind in Ghana. In this
study, we overcome the shortcomings of some of the previous studies by expanding the measures
of financial literacy. For example, Lusardi and Mitchell (2006, 2007a) rely on only three
questions to measure financial literacy, while Stango and Zinman (2006) rely on one question.
We use five questions.
Objectives
The main objective of this paper is to examine the relationship between financial literacy and
financial decision of SMEs in Ghana.
1. To measure the level of financial literacy of SMEs in Ghana
2. Identify the correlates of financial literacy
3. To estimate the relationship between financial literacy and utilization of financial
services by SMEs
Literature Review
Page 7
Lusardi Households with low levels of financial literacy are unable to make wise financial
decisions (Lusardi and Mitchell, 2007a) and participate less in the formal financial system
relative to their more financially-literate counterparts (Alessie, Lusardi and van Rooij (2007);
Hogarth and O’Donnell (1999).
Hastings and Tejeda-Ashton(2008) examined the links between investor characteristics such as
financial literacy, information format, and investment choice using data collected from a survey
and field experiment in Mexico’s privatized social security system. They found that while many
participants in the system were well informed about their choices, few had experience investing
in financial assets such as stocks, bonds, or mutual funds outside of their mandatory savings and
retirement account. In addition, they showed that financial literate respondents placed much
higher importance on fees relative to brand name when selecting funds.
Testing the theories of low demand for financial services in emerging markets, Cole, Sampson
and Zia(2009) combined novel survey evidence from Indonesia and India with a field experiment
and found a strong correlation between financial literacy and behaviour. However, a financial
education program had a modest effect, increasing demand for bank accounts only for those with
limited education or financial literacy. The study also demonstrated that prices matter both for
opening of bank accounts and for savings, and that, individuals who opened bank accounts in
response to incentives tended to keep them open for the long term.
Rooij, Bank and Lusardi (2007) show that one important determinant of stock market
participation that needs to be incorporated in our theoretical and empirical work is financial
literacy. Lack of understanding of economics and finance is a significant deterrent to stock
ownership.Other variables that have been found to influence financial service utilization are
income, as well as education (Bertaut and Starr-McCluer, 2001)
Lusardi and Mitchell (2006, 2007a) reveal that those who display low literacy are less likely to
plan for retirement and also accumulate much less wealth. It also find that among older adults,
Page 8
those who displayed better financial knowledge were more likely to plan, to succeed in planning,
and to invest in complex assets.
(see also Hilgert, Hogarth and Beverly (2003)..
Hilgert, Hogarth and Beverley (2003) find that individuals with more financial knowledge are
more likely to engage in a wide range of recommended financial practices, while Lusardi and
Mitchell (2006, 2007a). Similarly, Stango and Zinman (2007) show that those who are not able
to correctly calculate interest rates out of a stream of payments end up borrowing more and
accumulating lower amounts of wealth while Bayer et al., (1996) and Bernheim (2003) suggest
that workplace financial education initiatives increased participation in savings plans (), while
financial education mandates in high school significantly increased adult propensity to save.
Defining Accessibility and Utilisation
Access to finance and use of financial services do not mean the same thing. Whereas “access”
refers to the availability of a supply of reasonable quality financial services, “use” refers to the
actual consumption of financial services. In a standard demand–supply framework, it can be said
that access refers to supply, whereas use is the intersection of the supply and demand schedules.
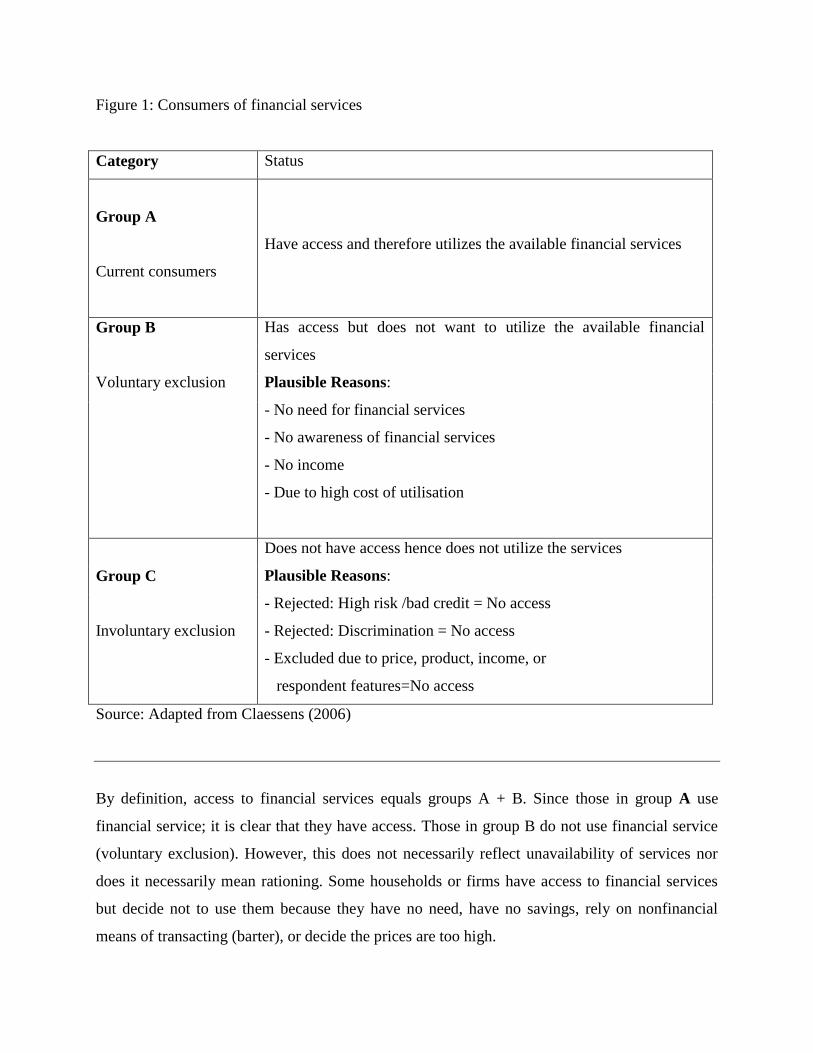
Based on Claessens’ conceptualization, illustrated in Figure 1, consumers of financial services
can be categorized into three: those who have access and therefore use the service (let’s call them
Group A), those have access but do not use (voluntary exclusion) (we call group B), and a third
group; those that have no access and thus do not use financial service (involuntary exclusion),
(group C).
Page 9
Figure 1: Consumers of financial services
Category Status
Group A
Current consumers
Have access and therefore utilizes the available financial services
Group B
Voluntary exclusion
Has access but does not want to utilize the available financial
services
Plausible Reasons:
- No need for financial services
- No awareness of financial services
- No income
- Due to high cost of utilisation
Group C
Involuntary exclusion
Does not have access hence does not utilize the services
Plausible Reasons:
- Rejected: High risk /bad credit = No access
- Rejected: Discrimination = No access
- Excluded due to price, product, income, or
respondent features=No access
Source: Adapted from Claessens (2006)
By definition, access to financial services equals groups A + B. Since those in group A use
financial service; it is clear that they have access. Those in group B do not use financial service
(voluntary exclusion). However, this does not necessarily reflect unavailability of services nor
does it necessarily mean rationing. Some households or firms have access to financial services
but decide not to use them because they have no need, have no savings, rely on nonfinancial
means of transacting (barter), or decide the prices are too high.
Page 10
METHODOLOGY
Theoretical Framework
Based on the life cycle hypothesis (See Ando & Modigliani ,1963) economic agents derive
utility from consumption/savings over their lifetime. In the simplest format, the consumer has a
lifetime expected utility, which is the expected value of the sum of per-period utility discounted
to the present from the consumer’s current age to his/her oldest attainable age. Assets and
consumption in each period are determined endogenously by maximizing this utility function
subject to an intertemporal budget constraint, which represents the present discounted value of
future resources. In this basic formulation of the saving decision, the actual requirements for
making saving decisions are demanding: economic agents should be assumed to have
information and make forecasts about many variables such as rates of interest, investment
returns, incomes and projected inflation. The economic agent uses that information to formulate
and execute optimal consumption/saving plans. Moreover, they have to perform calculations that
require, at minimum, an understanding of compound interest and the time value of money.
Decisions about how much to accumulate and how much to borrow to be able to smooth
consumption over the life-cycle also require an understanding of the working of interest rates.
Borrowing can be envisioned as a two-step process. The decision of whether or not to borrow is
the first step in that process. Once a decision is made to borrow, the next step is to decide how
much to borrow, taking the cost of borrowing into consideration.
Analysis of the borrowing decision is complicated by the need to both have and understand
credit market information. Difficulties can arise when this information is complex, incomplete,
or otherwise not sufficient for making effective market decisions. Economic decision-making
theory underscores the importance of product knowledge in making effective consumer choices.
Aryeetey, Baah-Nuako, Duggbeby, Hettige and Steel (1994), has shown that the desire for
financial service may only remain a potential demand because it cannot be actualized due to
market imperfection arising from information asymmetry. This underscores the fact that
information is critical in demand for financial service. Theoretically, we posit that greater
financial knowledge should enhance understanding of all costs and benefits associated with using
Page 11
financial service; whereas, a lack of knowledge of financial markets and instruments makes it
difficult to judge actual costs and benefits.
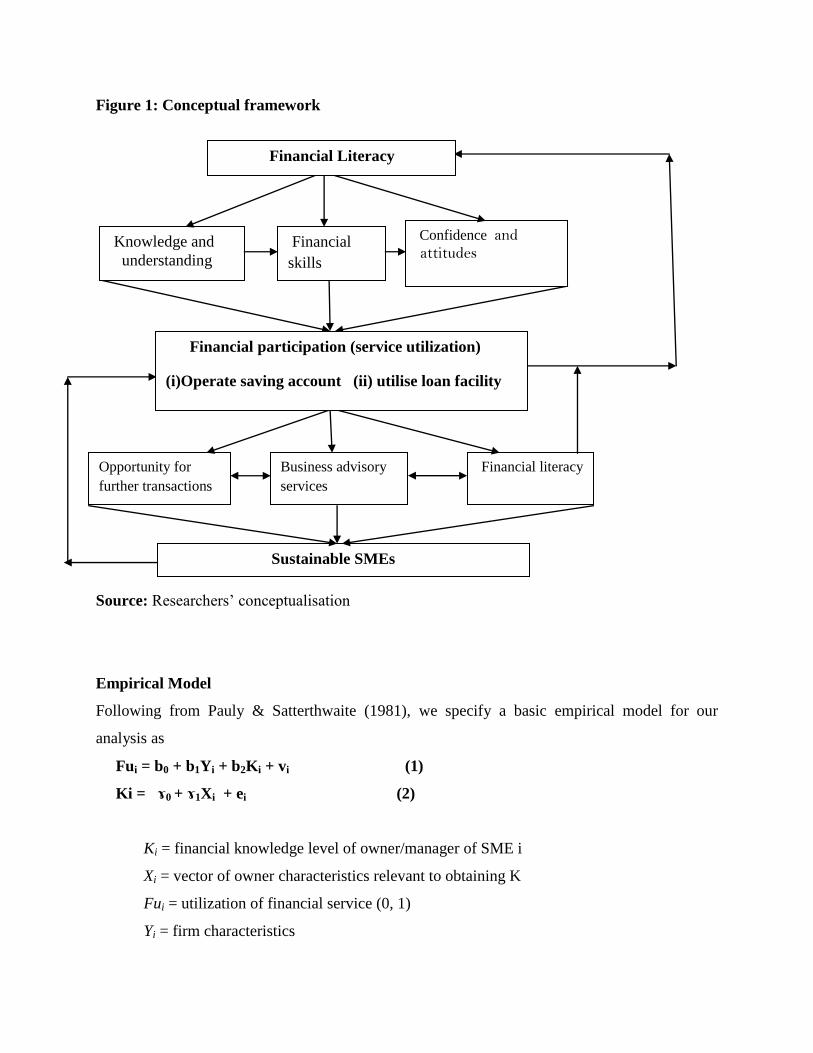
The framework below illustrates how we conceptualise the link between financial literacy and
sustainability of SMEs. From the adopted definition of financial literacy, which is the
knowledge of basic economic and financial concepts, as well as the ability to use that knowledge
and other financial skills to manage financial resources effectively for a lifetime of financial
well-being, we see that financial knowledge, financial skills and financial confidence represents
particularly basic forms of financial literacy. Financial knowledge, in turn, is reflected in
perceived financial knowledge and influences financial skills. Knowledge of how financial
systems works is an important underpinning for financial skills (e.g., negotiating terms,
navigating low cost facilities). Growth in knowledge increases the confidence of the economic
agent. Parker, Yoong, Bruine de Bruin, and Willis (2008) found that confidence in knowledge
predicts self reported retirement planning and savings. On the third level we see that financial
knowledge, skills and confidence culminate into financial behaviour (e.g., operating saving
account and utilizing microcredit facility). We also see that the experience gained through
financial behaviour feeds back to financial literacy through improvement in knowledge, skills
and confidence. Downwards on the framework, we reason that as firms and individuals
participate in the financial market and continue to utilize financial services, they create the
opportunity for further business transaction with the financial institution which increases access
to finance by SMEs. Moreover, SMEs can benefit from business advisory services once they
operate savings account or utilizes loan facilities with financial institutions. This may include
proper bookkeeping etc. Besides, as SMEs and financial institutions continue to relate, it
provides an opportunity for both to know more about the operations of each partner. This
knowledge will help SMEs to explore all the benefits from the financial institution which will
consequently build up healthy SME.
Page 12
Figure 1: Conceptual framework
Source: Researchers’ conceptualisation
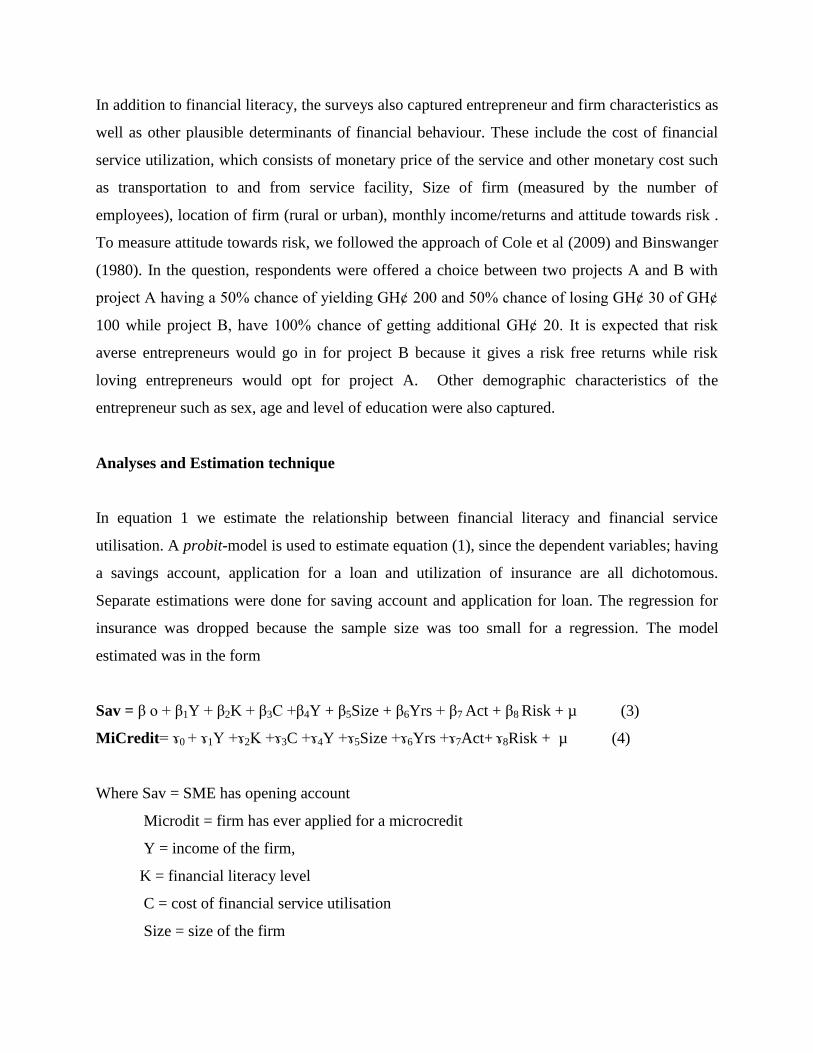
Empirical Model
Following from Pauly & Satterthwaite (1981), we specify a basic empirical model for our
analysis as
Fui = b0 + b1Yi + b2Ki + vi (1)
Ki = ɤ0 + ɤ1Xi + ei (2)
Ki = financial knowledge level of owner/manager of SME i
Xi = vector of owner characteristics relevant to obtaining K
Fui = utilization of financial service (0, 1)
Yi = firm characteristics
Sustainable SMEs
Opportunity for
further transactions
Financial literacy
Business advisory
services
Financial participation (service utilization)
(i)Operate saving account (ii) utilise loan facility
Confidence and attitudes
Knowledge and
understanding
Financial
skills
Financial Literacy
Page 13
vi and ei = random error terms
Equations 1 and 2 provide reduced form expression for utilization of financial services and
financial literacy
Variables
The dependent variable for the study is utilization of financial service. Demand for three basic
financial products was used as proxy for financial service utilization. These are savings
accounts, microcredit and insurance. All three were dichotomous variables taking the value 1 if
the individual participated in the outcome of interest and 0 if otherwise. Saving account allows
SMEs to deposit money at any time and it also provides an opportunity for further transaction
between SME and financial institution. SMEs were asked whether they had at least a saving
account with any financial institution. The question demanded yes or no for an answer. As a
follow up to this question, respondents were asked to state the reason for opening an account
with a financial institution. Two questions were asked on microcredit. First, respondents were
asked whether or not they had applied for any loan from any financial institution. Second, they
were asked to indicate the number of times they had applied for loan. Both were used in the
estimation. Since the main interest of the study was utilization, we did not find out whether
SMEs were successful in acquiring the loans applied for. The third proxy was the demand for
insurance. The respondents were asked if they had bought any formal insurance for their
businesses. To better understand barriers to use of financial service, respondents were asked
whether they would buy if cost of utilization was a barrier to utilization. Separate estimations
were done for each of the proxy.
Our major variable of interest is entrepreneurs’ level of financial literacy. Unfortunately, a
universally accepted measurement scale for financial literacy has not been developed yet (for an
overview see OECD, 2005). Thus, researchers usually construct their own scale. Following the
approach of Choi et al. (2006) and Kimball and Shumway (2006) which was also employed by
MÄuller and Weber (2008) and Lusardi and Mitchell (2007), we construct an aggregate financial
literacy score based on 5 quiz-like statements. SME entrepreneurs were asked to choose a correct
answer from at least two options. The questions covered knowledge on interest rates, inflation,
savings and insurance. The score of each respondent was used to generate a financial literacy
index, which was used in additional analysis.
Page 14
In addition to financial literacy, the surveys also captured entrepreneur and firm characteristics as
well as other plausible determinants of financial behaviour. These include the cost of financial
service utilization, which consists of monetary price of the service and other monetary cost such
as transportation to and from service facility, Size of firm (measured by the number of
employees), location of firm (rural or urban), monthly income/returns and attitude towards risk .
To measure attitude towards risk, we followed the approach of Cole et al (2009) and Binswanger
(1980). In the question, respondents were offered a choice between two projects A and B with
project A having a 50% chance of yielding GHȼ 200 and 50% chance of losing GHȼ 30 of GHȼ
100 while project B, have 100% chance of getting additional GHȼ 20. It is expected that risk
averse entrepreneurs would go in for project B because it gives a risk free returns while risk
loving entrepreneurs would opt for project A. Other demographic characteristics of the
entrepreneur such as sex, age and level of education were also captured.
Analyses and Estimation technique
In equation 1 we estimate the relationship between financial literacy and financial service
utilisation. A probit-model is used to estimate equation (1), since the dependent variables; having
a savings account, application for a loan and utilization of insurance are all dichotomous.
Separate estimations were done for saving account and application for loan. The regression for
insurance was dropped because the sample size was too small for a regression. The model
estimated was in the form
Sav = β o + β1Y + β2K + β3C +β4Y + β5Size + β6Yrs + β7 Act + β8 Risk + µ (3)
MiCredit= ɤ0 + ɤ1Y +ɤ2K +ɤ3C +ɤ4Y +ɤ5Size +ɤ6Yrs +ɤ7Act+ ɤ8Risk + µ (4)
Where Sav = SME has opening account
Microdit = firm has ever applied for a microcredit
Y = income of the firm,
K = financial literacy level
C = cost of financial service utilisation
Size = size of the firm
Page 15
Yrs = years of operation
Act = nature of economic activity
Risk = whether or not the entrepreneur is a risk averse
Equation 3 specifies the equation for whether or not SME has a saving account while equation 4
expresses the equation for microcredit.
We also estimate equation 2 using OLS. Here we regress financial literacy on the owner
characteristics. The variables included in the model are the level of education of the owner, the
age of the owner, the number of times he has received financial education, and sex of owner.
While it is accepted that the level of financial literacy influences participation in financial market
(specifically, the decisions to open account, apply for loan facility) we also recognise that
utilization of these financial services can improve financial knowledge. Due to this bi-
directionality of the effect, we consider the issue of endogeneity of financial literacy. In order to
address the endogeneity we used a two-stage probit regression model proposed by Maddala
(1983). In the first stage, ordinary least squares regression was used to predict the financial
literacy variable as a function of instruments and the exogenous variables of the main equation.
In the second stage, the predicted value from the first-stage regression replaced the financial
literacy variable in the main probit regression. In order to obtain asymptotically correct standard
errors, we used a strategy similar to the strategy used by Case and Katz (1991) and Gaviria and
Raphael (2001). Level of education of SME owner and the number of times he/she received
financial education were used as instruments. Level of education and number of times he/she
received financial education would not directly influence the decision to open an account and
apply for a loan, but have an indirect effect.
Data and Survey Design
In Ghana, the most important criterion used to classify business is the size of the workforce
(Boon, 1989). The ministry of local Government and Rural Development considers any
establishment that employs 1 to 9 people as small-scale enterprise, 10 -20 as medium scale and
Page 16
above 20 as large scale enterprises. For the purpose of this study, we adopted this definition. The
data for the study was mainly primary. Data was collected from 556 SMEs selected randomly
from four districts in the Greater Accra Region of Ghana. The districts were selected by
employing simple random sampling. Two of the district was predominantly urban, one was
predominantly rural while one was both rural and urban. All the selected SMEs were registered
with the National Board for Small Scale industries (NBSSI). The sampled size was obtained by
randomly selecting from the list obtained from the NBSSI. Interviews were conducted with all
the owners/managers of the selected SMEs. In order to ensure that respondents did not
collaborate with other people to provide responses especially for the questions that measured the
financial literacy levels, interviewers did not leave any survey with any respondent.
Validation of research instruments
The questionnaire was pretested with 35 respondents after which modifications were made for
final survey. Moreover, the questionnaires were given to two experts for review and suggestions.
The quality and consistency of the survey was also assessed using Cronbach’s alpha. The
reliability test conducted gave a large Cronbach alpha of 0.81.
RESULTS
Descriptive statistics on Firm and Owner Characteristics of SMEs
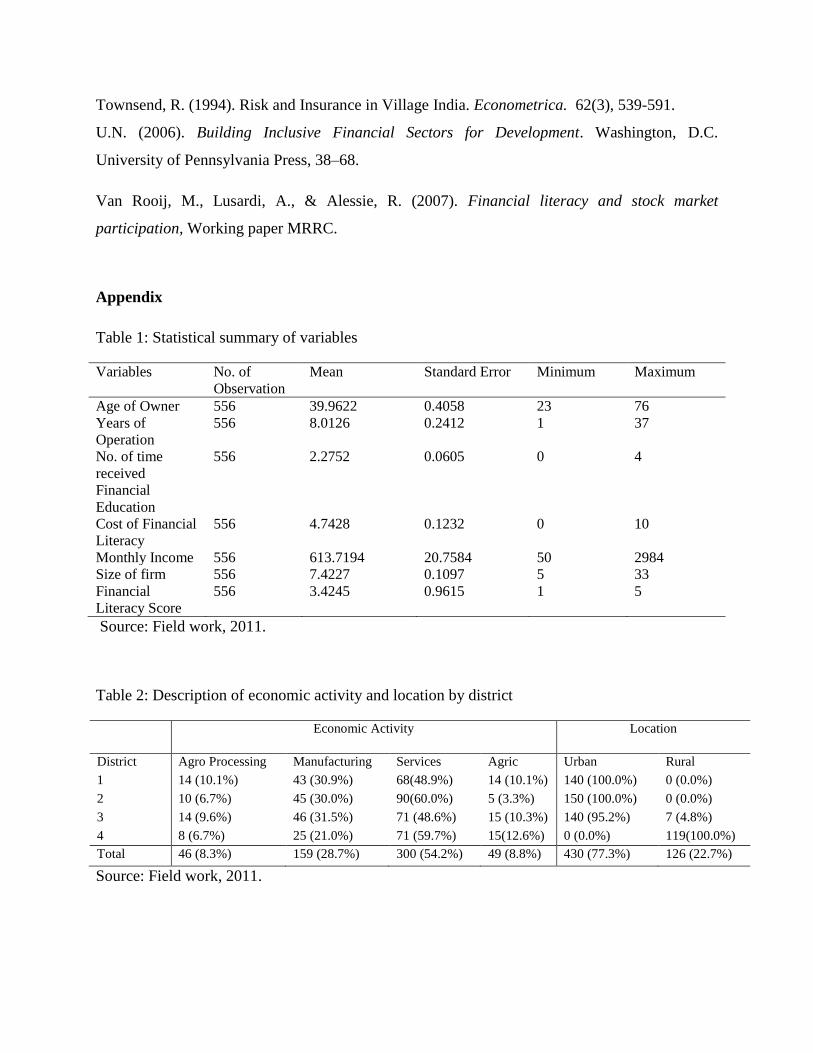
The means, standard errors and the maximum and minimum figures for the continuous variables
are reported in Table 1. The mean age of owners of the SMEs was about 40 years with the years
of operation being about 8 years. The monthly income of the firms ranged from 50 to 2984
Ghana cedis. The mean monthly income is about 614 Ghana cedis. The cost of using financial
services with transportation cost, charges and others had a mean of about 5 Ghana cedis.
[Insert Table 1]
Financial literacy score ranged from 1 to 5. A score on the scale of 1 to 5 was assigned with the
least score being 1 and the highest 5. The mean score was 3.4. Eventhough the level is not the
best, it cannot also be said it is be too bad. This indicates that majority of owners of SMEs had
Page 17
considerable level of knowledge on financial matters. This means owners of SMEs can make
informed financial decisions. However, only about 16% of the SMEs sampled had a score of two
and less while about 84% of the SMEs had three and above. This finding lends support to the
work of Muller and Weber (2008) which recorded high financial literacy. However, it is in
contrast with the work of Lusardi and Mitchell (2006), Hilgert and Hogarth (2002) which
reported high financial illiteracy among respondents especially among women and the elderly.
The study also discovers that male entrepreneurs had a higher score than female counterparts.
This again confirms the work of Lusardi and Mitchell (2006).
The type of economic activity undertaken by the various SMEs and their location are presented
in Table 2. Services accounted for about 54%. This is in line with the current facts in Ghana
where the services sector contributes the highest to GDP. The least number of SMEs was found
in Agro-processing ( 8%). The highest number of SMEs was selected from District 2 which also
happened to have the highest number of SMEs in the service sector with 60%. Manufacturing
followed services closely in all the districts. About 77% of the total number of SMEs was located
in the urban area whereas 23% in the rural area. This gives a true reflection of Greater Accra
region, from which the sample was chosen. Considering the fact that majority of the financial
institutions are located in the urban centers, it can be said that geographical access to these
facilities by SMEs is not a hindrance to utilization of the services of the financial institutions.
[Insert Table 2]
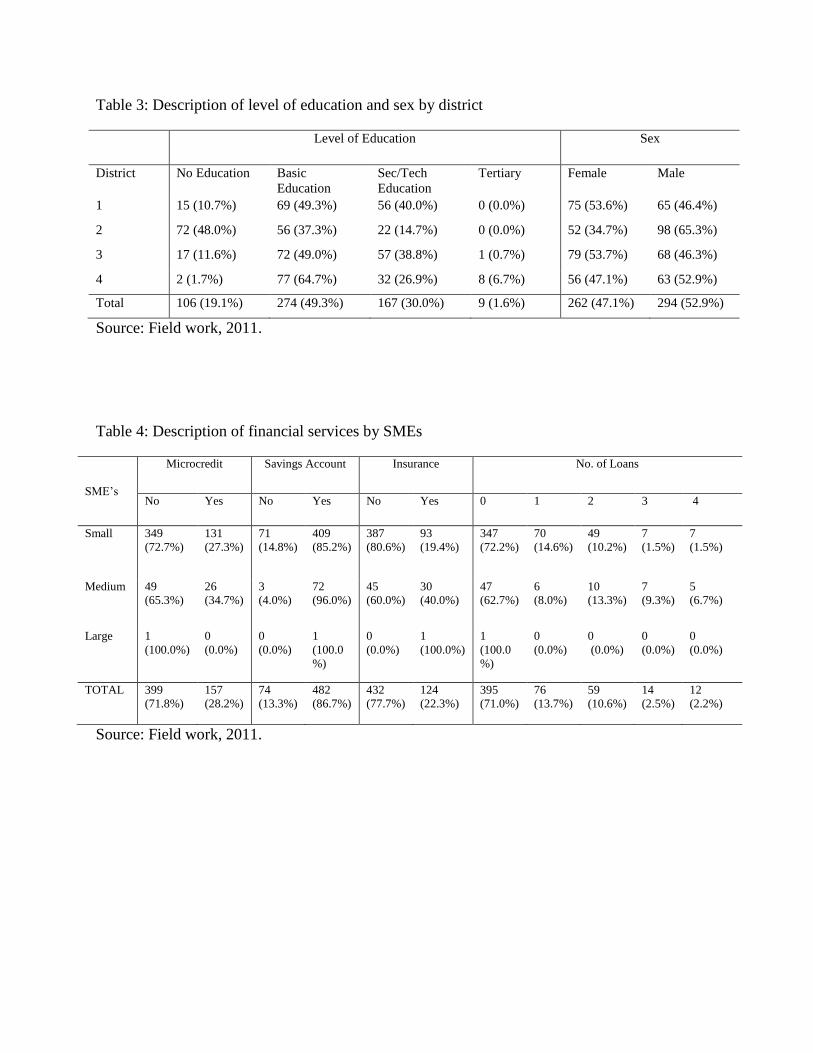
The descriptive statistics also reveal that, about 53% were males while females constituted
47%.This is shown in Table 3. The services enterprises were mostly owned by females (56%)
while about 69% of firms owned by male were in the manufacturing category. Moreover,
majority of the respondents had some level of education. About 49% of owners of SMEs had
basic education, 30% with secondary or technical education and about 2% had tertiary education.
Only 19% of the owners of the SMEs sampled had no education. The lower percentage of
tertiary education confirms the fact that in Ghana, tertiary graduates in Ghana find themselves in
paid employments instead of self-employment. Putting the level of education and the level of
financial literacy together, it is not surprising that the mean score for the financial literacy level
was about 3.4.
Page 18
[Insert Table 3]
Utilization of Financial Service
Table 4 shows utilization of financial service by SMEs. We run a crosstabs between the SMEs
classified into small, medium and large and financial service utilized. Ownership of a saving
account, insurance policy and whether the firm has applied for microcredit/loan before was used
to measure utilization of financial services. The data shows that 480 (representing 86.3%) out of
the 556 SMEs sampled were small scale, 75 (representing 13.5 %) were medium while only one
(0.2%) was in the large category. As can be seen on table 4, about 73% of the small scale firms
have not taken any micro credit within the past 12 month. For those who had taken some form of
micro credit, about 53% of them have had only one circle of loan within the past 12 month.
Some of the reasons cited for not applying are that financial institutions sometimes seize the
properties of default clients and perceived the cost of borrowing to be too high. Some also said
they had not applied for any credit because they were afraid of debt. For those who had applied
microcredit, they said they applied for loans to expand their business and also to meet
unexpected cash demands. The descriptive statistics also reveal that only 19.4% of the small
scale firms had purchased an insurance policy. Those who had not subscribed to any insurance
policy said that they did not make enough money to buy insurance. Majority also said they did
not perceive any danger so there was no need to buy insurance. The most utilized financial
service by the small scale firms was the operation of a savings account. About 85% of SMEs
interviewed had saving accounts with a financial institution. The medium scale firms also utilize
the savings accounted operation offered by the financial institutions with 96%. About 65% of
them have not accessed any micro credit from the financial institutions. Among the three
indicators of financial service utilization, the most used is operating a savings account (86.7%)
while subscription to an insurance policy to protect the firm is the least (22.3%). The reasons
cited for operating a saving account was to facilitate transfer of money, to increase the chances
of getting loans from financial institution and to provide security for incomes. These reasons
confirm the work of Cole et al. (2009).
Page 19
[Insert Table 4]
Determinants of Financial Literacy
In Table 5, we present OLS regression results for the determinants of explanatory variable of
interest. The table reveals that, sex of the owner of the SMEs, secondary/technical level
education as well as receiving financial education were statistically significant in explaining
financial literacy. Since sex is a dummy, the results suggest that male owners of SMEs are more
likely to be financial literates than their female counterparts. This is in consonant with the
descriptive statistics. There was a positive relationship between completions of
secondary/technical schooling and financial literacy of SMEs owners. This was significant at
1%. At the basic levels of education pupils are exposed to no financial education since the
curriculum does not include issues on financial matters. The number of times one had received
education on financial matters was positively related to level of financial literacy. Age of the
owner of the SMEs not significant in explaining financial literacy. The adjusted R-squared was
about 12%.
[Insert Table 5]
Financial literacy and Financial Service utilization
The relationship between financial literacy and financial service utilization was estimated using
the probit model. Two separate models were estimated: One for whether the firm has applied for
a micro credit in the past 12 month or not and whether the firm operated a savings account.
The results are show that financial literacy, size of firm, location of firm and, risk attitude were
found to be significant in explaining, saving account and applying for microcredit.
However, in view of the endogeneity between utilization of financial services and financial
literacy, we use the 2-stage probit regression to estimate the relationship between the varble of
interest and utilization of financial services. The results for the 2-stage probit regression are
presented in table 6. Model 1 has the dependent variable as whether the firm has apply for a
Page 20
micro credit in the past 12 month. From the table the age of the owner of the firm and the
residual of the financial literacy are the only variables that are significant in explaining financial
services utilization by SMEs. The positive sign for the financial literacy variable support the fact
that firms whose owners are financially literate are more likely to utilize financial services - take
micro credit, thereby increasing their chances of being sustainable. The whole model was seen to
be significant based on the probability of the chi-squared value at 1% level.
Model 2 shows the estimation for the second proxy for financial service utilization: whether a
SME operates a savings account or not. The location of the firm whether at the urban or rural
area, size of the firm, risk and financial literacy were significant in explaining whether a firm
will operate a savings account. The financial literacy, location and risk were at 1% level while
the size of the firm was significant 5%. The negative sign of the location variable suggest that it
is SMEs in the rural areas that are less likely to utilize financial services. This is because most of
the banking and non banking financial institutions are located in the urban areas and many in the
urban centers are more financially literate. SME owners who are risk averse are less likely to
operate saving account. Thus our variable of interest is significant in explaining financial service
utilization. This finding is consistent with the current empirical findings, notably the work of
Lusardi and Mitchell (2006), Stango and Zinman (2006) and Bernheim (2003).
The issue of insurance policy SMEs subscribe to in order protect their businesses was not used
because the responses were very small. Their use did not generate and result in Stata.
[Insert Table 6]
Conclusions
This study surveys 556 SMEs from four districts in the Greater Accra region of Ghana to
examine how financial literacy influences in SMEs utilization of financial services. The study
also investigated the determinants of financial literacy as well as the financial service utilization
by SMEs.
Page 21
The literature on financial literacy has shown it is crucial in stimulating both the financial and the
SME sectors, two important sectors which play important roles in the development process of the
economies of developing countries.
The benefits of better financial literacy may be great. SMEs may save more, and better manage
risk, by purchasing insurance contracts. There may even be general equilibrium effects:
increased demand by firms for financial services may improve risk sharing, reduce economic
volatility, improve intermediation, and speed overall financial development. This in turn could
facilitate competition in the financial services sector, and ultimately more efficient allocation of
capital within society.
The results of the study have proved that financial literacy of owners of SMEs is very critical in
explaining utilization of financial services by SMEs in Ghana. Moreover; the study has revealed
that financial literacy of owners of SMEs is modest. The study has also illuminated that number
of times financial education was received significantly explains financial literacy. Moreover, the
study has revealed that women are less likely to be financially literate.
Putting these findings together suggest that for SMEs to be sustained (both technically and
financially) there is the need to step up financial education in Ghana especially among SMEs.
We therefore recommend that the nationwide financial literacy week campaign instituted by the
Ministry of Finance should be intensified and well targeted. Since SMEs in the rural areas are
less likely to utilize financial service, we suggest that financial literacy education should be
target more at those in the rural areas.
References
Abubakr, Saeed. (2009). Formality of Financial Sources and Firm Growth: Empirical Evidence
From Brazilian SMEs 1999-2005. Journal of Academic Research in Economics. 1, (2009) 2.
Agarwal, S., Driscoll, J., Gabaix, X & Laibson, D. (2007). The Age of Reason: Financial
Decisions over the Lifecycle. mimeo, Harvard University.
Page 22
Agnew, J., & Szykman, L., (2005). Asset Allocation and Information Overload: The Influence of
Information Display, Asset Choice and Investor Experience. Journal of Behavioral Finance. 6,
57-70.
Aryeetey E.T, Baah-Nuako T, Duggbeby, H., & Steel, W.F. (1994). Supply and Demand for
finance of SMEs in Ghana. World Bank Discussion Papers, No.251, African technical
department Services, World Bank, Washington D.C.
Bayer, P., Bernheim, D., & Scholz, J. K. (1996). The Effects of Financial Education in the
Workplace: Evidence from a Survey of Employers. NBER Working Paper, 5655.
Bernheim, D. (1995). Do Households Appreciate Their Financial Vulnerabilities? An Analysis of
Actions, Perceptions, and Public Policy. Tax Policy and Economic Growth. Washington, DC:
American Council for Capital Formation, 1–30.
Bernheim, D. (1998). Financial Illiteracy, Education and Retirement Saving, in Olivia S.
Mitchell and Sylvester Schieber (eds.), Living with Defined Contribution Pensions, Philadelphia:
Bernheim, D., and Garrett, D. (2003). The effects of financial education in the workplace:
Evidence from a survey of households. Journal of Public Economics, 87, 1487-151.
Besley, Timothy, Stephen Coate, and Glenn Loury, 1993, The Economics of Rotating Savings
and Credit Associations, American Economic Review 83(4): 792-810.
Binswanger, H.P. (1980) Attitudes toward Risk: Experimental Measurement in Rural India.
American Journal of Agricultural Economics. 62, 395-407.
Boon, E. K. (). Women in SMEs: An African Example. Courier. 115, 74-76
Case, A.C., & Katz, L.F., (1991). The Company You Keep: The Effects of Family and
Neighborhood on Disadvantaged Youths. National Bureau of Economic Research Working
Paper 3705.
Page 23
Christelis, D., Jappelli, T., &. Padula, M. (2006). Cognitive abilities and portfolio choice, CSEF
Working Paper 157, University of Salerno.
Demirguc-Kunt, A., Beck, T. & Peria, M. S. M., (2007). Reaching out: Access to and use of
banking services across countries. Journal of Financial Economics 85, 234-266.
Economics and Statistics. 83, 257-268.
Gaviria, A., & Raphael, S. (2001). School-based Peer Effects and Juvenile Behaviour. Review of
Hastings, J., & Tejeda-Ashton, L. (2008). Financial Literacy, Information, and Demand
Elasticity:Survey and Experimental Evidence from Mexico. NBER Working Paper
Hilgert, M., Hogarth, J. & Beverly, S. (2003). Household Financial Management: The
Connection between Knowledge and Behavior. Federal Reserve Bulletin, July 309–322.
Hogarth, J. M., & O’Donnell, K. H. (1999), Banking Relationships of Lower-Income Families
and the Governmental Trend Toward Electronic Payment. Federal Reserve Bulletin, 86 (1): 459-
473.
Hogarth, J. M., & Hilgert, M. A. (2002). Financial knowledge, experience and learning
preferences: Preliminary results from a new survey on financial literacy. Consumer Interests
Annual, 48, 1-7.
Kimball, M. S., & Shumway, T. (2006). Investor Sophistication and the Participation, Home
Bias, Diversification, and Employer Stock Puzzles. Working Paper.
Lusardi, A,. & Mitchell, O. A. (2006) Financial literacy and planning: Implications for
retirement wellbeing. Working paper MRRC.
Lusardi, A,. & Mitchell, O. A., (2007b). Financial literacy and retirement preparedness: evidence
and implication for financial education. Journal of Business Economics. 35-44.
Page 24
Lusardi, A., & Mitchell, O.S. (2007a). Baby boomer retirement security: The roles of planning,
financial literacy, and housing wealth. Journal of Monetary Economics, 54, 205-224.
Maddala, G.S. (1983). Limited Dependent and Qualitative Variables in Econometrics.
Cambridge University Press.
Mandell, L. (2008). Financial education in high school, in Annamaria Lusardi, ed.: Overcoming
the saving slump: How to increase the effectiveness of financial education saving programs
(University of Chicago Press, Chicago).
MÄuller S., & Weber, M. (2008). Financial Literacy and Mutual Fund Investments: Who Buys
Actively Managed Funds? http//ssrn.com/abstract=10993305 retrieved on 25 January 2011.
Moore, D. (2003). Survey of Financial Literacy in Washington State: Knowledge, Behavior,
Attitudes and Experiences. Technical report 03-39, Social and Economic Sciences Research
Center, Washington State University.
National Council on Economic Education. (2005). What American Teens and Adults Know About
Economics. Washington, D.C.
OECD. (2005) Improving Financial Literacy. Organisation for Economic Co-operation and
Development.
Parker, A.M., Yoong, J., Bruine de Bruin, W., Willis, R. (2008). (Over)confidence and
economic behavior. Paper presented at the Conference on Understanding Economic Decision-
Making. Jackson, WY.
Stango, V, & Zinman. J. (2007). Fuzzy Math and Red Ink: When the Opportunity Cost of
Consumption Is Not What It Seems. Mimeo, Dartmouth College.
Page 25
Townsend, R. (1994). Risk and Insurance in Village India. Econometrica. 62(3), 539-591.
U.N. (2006). Building Inclusive Financial Sectors for Development. Washington, D.C.
University of Pennsylvania Press, 38–68.
Van Rooij, M., Lusardi, A., & Alessie, R. (2007). Financial literacy and stock market
participation, Working paper MRRC.
Appendix
Table 1: Statistical summary of variables
Variables No. of
Observation
Mean Standard Error Minimum Maximum
Age of Owner 556 39.9622 0.4058 23 76
Years of
Operation
556 8.0126 0.2412 1 37
No. of time
received
Financial
Education
556 2.2752 0.0605 0 4
Cost of Financial
Literacy
556 4.7428 0.1232 0 10
Monthly Income 556 613.7194 20.7584 50 2984
Size of firm 556 7.4227 0.1097 5 33
Financial
Literacy Score
556 3.4245 0.9615 1 5
Source: Field work, 2011.
Table 2: Description of economic activity and location by district
Economic Activity Location
District Agro Processing Manufacturing Services Agric Urban Rural
1 14 (10.1%) 43 (30.9%) 68(48.9%) 14 (10.1%) 140 (100.0%) 0 (0.0%)
2 10 (6.7%) 45 (30.0%) 90(60.0%) 5 (3.3%) 150 (100.0%) 0 (0.0%)
3 14 (9.6%) 46 (31.5%) 71 (48.6%) 15 (10.3%) 140 (95.2%) 7 (4.8%)
4 8 (6.7%) 25 (21.0%) 71 (59.7%) 15(12.6%) 0 (0.0%) 119(100.0%)
Total 46 (8.3%) 159 (28.7%) 300 (54.2%) 49 (8.8%) 430 (77.3%) 126 (22.7%)
Source: Field work, 2011.
Page 26
Table 3: Description of level of education and sex by district
Level of Education Sex
District No Education Basic
Education
Sec/Tech
Education
Tertiary Female Male
1 15 (10.7%) 69 (49.3%) 56 (40.0%) 0 (0.0%) 75 (53.6%) 65 (46.4%)
2 72 (48.0%) 56 (37.3%) 22 (14.7%) 0 (0.0%) 52 (34.7%) 98 (65.3%)
3 17 (11.6%) 72 (49.0%) 57 (38.8%) 1 (0.7%) 79 (53.7%) 68 (46.3%)
4 2 (1.7%) 77 (64.7%) 32 (26.9%) 8 (6.7%) 56 (47.1%) 63 (52.9%)
Total 106 (19.1%) 274 (49.3%) 167 (30.0%) 9 (1.6%) 262 (47.1%) 294 (52.9%)
Source: Field work, 2011.
Table 4: Description of financial services by SMEs
SME’s
Microcredit Savings Account Insurance No. of Loans
No Yes No Yes No Yes 0 1 2 3 4
Small 349
(72.7%)
131
(27.3%)
71
(14.8%)
409
(85.2%)
387
(80.6%)
93
(19.4%)
347
(72.2%)
70
(14.6%)
49
(10.2%)
7
(1.5%)
7
(1.5%)
Medium 49
(65.3%)
26
(34.7%)
3
(4.0%)
72
(96.0%)
45
(60.0%)
30
(40.0%)
47
(62.7%)
6
(8.0%)
10
(13.3%)
7
(9.3%)
5
(6.7%)
Large 1
(100.0%)
0
(0.0%)
0
(0.0%)
1
(100.0
%)
0
(0.0%)
1
(100.0%)
1
(100.0
%)
0
(0.0%)
0
(0.0%)
0
(0.0%)
0
(0.0%)
TOTAL 399
(71.8%)
157
(28.2%)
74
(13.3%)
482
(86.7%)
432
(77.7%)
124
(22.3%)
395
(71.0%)
76
(13.7%)
59
(10.6%)
14
(2.5%)
12
(2.2%)
Source: Field work, 2011.
Page 27
Table 5: Results of the Ordinary Least Square estimation
Dependent Variable: Financial Literacy Score
Estimation Technique: OLS
Coefficient Standard Error
Sex 0.3448*** 0.0794
Age of Owner -0.0350 0.0263
No. of time received financial
education
0.0423*** 0.0144
Income 0.0002 0.0007
Experience 0.0003 0.0003 Basic Education 0.0702 0.1035
Sec/Tec Education 0.4094*** 0.1133
Tertiary 0.4400 0.3100
Constant 3.8960*** 0.5547
No. Observation 556
F-stats 10.72
R-squared 0.136
Adj R-squared 0.123
Note: *, ** and *** indicate statistical significance at the 10%, 5% and 1%levels, respectively
Source: Field work, 2011.
Page 28
Table 6: Probit regression correcting for endogeneity
Dependent variable: Microcredit
(Model 1)
Estimation Technique: Probit
Dependent variable: Savings Account
(Model 2)
Estimation Technique: Probit
Coefficient Standard
Error
Marginal
effect
Coefficient Standard
Error
Marginal
effect
Age of firm
owners
0.0239*** 0.0085 0.0079 0.01088 0.0106 0.0022
Type of
Activity
-0.0722 0.0774 -0.0240 -0.0796 0.1005 -0.0159
Location 0.2308 0.1980 0.0793 -0.9916*** 0.2666 -0.1267
Years of
operation
-0.0060 0.0138 -0.0020 -0.0066 0.0172 -0.0013
Income -0.00002 0.0001 -7.75e-06 0.00002 0.0001 4.24e-06
Size of firm 0.0337 0.0245 0.0112 0.0797** 0.0391 0.0132
Risk 0.0257 0.1305 0.0110 1.2510*** 0.1684 -0.1460
Residual of
Financial
literacy
0.5825*** 0.2418 0.1935 0.7679*** 0.2970 0.1531
Constant 0.3470 0.8691 -2.0061* 1.1112
No. of
observation
554 554
Pseudo R2 0.039 0.096
LR chi2 (7) 25.26 41.74
Prob> chi2 0.014 0.0000
Note: *, ** and *** indicate statistical significance at the 10%, 5% and 1%levels, respectively
Source: Field work, 2011