1 Swelling Rock model 1. Overview The Swelling Rock model is a user-defined model that can be used to simulate the time-dependent anisotropic swelling of rocks. The model was originally implemented by Prof. Thomas Benz of NTNU and further developed by Bert Schädlich of TUGraz for PLAXIS. The model is based on previous work by Wittke-Gattermann & Wittke (2004), Anagnostou (1993) and Heidkamp & Katz (2002) and can account for the stress- and time dependency of swelling deformations. The following features are included: Transverse isotropic elastic stiffness (five material parameters needed). Elastic-perfectly plastic material behaviour with Mohr-Coulomb failure condition. Three different swelling laws, all going back to the idea formulated by Grob (1972). In detail: the Wittke model, the Anagnostou model, and a mixed variant. Explicit and implicit calculation of swelling strain. The implicit version finds an elastic trial stress that is compatible with the actual swelling strain whereas the explicit version uses the last converged stress for calculation of swelling strains. The implicit implementation is not fully implicit, e.g. stress correction in plastic yielding is not yet taken into account when finding swelling strain. The documentation starts with an overview on the chemo-physical processes causing the volume increase of certain rock types. The differences and similarities between clay and anhydrite swelling are outlined and related to the underlying chemical processes. Typical experimental results and field measurements for these materials are presented at the end of that chapter. The main part of the documentation deals with the formulation of the swelling constitutive model. The implemented model features are explained in detail and their practical usability is discussed. The model is validated against analytical time-swelling and stress-swelling curves. The influence of the model parameters is demonstrated in a parametric study on oedometer swelling tests. The last part of the documentation describes the model parameters.
Transcript
1
Swelling Rock model
1. Overview The Swelling Rock model is a user-defined model that can be used to simulate the time-dependent anisotropic swelling of rocks. The model was originally implemented by Prof. Thomas Benz of NTNU and further developed by Bert Schädlich of TUGraz for PLAXIS. The model is based on previous work by Wittke-Gattermann & Wittke (2004), Anagnostou (1993) and Heidkamp & Katz (2002) and can account for the stress- and time dependency of swelling deformations. The following features are included: Transverse isotropic elastic stiffness (five material parameters needed). Elastic-perfectly plastic material behaviour with Mohr-Coulomb failure condition. Three different swelling laws, all going back to the idea formulated by Grob (1972). In detail: the
Wittke model, the Anagnostou model, and a mixed variant. Explicit and implicit calculation of swelling strain. The implicit version finds an elastic trial stress
that is compatible with the actual swelling strain whereas the explicit version uses the last converged stress for calculation of swelling strains. The implicit implementation is not fully implicit, e.g. stress correction in plastic yielding is not yet taken into account when finding swelling strain.
The documentation starts with an overview on the chemo-physical processes causing the volume increase of certain rock types. The differences and similarities between clay and anhydrite swelling are outlined and related to the underlying chemical processes. Typical experimental results and field measurements for these materials are presented at the end of that chapter. The main part of the documentation deals with the formulation of the swelling constitutive model. The implemented model features are explained in detail and their practical usability is discussed. The model is validated against analytical time-swelling and stress-swelling curves. The influence of the model parameters is demonstrated in a parametric study on oedometer swelling tests. The last part of the documentation describes the model parameters.
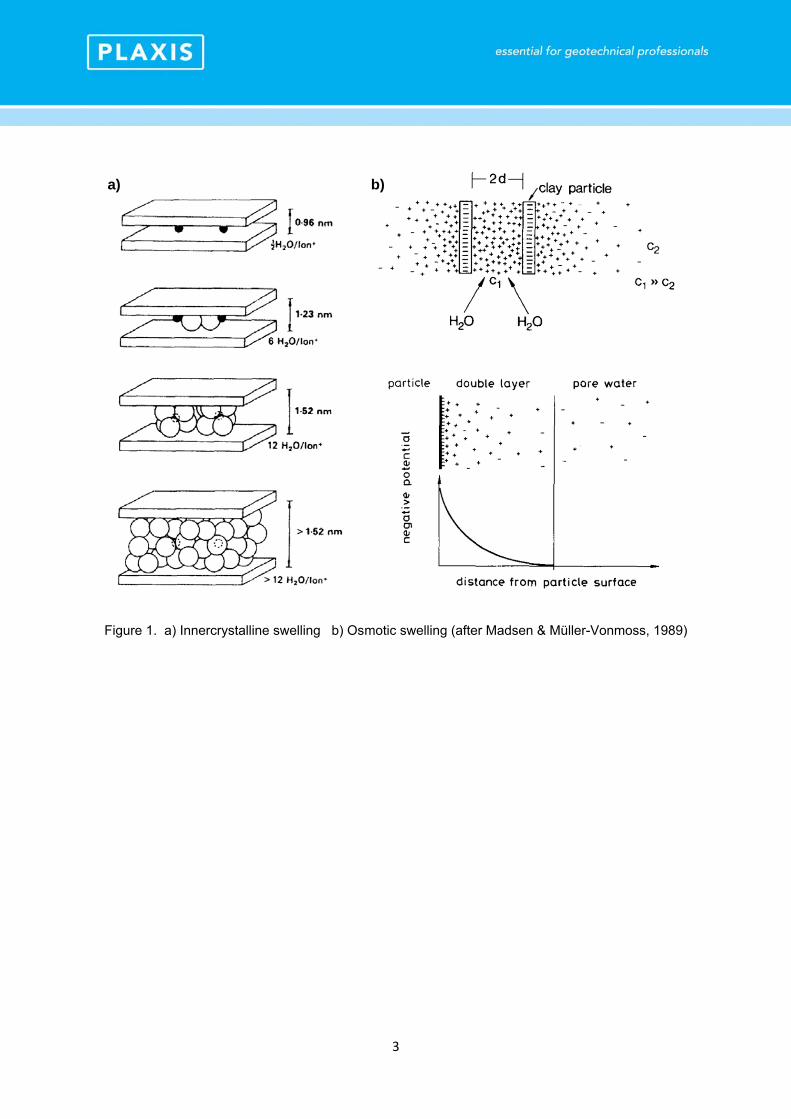
The first swelling mechanism is related to the incorporation of water within the clay particles. Clay minerals consist of negatively charged layers of aluminosilicate-anions, bounded by intermediate layers of cations. In the presence of water, the cations hydrate and water molecules are integrated into the clay mineral crystal (Fig. 1), as the energy released in hydration is much larger than the anion-cation bond within the clay mineral. The distance between the aluminosilicate layers increases in the process, resulting in up to 100% volume increase in the case of montmorillonite. The swelling pressure depends on the nature of the cations, with Ca2+-cations usually resulting in smaller swelling pressures than Na+-cations.
Innercrystalline swelling is only active up to a layer distance of 1 nm, but it requires immense external pressure to suppress it (e.g. ~400 MPa for pure montmorillonite). In most geotechnical applications such high pressure will neither be provided by the overburden nor by external loads. Unless the soil is initially completely dry, innercrystalline swelling has already occurred in the initial conditions.
More important in the context of geotechnical engineering is osmotic swelling, which is caused by differences in cation concentration in the clay and in the free pore water. After innercrystalline swelling has taken place, sodium cations (surrounded by water molecules) tend to align at the surface of the clay particles and form a so called electric double layer, which consists of the negatively charged aluminosilicate layers at the centre and positively charged, diffuse cations cloud at the surface. The hydrated cations are still positively charged as the positive parts of the water molecules align at the outer surface of the hydrated cations. Repulsive forces between the negatively charged neighbouring clay layers result in further increase of the layer distance, i.e. further swelling of the clay. Water is drawn into the intermediate space between the clay particles as a result of the difference in cation concentration with respect to the free pore water.
Theoretical swelling pressures developed by osmotic swelling hardly exceed 2 MPa, but larger swelling strains are involved than in innercrystalline swelling. It should be noted that while innercrystalline swelling cannot be reversed by measures available to the geotechnical engineer, osmotic swelling is reversible by increasing external stresses. Innercrystalline water can only be removed by oven drying at 200-300 °C, which means that laboratory tests using oven dried samples may measure osmotic and innercrystalline swelling simultaneously, while only the osmotic swelling is practically relevant.
3
Figure 1. a) Innercrystalline swelling b) Osmotic swelling (after Madsen & Müller-Vonmoss, 1989)
a) b)
4
3. Swelling of clays: Experimental data
Swelling of clays at different stress levels is well documented to follow a logarithmic relationship as
described by Grob’s swelling law (Grob, 1972) (Eq. 1 and Fig. 2). q(t=∞) is the final swelling strain at
the current axial stress a, kq is the swelling parameter (equal to the inclination of the swelling curve)
and q0 is the maximum swelling stress.
0q
aq
tq logk
(1)
The standard test to determine swelling characteristics is the Huder-Amberg test, which utilises unloading in oedometric conditions to obtain swelling deformations at different stress levels for the same sample. The logarithmic relationship can also be obtained by other testing methods (e.g. by allowing a certain amount of pre-swelling in oedometric conditions, followed by a zero-deformation swelling phase, Figure 3a. The values of the swelling parameters, however, depend at the testing method, as pointed out by Wolffersdorff & Fritzsche (2003).
Figure 2. Swelling test results after Huder & Amberg (1970) - path A-B-C-D: loading and unloading (dry); D-E: swelling under constant stress (after wetting), E-F: swelling deformations due to unloading
5
Figure 3. a. swelling test results of bentonite-claystone mixtures b. reversibility of swelling strains by increasing axial stresses (after Wang et al., 2012)
It is fairly well established, that swelling of clays is proportional to the content of sheet silicates and montmorillonite clay minerals in the rock matrix (Pregl et al., 1980; Weiss et al., 1980). A common procedure is to normalize the product of sheet silicate (Sch) and montmorillonite (Mo) content by the content of carbonates (Ka).
Figure 4. Relation between mineral composition and maximum swelling stresses for Pfänderstock
material (after Weiss et al., 1980)
Field measurements in the Pfaendertunnel (situated in swelling molasse marl) and in other tunnelling projects confirm the dependency of swelling deformations on the applied support pressure. Invert heave of up to 300 mm was measured in the initially non-anchored cross sections km 0+000 to 5+290 within the first 12 months, which however ceased to increase further after a support pressure of
a) b)
6
450 kPa was applied by installing pre-stressed anchors. In cross sections 5+290 to 6+718, a massive invert arch was installed directly after excavation, followed by applying a support pressure of 130 kPa, which resulted in invert heave deformations of ~14 mm after three years.
Figure 5. Influence of anchor pre-stressing on invert heave in km 4+400 of the Pfaendertunnel (after John, 1982)
time
invert heav
7
4. Swelling of anhydrite: Chemo-mechanical behaviour
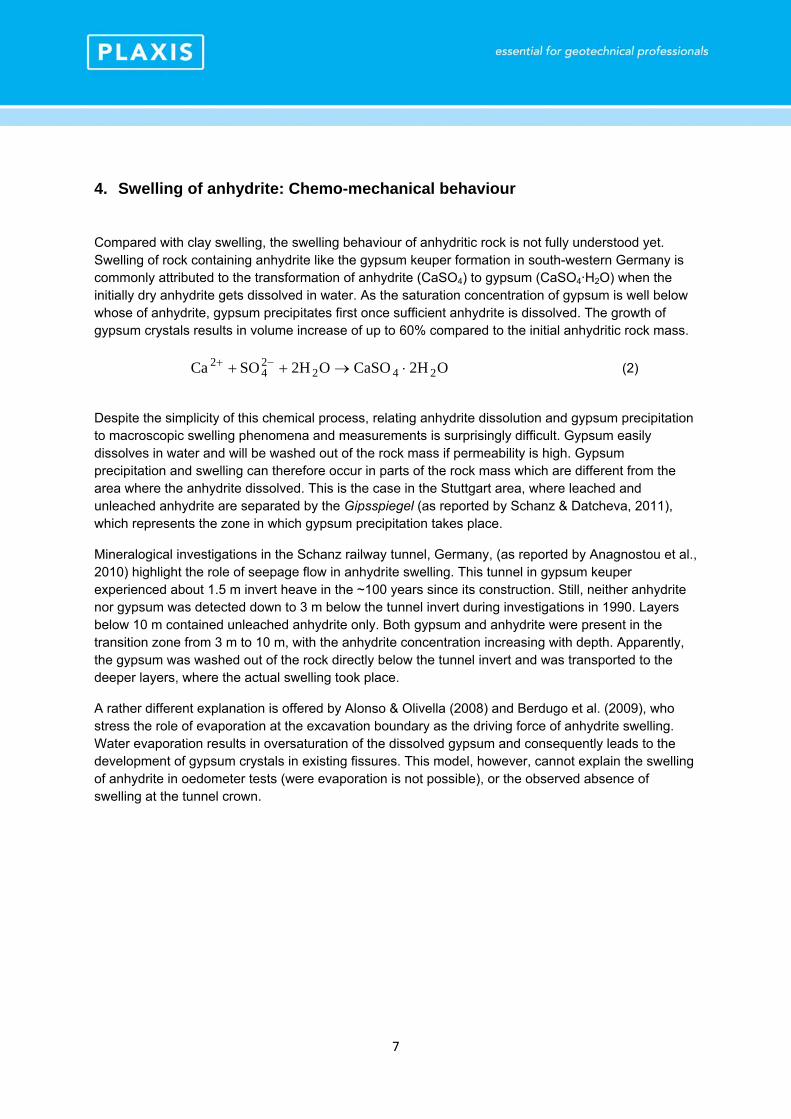
Compared with clay swelling, the swelling behaviour of anhydritic rock is not fully understood yet. Swelling of rock containing anhydrite like the gypsum keuper formation in south-western Germany is commonly attributed to the transformation of anhydrite (CaSO4) to gypsum (CaSO4·H2O) when the initially dry anhydrite gets dissolved in water. As the saturation concentration of gypsum is well below whose of anhydrite, gypsum precipitates first once sufficient anhydrite is dissolved. The growth of gypsum crystals results in volume increase of up to 60% compared to the initial anhydritic rock mass.
O2HCaSOO2HSOCa 24224
2 (2)
Despite the simplicity of this chemical process, relating anhydrite dissolution and gypsum precipitation to macroscopic swelling phenomena and measurements is surprisingly difficult. Gypsum easily dissolves in water and will be washed out of the rock mass if permeability is high. Gypsum precipitation and swelling can therefore occur in parts of the rock mass which are different from the area where the anhydrite dissolved. This is the case in the Stuttgart area, where leached and unleached anhydrite are separated by the Gipsspiegel (as reported by Schanz & Datcheva, 2011), which represents the zone in which gypsum precipitation takes place.
Mineralogical investigations in the Schanz railway tunnel, Germany, (as reported by Anagnostou et al., 2010) highlight the role of seepage flow in anhydrite swelling. This tunnel in gypsum keuper experienced about 1.5 m invert heave in the ~100 years since its construction. Still, neither anhydrite nor gypsum was detected down to 3 m below the tunnel invert during investigations in 1990. Layers below 10 m contained unleached anhydrite only. Both gypsum and anhydrite were present in the transition zone from 3 m to 10 m, with the anhydrite concentration increasing with depth. Apparently, the gypsum was washed out of the rock directly below the tunnel invert and was transported to the deeper layers, where the actual swelling took place.
A rather different explanation is offered by Alonso & Olivella (2008) and Berdugo et al. (2009), who stress the role of evaporation at the excavation boundary as the driving force of anhydrite swelling. Water evaporation results in oversaturation of the dissolved gypsum and consequently leads to the development of gypsum crystals in existing fissures. This model, however, cannot explain the swelling of anhydrite in oedometer tests (were evaporation is not possible), or the observed absence of swelling at the tunnel crown.
8
5. Swelling of anhydrite: Experimental data
As pointed out by Anagnostou et al. (2010), experimental data for anhydrite swelling are rather scarce. The lack of reliable data is due to the large time spans involved in anhydrite swelling. E.g., the laboratory swelling test series from the Freudenstein tunnel in Germany show no sign of attenuation, even though the tests started more than 20 years ago.
The test results of the Freudenstein samples (Anagnostou et al., 2010), extrapolated from the current measurements) indicate that the swelling strain is fairly independent of the applied stress in the relevant engineering stress range and exhibits a sharp drop only at high stress levels (Figure 6). In practical terms, this means that increasing the tunnel support pressure (by means of anchoring and stiff support) will not reduce the swelling deformations.
Figure 6. Swelling test results of gipskeuper material from the Freudenstein tunnel (after Pimentel, 2007), as reported in Anagnostou et al., 2010)
However, this contradicts the reported results of field tests in the Wagenburg test tunnels (Kovari et al., 1988; Berdugo et al., 2009) and the Freudenstein test gallery (Berdugo et al., 2009). After observing significant invert heave in the Wagenburg tunnels in Stuttgart from 1942-1970, two 20 m long test tunnels were excavated in 1970-71 from the northern tunnel into the unleached anhydrite. The roof and walls of the horse-shoe shaped test tunnels were sealed with shotcrete. The tunnel invert was left free of any sealing except for a part of tunnel II, which was covered with an anchored concrete slab. Test tunnel I was kept free of artificial watering, while tunnel II was watered once a week. Measurements after 6 years of swelling clearly show the influence of the applied support pressure: About 600 mm of invert heave were measured in the non-supported area of test tunnel II, but only 30 mm in the area of the anchored concrete slab (Figure 7).
9
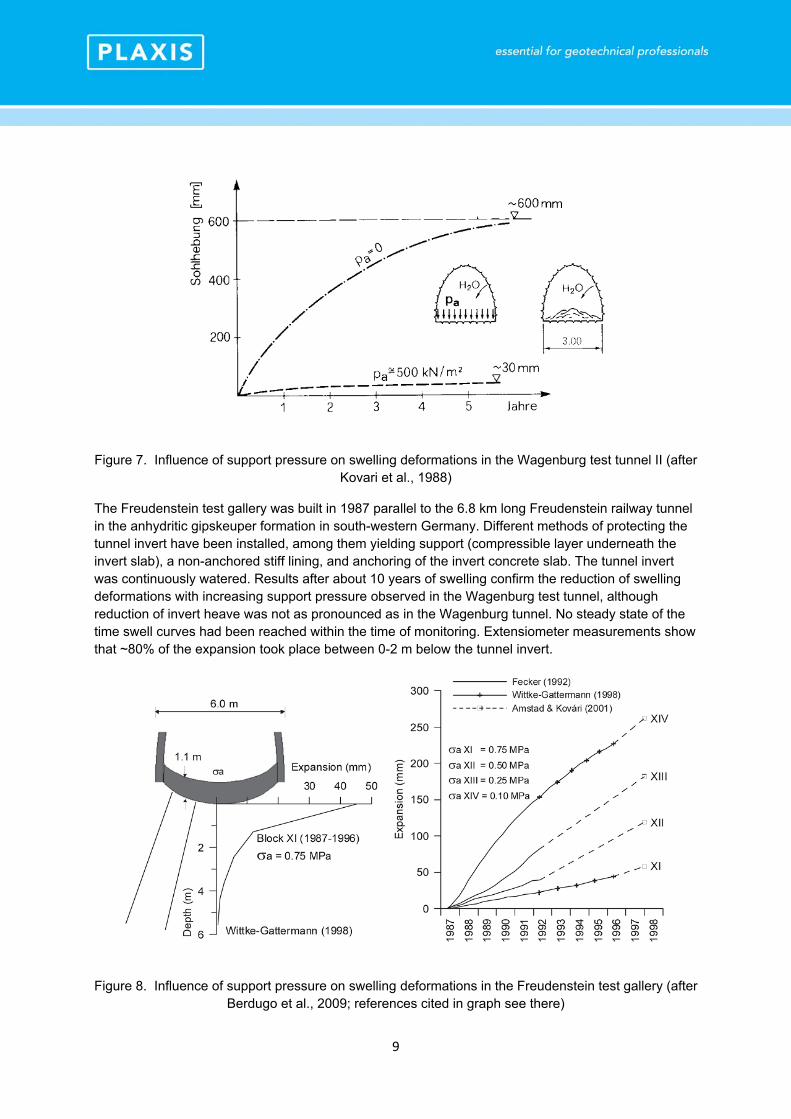
Figure 7. Influence of support pressure on swelling deformations in the Wagenburg test tunnel II (after Kovari et al., 1988)
The Freudenstein test gallery was built in 1987 parallel to the 6.8 km long Freudenstein railway tunnel in the anhydritic gipskeuper formation in south-western Germany. Different methods of protecting the tunnel invert have been installed, among them yielding support (compressible layer underneath the invert slab), a non-anchored stiff lining, and anchoring of the invert concrete slab. The tunnel invert was continuously watered. Results after about 10 years of swelling confirm the reduction of swelling deformations with increasing support pressure observed in the Wagenburg test tunnel, although reduction of invert heave was not as pronounced as in the Wagenburg tunnel. No steady state of the time swell curves had been reached within the time of monitoring. Extensiometer measurements show that ~80% of the expansion took place between 0-2 m below the tunnel invert.
Figure 8. Influence of support pressure on swelling deformations in the Freudenstein test gallery (after Berdugo et al., 2009; references cited in graph see there)
10
6. Summary of swelling behaviour
The swelling behaviour of clay appears to be sufficiently well understood to allow interpretation of laboratory test results as well as field measurements. Dependency of swelling deformations on stress level follows a logarithmic relationship, which can be described by Grob’s swelling law. Consequently, high swelling stresses at the tunnel lining can be avoided by allowing for relatively small deformations. Swelling deformations can be reversed by either increasing the load level or drying of the clay. Compared with anhydrite swelling, deformations develop relatively fast in clay, with swelling rates decreasing with increasing size of the sample.
There is less consensus regarding the processes involved in anhydrite swelling. While the transformation of anhydrite to gypsum without doubt delivers considerable increase in volume, the process leading to precipitation and gypsum crystal growth remains disputed, with some authors outright rejecting the notion of gypsum driving the swelling process. There is also significant discrepancy between laboratory swelling tests (yielding swelling strains almost independent of stress level) and the decrease of swelling with increasing support pressure observed in large scale field tests. In particular noteworthy are the large time periods involved in anhydrite swelling. Both laboratory and field tests usually show no sign of attenuation even after decades of continuing swelling. Swelling in tunnelling projects in anhydrite is restricted to the rock mass down to several meters below the tunnel invert, which closely resembles the swelling area observed in clay swelling. The transformation of anhydrite to gypsum is not reversible by increasing stresses or drying.
It appears feasible to utilize Grob’s swelling law for both swelling clays and anhydrite, as the logarithmic relationship takes account of the reduction of swelling deformations with increasing support pressure, which is observed in both clay and anhydrite swelling. However, input parameters for the swelling law can hardly be derived from laboratory tests due to the following limitations:
1. Dependency of final swelling strains of clays on the swelling test method 2. Dependency of time-swell-curves on sample thickness for clays 3. Laboratory swelling tests on anhydrite show too little influence of stress level on swelling
deformations 4. Very long time periods in anhydrite swelling to reach steady state 5. Dependency of in situ swelling on water supply
Laboratory swelling tests can indicate qualitatively, whether swelling is to be expected or not, but these tests are hardly suited to derive reliable material parameters for a constitutive model. Numerical simulations should better be calibrated against in-situ measurements, which evidently makes class A predictions for real projects notoriously difficult.
11
7. Formulation of the swelling rock model
Anisotropic elasticity
The total strain increment is decomposed into an elastic component el, a plastic component pl and a
swelling strain componentq (equation 3). Elastic strains are calculated according to cross-anisotropic elasticity. A deviation of the material axis of symmetry from the vertical axis can be taken into account by the rotation angle , which describes a counterclockwise rotation of the material axes in the x-y-
plane (i.e. about the global z-axis, Figure 9). If equals 0, Del = Delref and the material axis of
symmetry coincides with the global y-axis.
qplel εεεε (3)
elel εDσ (4)
rotelref
Trot
el MDMD (5)
cossin
sincos
cossinsin
/sincossin
/sinsincos
rot
0000
0000
002022
000100
00220
0022022
22
M (6)
By introducing n = Et/Ep and m = 1-tt-2·n·pt2, the cross-anisotropic stiffness matrix can be written as
66
55
44
332313
232212
131211
00000
00000
00000
000
000
000
D
D
D
DDD
DDD
DDD
elrefD (7)
with
tt
ptt m
nED
1
1 2
11 , m
EDDpt
t
2312 (8a)
tt
ptttt m
nED
1
2
13 , m
ED ttp
1
22 (8b)
12
ptGDD 5544 , tt
ttt
EGD
1266 (8c)
Figure 9. Definition of material rotation angle in PLAXIS 2D
The above equations only take account of rotation about one axis as used in PLAXIS 2D. The model is not (yet) available in PLAXIS 3D.
Stress dependency of swelling strains
The relationship between final swelling strains iq(t=∞) and the axial stress in the direction of swelling is
taken from Grob’s decadic-logarithmic swelling law.
iq
iqi
tqi logk
010
(10)
kqi is the (axial) swelling parameter, i is the axial stress and q0i is the maximum swelling stress in that
direction. The swelling curve is limited at c = -10 kPa to avoid excessive swelling strains at low or tensile stresses. Cross-anisotropy in swelling behaviour can be taken into account by different values of kqi for the axial directions. The orientation of the material axes is the same for elasticity and swelling behaviour ( = 0: horizontal bedding plane). It is however possible to use isotropic elasticity and anisotropic swelling behaviour, or vice versa.
Figure 10. Grob’s swelling law (Grob, 1972)
13
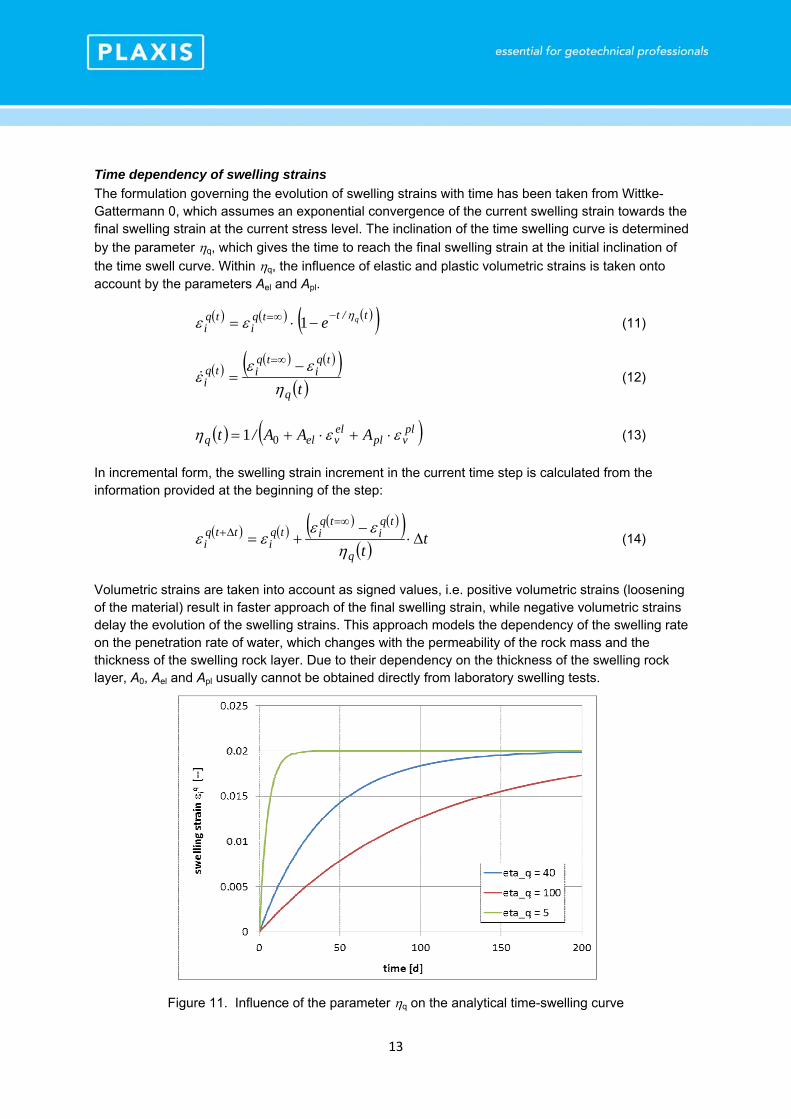
Time dependency of swelling strains
The formulation governing the evolution of swelling strains with time has been taken from Wittke-Gattermann 0, which assumes an exponential convergence of the current swelling strain towards the final swelling strain at the current stress level. The inclination of the time swelling curve is determined
by the parameter q, which gives the time to reach the final swelling strain at the initial inclination of
the time swell curve. Within q, the influence of elastic and plastic volumetric strains is taken onto account by the parameters Ael and Apl.
t/ttqi
tqi
qe 1 (11)
tq
tqi
tqitq
i
(12)
plvpl
elvelq AAA/t 01 (13)
In incremental form, the swelling strain increment in the current time step is calculated from the information provided at the beginning of the step:
ttq
tqi
tqitq
ittq
i
(14)
Volumetric strains are taken into account as signed values, i.e. positive volumetric strains (loosening of the material) result in faster approach of the final swelling strain, while negative volumetric strains delay the evolution of the swelling strains. This approach models the dependency of the swelling rate on the penetration rate of water, which changes with the permeability of the rock mass and the thickness of the swelling rock layer. Due to their dependency on the thickness of the swelling rock layer, A0, Ael and Apl usually cannot be obtained directly from laboratory swelling tests.
Figure 11. Influence of the parameter q on the analytical time-swelling curve
14
Calculation of swelling strains in different coordinate systems
The transition from the 1D-swelling law to a general 3D-constitutive model requires some assumptions about the mutual influence of swelling in different directions. In the following equations, indices ‘t’ and ‘p’ refer to properties tangential and perpendicular to the bedding plane, respectively. Three different approaches are available in the current model:
1) Wittke model
The 1D swelling law is evaluated in the coordinate system of the principal stresses. No coupling of axial swelling strains is taken into account. The global stress state , swelling parameters kqi and q0i
and the accumulated swelling strains iq(t) are transformed in the system of the principal stress axes.
After calculating the swelling strain increment iq(t), swelling strains are rotated back into Cartesian
coordinates. For the calculation of swelling strains only the diagonal elements of the rotated matrices kq and q0 are taken into account.
Swelling parameters in the bedding plane system (input values):
qt
qp
qt
q
k
k
k
00
00
00
k ,
tq
pq
tq
q
0
0
0
0
00
00
00
σ (15)
Rotation matrix from bedding plane system into Cartesian coordinates
100
0
0
cossin
sincos
Rot (16)
Rotation of swelling parameters from bedding plane into Cartesian coordinates:
RotkRotk qTCart
q , RotσRotσ 00 qTCart
q (17)
Rotation into principal stress coordinates:
n1, n2, n3 … unit vectors of the principal stress axis
321
321
321
n3n3n3
n2n2n2
n1n1n1
Rot S (18)
TSCartq
SSq RotkRotk , TSCart
qSS
q RotσRotσ 00 (19)
15
qzz
qyz
qxz
qyz
qyy
qxy
qxz
qxy
qxx
q
ε , TSqSqS RotεRotε (20)
Calculation of swelling strain increments for time step �t:
qS,
qS,
qS,
qS
33
22
11
00
00
00
ε (21)
plvpl
elvel
qAAA
0
1 (22)
qS
i,i
i,iSq
ii,i
Sq
q
qSi,i log
tε
σk
0
(23)
Rotation of swelling strain increment from principal stress coordinates back into Cartesian coordinates:
SqSTSCart,q RotεRotε (24)
2) Anagnostou model
The original model proposed by Anagnostou (1993) is rather complex and includes a groundwater flow part. Only the swelling part of this model is considered here. Swelling is evaluated in the bedding plane coordinate system, which significantly reduces the number of matrix transformations compared with the Wittke model. Cross-anisotropic swelling characteristics are described by the parameter ,
which can be related to the swelling parameters kqt and kqp (equation 27). equals 0 for an isotropic material and 0 for a material without swelling parallel to the bedding plane (kqt = 0).
It should be noted that the model predicts isotropic swelling strains for kqt = kqp (isotropic swelling potential), even though the stress state and the maximum swelling stresses may not be isotropic. In this case the swelling strains depend on the ratio (p’/pq0) and hence on mean effective stress. Final swelling strains in oedometric conditions are therefore much smaller than with the Wittke model, as the increase in horizontal stress due to horizontal swelling and the consequential increase in p’ limits swelling in the vertical direction.
Rotation of stress state into bedding plane system:
zzyzxz
yzyyxy
xzxyxx
σ ,
100
0
0
cossin
sincos
Rot (25)
16
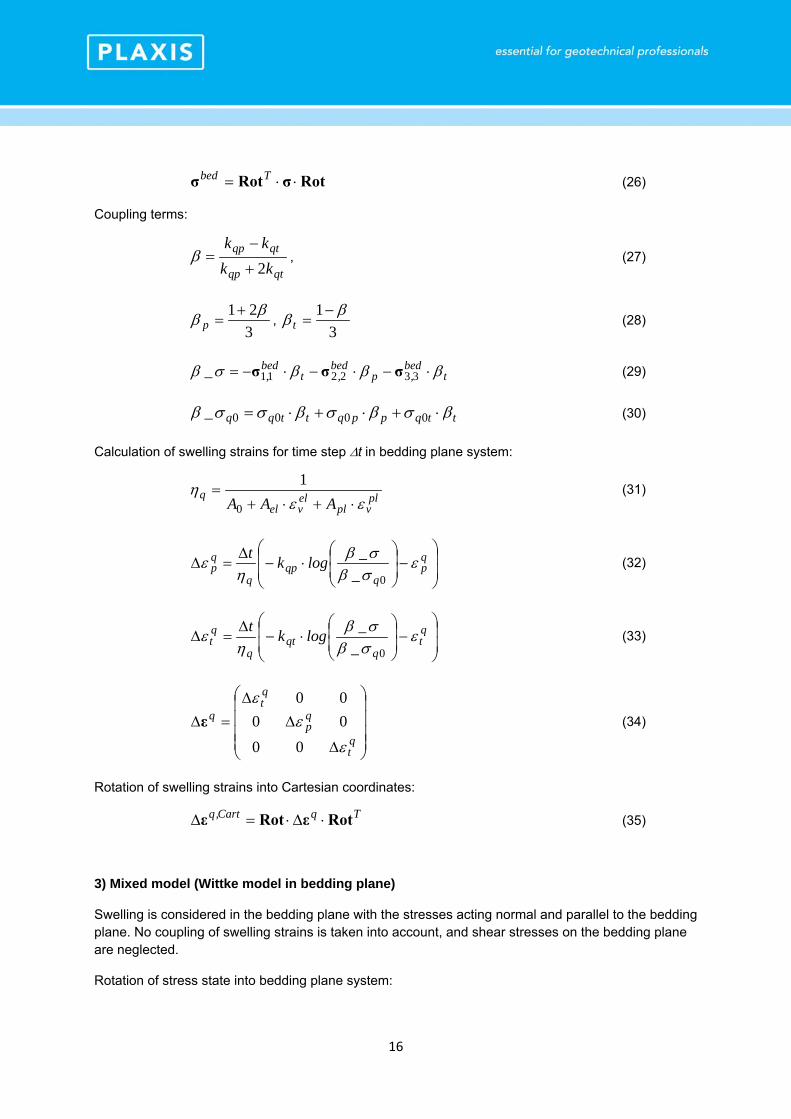
RotσRotσ Tbed (26)
Coupling terms:
qtqp
qtqp
kk
kk
2
, (27)
3
21 p ,
3
1 t (28)
tbed,p
bed,t
bed,_ 332211 σσσ (29)
ttqppqttqq_ 0000 (30)
Calculation of swelling strains for time step t in bedding plane system:
plvpl
elvel
qAAA
0
1 (31)
q
pq
qpq
qp _
_logk
t
0
(32)
q
tq
qtq
qt _
_logk
t
0
(33)
qt
qp
qt
q
00
00
00
ε (34)
Rotation of swelling strains into Cartesian coordinates:
TqCart,q RotεRotε (35)
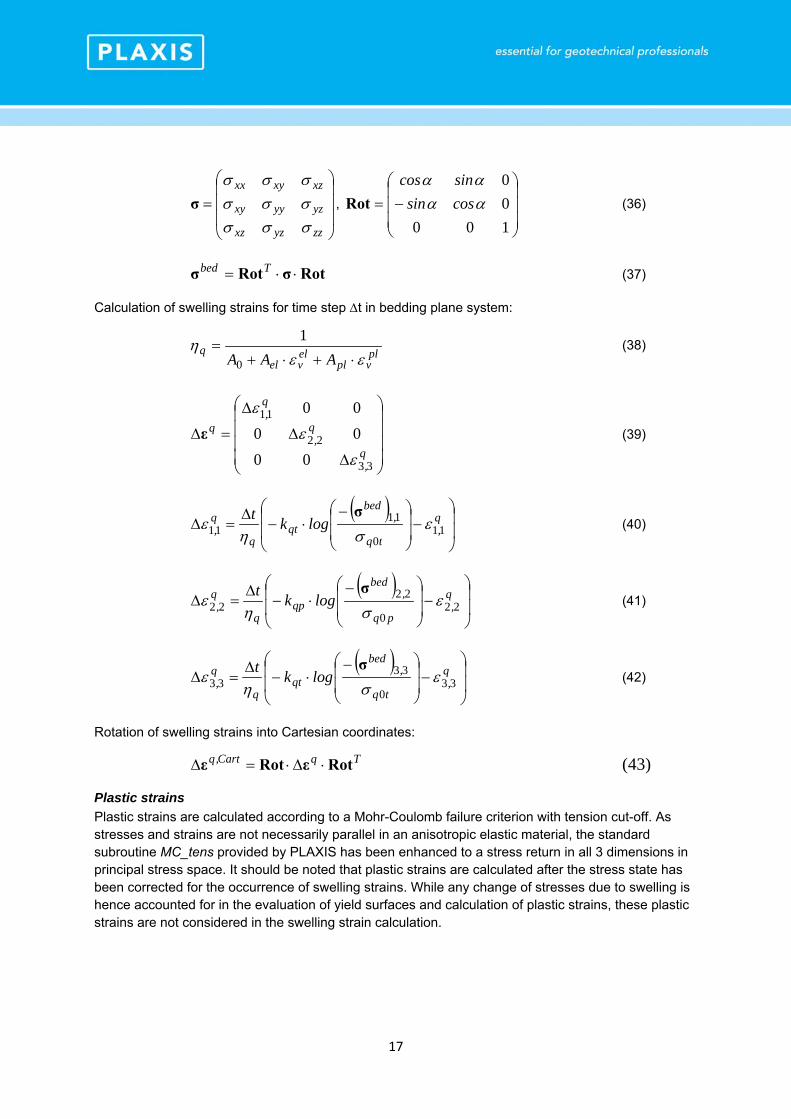
3) Mixed model (Wittke model in bedding plane)
Swelling is considered in the bedding plane with the stresses acting normal and parallel to the bedding plane. No coupling of swelling strains is taken into account, and shear stresses on the bedding plane are neglected.
Rotation of stress state into bedding plane system:
17
zzyzxz
yzyyxy
xzxyxx
σ ,
100
0
0
cossin
sincos
Rot (36)
RotσRotσ Tbed (37)
Calculation of swelling strains for time step t in bedding plane system:
plvpl
elvel
qAAA
0
1 (38)
q,
q,
q,
q
33
22
11
00
00
00
ε (39)
q
,tq
,bed
qtq
q, logk
t11
0
1111
σ (40)
q
,pq
,bed
qpq
q, logk
t22
0
2222
σ (41)
q
,tq
,bed
qtq
q, logk
t33
0
3333
σ (42)
Rotation of swelling strains into Cartesian coordinates:
TqCart,q RotεRotε (43)
Plastic strains
Plastic strains are calculated according to a Mohr-Coulomb failure criterion with tension cut-off. As stresses and strains are not necessarily parallel in an anisotropic elastic material, the standard subroutine MC_tens provided by PLAXIS has been enhanced to a stress return in all 3 dimensions in principal stress space. It should be noted that plastic strains are calculated after the stress state has been corrected for the occurrence of swelling strains. While any change of stresses due to swelling is hence accounted for in the evaluation of yield surfaces and calculation of plastic strains, these plastic strains are not considered in the swelling strain calculation.
18
Additional model features
Coupling of swelling with presence of water
There is extensive evidence from laboratory tests and field observations, that swelling phenomena in both clay and anhydrite require the presence of water. This can be taken into account in the model by choosing Water = 1 in the input parameter menu. In that case the swelling part of the model is only activated for the current stress point if the steady state pore water pressure Sig0(7) is less than -0.01 kPa. Increase of pore water pressure at later stages still results in swelling stresses. With this approach the whole soil body can be defined with the same material, but only its submerged or wetted parts develop swelling deformations.
Coupling of maximum swelling pressure to initial stresses
The correlation between maximum swelling stresses and the initial, undisturbed stress state is not fully clear yet. For initially fully saturated clays, the initial stress state obviously poses an upper boundary for the maximum swelling pressure, whereas no such relationship seems to exist for anhydrite.
Variation of maximum swelling pressure with the initial stress level can be achieved in the model with the input parameter inicoupling. For inicoupling = 0, the input parameters 22 and 23 are used. In case of inicoupling > 0, the maximum swelling pressures are calculated from the initial effective stresses normal and tangential to the bedding plane:
q0p = - inicoupling ·'0p
q0t = - inicoupling ·'0t
This procedure is carried out during the initialization of the soil cluster. In case of gravity loading (’0 = 0) it is recommended to do the gravity loading step with a material set with inicoupling = 0, and change the material in the next calculation phase. Values of inicoupling > 1 should not be used.
19
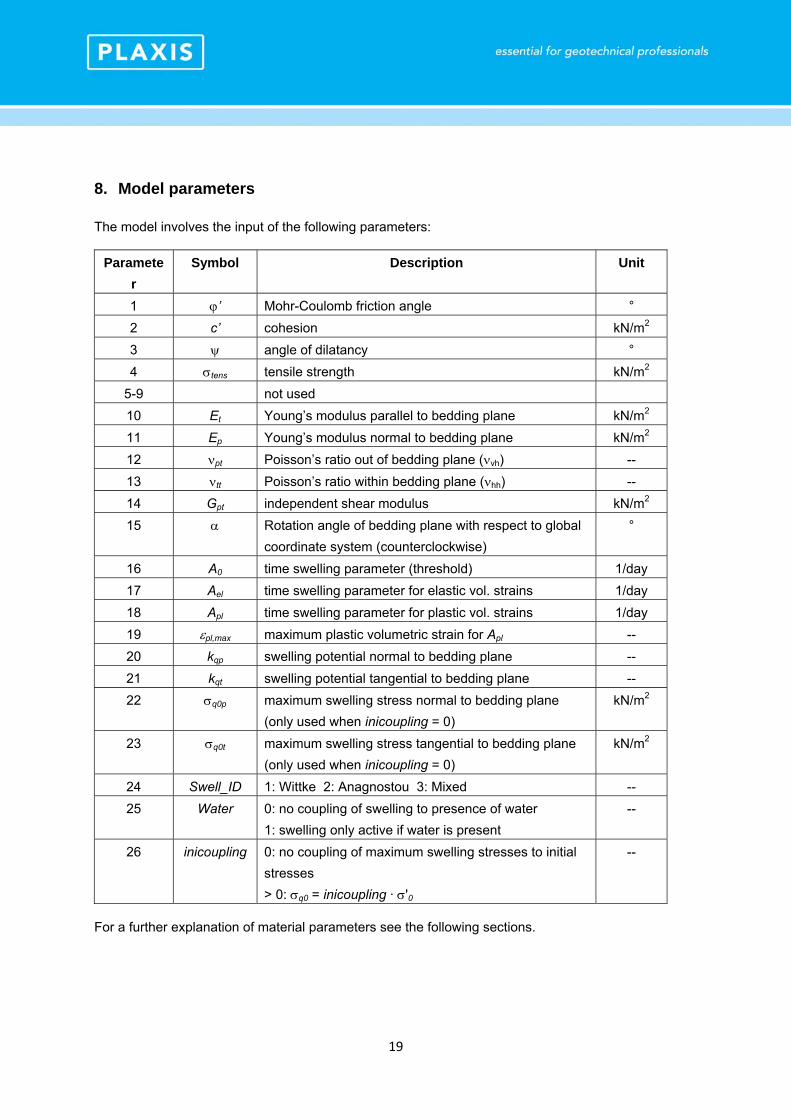
8. Model parameters The model involves the input of the following parameters:
Paramete
r
Symbol Description Unit
1 ’ Mohr-Coulomb friction angle °
2 c’ cohesion kN/m2
3 angle of dilatancy °
4 tens tensile strength kN/m2
5-9 not used
10 Et Young’s modulus parallel to bedding plane kN/m2
11 Ep Young’s modulus normal to bedding plane kN/m2
12 pt Poisson’s ratio out of bedding plane (vh) --
13 tt Poisson’s ratio within bedding plane (hh) --
14 Gpt independent shear modulus kN/m2
15 Rotation angle of bedding plane with respect to global
coordinate system (counterclockwise)
°
16 A0 time swelling parameter (threshold) 1/day
17 Ael time swelling parameter for elastic vol. strains 1/day
18 Apl time swelling parameter for plastic vol. strains 1/day
19 pl,max maximum plastic volumetric strain for Apl --
20 kqp swelling potential normal to bedding plane --
21 kqt swelling potential tangential to bedding plane --
22 q0p maximum swelling stress normal to bedding plane
(only used when inicoupling = 0)
kN/m2
23 q0t maximum swelling stress tangential to bedding plane
(only used when inicoupling = 0)
kN/m2
24 Swell_ID 1: Wittke 2: Anagnostou 3: Mixed --
25 Water 0: no coupling of swelling to presence of water
1: swelling only active if water is present
--
26 inicoupling 0: no coupling of maximum swelling stresses to initial
stresses
> 0: q0 = inicoupling · '0
--
For a further explanation of material parameters see the following sections.
20
Elasticity
Transverse isotropic elasticity has been implemented with the following conventions:
Figure 12. Definition of elastic anisotropy
Care has to be taken to define the extra shear modulus needed (denoted Gn in the drawing above and named G23 in the list of model parameters). It is possible to leave the input for G23 empty (= 0) and then the formula by Barden, G23 = Ep/(1+Ep/Et+2p) is used to fill in a default value inside the material model. Isotropic elasticity can be obtained in specifying Ep = Et and p = t. The rotation angle - (parameter 15 in the above table) is defined counter-clockwise. Zero degrees gives a horizontal plane. As axis convention is different in PLAXIS 2D and 3D, the current implementation cannot be used in PLAXIS 3D, as the plane in the model rotates along the z-axis, which is not right in PLAXIS 3D. Yield criterion
The basic Mohr-Coulomb failure criterion is included. Parameters to be defined are friction angle, cohesion and dilatancy.
Figure 13. Mohr-Coulomb failure criterion
Note that in combination with anisotropic elasticity, dilatancy becomes a difficult topic as strain and stress space are not linked through an affine transformation that does preserve angles. In other words, elastic volumetric strain can be associated with deviatoric stress changes even with a dilatancy angle
21
of 0. Dilatancy in the current implementation only affects the plastic component of volumetric strain (as typically seen in elasto-plasticity). Swelling models
The model comprises three different swelling models that differ in details but all go back to the idea by Grob. Model ID = 1 (Parameter 24): Wittke model
According to Wittke, the 1D swelling law shall be evaluated in direction of principle stress when translated to 3D. The three principle stress directions are evaluated separately. There is no coupling between them. Model ID = 2 (Parameter 24): Anagnostou model
Main conceptual difference between the Anagnostou model and the Wittke model is that in the latter, swelling can be evaluated in any coordinate system and hence, also in the bedding plane system, and that there is a coupling term between directional swelling strains.
Model ID = 3 (Parameter 24): Wittke on bedding plane
The third swelling model is the Wittke approach on the bedding plane, or in other words: Anagnostou without coupling.
Pros and cons of the different swelling models
Model ID 2 and 3 are most efficient as there is less rotation operations to be undertaken and also, small numerical errors in transferring kq to the principal stress system may end up with fluctuations in swelling strain etc. Model ID 1 does not work well at zero stress level as there is no consistent principal stress system defined in which swelling is calculated. Therefore, when using Modell ID 1 in a free swelling test, best assign two small loads in two of the directions, e.g. 0.1 kPa and 0.2 kPa. In boundary value problems, this is not an issue.
22
9. State parameters
The swelling rock model has 13 state parameters, which can be viewed in the Output part of the program: 1: Accumulated swelling volumetric strain 2: Accumulated elastic volumetric strain 3: Accumulated plastic volumetric strain 4: Swelling strain xx (Model ID 1); Swelling strain relative to bedding plane (Model ID 2 and 3) 5: Swelling strain yy (Model ID 1); Swelling strain relative to bedding plane (Model ID 2 and 3) 6: Swelling strain zz (Model ID 1); Swelling strain relative to bedding plane (Model ID 2 and 3) 7: Swelling strain xy (Model ID 1); Not used in Model ID 2 and 3 8: Swelling strain yz (Model ID 1); Not used in Model ID 2 and 3 9: Swelling strain xz (Model ID 1); Not used in Model ID 2 and 3 10: Accumulated swelling volumetric strain calculated after plastic correction 11: Error indication calculated from StVar(11) = ABS(StVar(1)-StVar(10)) / ABS(StVar(1)) 12: (Model ID 2 – visualization only) else unused 13: 0 (Model ID 2 – visualization only) else unused
23
10. References
Alonso, E.E. & Olivella, S. (2008). Modelling tunnel performance in expansive gypsum claystones. International Association for Computer Methods and Advances in Geomechanics (IAC-MAG), Goa, India, 891–910.
Anagnostou, G. (1993). A model for swelling rock in tunnelling. Rock Mechanics and Rock Engineering 26 (4), 307-331.
Anagnostou, G.; Pimentel, E. & Serafeimidis, K. (2010). Swelling of sulphatic claystones – some fundamental questions and their practical relevance. Geomechanics and Tunnelling 3 (5), 567-572.
Berdugo, I.R.; Alonso, E.; Romero, E. & Gens, A. (2009). Tunnelling and Swelling in Triassic Sulphate–Bearing Rocks. Part I. Case studies from Baden–Württemberg, Revista Epsilon 12, 1–17.
Berdugo, I.R.; Alonso, E.; Romero, E.; Gens, A. & Albis, M. (2009). A review of expansive phenomena in Wagenburg North Tunnel. Físicas y Naturales 33, 455–468
Czurda, K.A. & Ginther, G. (1983). Quellverhalten der Molassemergel im Pfänderstock bei Bregenz, Österreich. Mitt. österr. geolog. Ges. 76, 141-160.
Grob, H. (1972). Schwelldruck im Belchentunnel. Proc. Int. Symp. für Untertagebau, Luzern, 99-119.
Heidkamp, H. & Katz, C. (2002). Soils with swelling potential - Proposal of a final state formulation within an implicit integration scheme and illustrative FE-calculations. Proc. of the 5th World Congress on Comp. Mec., Vienna, Austria.
Huder, J. & Amberg, G. (1970). Quellung in Mergel, Opalinuston und Anhydrit. Schweizerische Bauzeitung 43, 975–980.
John, M. (1982). Anwendung der neuen österreichischen Tunnelbauweise bei quellendem Gebirge im Pfändertunnel. Proc. of the 31st Geomechanik Kolloquium, Salzburg, Austria,
Kovari, K.; Amstad, Ch. & Anagnostou, G. (1988). Tunnelbau in quellfähigem Gebirge. Mitteilungen der Schweizerischen Gesellschaft für Boden- und Felsmechanik, Heft 154, Fribourg, 1–8.
Madsen, F.T & Müller-Vonmoss, M (1989). The swelling behaviour of clay. Applied Clay Science 4, 143-156.
Pimentel, E. (2007). Quellverhalten von Gesteinen – Erkenntnisse aus Laboruntersuchungen. Quellprobleme in der Geotechnik. Mitteilungen der Schweizerischen Gesellschaft für Boden- und Felsmechanik, Heft 115, Fribourg, 13–20.
Pregl, O.; Fuchs, M.; Müller, H.; Petschl, G.; Riedmüller, G. & Schwaighofer, B. (1980). Dreiaxiale Schwellversuche an Tongesteinen. Geotechnik 1, 1-7.
Schädlich, B. (2013). Internal report: Swelling Rock model. Technical University Graz.
Schanz, T. & Datcheva, M. (2011). Report on how to use PLAXIS for the analysis and design of tunnels in swelling rock. internal report.
Wang, Q., Tang, A.M., Cui, Y.J, Delage, P., Gatmiri, B. (2012). Experimental study on the swelling behaviour of bentonite/claystone mixture. Engineering Geology 124, 59-66.
Weiss, E.H.; Müller, H.M.; Riedmüller, G. & Schwaighofer, B. (1980). Zum Problem quellfähiger Gesteine im Tunnelbau. Geolog. Paläont. Mitt. Innsbruck 10 (5), 207-210.
Wittke-Gattermann, P. & Wittke, M. (2004) Computation of Strains and Pressures for Tunnels in Swelling Rocks. Proc. ITA 2004 E14, 1-9.
V. Wolffersdorff, P.-A.; Fritzsche, S. (2003). Laboratory swell tests on overconsolidated clay and diagenetic solidified clay rocks. Proc. Int. Symp. GeoTechnical Measurements and Modelling (GTMM), Karlsruhe, Germany, 407 – 412.