Swimming performance and larval quality are altered by rearing substrate at early
life phases in white sturgeon, Acipenser transmontanus (Richardson, 1836)
By D. W. Baker1, D. S. O. McAdam2, M. Boucher3, K. T. Huynh4 and C. J. Brauner4
1ICSS, VIU, Nanaimo, BC, Canada; 2MOE, University of British Columbia, Vancouver, BC, Canada; 3Freshwater FisheriesSociety of BC, Abbotsford, BC, Canada; 4Department of Zoology, University of British Columbia, Vancouver, BC, Canada
Summary
To investigate the role of substrate enrichment on larvalgrowth and performance, white sturgeon, Acipenser trans-montanus, were reared for 12 dph (the pre-feeding stage) in
the presence and absence of enriched substrates (i.e. structur-ally complex media). Following this period, larval sturgeonwere transferred to holding tanks with unenriched substrate
(lacking structural complexity) and reared for an additional30 days, during which time health and performance indica-tors (growth, Ucrit, startle response reaction time) and whole
body lipid composition were assessed at 15 and 18°C. Stur-geon reared on unenriched substrates tended to grow moreslowly (up to 40% reduced mass at 40 dph) with a lowercondition factor (5–15% lower between 8 and 40 dph), but
also exhibited delayed gut development and reduced rate ofyolksac absorption (at 15 dph) than those reared withenriched substrates. Whole body lipid composition was sig-
nificantly altered with substrate enrichment, although thebiological relevance of these changes is unknown. White stur-geon reared without exposure to enriched substrates at some
temperatures and developmental phases demonstrated mod-est reductions in aerobic (~20–30% lower Ucrit) and startleresponse performance (~5–10% slower reaction time) at 15
and 30 dph. Overall, most effects were influenced by rearingtemperatures and parentage, such that differences were notstatistically significant under all conditions. Clearly, however,substrate enrichment plays an important role in development
of white sturgeon during early life stages.
Introduction
White sturgeon, Acipenser transmontanus, are native to threemajor watersheds in western North America (Columbia, Sac-
ramento and Fraser River watersheds). Most Canadian pop-ulations are endangered (COSEWIC, 2012) and four of sixCanadian populations are listed under the Species at RiskAct (SARA), with the Kootenay River population also listed
under the US Endangered Species Act. Three populations inCanada are undergoing chronic recruitment failure and arecurrently sustained by hatchery inputs. While causes are
uncertain, recruitment failure likely results from increasedearly life phase mortality, which may be caused by alteredcharacteristics of river substrates (McAdam et al., 2005; Par-
agamian et al., 2009). Changes in rearing substrate (e.g.
increased fine substrates in rearing gravels) have been shownto have a negative impact on development of salmonids (Pet-erson and Martin-Robichaud, 1995; Kihslinger and Nevitt,
2006) and other species (e.g. robust redhorse, Moxostomarobustum; Jennings et al., 2010). While the specific mecha-nisms involved in larval effects are poorly understood, they
are highly relevant to understanding habitat-recruitment rela-tionships in fish in general, but white sturgeon in particular.Altering substrate enrichment (i.e. structural complexity,
Batzina et al., 2014) can affect larval survival and quality inwhite sturgeon as early as in the yolksac stages. Substratechange has been linked with decreased wild recruitment forthe Kootenay (Paragamian et al., 2009) and Nechako
(McAdam et al., 2005) populations, and manipulative fieldstudies show effects on larval retention, survival and growth(McAdam, 2012; Crossman and Hildebrand, 2014). Labora-
tory studies confirm this, where the degree of substrateenrichment affects not only growth and survival, but alsowhole animal energetics as inferred from changes in meta-
bolic scope throughout larval white sturgeon development(Boucher, 2012; Boucher et al., 2014). As reductions in larvalgrowth may also lead to indirect effects on larval condition
that diminish survival (Anderson, 1988; Gessner et al., 2009;Boucher, 2012), determining the source of reduced larvalcondition has important implications for evaluation of thequality of both captive and wild larvae. For example, differ-
entiating whether the mortality of feeding larvae is the resultof prior conditions (e.g. substrate effects on yolksac larvae)or subsequent conditions (e.g. food availability effects on
feeding larvae) may be critical for directing population recov-ery efforts, due to the substantial differences in habitat utili-zation between these two stages.
Negative effects associated with substrate enrichment onphysiological performance (such as swimming or escapebehaviours) in early life phase sturgeon may manifest beforethe effects on growth and survival. Previous research has
revealed effects of substrate enrichment on larval behaviour(hiding, Gessner et al., 2009; McAdam, 2011; predatoravoidance, Gadomski and Parsley, 2005; McAdam, 2011).
Swimming performance or predator avoidance responsesmay be vital – for example, the transition to exogenous feed-ing increases requirements for prey capture and predator
avoidance. When fish are pushed to their physical limits (i.e.exercise), the respiratory, cardiovascular and metabolic pathways
U.S. Copyright Clearance Centre Code Statement: 0175-8659/2014/3006–1461$15.00/0
are all forced to operate maximally, and any compromise inphysiological performance may be revealed (e.g. as prema-ture fatigue, Randall and Brauner, 1991; Brauner et al.,1994; Jain et al., 1998). In addition to earlier detection, faster
swimming and more rapid escape behaviours can be assumedto benefit fish, while the relationship between growth andsurvival can be complex (Anderson, 1988; Fuiman, 2002).
Consequently, maximal sustainable aerobic swimming speed(Ucrit) and startle response reaction time (SRRT, alsoreferred to as escape latency or alarm responsiveness) can be
indicative diagnostic tools (Suboski et al., 1990; Domeniciet al., 2007; Nendick et al., 2009), and provide valuableproxies for larval quality.
Another avenue for assessing larval condition is throughanalysis of fatty acid composition. Fatty acids (FA) provideessential molecular precursors, which support energeticdemands, superior growth, and developmental requirements
of larvae, and FA composition has been evaluated previouslyfor a variety of species as an indicator of larval quality (seeFerron and Leggett, 1993). Deficiencies in some fatty acids
have been shown to reduce larval growth, performance andsurvival in a number of fish species (Navarro and Sargent,1992; Koven et al., 2001; Tocher, 2003). Also, improved lar-
val escape performance in larvae with higher arachidonicacid (ARA) levels (Fuiman and Ojanguren, 2011) indicatespotentially important links between FA composition and sur-vival.
The goal of this study was to investigate the effects ofrearing yolksac larvae on enriched substrates from 0 to12 days post-hatch (dph), on growth and performance to
40 days post-hatch. We measured persistent and carry-overeffects on growth and physiological performance (Ucrit andSRRT) at two temperatures, 15°C and 18°C, the latter close
to an upper thermal maxima. We additionally assessed wholebody fatty acid (FA) composition and yolksac and gut devel-opment. Based on prior observations (Boucher et al., 2014),
we predicted that white sturgeon larvae reared with enrichedsubstrates during the yolksac larvae phase would exhibitsuperior survival, growth and quality (as indicated byenhanced physiological performance) due to decreased stress
or overall activity. Overall, this research provides insight intoboth substrate effects on recruitment, and the potential useof novel quality indicators (swimming performance, FA com-
position) to assess the condition of white sturgeon larvae.
Materials and methods
Animal husbandry
White sturgeon larvae utilized in this study were the progenyof wild caught broodstock derived from the transboundary
reach of the Columbia River, spawned at the KootenayTrout Hatchery in Wardner, BC in 2010 (Series I) and 2011(Series II). Embryos were from two distinct genetic crosses,arbitrarily referred to as Family A and B for Series I, and
Family C and D for Series II. Embryos were transferredfrom the hatchery to the University of British Columbia(UBC, Vancouver, BC) at approximately 6 days post-fertil-
ization in chilled coolers via airfreight (4 h transit time).
In Experimental Series I, (June–August 2010) embryoswere transferred to individually aerated, drip irrigated, plas-tic tubs (8-L) with no internal flow, supplied with biofiltered,temperature controlled, recirculating dechlorinated Vancou-
ver City water. In Experimental Series II (June–August2011), embryos and hatching larvae were held in 50-L glassaquaria supplied with static dechlorinated freshwater, with
water quality maintained by regular water exchange withde-chlorinated water (~50%) once (1–11 dph) or twice (12–40 dph) daily. In both cases, embryos and larvae were
exposed to a photoperiod of 12:12 h light:dark and held ateither 15 (�1°C) or 18 (�1°C) (only Series I) temperatures.Upon initiating of feeding (12 dph), larvae were fed to
satiation 3 times daily with a larval mash (crushed SkrettingBioTrout pellets, supplemented with dry krill and Cyclop-eeze�). Tanks were cleaned by siphon to remove uneatenfood 1 h after each feeding.
In Series 1, larval sturgeon from the same families butreared at the Kootenay Trout Hatchery to either 14 dph(referred to as hatchery reared unenriched substrate 15 dph,
or HUS15, see Table 1) or 29 dph (referred to as hatcheryreared unenriched substrate 30 dph, or HUS30, see Table 1)were transported to UBC in thermostatted (through addition
of high thermal inertia packs) coolers via airfreight (4 h tran-sit time). These larval sturgeon were transferred to identicalholding tanks within the recirculating system (in Experimen-tal series I) or identical glass aquaria (in Experimental Series
II) with other measured parameters (such as water flow, tem-perature, and diet) kept similar. The larvae transported toUBC at 15 dph were reared for a further 15 days in identical
holding tanks (referred to as hatchery and lab reared unen-riched substrate 30 dph, or HLUS30, see Table 1).Food was withheld 12 h before maximum aerobic swim-
ming performance testing (Ucrit) and startle response assess-ment to avoid the metabolic effects of digestion. All holdingand sampling procedures were approved by the University of
British Columbia Animal Care Committee (protocol numberA07-0080).
Experimental protocols
Experimental series I. In this experimental series, we investi-gated the effect of substrate enrichment on mass, Ucrit, startleresponse reaction time (SRRT) and whole animal FA ratios
at two temperatures (15°C and 18°C). Following hatch, stur-geon larvae were transferred to identical tanks (20-L plasticaquaria) that included either unenriched substrate (US, lack-ing structural complexity) or enriched substrate (ES, having
structural complexity). In Series I, US treatment consisted ofa bare, plastic bottom, and the ES consisted of 100 sub-merged BioballsTM. Larvae from each of two genetically dis-
tinct families were reared at two temperatures (15 and 18°C)for each substrate condition and all family, temperature, andtreatment combinations were replicated in duplicate. At
12 dph, substrate was removed from the ES treatment andlarvae in all treatments were reared over unenriched sub-strate for the remainder of the experiment (to 30 dph).Groups were kept separately throughout the course of the
1462 D. W. Baker et al.
experiment (i.e. families, replicates, temperatures and sub-strate conditions remained separated).
White sturgeon larvae were weighed at 4, 7, 11, 15, 25,and 29 dph. Larvae were collected (n = 6 per treatment) intoa 50 ml centrifuge tube and terminally euthanized in MS-222(0.1 g L�1, buffered with 0.2 g L�1 NaHCO3). Larvae were
then gently blotted with paper towels and transferred to anultra-fine scale (sensitivity � 0.1 mg) to obtain mass mea-surements. Other larvae were frozen in liquid nitrogen for
later analysis of lipid composition. Larvae initially reared atthe Kootenay Trout hatchery were also assessed in this wayat 15 (HUS15) and 30 (HUS30, HLUS30) dph (see Table 1).
Swim trials were conducted in fresh water at 15 dph and
30 dph. Subjects were collected randomly from activelyswimming fish. At each temperature, a total of 64 fish werechallenged with ramped-critical swim tests (n = 8 per group;
2 substrates 9 2 families 9 2 replicates, with the exceptionof 30 dph sturgeon held at 18°C where survival was toolow). Hatchery reared larval sturgeon (HUS15, HUS30, and
HLUS30) were subjected to an identical protocol (n = 8 perfamily). Two Blazka-type (Blazka, 1960) swim tunnels (miniswim tunnel, Loligo Systems; www.loligosystem.com,
26.4 mm diameter, 100.0 mm length) were fitted with plastic
flow-straighteners at both ends to facilitate laminar flow andseparate fish from the propeller mechanism that produced
the flow. Temperature was maintained at �1°C of rearingtemperature (i.e. 15 or 18°C) throughout the swim trials.Fish within each group were distributed equally between thetwo swim tunnels to avoid bias. An additional plastic mesh
was added to the flow straighteners to prevent fish fromseeking refuge within the holes of the grid.Following transfer in water to the darkened swim flume,
sturgeon were permitted 5 min to recover from handlingbefore the initiation of any flow. Fish were then allowed 20–30 min to habituate to the tunnel environment at a low flow
rate (~0.25 bl s�1) before the ramping protocol began. Watervelocity was increased by approx. 0.3 cm s�1 every minuteuntil fatigue. Fish were considered fatigued following a 10 speriod where fish could not escape the down-stream grid,
although the initial time that fish laterally contacted the gridwas recorded. At fatigue, water flow was stopped and thefish was removed, euthanized with MS-222 (0.1 g L�1, buf-
fered with 0.2 g L�1 NaHCO3), patted dry, weighed, and thelength measured. Fish were then placed in 1.5 ml bullettubes, rapidly flash frozen in liquid nitrogen, and stored at
�80°C for future analysis.Water velocities (cm s�1) were calculated from images
obtained from high-speed photography (420 frames s�1) of
the movement of a coloured dye injected at the upstream
Table 1Definitions of treatment groups for Series I and Series II
Label Definition Series
ES Enriched substrate, up to ~12 dph Series I (BioballsTM)Series II (Gravel)
US Unenriched substrate Series I (no added substrate)Series II (sand)
HUS15 Hatchery reared unenriched substrate, 15 dph Series IHUS30 Hatchery reared unenriched substrate, 30 dph Series IHLUS30 Hatchery and lab reared, unenriched substrate, 30 dph Series I
Family Treatment group
Days post hatch (dph)
4 7 11 15 25 29
Series I: Mass (mg) of white sturgeon larvae from Family A and B reared on enriched (ES) or unenriched (US) substrates at 15 and 18°C upto 29 days post hatch (dph)
All sturgeon transferred to tanks with no enriched substrate at approx. 10–12 dph. Superscript ‘a’ = fish shipped to UBC at 14 dph andweighed at 15 dph and 29 dph. Superscript ‘b’ = fish shipped to UBC at 28 dph, and weighed at 29 dph. Values expressed as means � SEM.
Swimming performance of Acipenser transmontanus larvae 1463
end of the swim tunnel and correlated with the voltage (V)supplied to the propeller motor. Each swim tunnel was cali-brated independently; the voltage:water velocity relationshipswere similar between the two. There was no overall effect of
swim tunnel selection (i.e. A vs B) on swim performance ateither 15°C or 18°C.
Startle response reaction time (SRRT) protocol
The SRRT was measured in actively swimming larval white
sturgeon that were randomly captured (n = 10 per group; 2substrates 9 2 families 9 2 replicates) from holding tankswith a beaker and transferred in water and allowed to
recover for 1 h in a Petri dish (10 cm diameter filled withwater) located on a well-lit temp. controlled wet table. Fishheld at 18°C for 30 dph exhibited poor survival and thuswere excluded from this test. To induce the startle response,
a metal rod was used to strike the edge of the Petri dish dur-ing which a vertically positioned high-speed video camera(420 frames s�1) recorded the event. Following this proce-
dure, fish were terminally anaesthetized.The SRRT was evaluated using image analysis software
(ImageJ, version 1.4) by counting the number of frames
between the initial strike of the metal rod on the Petri dishand the first visible movement of the head following stimula-tion of the startle response. Time between stimulus andresponse (i.e. delay time) was calculated based on the cam-
era’s frame capture rate and referred to as startle responsereaction time (SRRT).
Experimental series II. In this experimental series, we inves-
tigated the effect of substrate enrichment on growth, condi-tion factor and fatty acid composition. Following hatch,larval sturgeon were transferred to identical tanks that heldeither added sand (particulate size < 0.2 cm; treatment group
= unenriched substrate, US) or larger gravel (roughly 1–2 cmdiameter; treatment group = enriched substrate, ES) through11 dph. Again, treatments were replicated twice (2 substrate
9 2 families). At 12 dph, all added substrates were removedcompletely from all tanks, and larvae reared in an unen-riched substrate environment (i.e. bare glass tank) from 12 to
40 dph. At 12 dph, feeding commenced with the same foodand feeding protocol as described in Series I.Sturgeon larvae (n = 10) were collected at 0, 1, 4, 7, 10,
12, 15, 25, 30 and 40 dph from each treatment group (i.e.US and ES), terminally euthanized in MS-222 (0.1 g L�1,buffered with 0.2 g L�1 NaHCO3) and preserved in 4%paraformaldehyde (0.1 M phosphate buffer, pH = 7.4). Sam-
ples were then evaluated for wet weight and length.
Yolksac and gut development analysis
At 15 dph, five larvae (n = 5) from each treatment in Series IIwere preserved in 4% para-formaldehyde and sent to Wax-it
Histology Services Inc. (Vancouver, BC) for sectioning andstaining. Longitudinal sections down the midline were stainedusing hematoxylin and eosin (H & E). Larval sections wereevaluated based on the developmental state of their digestive
tract: in particular, observations of the presence of a yolksac
(indicating incomplete conversion to the gastric stomach) anddevelopment of the stomach lining (e.g. improved staining,increased mucosal folds and muscle) were recorded.
Fatty acid analysis
Fatty acid analysis was performed on larvae from both Series
I and II. In Series I, larvae were sampled at 15 (experimentalgroups and hatchery reared fish), 29 (experimental groups)and 34 dph (hatchery reared fish), while in Series II, all larval
groups were sampled at 30 and 40 dph. To obtain fatty acidprofiles and composition, randomly collected larvae wereblotted dry, frozen in liquid nitrogen and stored at �80°C.On the day of the analysis, frozen larvae were homogenizedusing Tissue TearorTM homogenizer (model 398; Mexico). Lip-ids were extracted according to Bligh and Dyer (1959), methy-lated in 6% HCl/methanol solution at 80°C for a minimum of
two hours, and a further extraction was done in hexane. Theresulting fatty acid methyl esters (FAMEs) were identifiedand quantified using HPLC gas chromatography (1 ll injec-tion volume, GC-Varian model 3900, California, USA) withan Agilent column (100 m 9 0.25 mm id; CP7420) and aflame ionization detector. FAMEs were eluted from the col-
umn with helium as the carrier gas. The column heating pro-tocol was adopted from Grant et al. (2008). An initialtemperature of 140°C was raised to 216°C at a rate of 4°Cmin�1, then to 240°C at 2°C min�1, with the injector and
detector temperature set at 260°C (total running time:46 min.). FAMEs were identified using GALAXIE WORKSTATION
software (Varian; version 1.9) and individual FAME concen-
tration was expressed as percentage of the total identifiablefatty acids. Treatments were compared based on 1) levels ofindividual FAs and 2) FA ratios including the Essential Fatty
Acid Deficiency Index (EFADI, Takeuchi, 1997).
Calculations and statistical analysis
In Series I, maximum sustainable aerobic swimming speed(Ucrit) was calculated according to Brett (1964) using theequation:
Ucrit ¼ Ui þ ½UiiðTiT�1ii Þ�
with Ui the highest velocity maintained for the whole minuteinterval, Uii the velocity increment, Ti the time elapsed atfatigue velocity and Tii the interval time (i.e. 60 s). Ucrit isexpressed in body lengths per sec (bl s�1).
In Series II, condition factor (CF) was calculated as:
All analyses were conducted using SigmaPlot 10.0 with
level of statistical significance of P < 0.05. Values arereported as means � standard errors of the means (SEM).
1464 D. W. Baker et al.
In Series I, the combined effect of all three factors (tem-perature, substrate type and genetic origin) on each of mass,Ucrit and startle response delay were examined using a mixedmodel, 3-way analysis of variance (3-way ANOVA). SNK post
hoc tests were used to identify where significant differencesoccurred.In Series II, comparisons of parameters (e.g. length, mass,
condition factor, family, FAs, slope of linear trends) betweenenriched and unenriched substrate treated groups were testedusing Student’s paired t-test. When more than two groups
were compared (US, ES and hatchery-reared), one-way ANO-
VA was followed by post hoc analysis with the pairwiseHolm-Sidak test.
Results
Experimental series I: the effect of substrate enrichment on growth,
Ucrit, and SRRT
White sturgeon larvae increased in mass over the course ofthe experiment (P < 0.05, see Table 1). Temperature affectedgrowth such that white sturgeon were significantly larger at
18°C than at 15°C at each time point measured after 1 dph.There were also effects of parentage: white sturgeon fromFamily B were significantly heavier than those of Family A
from 1 dph until 25 dph. Larval mass was not significantlydifferent between substrate treatments until 11 dph, althoughat this sampling time the effect of substrate alone could notbe resolved due to a significant interaction term among the
three factors (P = 0.005). However, from 15 dph up to andincluding 29 dph, white sturgeon reared in ES were signifi-cantly larger than those reared with US.
Rearing conditions at the Kootenay Trout Hatcheryappear to be more suited for rapid growth of larval whitesturgeon as hatchery reared sturgeon were significantly larger
than their lab reared counterparts at both 15 dph and29 dph (Table 2).
Maximum swimming speed (Ucrit)
At 18 dph, there was a significant effect of substrate on Ucrit,however, this effect was dependent on temperature. When
analyzed separately, at 15°C there was no effect of substratetreatment (i.e. US vs ES) on Ucrit. In contrast, white stur-geon larvae reared at 18°C in US had a significantly lower
Ucrit than those in ES (1.7 bl s�1 compared to 2.6 bl s�1,respectively). Despite the larger size of family B and fasteroverall swimming speeds, larvae from family A had signifi-
cantly higher average Ucrit relative to body length, which isconsistent with expected scaling effects.At 30 dph, no difference in swimming performance was
detected between substrate treatments at 15°C. Larvae fromFamily A again had a higher overall Ucrit than Family B.Low larval survival at 18°C did not allow examination ofsubstrate effects on Ucrit. White sturgeon larvae collected
from the hatchery had significantly higher mean Ucrit thanUBC reared fish at both 15 and 30 dph (Fig. 1).Larvae used for Ucrit exhibited similar growth trends in
response to temperature and family differences as those lar-
vae examined solely for growth, indicating that the fishselected (from active swimmers within the tank) accuratelyrepresented size and length of fish overall from that treat-ment. In addition, no differences in condition factor of larvae
were observed between treatments at 15 dph (pooled value,CF = 0.43 � 0.01).
Startle response reaction time (SRRT)
Overall, no main effect of substrate or temperature on SRRT
was detected, but larvae from Family A had a significantlylonger overall SRRT than those from Family B. Data werefrom each temperature separately in order to a) avoid the
possible confounding effects of temperature on growth anddevelopment, b) increase statistical power, and c) match thestatistical protocol of Ucrit analysis, This approach illustratedthat while there was no effect of family or substrate treat-
ment on SRRT at 18°C (Fig. 2), at 15°C there was a signifi-cant overall effect of both family and substrate treatment,with larval sturgeon reared on US requiring over 20% longer
to respond than ES (Fig. 2). It is worth noting, however,that the statistical power of this examination was low, andso these findings may be conservative.
Experimental series II: the effect of substrate enrichment on growth
and gut development
As in Series I, larvae reared with ES were heavier and longerthan those reared with US. For example, ES-treated larvaesampled from Family C were significantly heavier at all sam-
pling times from 8 to 40 dph (excluding 15 dph), and signifi-cantly longer at all time points from 10 dph to 40 dph(excluding 12 dph); these differences were as great as 39%
and 9%, respectively (Fig. 3). Similar patterns were seen forFamily D (Fig. 3d).In general, condition factor was higher in larvae from ES
treatments than from US in both families (Fig. 3e,f). All lar-vae independent of substrate treatments exhibited a sharpdecrease in condition factor from about 1.0 at hatch (0 dph)to below 0.6 by 15 dph and subsequently stabilized at 0.5;
this, however, is a reflection of developmental changes (e.g.yolksac absorption) rather than indicative of any change inhealth status.
Gut development
Gut development appears more advanced in larvae from ESthan in US treatments based upon histological findings. Forexample, increased musculature of the stomach wall and in-vaginations in the mucosal lining in four of five larvae from
ES for Family C (compared to zero of five for US) and fiveof five larvae from Family D (compared to two of five forUS) suggest that development is occurring faster or develop-
mental phases are reached earlier with exposure to ES(Fig. 4). Additionally, the complete lack of yolksacs in larvaefrom ES relative to the presence in US in some larvae (three
of five larvae from Family C and two of five larvae fromFamily D) support this conclusion.
Swimming performance of Acipenser transmontanus larvae 1465
Experimental series I and II: the effect of substrate enrichment on
relative fatty acid composition
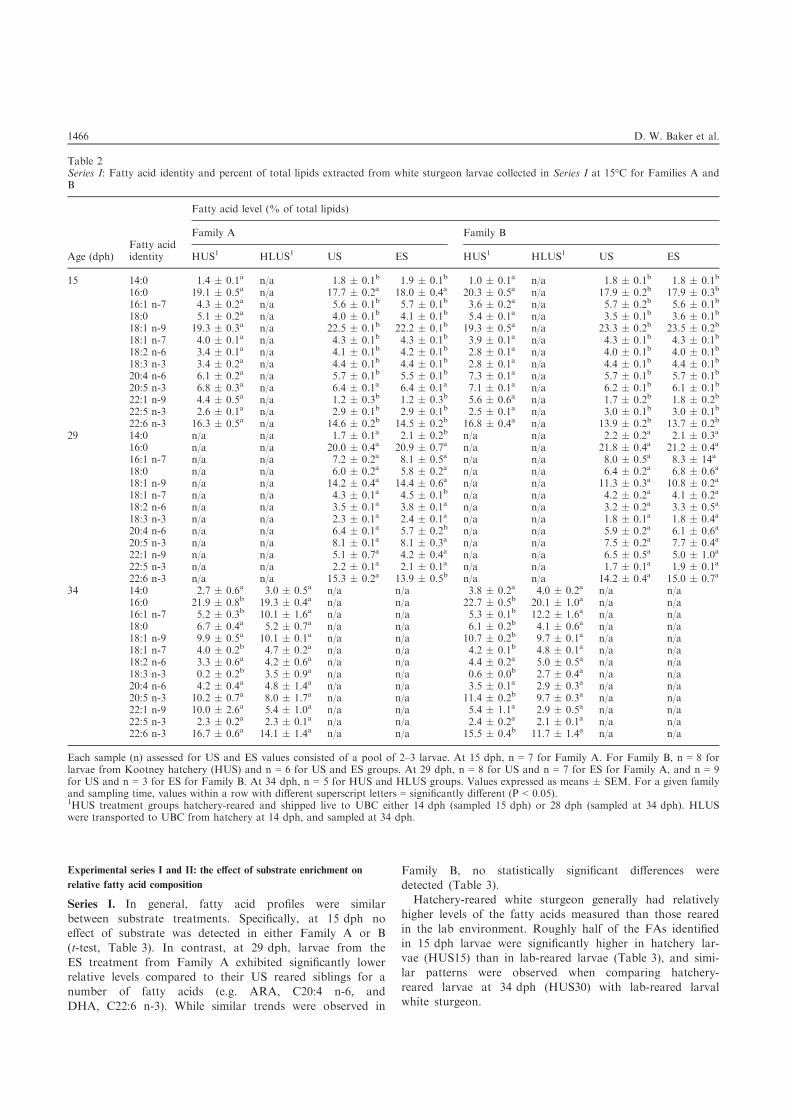
Series I. In general, fatty acid profiles were similar
between substrate treatments. Specifically, at 15 dph noeffect of substrate was detected in either Family A or B(t-test, Table 3). In contrast, at 29 dph, larvae from the
ES treatment from Family A exhibited significantly lowerrelative levels compared to their US reared siblings for anumber of fatty acids (e.g. ARA, C20:4 n-6, and
DHA, C22:6 n-3). While similar trends were observed in
Family B, no statistically significant differences weredetected (Table 3).Hatchery-reared white sturgeon generally had relatively
higher levels of the fatty acids measured than those reared
in the lab environment. Roughly half of the FAs identifiedin 15 dph larvae were significantly higher in hatchery lar-vae (HUS15) than in lab-reared larvae (Table 3), and simi-
lar patterns were observed when comparing hatchery-reared larvae at 34 dph (HUS30) with lab-reared larvalwhite sturgeon.
Table 2Series I: Fatty acid identity and percent of total lipids extracted from white sturgeon larvae collected in Series I at 15°C for Families A andB
Each sample (n) assessed for US and ES values consisted of a pool of 2–3 larvae. At 15 dph, n = 7 for Family A. For Family B, n = 8 forlarvae from Kootney hatchery (HUS) and n = 6 for US and ES groups. At 29 dph, n = 8 for US and n = 7 for ES for Family A, and n = 9for US and n = 3 for ES for Family B. At 34 dph, n = 5 for HUS and HLUS groups. Values expressed as means � SEM. For a given familyand sampling time, values within a row with different superscript letters = significantly different (P < 0.05).1HUS treatment groups hatchery-reared and shipped live to UBC either 14 dph (sampled 15 dph) or 28 dph (sampled at 34 dph). HLUSwere transported to UBC from hatchery at 14 dph, and sampled at 34 dph.
1466 D. W. Baker et al.
Series II. Relative fatty acid levels in ES larvae were gener-ally higher than those in US larvae, but this finding wasdependent to some extent on the family examined. For exam-
ple, in Family C, ES-exposed fish exhibited significantlyhigher levels for eight of the thirteen fatty acids, includingomega 3- and 6- fatty acids, at 30 dph than their US coun-terparts (Table 3), while in Family D, ES larvae exhibited
levels of C14:0 and C18:2 n-6 (linoleic acid, LA), roughlytwice that of US larvae (Table 3). Similar respective trendswere observed within each family at 40 dph, although differ-
ences were less pronounced. Again, ES sturgeon from FamilyC had levels of C14:0, C16:1 n-7 and LA that weresignificantly greater than those in US larvae, but in Family
D, levels of omega 3 essential fatty acids – EPA, DPA andDHA – were 22, 23 and 17% higher, respectively, in ES lar-vae (Table 3). Thus, despite significant effects existing
between the two treatments, there is no clear pattern.
Fatty acid ratios
Fatty acid ratios have been relied on as a means to identifytrends and treatment effects based on described biochemicalrelationships between FAs (e.g. ARA and heneicosapentae-
noic acid, HPA). Although relative fatty acid composition
0
1
2
3
4
5
Family A Family B
*
0
1
2
3
4
5
Family A Family B
a
a
a
b
0
1
2
3
4
5
Family A Family B
**
*
Ucr
it (b
l s–1
)
(a)
(b)
(c)
Fig. 1. Differences in maximal sustainable aerobic swimming speed(Ucrit) of larval white sturgeon between substrate treatments [unen-riched substrate (US; black bars) vs enriched substrate (ES; mediumgray bars)] in Series I at (a) 15°C at 15 dph and (b) 18°C at 15 dph,and (c) at 15°C 30 dph. Dark grey and light gray bars = hatcheryreared larvae (HUS) and hatchery and lab reared (HLUS) groups,respectively. Values expressed as means � SEM, N = 8 per group.Asterisk = a statistically significant difference from unenriched sub-strates within families. Letters that differ = significant differencesbetween all treatment groups.
0
20
40
60
80
Family A Family B
A
AB B
B
0
20
40
60
80
Family A Family B
Star
tle re
actio
n re
spon
se ti
me (
ms)
(a)
(b)
Fig. 2. Differences in startle response reaction time of larval whitesturgeon between substrate treatments [unenriched substrate (US;black bars) vs enriched substrate (ES; light gray bars)] in Series I at(a) 15°C and (b) 18°C at 15 dph. Values expressed as means �SEM, N = 10 per group. Letters that differ = significant differencesbetween groups.
Swimming performance of Acipenser transmontanus larvae 1467
results differ somewhat between Series I and II, both sets ofdata were combined to improve statistical confidence andbetter illustrate overall trends. We acknowledge, however,that these pooled results yield findings that should be inter-
preted with caution.Some fatty acid ratios were affected by whether yolksac
larvae were exposed to ES or US. For example, while the
ratios of both omega 3 to omega 6, and EPA to ARAincreased significantly with development in both treatment
groups (Fig. 5b,c), the rates of these increases were signifi-cantly higher in larval sturgeon reared with ES: that is, therewas a significant difference in the slopes of the ratios overtime between rearing conditions (t-test, Fig. 5b,c). Con-
versely, the relative amount of DHA to EPA decreased withdevelopment (Fig. 5a), but the rate of decrease was notaffected by substrate exposure history (Fig. 5a). All larvae
irrespective of substrate condition exhibited a decrease in theessential fatty acid deficiency index from roughly 1.0 at
Fig. 3. Effect of substrate (enriched, open symbols vs unenriched, filled symbols) on white sturgeon larval wet weight (a, b), length (c, d) andcondition factor (e, f) during development in Family C (squares; a,c,e) and d (diamonds; b,d,f) in Series II. Values expressed as means �SEM (n = 20). For a given time point (dph), an asterisk indicates a statistically significant difference between substrates (P < 0.05).
Fig. 4. Representative images of digestive tract morphology of white sturgeon larvae following exposure to enriched (ES) or unenriched (US)substrates at 15 dph in Families C and D in Series II. Numbers in labels = individuals (i.e. ES1 is a different animal than ES2). Top leftmicrograph scale bar = 2 mm. All other micrographs taken at same magnification and scaled equally.
1468 D. W. Baker et al.
15 dph to 0.6 by 30 dph and then a stabilization at approx.
0.5 by 40 dph until the termination of the experiment(Fig. 5d). As with the condition factor, this is likely a naturaltrend associated with early development that has not been
previously reported for sturgeon.
Discussion
The findings of this study demonstrate that exposure toenriched substrates during the early life history of white stur-geon was beneficial overall, and so expand on prior findings
regarding growth and physiological effects (Boucher, 2012;Boucher et al., 2014). Here we determined that white stur-geon larval growth and condition factor, gut development,
Ucrit, SRRT, and FA composition were all altered whenreared in the absence of enriched substrates, although tem-perature and parentage in some cases mediated or exacer-
bated those effects. The identification of more phenotypiclimitations associated with poor substrate conditions in stur-geon provides further support (see also Gessner et al., 2009;
Zubair et al., 2012; Boucher et al., 2014) for the causal linksbetween reduced substrate complexity (i.e. loss of interstitialhabitats) and recruitment limitations (McAdam et al., 2005;Paragamian et al., 2009; McAdam, 2012).
Substrate effects on growth and development
Consistent with other studies (Gessner et al., 2009; Boucheret al., 2014), yolksac larvae reared under an enriched sub-strate regime exhibited enhanced growth and higher condi-tion factors. This effect was, however, family and
temperature dependent, as well as more pronounced in SeriesII. Substrate enrichment has been observed to affect growthin salmonids (Peterson and Martin-Robichaud, 1995; Kih-
slinger and Nevitt, 2006) and other species (e.g. robust red-horse, Moxostoma robustum; Jennings et al., 2010). Whilethere are exceptions, in general increased size can confer sub-
stantial survival benefits (Fuiman, 2002).Delayed development of a functional gastric stomach
and the initiation of feeding as a result of early rearingconditions may provide a potential mechanism for the high
mortality rate commonly observed in lab or hatcheryrearing of many sturgeon species (e.g. Asgari et al., 2014).Histology revealed developmental differences in the gastro-
intestinal system between treatments, including greaterdevelopment of stomach musculature and more rapid yolkabsorption in the ES treatments (Fig. 4). While it is per-
haps not surprising that prolonged retention of the yolksacin US was associated with delayed gut development, webelieve these findings would likely represent negative effects
Table 3Series II: Identity and total lipid percentage of fatty acids extracted from white sturgeon larvae collected in Series II
Fish sampled at 30 and 40 dph for both Families C and D (n = 10). Values expressed as means � SEM. For a given family and samplingtime, values within a row with different superscript letters = significantly different (P < 0.05).
Swimming performance of Acipenser transmontanus larvae 1469
on larval quality based on interpretation of larval qualityindicators observed in other fishes (e.g. Theilacker andWatanabe, 1989). Most prior studies of early larval ontog-
eny in sturgeon evaluate larvae reared without substrateenrichment. The provision of substrate during the yolksacphase may therefore provide a valuable modification torearing protocols (Boucher, 2012).
Substrate effects on Ucrit and SRRT
White sturgeon reared on US exhibited a Ucrit that was25.5% lower at 15 dph when reared at 18°C, but showedno significant effect when reared at 15°C. Recently demon-
strated was that sturgeon reared in ES exhibit a greatermetabolic scope (difference between maxima and restingmetabolic rate; Boucher, 2012) – this increase may help
explain our finding of an Ucrit effect of US only at an ele-vated temperature (18°C). The addition of a second stres-sor (e.g. temperature) may exacerbate substrate effectswhen combined with an exercise challenge. Alternately,
given the effect of temperature on the rate of development,the difference in Ucrit may be related to life history charac-teristics or ontogeny.
Larvae reared on ES exhibited a 20% shorter SRRT com-pared to those reared with US at 15°C, but not at 18°C. Thebasis for the differential effect of temperature is unknown,
but may again be related to the different developmentalstages of the animals at the different temperatures. It is likelythat the SRRT informs on life history relevant traits, such as
predator avoidance, however, further studies are required toinvestigate this directly.
Substrate effects on fatty acid composition
FA profiles for sturgeon larvae were generally similar tothose of other fish, with the functionally important palmitic(C16:0) and oleic (C18:1n-9) fatty acids (Rainuzzo et al.,
1997) as the principal saturated and monounsaturated fattyacid and DHA (important in neural activity, Tocher, 2003)as the predominant polyunsaturated fatty acid. White stur-
geon larvae exhibited a DHA/EPA ratio of about 2.0, andsimilar results have been observed in some other sturgeonspecies (Gershanovich, 1989). Interestingly, EFADI valueswere not significantly different between US and ES treat-
ments and were similar to those found for other fishes. Forexample, EFADI was on average 0.44 for wild-caught mar-ine fish (Takeuchi, 1997) and between 0.35 and 1.08 for lab-
reared Chilean flounder (Wilson, 2009). In white sturgeon inthis study, EFADI declined from 1.03 to 0.57 from 15 to40 dph. Thus, despite reduced growth associated with US,
no indications of energetic limitations associated with feedavailability or absorption were observed based on EFADI.Of particular importance was the finding that relative dif-
ferences in some FA ratios between larvae reared onenriched substrates became greater, not less, over time (up to40 dph). Both EPA:ARA and omega 3:omega 6 ratiosincreased more rapidly in larvae reared on ES during ontog-
eny (t-test), this difference due primarily to lower concentra-tions of ARA. Variation in the FA ratios is associated withexposure to prior stressors (Sargent, 1995; Tocher, 2003),
and elevation of ARA has been associated with elevated cor-tisol, as ARA-derived eicosanoids are linked to productionof corticosteroids (Martins et al., 2012). The presence of ele-
vated cortisol in the absence of substrate enrichment in both
Fig. 5. Effect of substrate (enriched, open symbols, vs unenriched, filled symbols) on fatty acid ratios from both Series I and II during larvaldevelopment in Families A (circle), B (triangle), C (square) and D (diamond): (a) docosahexanenoic acid C22:6n-3/eicosapentaenoic acidC20:5n-3 (DHA/EPA), (b) eicosapentaenoic acid C20:5n-3 / arachidonic acid C20:4n-6 (EPA/ARA) (c) Omega 3/Omega 6 fatty acids and (d)essential fatty acid deficiency index. Ratios calculated from fatty acid percentages reported in Tables 1 and 2. Linear regressions calculatedusing individuals for each substrate condition (n = 63 for enriched and n = 69 for unenriched). Slopes of regression lines reported at the bot-tom left of each panel, where an asterisk indicates statistically different slopes between substrates (P < 0.05). Values expressed as means �SEM (n = 3–10).
1470 D. W. Baker et al.
lake sturgeon and white sturgeon (Zubair et al., 2012; Bateset al., 2014) may therefore be associated with slower develop-ment and reduced growth. Collectively, these findings suggestthat larvae reared on enriched substrates may be less likely
to exhibit chronic stress, a conclusion consistent withimproved stress tolerance in Persian sturgeon and beluga thatwere given fatty acid supplementation (Noori et al., 2011).
Conclusions
Through investigation of the role of substrate on early devel-opment of white sturgeon, we have demonstrated that rear-ing on bare or unenriched substrates over the first 10–12 dph
resulted in modest deleterious modifications to size, Ucrit andSRRT when assessed later during development, althoughthese effects could be mediated by parentage or rearing tem-perature. In addition, despite no evidence of malnutrition,
larvae reared in US exhibited an altered fatty acid profileand slower yolk utilization, although further analysis isrequired to determine the biological relevance of and mecha-
nisms associated with these differences. Clearly, the structuralcomplexity of substrates play an important role in white stur-geon development during early life phases, and we believe
this role may ultimately help explain rearing and recruitmentchallenges under captive and wild conditions.
Acknowledgements
This research was supported by the Habitat ConservationTrust Foundation. We thank Ben Speers-Roesch for advice
regarding lipid extraction and Karen Tattersall, StephanieWong, Keleigh McLaughlin and Jane Yoo for excellent tech-nical assistance.
References
Anderson, J. T., 1988: A review of size dependent survival duringpre-recruit stages of fishes in relation to recruitment. J. Northw.Atl. Fish. Sci. 8, 55–66.
Asgari, R.; Rafiee, G.; Shahrooz, R.; Agh, N.; Gisbert, E., 2014:Ontogeny of the digestive system in hatchery producing Beluga(Huso huso Linnaeus, 1758); a comparative study betweenBeluga and genus Acipenser. Aqua. Nutr. doi: 10.1111/anu.12113.
Bates, L. C.; Boucher, M. A.; Shrimpton, J. M., 2014: Effect of tem-perature and substrate on whole body cortisol and size of larvalwhite sturgeon Acipenser transmontanus. J. Appl. Ichthyol. 30,1259–1263.
Batzina, A.; Dalogiannis, D.; Dalla, C.; Papdopoulou-Daifoti, Z.;Chadio, S.; Karakatsouli, N., 2014: Blue substrate modifies thetime course of stress response in gilthead seabream Sparus aura-ta. J. Appl. Ichthyol. 420, 247–253.
Blazka, P., 1960: A new type of respirometer for the determinationof the metabolism of fish in an active state. Physiol. Bohemo-slov. 9, 553–558.
Bligh, E. G.; Dyer, W. J., 1959: A rapid method of total lipid extrac-tion and purification. Can. J. Biochem. Physiol. 37, 911–917.
Boucher, M., 2012: The effect of substrate rearing on the growth,development, and survival of larval white sturgeon (Acipensertransmontanus) during early ontogeny. M.Sc. thesis. Univ.Northern B.C. 84 pp.
Boucher, M. A.; McAdam, S. O.; Shrimpton, J. M., 2014: The effectof temperature and substrate on the growth, development andsurvival of larval white sturgeon. Aquaculture 430, 139–148. inreview.
Brauner, C. J.; Iwama, G. K.; Randall, D. J., 1994: The effect of short-duration seawater exposure on the swimming performance of wildand hatchery-reared juvenile coho salmon (Oncorhynchus kisutch)during smoltification. Can. J. Fish Aquat. Sci. 51, 2188–2194.
Brett, J. R., 1964: The respiratory metabolism and swimming perfor-mance of young sockeye salmon. J. Fish. Res. Board Can. 21,1183–1226.
COSEWIC (Committee on the Status of Endangered Wildlife inCanada), 2012: COSEWIC assessment and status report on thewhite sturgeon Acipenser transmontanus in Canada. Available:http://www.sararegistry.gc.ca/document/default_e.cfm?documen-tID =414 (accessed on November 2012).
Crossman, J. A.; Hildebrand, L. R., 2014: Evaluation of spawningsubstrate enhancement for white sturgeon in a regulated river:effects on larval retention and dispersal. Riv. Res. Appl. 30,1–10.
Domenici, P.; Lefrancois, C.; Shingles, A., 2007: Hypoxia and theantipredator behaviours of fishes. Phil. Trans. R. Soc. B 362,2105–2121.
Ferron, A.; Leggett, W. C., 1993: An appraisal of condition mea-sures for marine fish larvae. Adv. Mar. Biol. 30, 217–303.
Fuiman, L. A., 2002: Special considerations of fish eggs and larvae.In: Fishery Science: the unique contribution of early life stages.L. A. Fuiman and R. G. Werner (Eds.) Blackwell, Oxford, pp.1–32.
Fuiman, L. A.; Ojanguren, A. F., 2011: Fatty acid content of eggsdetermines antipredator performance of fish larvae. J. Exp.Mar. Biol. Ecol. 407, 155–165.
Gadomski, D. M.; Parsley, M. J., 2005: Effects of turbidity, lightlevel, and cover on predation of white sturgeon larvae by pricklysculpins. Trans. Am. Fish. Soc. 134, 369–374.
Gershanovich, A. D., 1989: Lipid mobilization during early develop-ment of sturgeons. In: Acipenser: Actes du premier colloqueinternational sur l’esturgeon. P. Williot (Ed.). Cemagref Publica-tion, Bordeaux, France, pp. 41–52.
Gessner, J.; Kamerichs, C. M.; Kloas, W.; Wuertz, S., 2009:Behavioural and physiological responses in early life phases ofAtlantic sturgeon (Acipenser oxyrinchus Mitchill 1815) towardsdifferent substrates. J. Appl. Ichthyol. 25, 83–90.
Grant, A. M.; Baker, D.; Higgs, D.; Brauner, C. J.; Richards, J. G.;Balfry, S. K.; Schulte, P. M., 2008: Effects of dietary canola oillevel on growth, fatty acid composition and osmoregulatoryability of juvenile fall chinook salmon (Oncorhynchus tsha-wytscha). Aquaculture 277, 303–312.
Jain, K. E.; Birtwell, I. K.; Farrell, A. P., 1998: Repeat swimmingperformance of mature sockeye salmon following a brief recov-ery period: a proposed measure of fish health and water quality.Can. J. Zool. 76, 1488–1496.
Jennings, C. A.; Dilts, E. W.; Shelton, J. L. Jr; Paterson, R. C.,2010: Fine sediment affects on survival to emergence of robustredhorse. Env. Biol. Fish. 87, 43–53.
Kihslinger, R. L.; Nevitt, G. A., 2006: Early rearing environmentimpacts cerebellar growth in juvenile salmon. J. Exp. Biol. 209,504–509.
Koven, W.; Barr, Y.; Lutzky, S.; Ben-Atia, I.; Weiss, R.; Harel, M.;Behrens, P.; Tandler, A., 2001: The effect of dietary arachidonicacid (20:4n-6) on growth, survival and resistance to handlingstress in gilthead seabream (Sparus aurata) larvae. Aquaculture193, 107–122.
Martins, D. A.; Rocha, F.; Mart�ınez-Rodr�ıguez, G.; Bell, G.;Morais, S.; Castanheira, F.; Bandarra, N.; Coutinho, J.; ManuelY�ufera, M.; Conceic�~ao, L. E. C., 2012: Teleost fish larvae adaptto dietary arachidonic acid supply through modulation of theexpression of lipid metabolism and stress response genes. Brit. J.Nutr. 108, 864–874.
McAdam, S. O., 2011: Effect of substrate condition on habitat useand survival by white sturgeon (Acipenser transmontanus) larvaeand potential implications for recruitment. Can. J. Fish Aquat.Sci. 68, 812–822.
McAdam, S. O., 2012: Diagnosing white sturgeon (Acipenser trans-montanus) recruitment failure and the importance of substrate
Swimming performance of Acipenser transmontanus larvae 1471
condition to yolksac larvae survival. Ph.D. thesis, University ofBritish Columbia. 175 pp.
McAdam, S. O.; Walters, C. J.; Nistor, C., 2005: Linkagesbetween white sturgeon recruitment and altered bed substratesin the Nechako River, Canada. Trans. Am. Fish. Soc. 134,1448–1456.
Navarro, J. C.; Sargent, J. R., 1992: Behavioural differences in starv-ing herring (Clupea harengus L.) larvae correlate with body lev-els of essential fatty acids. J. Fish Biol. 41, 509–513.
Nendick, L.; Grant, A.; Gardner, M.; Sackville, M.; Brauner, C. J.;Farrell, A. P., 2009: Swimming performance and associatedionic disturbance of juvenile pink salmon Oncorhynchusgorbuscha determined using different acceleration profiles. J.Fish Biol. 75, 1626–1638.
Noori, F.; Takami, G. A.; Van Speybroeck, M.; Van Stappen, G.;Sorgeloos, P., 2011: Feeding Acipenser persicus and Huso huso(Acipenseriformes) larvae with Artemia urmiana nauplii enrichedwith HUFA and vitamin C: II. Effect on tolerance to shock expo-sure of environmental factors. J. Appl. Ichthyol. 27, 787–795.
Paragamian, V. L.; McDonald, R.; Nelson, G. J.; Barton, G., 2009:Kootenai River velocities, depth, and white sturgeon spawning siteselection – a mystery unraveled? J. Appl. Ichthyol. 25, 640–646.
Peterson, R. H.; Martin-Robichaud, D. J., 1995: Yolk utilization byAtlantic salmon (Salmo salar L.) alevins in response to tempera-ture and substrate. Aquacult. Eng. 14, 85–99.
Rainuzzo, J. R.; Reitan, K. I.; Olsen, Y., 1997: The significance oflipids at early stages of marine fish: a review. Aquaculture 155,103–115.
Randall, D.; Brauner, C. J., 1991: Effects of environmental factorson exercise in fish. J. Exp. Biol. 160, 113–126.
Sargent, J. R., 1995: Origins and functions of egg lipid: nutritionalimplications. In: Broodstock management and egg and larvalquality. N. R. Bromage and R. J. Roberts (Eds.) Blackwell Sci-ence, Oxford, pp. 353–372.
Suboski, M.; Bain, S.; Carty, A. E.; McQuoid, L. M.; Seelen, M. I.;Seifert, M., 1990: Alarm reaction in acquisition and social trans-mission of simulated-predator recognition by zebra danio fish(Brachydanio rerio). J. Comp. Psych. 104, 101–112.
Takeuchi, T., 1997: Essential fatty acid requirements of aquatic ani-mal with emphasis on fish larvae and fingerlings. Rev. Fish. Sci.5, 1–25.
Theilacker, G. H.; Watanabe, Y., 1989: Midgut cell height definesnutritional status of laboratory raised larval northern anchovy,Engraulis mordax. Fish. Bull. 87, 457–469.
Tocher, D. R., 2003: Metabolism and functions of lipids and fattyacids in teleost fish. Rev. Fish. Sci. 11, 107–184.
Wilson, R., 2009: Dietary effects of n-3 highly unsaturated fatty acidlevels on egg and larval quality, and the fatty acid compositionof the eggs of Chilean flounder Paralichthys adspersus brood-stock. Aquacult. Res. 40, 1400–1409.
Zubair, S. N.; Peake, S. J.; Hare, J. F.; Anderson, W. G., 2012: Theeffect of temperature and substrate on the development of thecortisol stress response in the lake sturgeon, Acipenser fulves-cens, Rafinesque (1817). Environ. Biol. Fish. 93, 577–587.