Page 1
RIGHT:
URL:
CITATION:
AUTHOR(S):
ISSUE DATE:
TITLE:Nondestructive evaluation of larval development andfeeding behavior of the bamboo powderpost beetleDinoderus minutus in bamboo culms( Dissertation_全文 )
Watanabe, Hiroki
Watanabe, Hiroki. Nondestructive evaluation of larval development and feeding behavior of the bamboo powderpostbeetle Dinoderus minutus in bamboo culms. 京都大学, 2018, 博士(農学)
2018-03-26
https://doi.org/10.14989/doctor.k21140
Page 2
Nondestructive evaluation of larval
development and feeding behavior of
the bamboo powderpost beetle
Dinoderus minutus in bamboo culms
Hiroki WATANABE
2018
Page 3
Contents
General introduction ...................................................................................................................... 1
Chapter 1. Literature review and objectives .................................................................................. 5
1.1. Introduction ........................................................................................................................ 5
1.2. Insect pests of bamboo culms in Japan ............................................................................... 5
1.3. Studies on the biology and control of D. minutus and closely related species ................... 9
1.4. Nondestructive techniques for detecting insects and insect attack in wood ..................... 11
1.5. Objectives ......................................................................................................................... 15
Chapter 2. Evaluation of larval development and feeding behavior using X-ray computed
tomography ............................................................................................................. 16
2.1. Introduction ...................................................................................................................... 16
2.2. Visualization of larval growth process and tunneling process in infested bamboo culms 17
2.2.1. Materials and methods ............................................................................................... 17
2.2.2. Results and discussion on larval growth and tunneling observed in CT images ....... 19
2.3. Evaluation of individual egg-to-adult development and feeding behavior ...................... 25
2.3.1. Egg collecting ............................................................................................................ 25
2.3.2. Inoculation of larvae in bamboo and X-ray CT scanning .......................................... 27
2.3.3. Results and discussion on larval–pupal development and larval feeding .................. 30
2.3.4. Discussion on larval duration .................................................................................... 35
2.3.5. Pre-mating adult feeding ........................................................................................... 37
2.4. Summary .......................................................................................................................... 39
Chapter 3. Relationship between the movements of the mouthparts and the generation of
acoustic emission .................................................................................................... 41
3.1. Introduction ...................................................................................................................... 41
3.2. Materials and methods ...................................................................................................... 42
3.2.1. Experimental insects and bamboo specimens ............................................................ 42
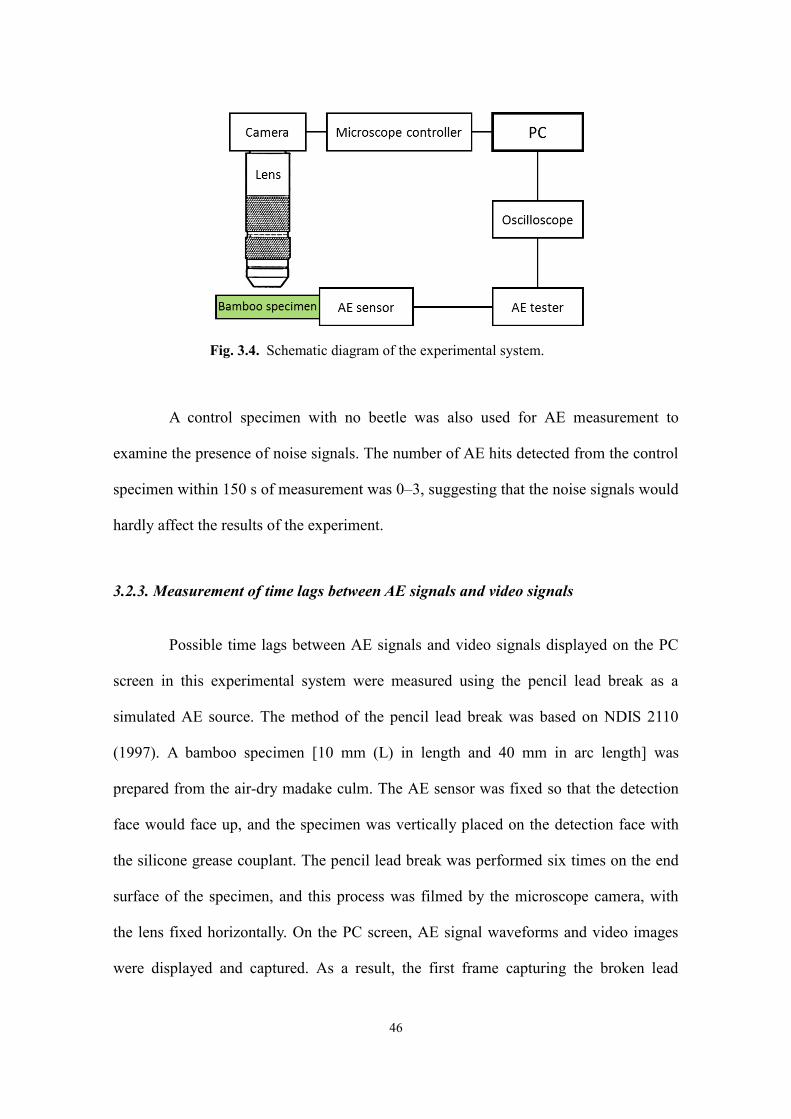
3.2.2. Apparatuses ............................................................................................................... 44
3.2.3. Measurement of time lags between AE signals and video signals ............................ 46
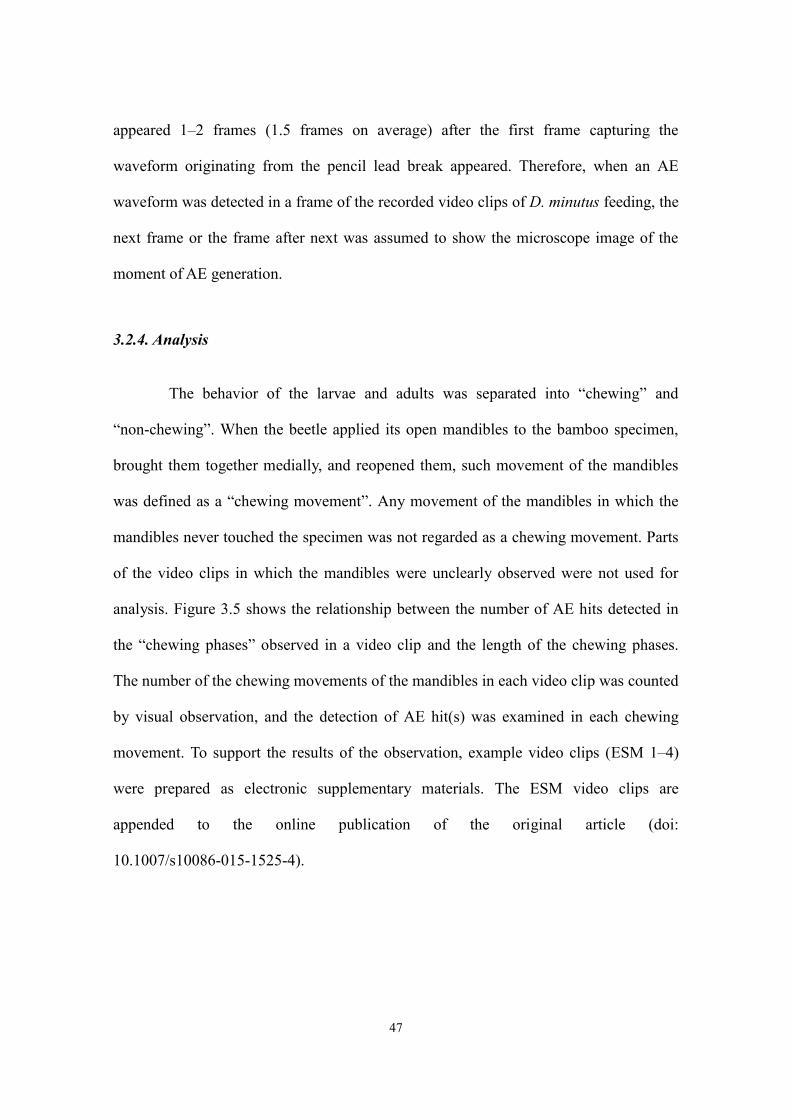
3.2.4. Analysis ..................................................................................................................... 47
3.3. Results and discussion ...................................................................................................... 48
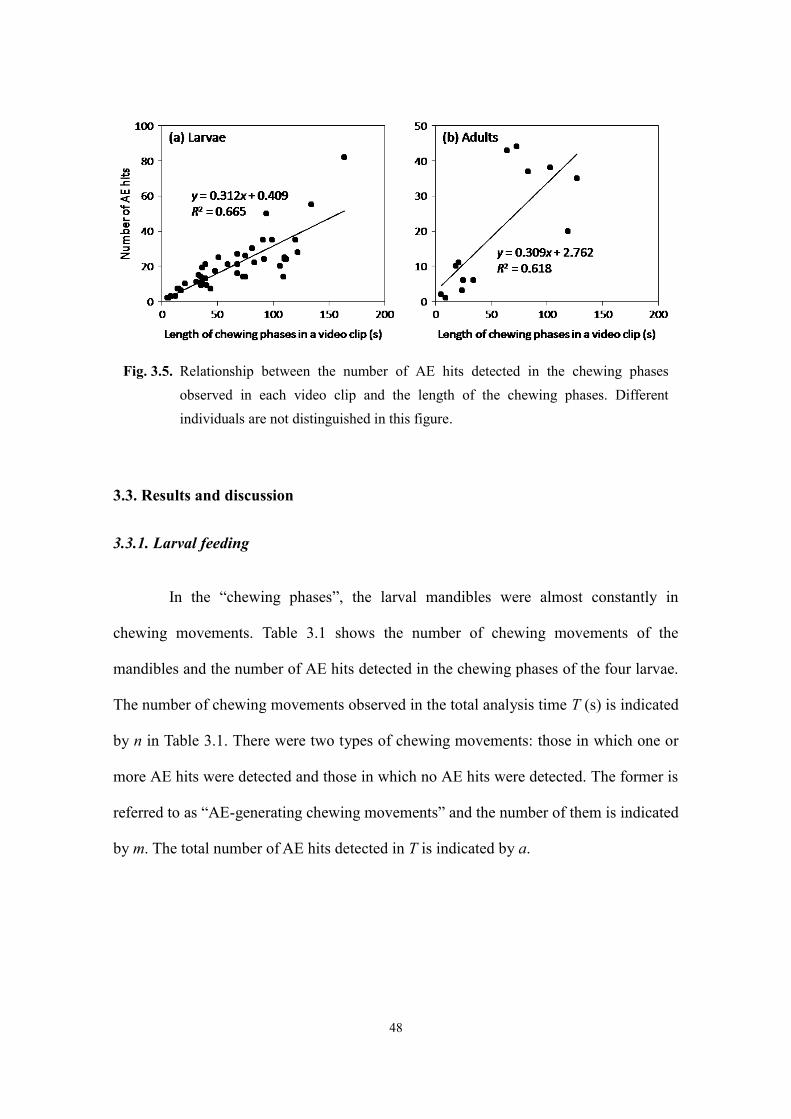
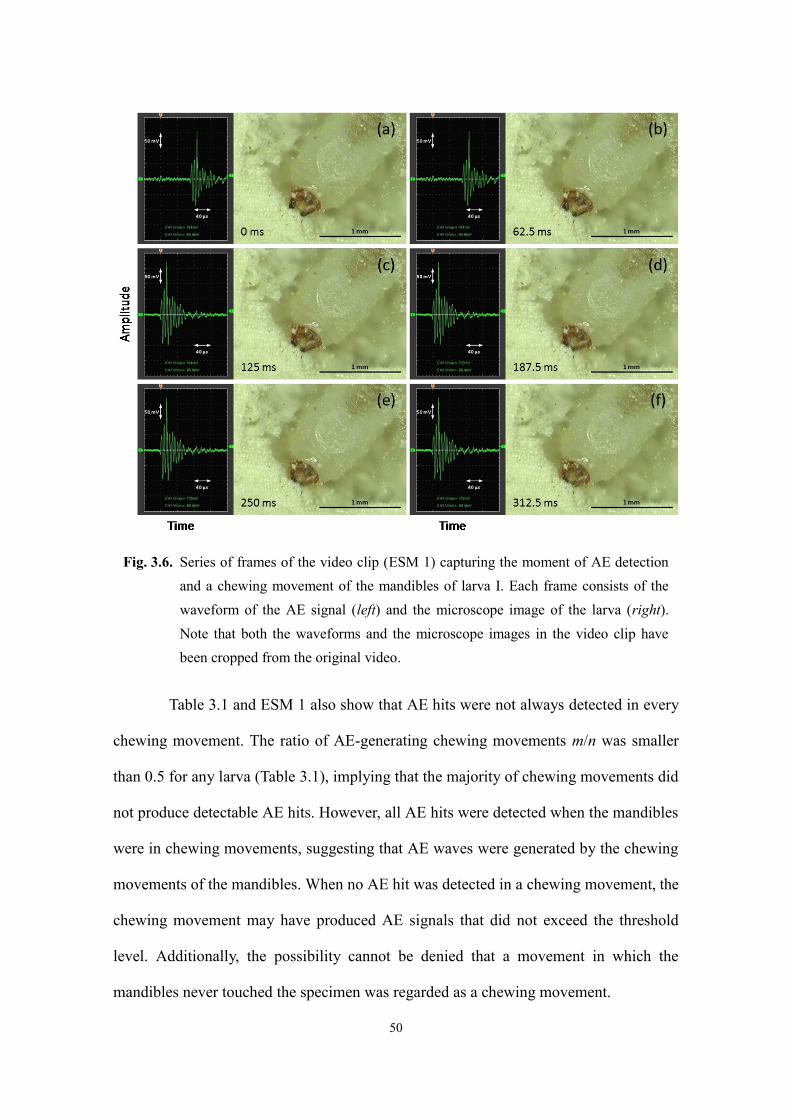
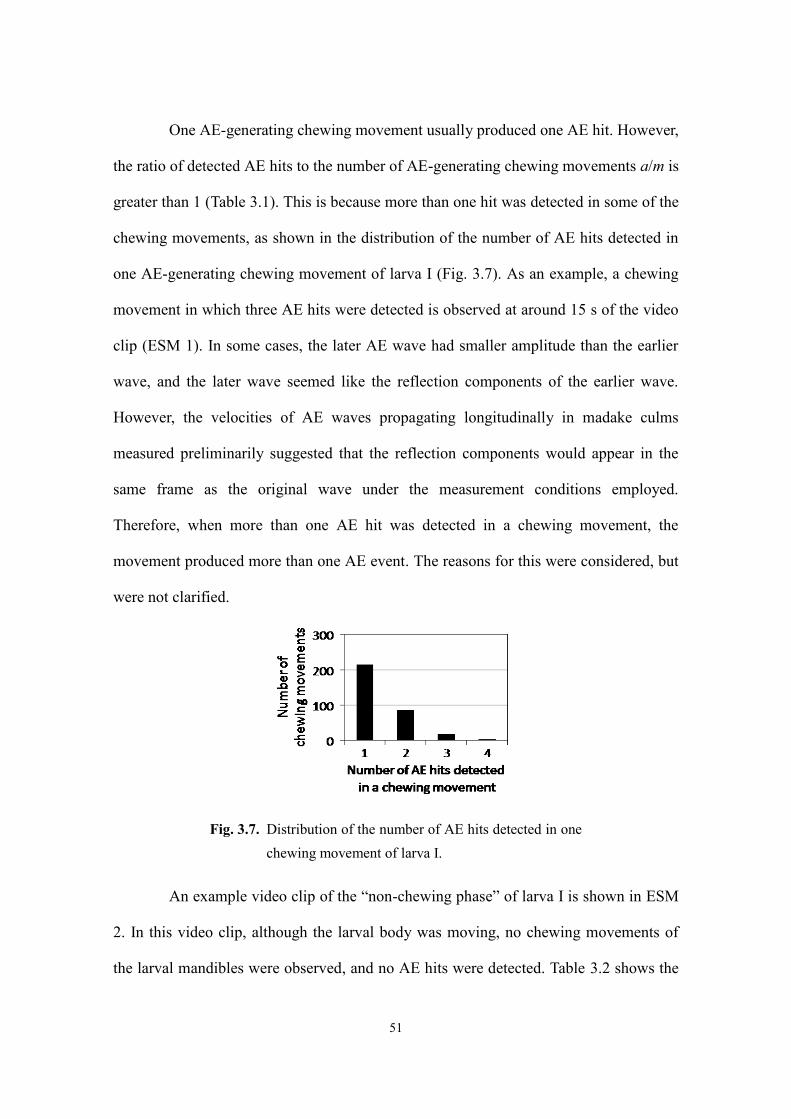
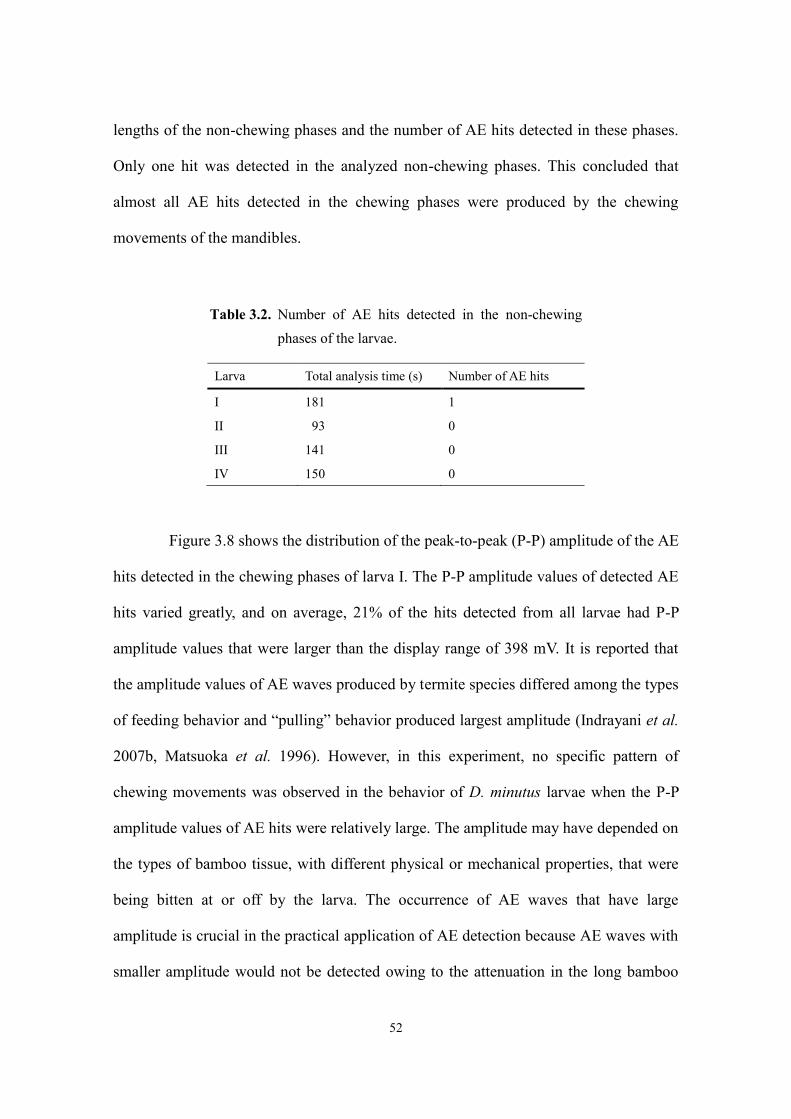
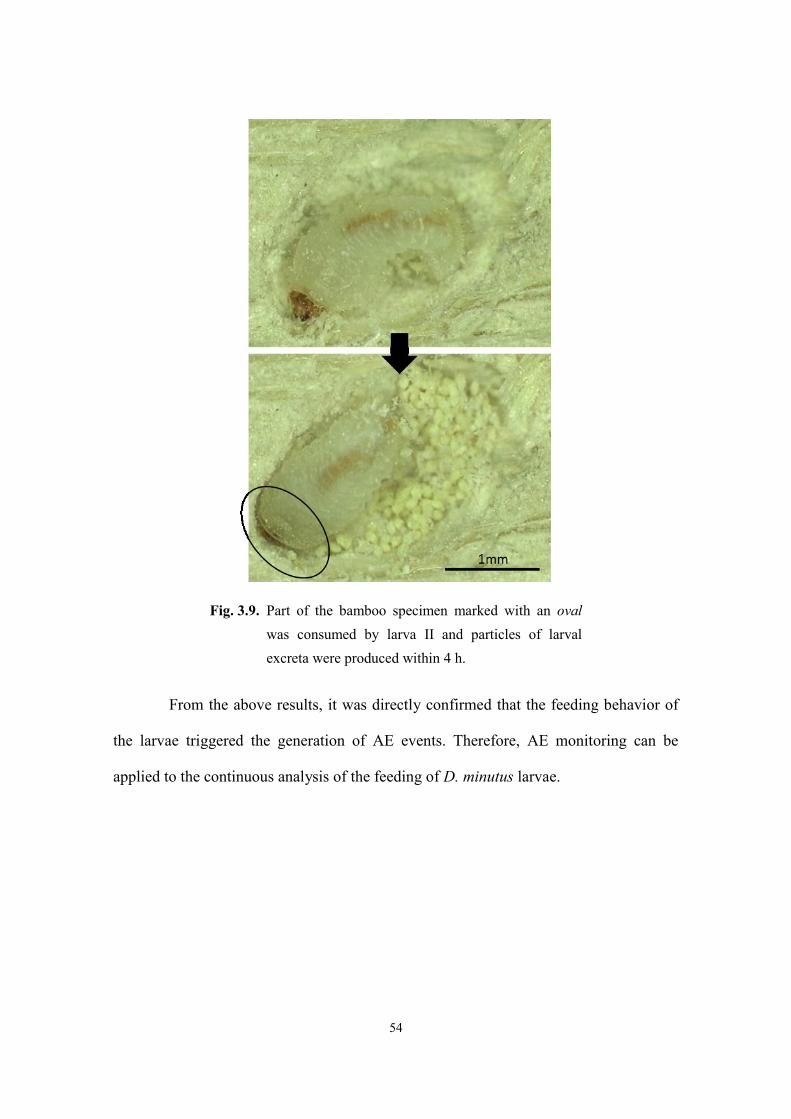
3.3.1. Larval feeding ............................................................................................................ 48
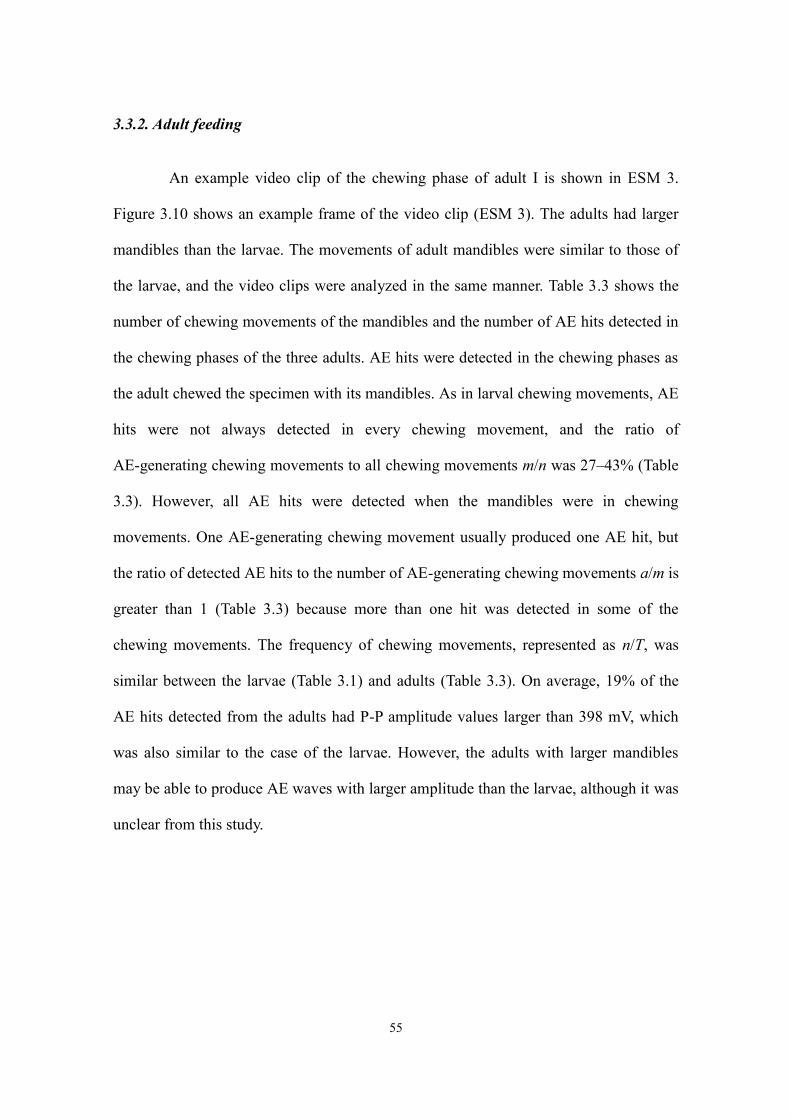
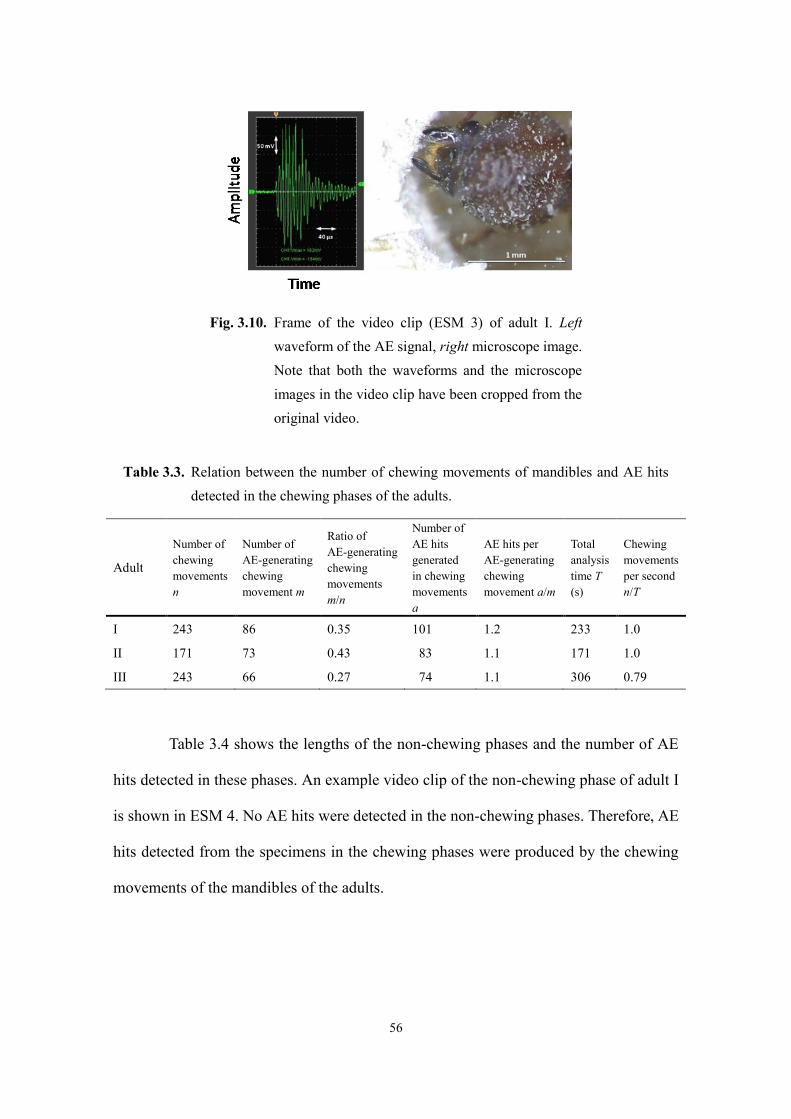
3.3.2. Adult feeding ............................................................................................................. 55
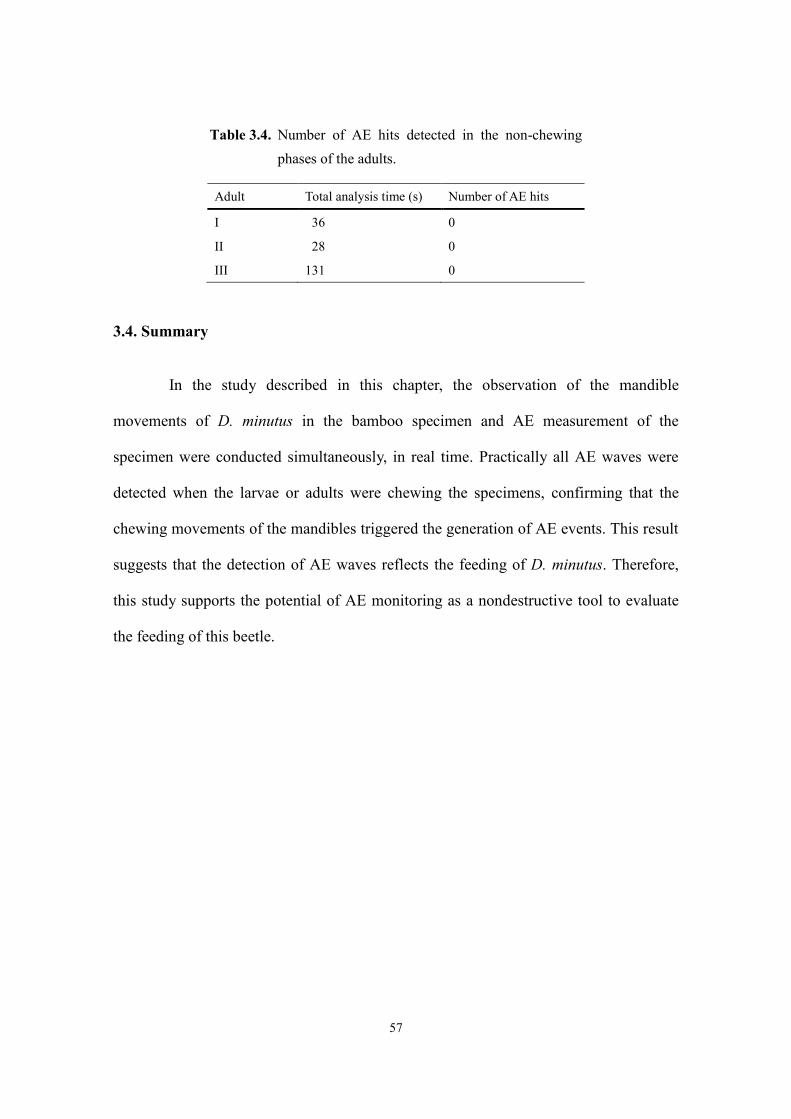
3.4. Summary .......................................................................................................................... 57
Page 4
Chapter 4. Combined use of acoustic emission and X-ray computed tomography to monitor
larval feeding activity and development .................................................................. 58
4.1. Introduction ...................................................................................................................... 58
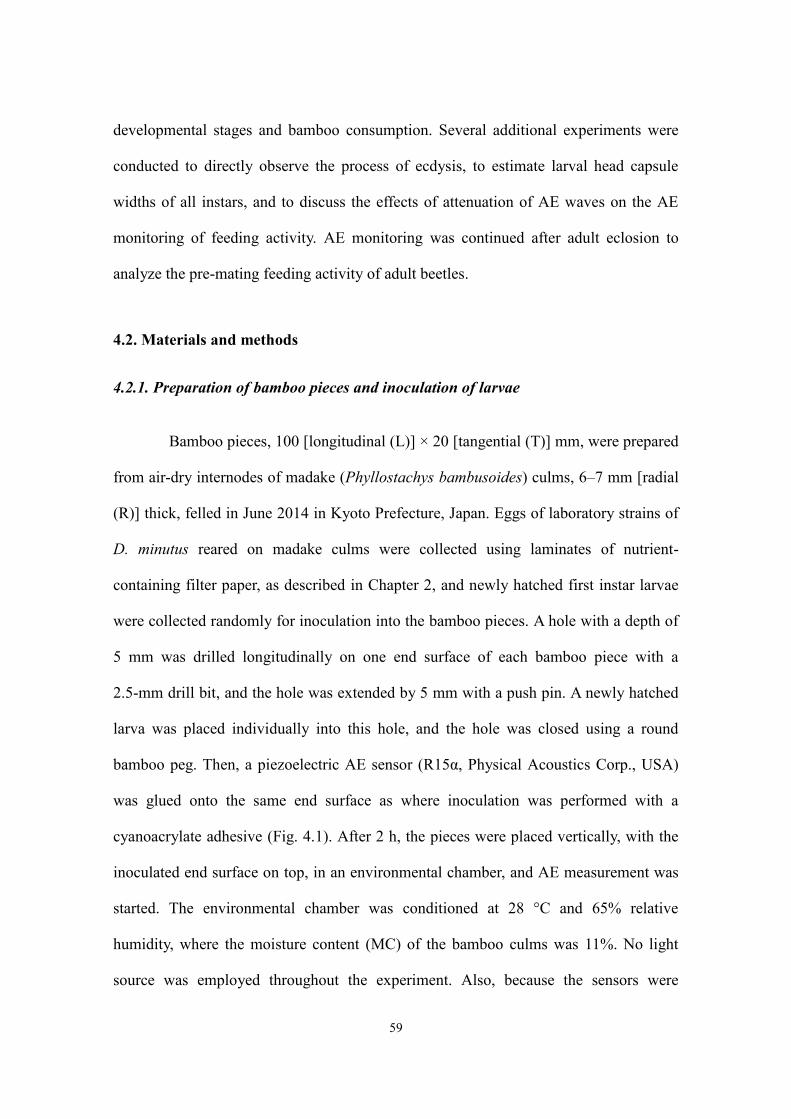
4.2. Materials and methods ...................................................................................................... 59
4.2.1. Preparation of bamboo pieces and inoculation of larvae ........................................... 59
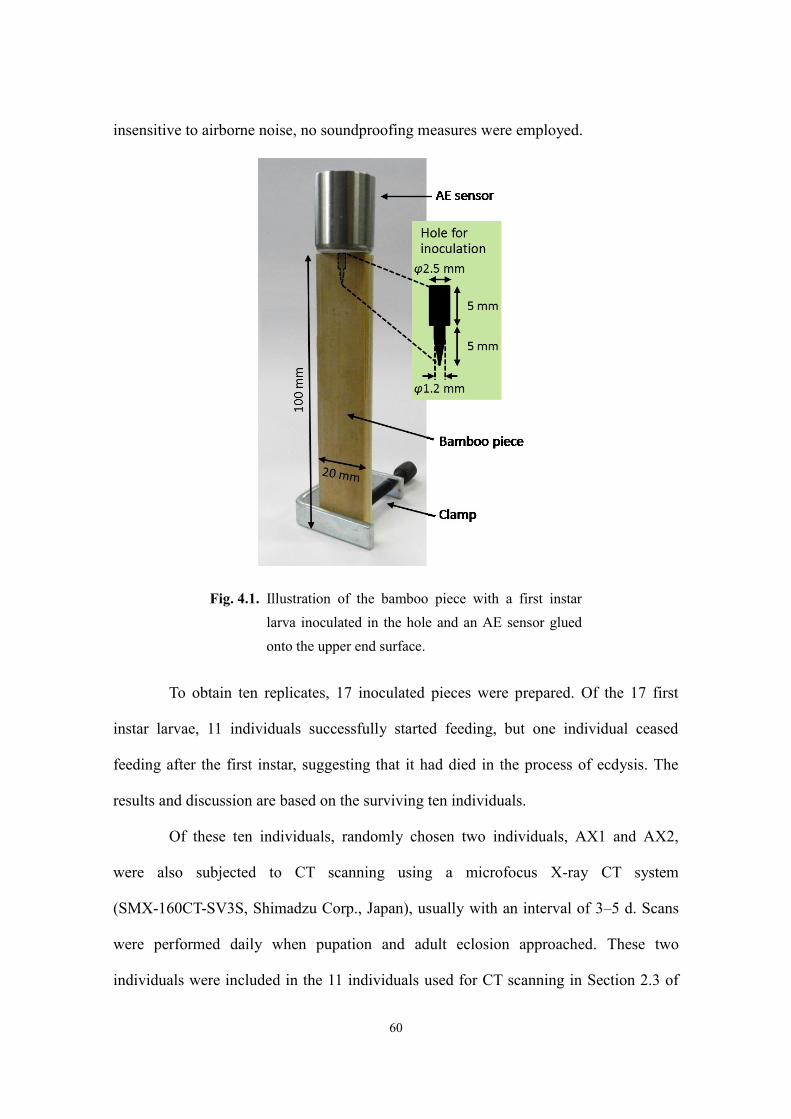
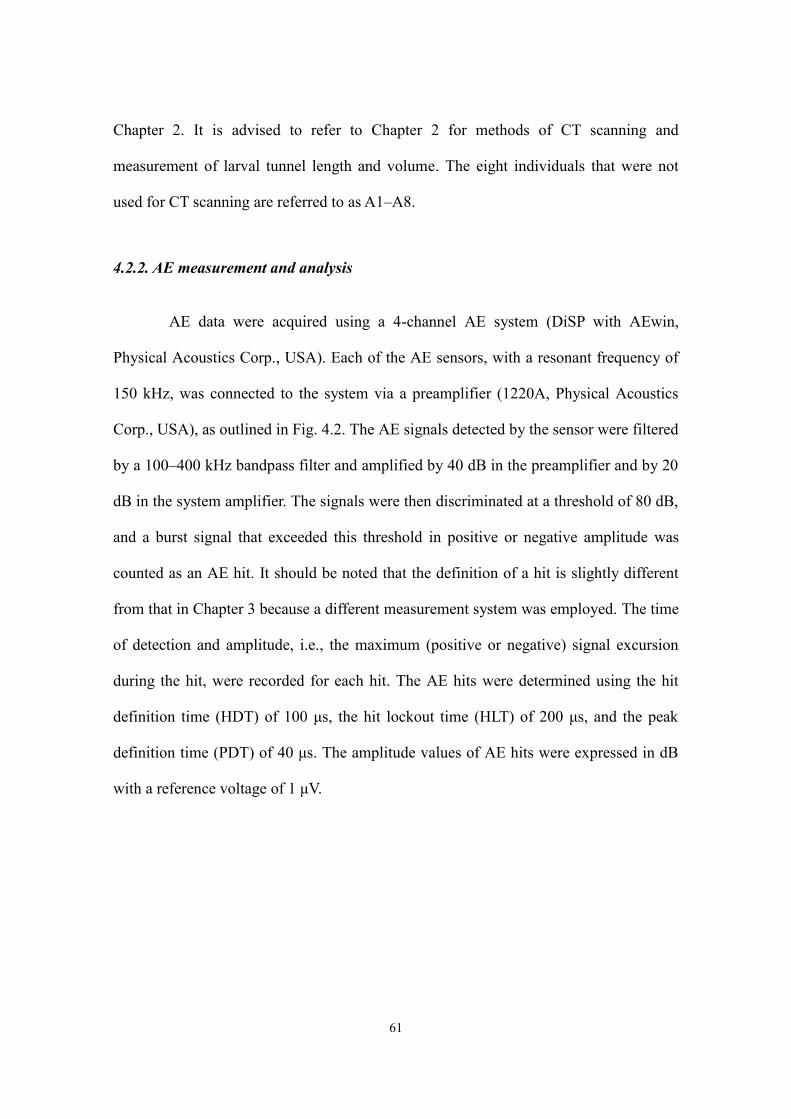
4.2.2. AE measurement and analysis ................................................................................... 61
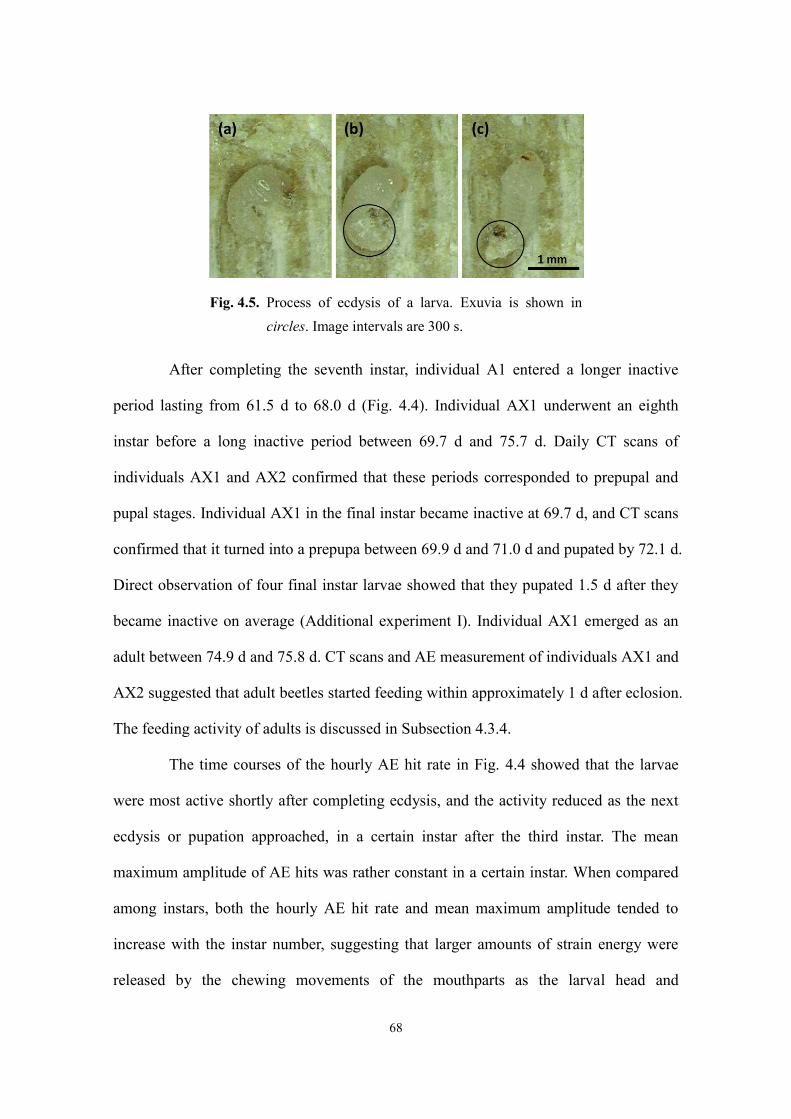
4.2.3. Direct observation of ecdysis and pupation (Additional experiment I) ..................... 62
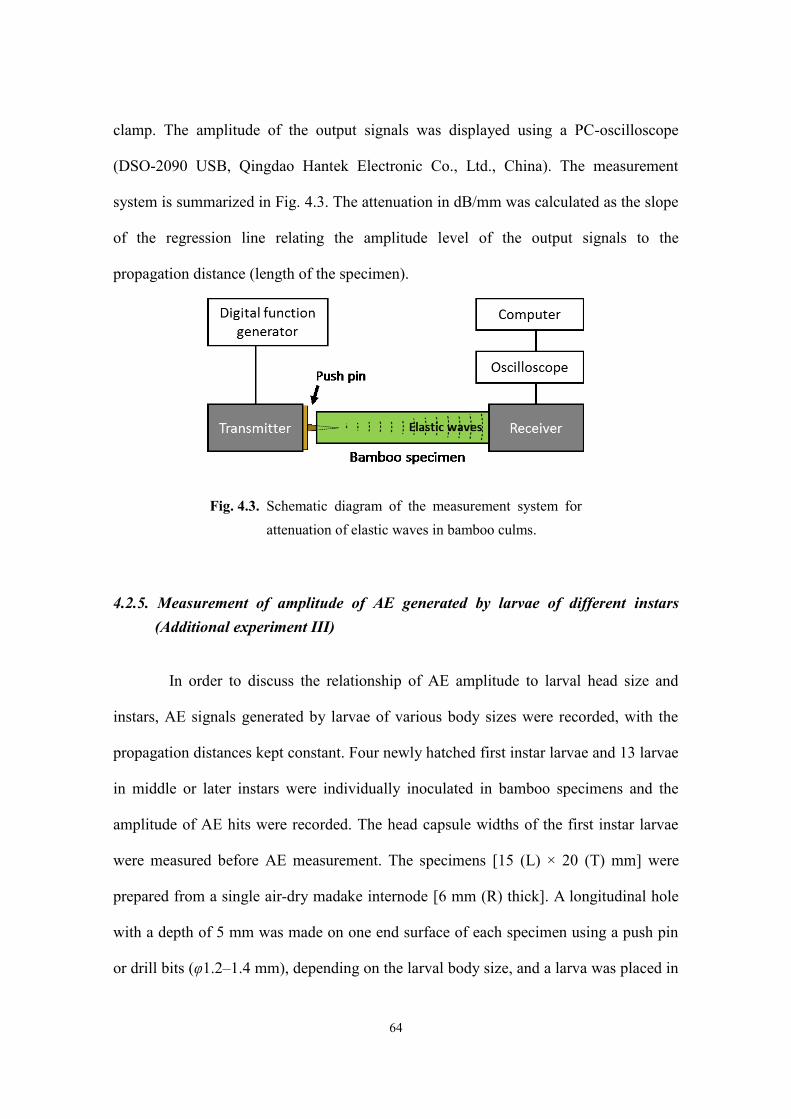
4.2.4. Measurement of distance attenuation of elastic waves in bamboo (Additional
experiment II) ............................................................................................................ 63
4.2.5. Measurement of amplitude of AE generated by larvae of different instars (Additional
experiment III) .......................................................................................................... 64
4.2.6. Estimation of head capsule widths of all instars (Additional experiment IV) ........... 65
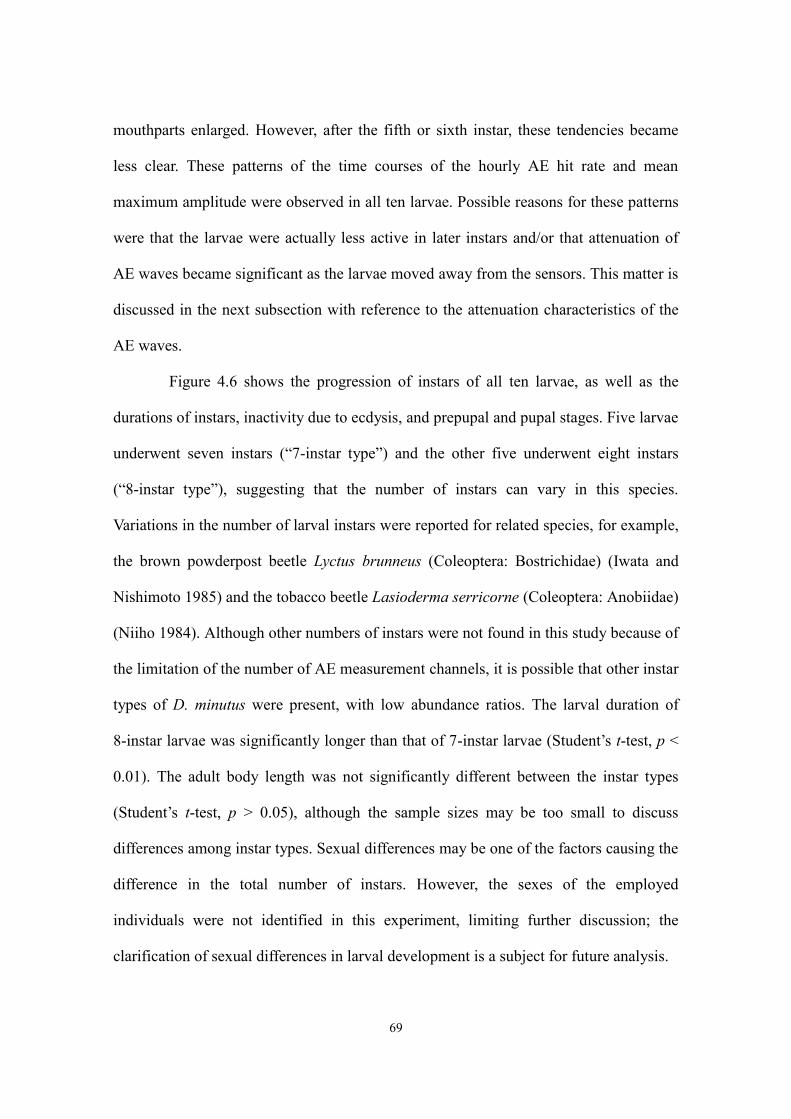
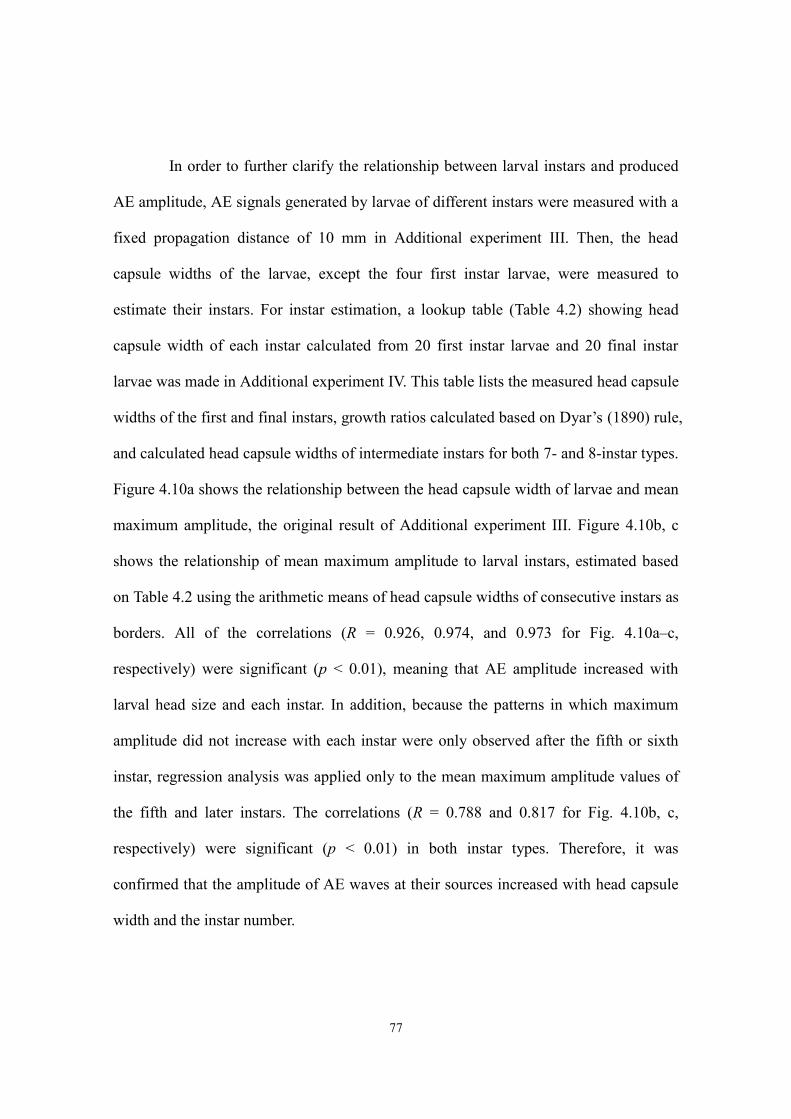
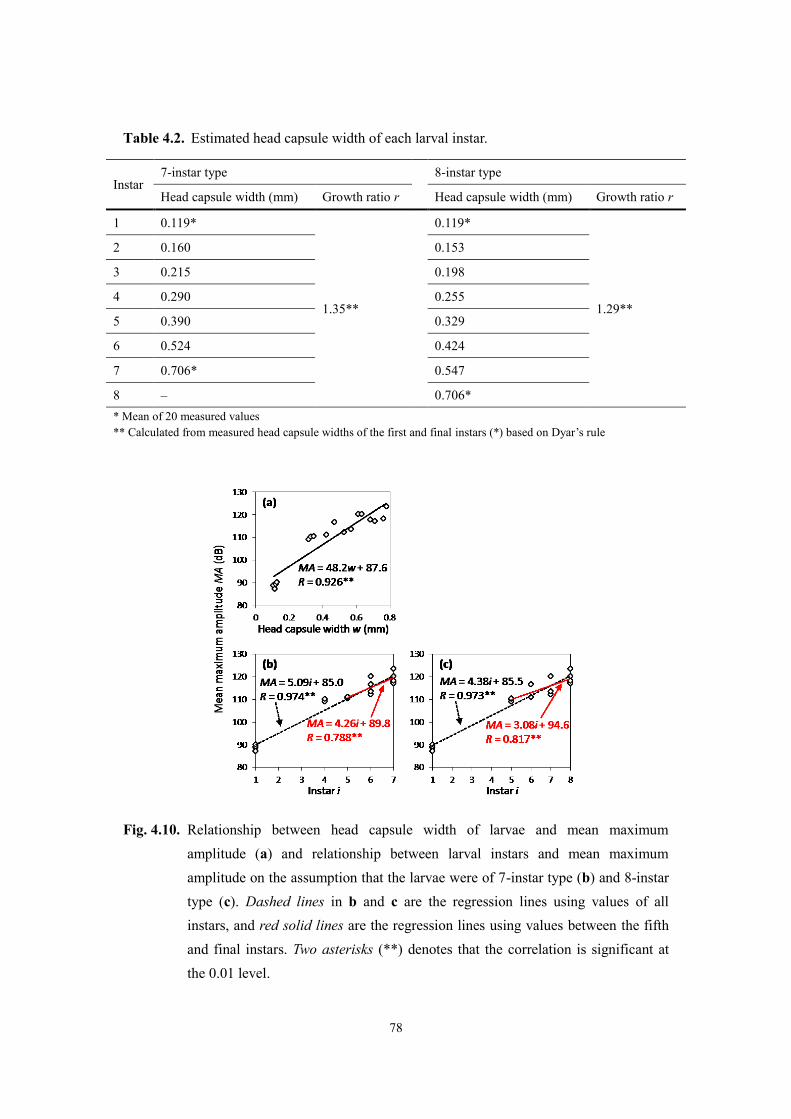
4.3. Results and discussion ...................................................................................................... 66
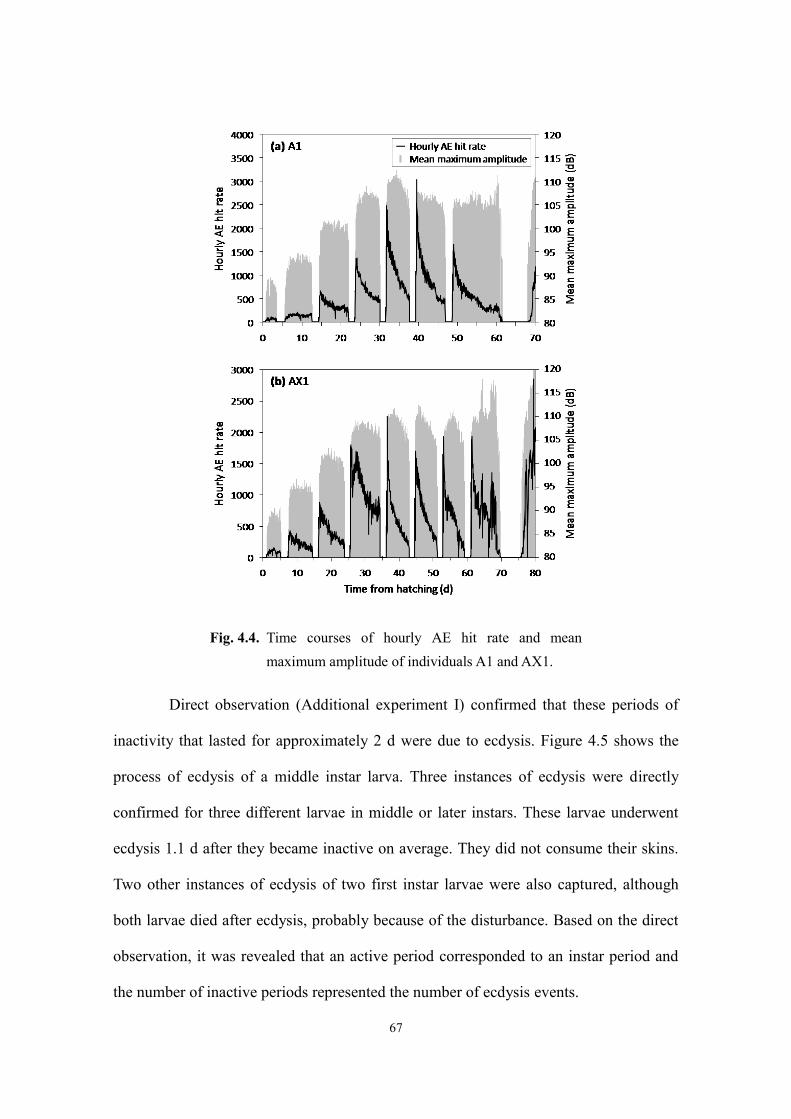
4.3.1. Feeding activity and development from the first instar to adult eclosion .................. 66
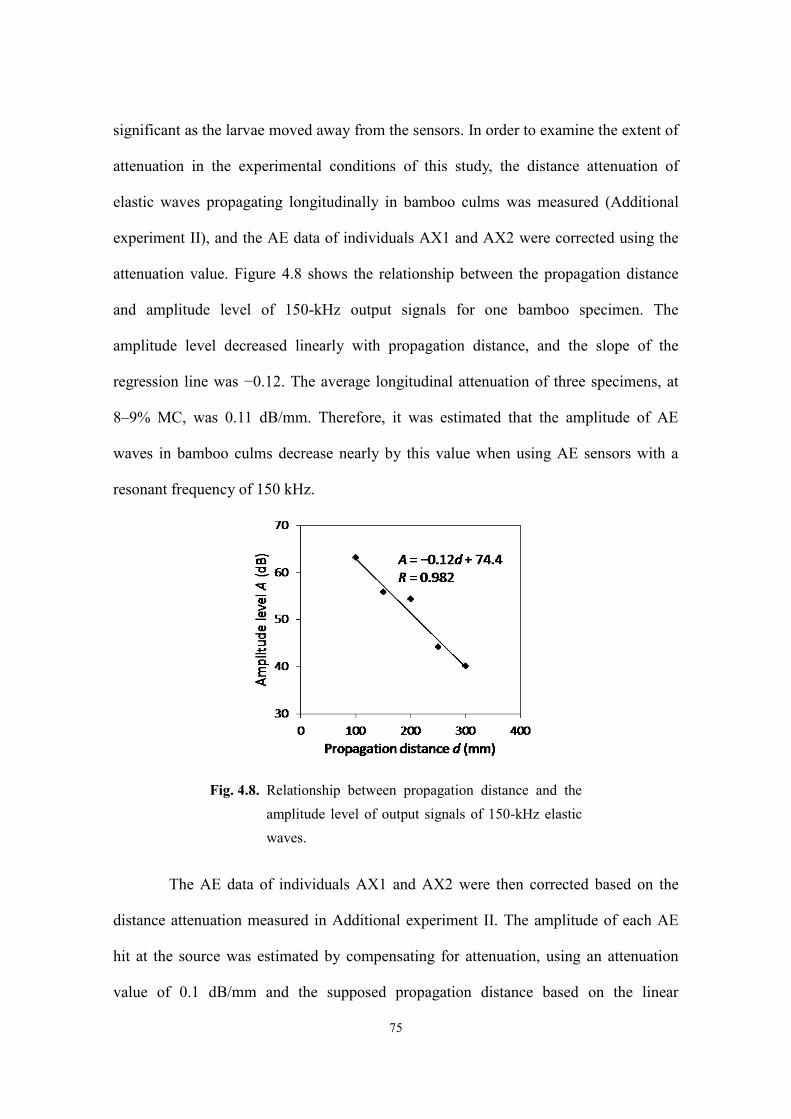
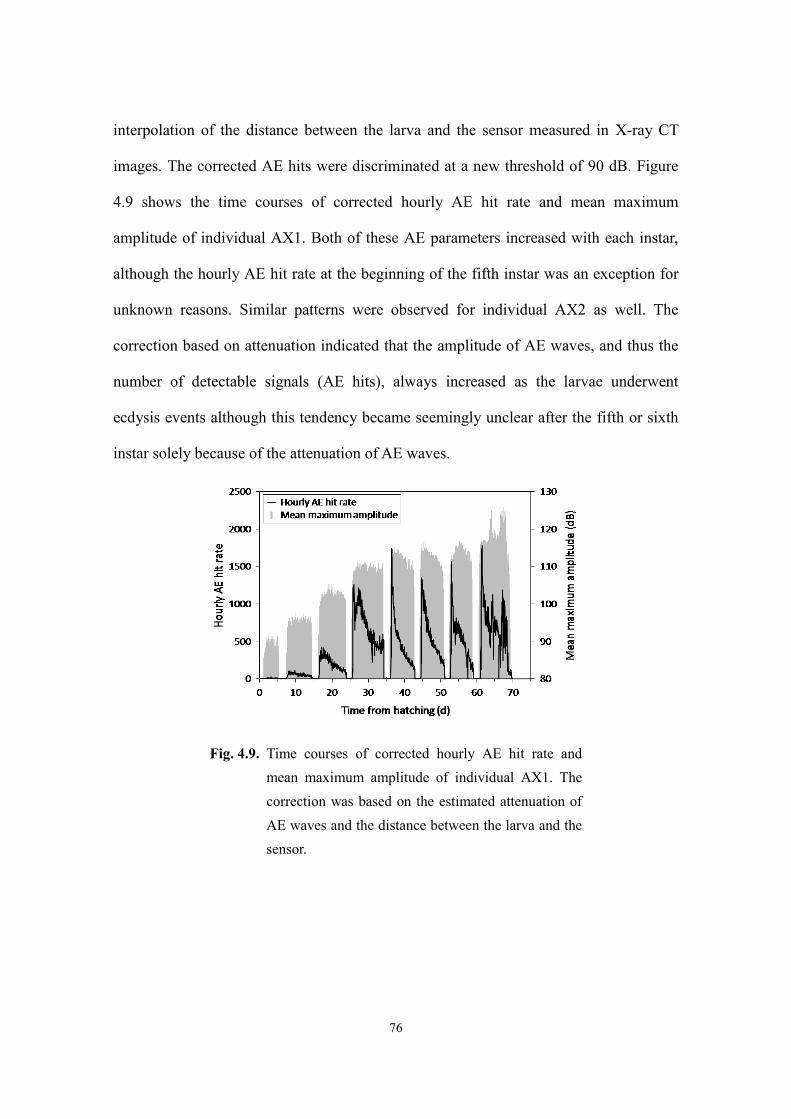
4.3.2. Effects of attenuation of AE waves ........................................................................... 74
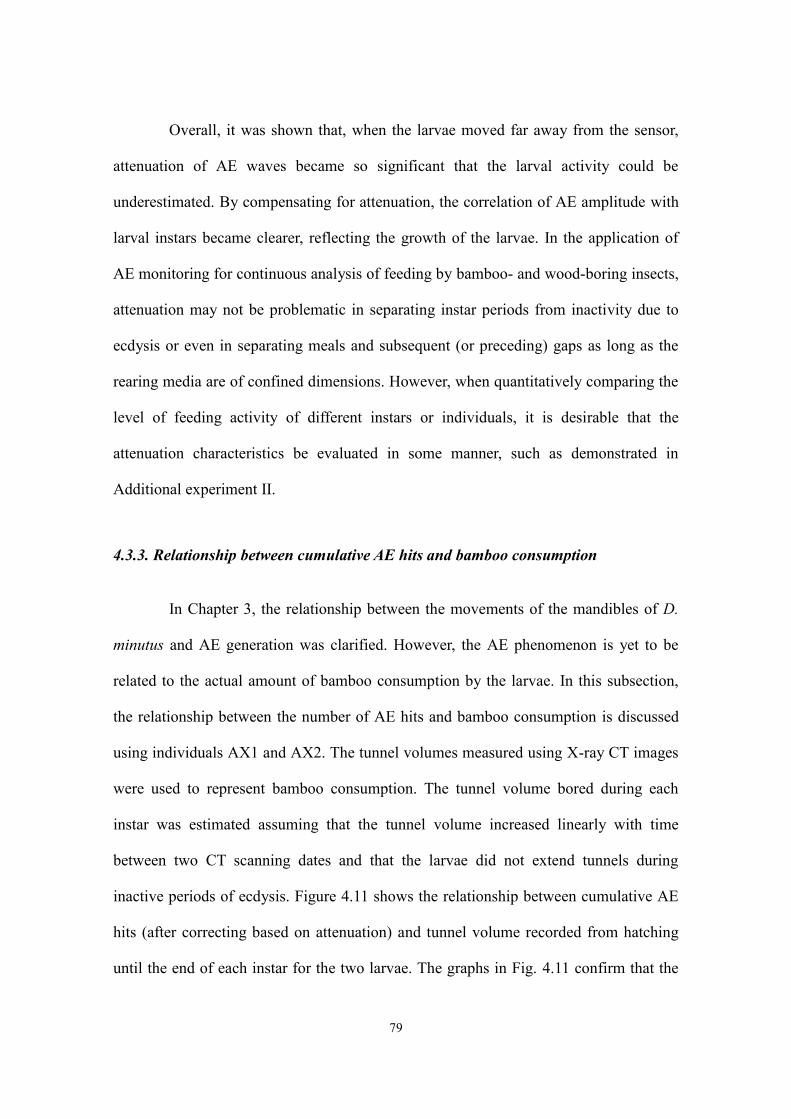
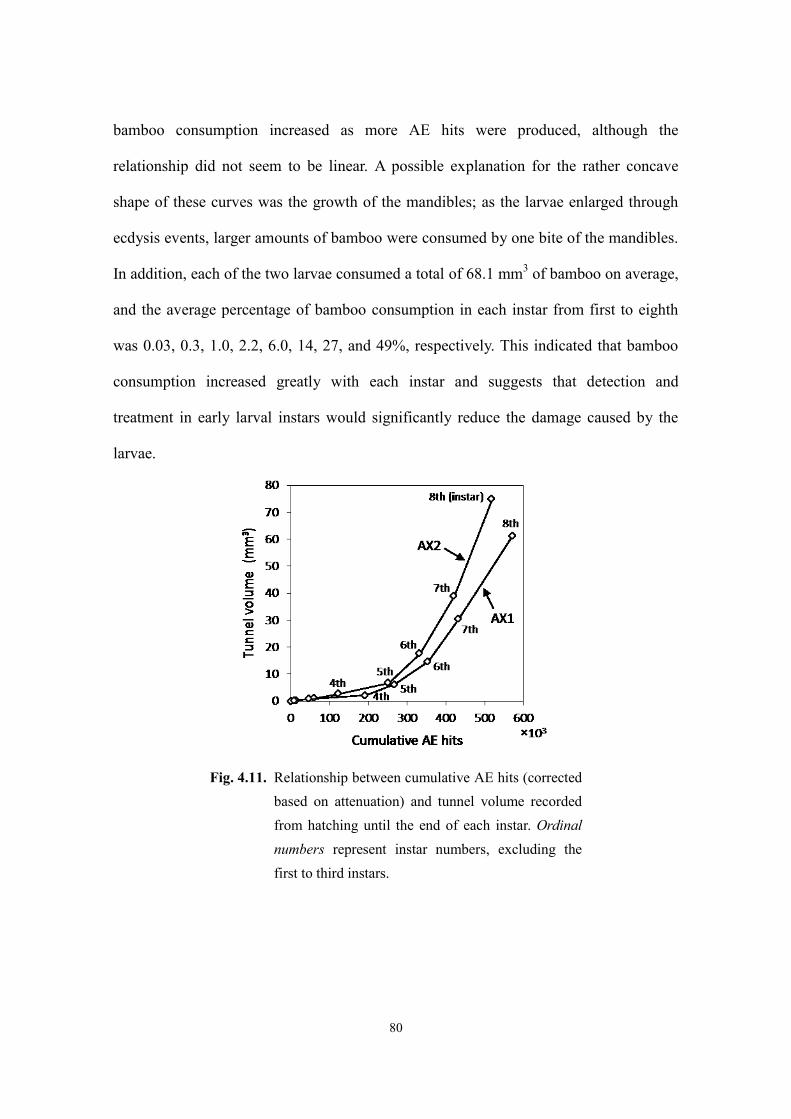
4.3.3. Relationship between cumulative AE hits and bamboo consumption ....................... 79
4.3.4. Pre-mating adult feeding activity............................................................................... 81
4.4. Summary .......................................................................................................................... 82
Chapter 5. General discussion and future perspectives ............................................................... 84
5.1. Introduction ...................................................................................................................... 84
5.2. Novelty of monitoring using X-ray CT and AE in entomology ....................................... 84
5.3. Usefulness of X-ray CT and AE monitoring in managing D. minutus ............................. 86
5.3.1. Desirable process of IPM for bamboo materials ....................................................... 86
5.3.2. Application of X-ray CT and AE to inspection of insect attack ................................ 88
5.3.3. Application of X-ray CT and AE as laboratory analysis tools in developing control
measures .................................................................................................................... 89
Summary and conclusions ........................................................................................................... 93
Acknowledgements ..................................................................................................................... 95
References ................................................................................................................................... 96
Page 5
1
General introduction
In many temperate and tropical regions of the world, bamboo species (family
Poaceae: subfamily Bambusoideae) are an abundant natural resource because of their
fast-growing nature (Fujii 2013, Uchimura 2005, 2009, 2012). They produce culms, in
which hollow internodes are separated by diaphragms at the nodes. Bamboo culms are
flexible and have highly useful mechanical properties (Fujii 2013, Uchimura 2005, 2009,
2012). For example, the tensile strengths of culms of madake, Phyllostachys
bambusoides, and moso bamboo, P. edulis (syn.: P. pubescens), the two most common
bamboo species in Japan, are 270% and 190%, respectively, of sugi (Cryptomeria
japonica) wood, and the compression strengths of madake and moso bamboo culms are
both 210% of sugi wood (Forestry and Forest Products Research Institute 2004).
Bamboo culms also exhibit high machinability and desirable aesthetic qualities (Fujii
2013, Okahisa et al. 2005, Uchimura 2005, 2009, 2012). In Japan, bamboo culms have
been used to make household goods, such as furniture products, tools, and utensils, and
craft products, and as materials for agricultural and forestry uses (Fujii 2013, Uchimura
2005, 2009, 2012, Ueda 1963). In wooden buildings, they have also been used mainly
as decorative elements and as a lathing material for clay walls (Fujii 2013, Uchimura
2005, 2009, 2012, Ueda 1963). However, primarily because of the spread of alternative
materials such as plastics and metals, the demand for bamboo culms has been
decreasing in Japan (Forestry Agency 2011, Uchimura 2005, 2009, 2012). For example,
the production quantity and import of bamboo culms decreased by 35% and 57%,
respectively, between 1998 and 2009 (Forestry Agency 2011). The decreasing demand
for bamboo has led to expanding areas of bamboo forests being left abandoned, which is
being taken up as an environmental issue (Forestry Agency 2011, Uchimura 2009).
Page 6
2
A major reason for bamboo materials being replaced by alternatives is their
lack of durability. Bamboo culms are known to be susceptible to biodeterioration and
are readily attacked by insect pests (Fujii 2013, Okahisa et al. 2005), which can reduce
the strength and aesthetic values of the culms. Susceptibility to insect attack is an
unavoidable problem in attempts to reinvigorate the demand of bamboo culms not only
as materials for conventional uses but also for novel uses, especially as construction
materials, taking advantage of their strength qualities.
There are two possible ways for insect infestation to occur in bamboo culms.
Adult insects may enter and oviposit in bamboo culms during the processes of felling,
seasoning, and processing, and the infected culms may be made into products or
integrated into constructions without being detected. Adults may also enter bamboo
products or materials in use, where they subsequently reproduce and cause damage. To
eliminate the former route of infestation, preventive measures are necessary. When
insect entrance and oviposition are suspected, remedial treatments, such as the use of
insecticides or heat treatment, are also needed. Preventive and remedial measures that
do not rely heavily on chemicals are desirable because of the associated impacts on the
environment and human health. The latter route of infestation can be dealt with by
regular inspection to detect insect attack at an incipient stage. Development of accurate
and practical detection systems to inspect for insect damage is necessary. Damaged
parts should be processed using a remedial treatment or be disposed of and replaced.
The application of preventive measures to treated or replacing parts is necessary to
prevent re-infestation.
Establishment of integrated pest management (IPM) with a combination of
protection, remediation, and inspection measures requires nondestructive techniques
that can be used to detect and analyze insect activities in bamboo culms. Such
Page 7
3
techniques could be useful in evaluating the efficacy of preventive and remedial
measures, and the principles of the technology could be applied to the development of
practical in situ detection apparatuses. Furthermore, such techniques could also be used
in laboratory studies to monitor the activities of individual insects, revealing
fundamental information regarding the biology of bamboo-boring insects, on which any
aspect of IPM should be based.
Knowledge regarding the life history, such as developmental periods of all
stages, the number of larval instars, and the reproductive capacity of adults, is important.
Information on developmental periods can be used to estimate the occurrence of
infestation. Determining instars is important in implementing remedial treatments
because the effects of such treatments may differ depending of the developmental stages
including instars. Information related to insect damage, such as the temporal and spatial
patterns of tunneling, is also useful for estimating the extent of damage and reduced
strength by inspection and for modeling the progress of damage. However, as revealed
in Chapter 1, reliable information regarding the development and feeding of even the
most important insect pest, the bamboo powderpoest beetle Dinoderus minutus, in
bamboo culms is scarce, and applicability of any nondestructive technique to reveal
such information is yet to be investigated.
The primary purpose of this research was to find nondestructive techniques
suitable for obtaining fundamental knowledge on D. minutus that is necessary for
establishing IPM strategies. Because the larval stages are the most difficult to analyze,
this research particularly focused on larval development and feeding. The applicability
of two nondestructive techniques, X-ray computed tomography (CT) and acoustic
emission (AE) monitoring was tested.
This doctoral thesis consists of five chapters. In Chapter 1, existing literature
Page 8
4
on the biology and control of bamboo-boring insects, particularly D. minutus, is
reviewed. Then, literature on methods for nondestructive detection and inspection of
insect attack in wood is reviewed in order to search for appropriate techniques to
investigate larval development and feeding characteristics of D. minutus. Based on this
review of the literature, the objectives of this research are clarified.
In Chapters 2–4, experiments conducted to evaluate the applicability of X-ray
CT and AE monitoring are described. In Chapter 2, the applicability of X-ray CT for
quantitatively evaluating the processes of larval growth and feeding is discussed. In
Chapter 3, the relationship between the movements of the mouthparts, particularly
mandibles, of D. minutus and the generation of AE is clarified, and the effectiveness of
AE monitoring for the continuous analysis of feeding activity is proposed. In Chapter 4,
the use of continuous AE monitoring of feeding activity to determine the number and
time periods of instars and to analyze the rhythmic patterns of feeding is described. The
relationships among the transitions of feeding activity, larval development, and the
amount of bamboo consumed by the larvae are also discussed based on the combined
use of X-ray CT and AE monitoring. Finally, in Chapter 5, the entomological
significance of X-ray CT and AE monitoring and the findings obtained using these
techniques is summarized, and applicability and future perspectives of the techniques
and findings for IPM for bamboo materials are discussed.
Page 9
5
Chapter 1. Literature review and objectives
1.1. Introduction
In this chapter, the literature on insect pests of bamboo culms in Japan and the
biology and control of the bamboo powderpost beetle Dinoderus minutus is reviewed.
Then, literature on nondestructive methods for detecting insect attack in wood is
reviewed in order to search for appropriate techniques to investigate larval development
and feeding characteristics of D. minutus in bamboo culms. Based on this review, the
objectives of this research are clarified.
1.2. Insect pests of bamboo culms in Japan
In Japan, notable insect species that attack bamboo culms after felling belong
to two families, Bostrichidae and Cerambycidae, of beetles (order Coleoptera). Bamboo
pests in the former family include the bamboo powderpost beetle D. minutus, the
Japanese shot-hole borer D. japonicus, the brown powderpost beetle Lyctus brunneus,
and the oriental powderpost beetle Lyctoxylon dentatum (Mori and Arai 1979, The
Society of House and Household Pests Science, Japan 1995, Tokyo National Research
Institute for Cultural Properties 2001, Ueda 1963, Wood Technological Association of
Japan 1961, Yamano 1976, Yasutomi and Umeya 1983). The genus Dinoderus is
classified in subfamily Dinoderinae, and the genera Lyctus and Lyctoxylon in subfamily
Lyctinae. In the latter family (Cerambycidae), two species, Purpuricenus temminckii
and Chlorophorus annularis, are known as common pests of bamboo (Mori and Arai
1979, The Society of House and Household Pests Science, Japan 1995, Tokyo National
Research Institute for Cultural Properties 2001, Ueda 1963, Wood Technological
Association of Japan 1961). Termite species are not known as major pests of bamboo,
Page 10
6
although species such as Reticulitermes speratus and Coptotermes formosanus can
attack bamboo culms (The Society of House and Household Pests Science, Japan 1995).
Among these species, D. minutus is considered to be the most important
bamboo pests in Japan (Mori and Arai 1979, The Society of House and Household Pests
Science, Japan 1995, Wood Technological Association of Japan 1961, Yamano 1976,
Yasutomi and Umeya 1983), as well as being a cosmopolitan species throughout
tropical and temperate regions (Fisher 1950). Therefore, this species was chosen as the
test species in this research.
General information regarding the biology and attack of D. minutus can be
summarized as follows based on literature in Japan, including books and encyclopedia
(Mori and Arai 1979, The Society of House and Household Pests Science, Japan 1995,
Tokyo National Research Institute for Cultural Properties 2001, Ueda 1963, Wood
Technological Association of Japan 1961, Yamano 1976, Yasutomi and Umeya 1983).
Adults of D. minutus are dark brown beetles with a body length of 2.5–3.5 mm. Mated
adults enter bamboo culms from cut surfaces, create tunnels, and oviposit inside. The
hatched larvae develop by boring into and feeding on the parenchyma near the inner
surface of culms. Larvae are known to undergo five instars. After completing the larval
stages, they pupate inside the culms. The adults also feed on bamboo after adult
eclosion and leave via an exit hole. In the process of oviposition and larval and adult
feeding, they turn bamboo culms into frass, a powdery mixture of excrement and
bamboo fragments. Tunnels bored by larvae are packed with frass, while adults
discharge frass from their tunnels. Piles of frass resulting from adult tunneling can be a
sign of infestation. Dinoderus minutus has one to four broods per year, and adults are
seen from March to November. They hibernate in both larval and adults stages. It is
considered that starch stored in bamboo parenchyma attracts the beetles. Because the
Page 11
7
starch content in bamboo culms fluctuates throughout the year, it is traditionally
recommended to fell culms in particular seasons of the year, generally said to be from
fall to winter, to reduce susceptibility. Dinoderus minutus has been recorded as infesting
a historical house conserved as a cultural property, where bamboo ceiling of the house
was severely damaged and adults that fell from the ceiling caused further damage to the
tatami mats.
Other than attacking bamboo materials, D. minutus may also infest non-woody
materials such as stored crops (Nobuchi 1986, 1992). Infestation of D. minutus in
Susuki grass, Miscanthus sinensis, stored as a roofing material for a Japanese shrine was
reported previously (Fukuda et al. 1994). Adults are known to bore into materials that
are not suitable for reproduction, for example, softwoods, hardwoods, and even
non-plant materials such as telecommunication cables (Miyamoto 1985, Nobuchi 1986,
1992, The Society of House and Household Pests Science, Japan 1995, Wood
Technological Association of Japan 1961). The reasons for this type of behavior may
include feeding and hiding (Nobuchi 1992) but as yet they remain unclear. In addition,
infestation of D. minutus may accompany the occurrence of a parasitoid bethylid wasp,
Sclerodermus nipponicus, which is known as a stinging pest (Tokyo National Research
Institute for Cultural Properties 2001).
The morphology of adult D. minutus is very similar to other Dinoderus spp.
found in Japan. The antennae of D. minutus are 10-segmented, which can be used to
differentiate D. minutus from D. japonicus that have 11-segmented antennae (Fisher
1950, Mori and Arai 1979, Nobuchi 1986, 1992, The Society of House and Household
Pests Science, Japan 1995, Tokyo National Research Institute for Cultural Properties
2001, Ueda 1963, Wood Technological Association of Japan 1961, Yamano 1976).
Compared with D. minutus, D. japonicus is slightly larger and slightly darker in color,
Page 12
8
though attacks may be more occasional and it is known to have only one brood per year
(Mori and Arai 1979, Nobuchi 1986, 1992, The Society of House and Household Pests
Science, Japan 1995, Tokyo National Research Institute for Cultural Properties 2001,
Ueda 1963, Wood Technological Association of Japan 1961). Two other species of
Dinoderus have been identified in Japan, D. bifoveolatus and D. speculifer (Nobuchi
1986, 1992). The former species has 12–14 denticles on the anterior edge of the pronota
and elytra with ocellate punctures, whereas D. minutus has 8–10 denticles and elytra
without ocellate punctures (Fisher 1950, Nobuchi 1986, 1992, Schäfer et al. 2000). This
species was first recorded in Japan by Nobuchi (1986), and there are several subsequent
records (City of Nagoya 2009, Kawakami and Iwata 1993), but it is not known to have
become established in Japan. It attacks hardwoods and palm timbers (Nobuchi 1986,
1992, The Society of House and Household Pests Science, Japan 1995). The latter
species, D. speculifer, is darker and larger than D. minutus and D. bifoveolatus and has
12–14 denticles on the anterior edge of the pronota (Nobuchi 1986). It is a rare species
and the host materials are unknown (Nobuchi 1986). The pronota of D. ocellaris,
another bamboo borer found in India and some other parts of Asia, are not distinctly
bifoveolate, unlike D. minutus and some other Dinoderus spp. (Fisher 1950), but this
species has not been found in Japan.
According to Abood et al. (2010), adults of D. minutus do not have apparent
morphological sexual characteristics, with the body size not significantly different
between males and females. However, they reported that sexes can be easily
differentiated in the pupal stage based on morphological differences of the last
abdominal segments.
Page 13
9
1.3. Studies on the biology and control of D. minutus and closely related species
Being an important pest of bamboo in many countries, studies on D. minutus
have been conducted by some researchers who have sought to clarify the biology of this
species and to develop effective control measures. Plank (1948) described the life
history of D. minutus in Puerto Rico. For the examination of larval stages, he used
culms of Bambusa vulgaris as a rearing medium and observed the larvae by chipping
the culms into sections with a small knife. He found four larval instars based on Dyar’s
(1890) rule, although each instar period could not be measured. Plank (1950)
investigated factors influencing the susceptibility of culms of several bamboo species to
adult D. minutus and found that the starch content was the most important. Plank and
Hageman (1951) conducted a more quantitative analysis of starch content and reported a
strong positive correlation between the starch content in bamboo culms and the
susceptibility to attack by adult D. minutus. Nair et al. (1983) described the attack of
Dinoderus spp. on Ochlandra travancorica culms in India and showed the suitability of
tapioca and wheat flour based diets for laboratory culture of D. minutus. Another study
on artificial diets was conducted by Suzuki and Kirton (1991), and flour cakes of some
cereals such as whole wheat and buckwheat were found to be suitable.
The efficacy of chemical treatments to increase the resistance of bamboo has
also been investigated. Ninomiya and Kotani (2002) showed that acetylation of madake
(Phyllostachys bambusoides) culms could prevent the entrance of adult D. minutus
beetles. Treatment with insecticides such as thiamethoxam (Acda 2008), deltamethrin,
and permethrin (Garcia and Morrell 2010) was also proven to effectively protect B.
vulgaris culms from feeding and oviposition of D. minutus.
Recently, further findings on the life history and characteristics of attack have
Page 14
10
been reported. Garcia and Morrell (2008) monitored the field abundance of D. minutus
throughout different seasons in the Philippines and showed that factors such as starch
content in B. vulgaris culms and temperature influenced the populations. Garcia and
Morrell (2009) estimated the developmental threshold temperatures and thermal
requirements of egg, larval, and pupal stages of D. minutus in the Philippines based on
the developmental periods of these stages at different temperatures. Larval development
in B. vulgaris culms was observed using a razor blade for dissection. Norhisham et al.
(2013) used an individual rearing method, which was adapted from the method of Iwata
and Nishimoto (1985) for studies of L. brunneus (see the following paragraph), to
investigate larval development of D. minutus in Malaysia. They used cassava flour as a
rearing medium and found five larval instars based on the inspection of exuviae. Abood
and Norhisham (2013) used cassava pellets as an oviposition medium to determine the
effects of humidity on the reproductive capacity and egg hatchability of D. minutus in
Malaysia. Although the number of eggs laid by females increased with relative humidity,
egg hatchability decreased when relative humidity was high (85%). Norhisham et al.
(2015) investigated the effects of moisture content in Gigantochloa scortechinii culms
on the boring capacity and life span of adult D. minutus in Malaysia. At optimum
moisture content, 15%, the developmental periods of egg, larvae, and pupae in G.
scortechinii culms were measured. Inspection of larvae was carried out with a dissection
knife.
In addition, literature on methodologies for investigating the life history,
especially larval development, of other species closely related to D. minutus was
reviewed. Sitaraman (1951) described the life history of D. ocellaris. Rearing in maize
powder was used for the investigation of larval period, and molting was confirmed by
microscopic observation of exuviae. Wright (1960) designed cages, each made of wood
Page 15
11
flour filled between a pair of glass panes or slides, to observe the movement and
development of the southern lyctus beetle, L. planicollis, but the wood flour was not
thin enough, although 1 or 2 mm thick, to observe the larvae, and no larvae survived
until pupation. Iwata and Nishimoto (1985) developed an individual rearing method to
study the larval development of L. brunneus. This method utilized gelatin capsules
containing stuffed buckwheat flour as a diet and single larvae. Ecdysis events were
detected by microscopic inspection of exuviae in the material that remained on a sieve.
Review of the literature on D. minutus revealed that, although factors
influencing the susceptibility of bamboo culms and treatments to increase resistance
have been investigated in several studies based on the visible behavior of adults, no
reliable methods to analyze the feeding of larvae have been established. Biological
studies on the larval development of D. minutus have relied on the direct dissection of
bamboo culms, which may have affected the natural development or behavior of the
larvae, or on tests using artificial diets, in which the larval development or behavior
may be different from those in bamboo culms. The same was true for other related
species. In addition, there are no reliable reports on the extent of attack caused by D.
minutus larvae. Therefore, techniques to nondestructively analyze larval development
and feeding are desired. In the next section, literature on methods for nondestructive
detection and analysis of insects in wood is reviewed in order to search for appropriate
approaches for the analysis of D. minutus.
1.4. Nondestructive techniques for detecting insects and insect attack in wood
The cryptic nature of xylophagous insects has hindered studies regarding their
biology and control in the fields of forest and wood sciences. Many studies have been
Page 16
12
made on techniques to detect, visualize, or monitor the presence and attack of insects in
logs, timber, wooden products, and wooden constructions in order to either study the
biology of insects or inspect for insect damage.
One such technique is the use of X-rays. Radiography, or roentgenography, is a
technology that images the internal structure of an object on the principle that the
amount of X-ray absorption in the object depends on its density and composition.
Radiography has been able to not only visualize insect tunnels and presence but also
determine the developmental stages, estimate population size, and trace the growth
process of insects inside wood (Amman and Rasmussen 1969, Berryman and Stark
1962, Fisher and Tasker 1940, Jones and Ritchie 1937, Mori et al. 1979, Yaghi 1924).
Jones and Ritchie (1937) confirmed spectrographically that the larvae of Lyctus sp. had
greater absorption of X-rays than wood owing to the concentration of mineral salts
present in wood. However, only thin plates of wood could be used to trace the
movement or growth of insects. The development of X-ray computed tomography (CT)
has eliminated this limitation. In X-ray CT, either the object or the pair of the X-ray
source and detector is rotated so that a stack of cross-sectional images of the object can
be obtained through reconstruction. X-ray CT was used to visualize the tunnels or
galleries of the oak platypodid beetle Platypus quercivorus (Sone et al. 1995), a
xiphydriid woodwasp Rhysacephala warraensis (Jennings and Austin 2011), the
whitespotted sawyer Monochamus scutellatus (Bélanger et al. 2013), and drywood
termite species Cryptotermes secundus (Fuchs et al. 2004) and Incisitermes minor
(Himmi et al. 2014, Yanase et al. 2014) developed in wood blocks or logs. Larval
bodies of an anobiid beetle Priobium cylindricum were also captured in X-ray CT
images (Kigawa et al. 2009, Torigoe et al. 2010). Although it may not be useful to trace
the movement of certain individual termites because of their active locomotion and
Page 17
13
aggregation behavior, it is considered promising for tracing larvae of D. minutus, which
are probably more quiescent in terms of locomotion.
Different types of technique for in situ nondestructive detection of
wood-attacking insects, most importantly termites, have been developed. Acoustic
emission (AE) is a typical example. AE is a phenomenon in which elastic waves are
generated by the release of the stored strain energy when local material changes, such as
microfractures, occur. Elastic waves released by this phenomenon are called AE waves,
and material changes resulting in the generation of AE waves are called AE events.
Although there are no specified frequency ranges for the definition of AE waves,
practically, frequencies in the ultrasonic range are utilized and, in the studies reviewed
below, AE sensors with resonant frequencies of 50–150 kHz were most commonly used.
Early studies showed that detectable AE waves were generated by active infestation of
termites in wood, and the characteristics of termite-related AE waves were investigated
(Fujii et al. 1990, Lemaster et al. 1997, Lewis and Lemaster 1991, Lewis et al. 1991,
Noguchi et al. 1991, Robbins et al. 1991, Scheffrahn et al. 1993). Direct observation of
termite behavior and simultaneous AE measurement confirmed that AE waves were
generated by the feeding activity of termites (Fujii et al. 1995, Matsuoka et al. 1996).
Investigations were made to design suitable sensor types and waveguide types and to
build portable detection devices (Lewis et al. 2004, Scheffrahn et al. 1993, Yanase et al.
1998, 1999, 2000a, 2000b, 2001). AE monitoring was successfully applied to termite
detection in wooden constructions (Fujii et al. 1998, Weissling and Thoms 1999, Yanase
et al. 1999, 2001) and bait traps (Fujii et al. 1997). It was also applied to biological
analyses of feeding responses of termites to different conditions (Imamura and Fujii
1995, Indrayani et al. 2003, 2007a, 2007b), suggesting that it was an effective tool for
biological studies of wood-attacking insects. Furthermore, some studies dealt with AE
Page 18
14
generated by wood-boring beetles, such as Lyctus spp. (Creemers 2015, Fujii et al. 1992,
Imamura et al. 1998), cerambycid beetle species Semanotus japonicus (Fujii et al. 1992,
1994) and Hylotrupes bajulus (Creemers 2013, 2015), and anobiid beetle species
Anobium punctatum, Xestobium rufovillosum (Creemers 2013, 2015), and Oligomerus
ptilinoides (Le Conte et al. 2015). These previous reports suggested that the feeding
activity of D. minutus should generate AE waves, and the detection of AE waves could
allow continuous analysis of their feeding, which is closely related to larval growth and
development.
Another example of in situ detection is the detection of odor or gases emitted
by insects. The olfactory ability of trained dogs to find termite infestation was tested
and shown to be accurate enough for practical use (Brooks et al. 2003, Lewis et al.
1997). Development of gas sensors to detect odor and metabolic gases emitted by
termites was also pursued (Yanase et al. 2012, 2013a, 2013b). Termites are known to
emit gases, such as carbon dioxide, methane, and hydrogen through metabolism (Khalil
et al. 1990, Sanderson 1996, Sugimoto et al. 1998, Zimmerman et al. 1982), and among
sensors designed to target these gases, the hydrogen sensor was found most suitable for
termite detection (Yanase et al. 2012, 2013a, 2013b). In addition, the feasibility of
detection of insects, including beetles, in art objects by measurements of respiration, i.e.,
measurements of concentration changes of carbon dioxide (Koestler et al. 2000) and
oxygen (Stus̆ek et al. 2000), was proposed. In the present research, however, methods of
chemical detection were not used for detection and analysis of D. minutus because
bostrichid beetles are not known to emit special metabolic gases and measurement of
respiration may require sensors with high sensitivities to detect changes in carbon
dioxide and oxygen levels in the atmosphere. Gas detection may perhaps be a promising
approach to analyze anobiid or cerambycid beetles which are known to digest cellulose
Page 19
15
or hemicellulose with the aid of gut microorganisms (Yoshimura 2016).
Techniques using electromagnetic waves to detect moving termites were also
developed. Termite movement in wood could be detected by measuring the reflected
components of microwaves (Evans 2002) or millimeter waves (Fujii et al. 2007). The
former technique has been integrated into a commercial termite detector called
TermatracTM
(Evans 2002). However, the locomotion of beetle larvae is estimated to be
slow, and such techniques are probably unsuitable for analysis of larval activities of D.
minutus.
1.5. Objectives
The two techniques, X-ray CT and AE monitoring, were deemed promising for
revealing the biology of D. minutus hidden with bamboo culms. Therefore, the objective
of this research was to evaluate the applicability of these nondestructive techniques to
analyze larval development and feeding behavior. Experiments designed for this
purpose were conducted and are described in Chapters 2–4. The novelty and usefulness
of these techniques and findings obtained by them are discussed from the viewpoint of
entomology and pest management in Chapter 5.
Page 20
16
Chapter 2. Evaluation of larval development and feeding behavior
using X-ray computed tomography1
2.1. Introduction
The life history and bamboo-attacking behavior of the bamboo powderpost
beetle Dinoderus minutus are very difficult to investigate and, thus, remain poorly
understood. The larval development and tunneling behavior are especially difficult to
analyze because the larvae never leave bamboo culms before adult eclosion. X-ray
computed tomography (CT) has proven to be an effective technique to nondestructively
detect and analyze the presence and damage of insects in wood. As reviewed in Chapter
1, X-ray CT was used not only to observe insect tunnels and galleries but also to
visualize the bodies of wood-boring insects (Bélanger et al. 2013, Fuchs et al. 2004,
Himmi et al. 2014, Jennings and Austin 2011, Kigawa et al. 2009, Sone et al. 1995,
Torigoe et al. 2010, Yanase et al. 2014). However, X-ray CT has never been used to
visualize various stages of D. minutus inside bamboo culms or to trace the growth or
behavior of any wood-inhabiting insects in the complete developmental periods.
In this chapter, the applicability of X-ray CT for evaluating the processes of
larval growth and feeding, or tunneling, is discussed. First, in Section 2.2, artificially
infested bamboo specimens were scanned using a microfocus X-ray CT system to
evaluate the performance of the CT system for visualizing the beetles and tunnels and
for tracing the growth and tunneling processes. Then, in Section 2.3, the same CT
1 Section 2.2 originally published in: Watanabe, H., Yanase, Y., Fujii, Y. (2015a) Evaluation of larval
growth process and bamboo consumption of the bamboo powder-post beetle Dinoderus minutus
using X-ray computed tomography. Journal of Wood Science 61(2), 171–177.
Section 2.3 originally published in: Watanabe, H., Yanase, Y., Fujii, Y. (2017a) Nondestructive
evaluation of egg-to-adult development and feeding behavior of the bamboo powderpost beetle
Dinoderus minutus using X-ray computed tomography. Journal of Wood Science 63(5), 506–513.
Page 21
17
system was used to trace and quantify the development and feeding from first instar to
pupation and adult eclosion in bamboo pieces containing single individuals.
Investigation from the first instar was facilitated by a method for egg collecting
employing nutrient-containing filter paper. The feeding of newly eclosed pre-mating
adults was also analyzed.
2.2. Visualization of larval growth process and tunneling process in infested
bamboo culms
2.2.1. Materials and methods
Four bamboo pieces, 100 mm [longitudinal (L)] in length and approximately
35 mm [tangential (T)] in width, each with a node in the middle of its length, were
prepared from partly moist culms of madake (Phyllostachys bambusoides) felled in May
2013 in Kyoto Prefecture, Japan. A laboratory strain of D. minutus reared on an artificial
diet made of buckwheat flour (Suzuki and Kirton 1991) was used. A total of 25 adult
beetles and the four bamboo pieces were enclosed together in a plastic container with a
vent hole and were left undisturbed at room temperatures (25–29 °C) for two months to
allow the beetles to reproduce. X-ray CT scans confirmed the existence of larvae inside
the pieces.
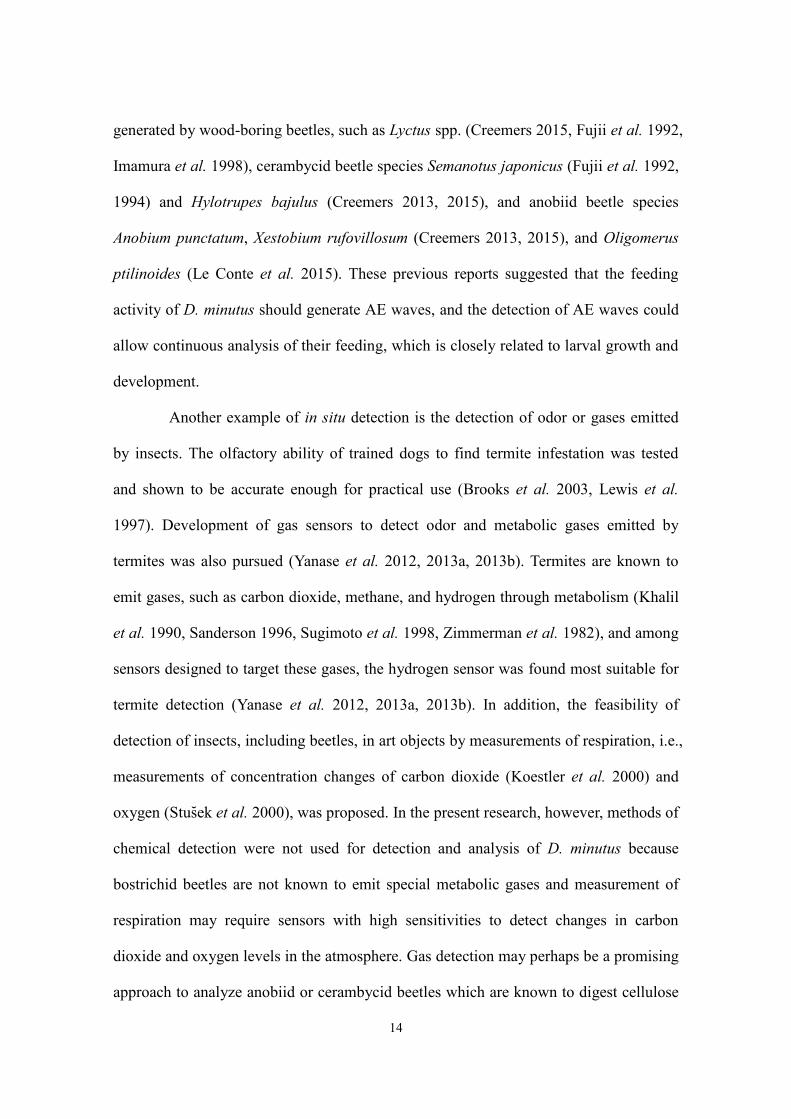
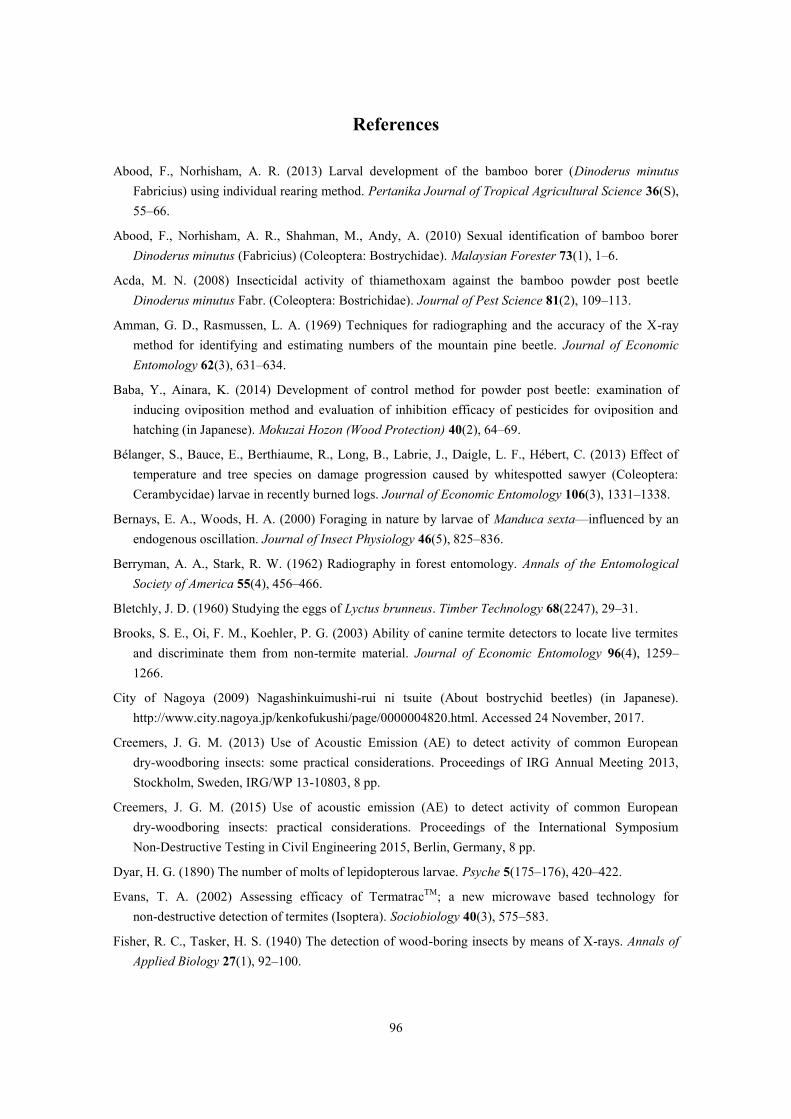
One of the four bamboo pieces was used for CT scanning. This piece was split
into three thinner specimens [approximately 12 mm (T) in width] so that their cross
section would fit into the xy field of view when scanning (Fig. 2.1). All of the three split
specimens were kept in a glass bottle with the fiber direction vertical and were scanned
every 2–5 d (mostly every 3 d). During the two-month exposure, the specimens were
considered to have reached an equilibrium moisture content (MC) of 12%, which was
Page 22
18
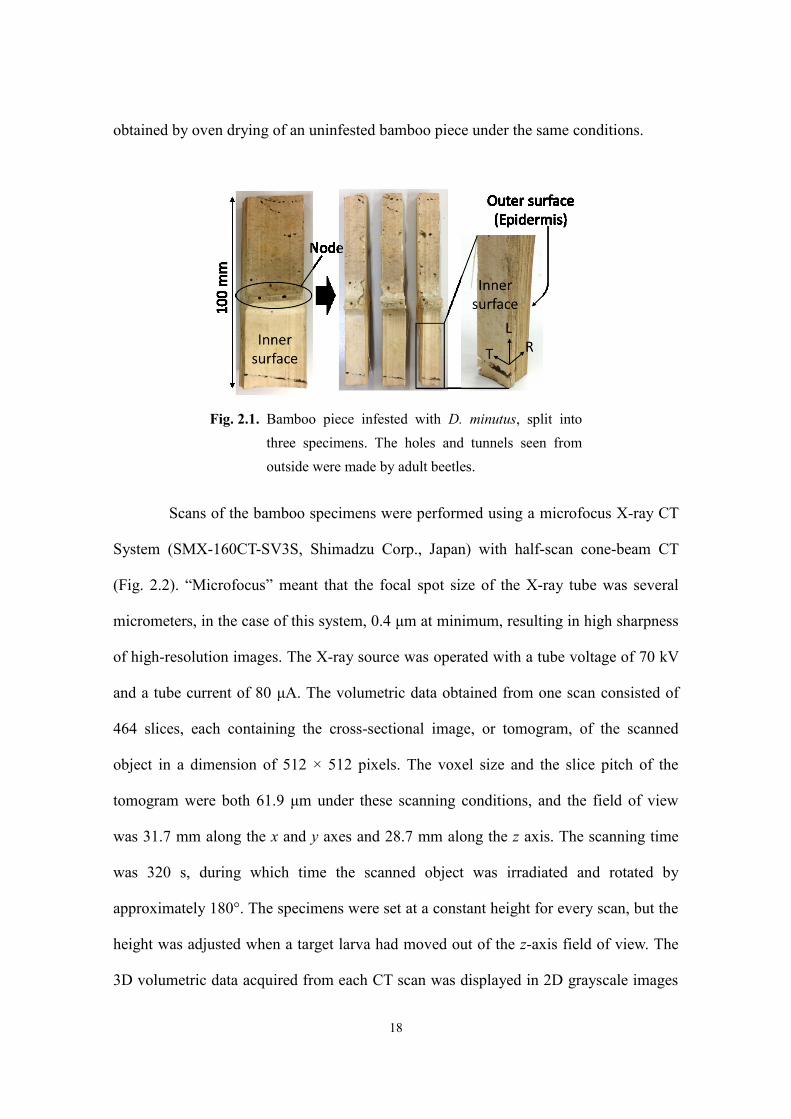
obtained by oven drying of an uninfested bamboo piece under the same conditions.
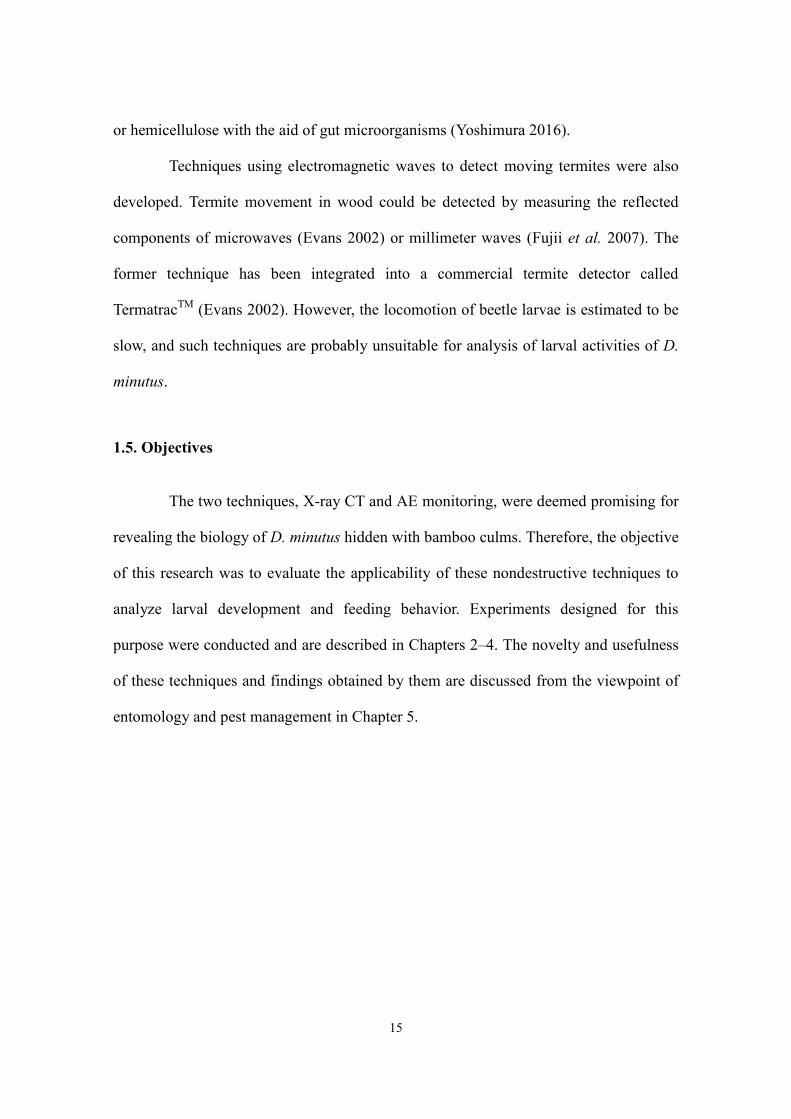
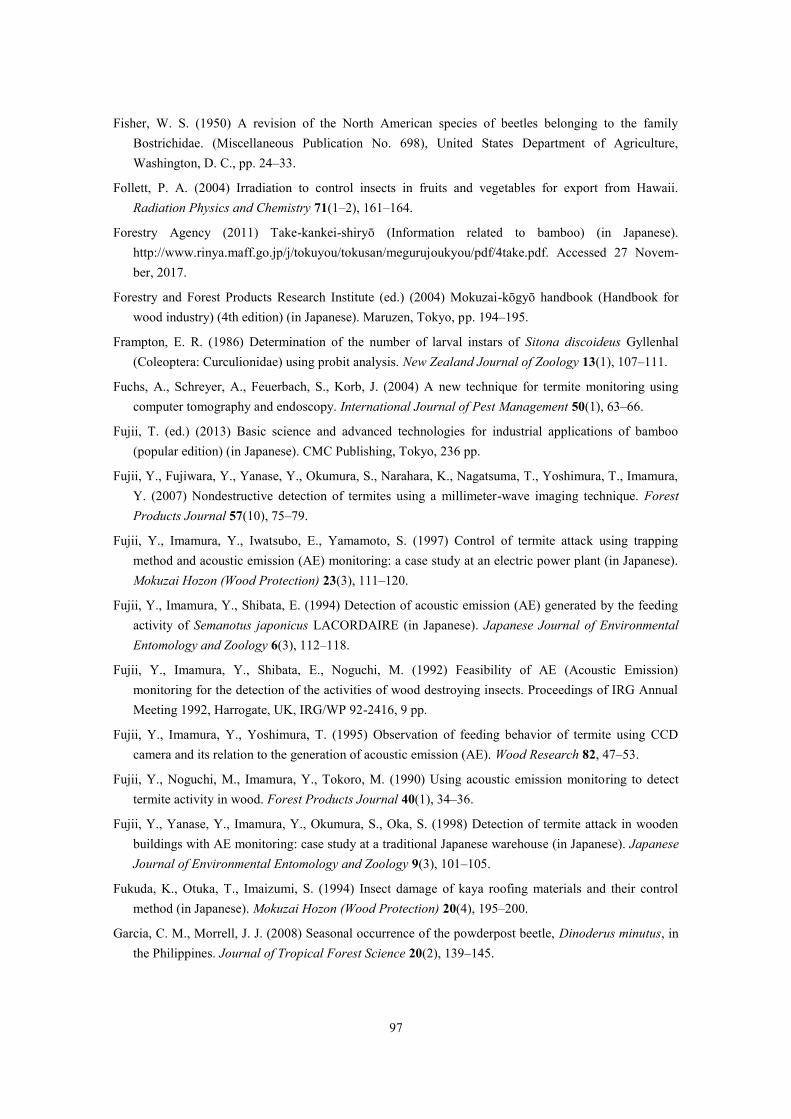
Scans of the bamboo specimens were performed using a microfocus X-ray CT
System (SMX-160CT-SV3S, Shimadzu Corp., Japan) with half-scan cone-beam CT
(Fig. 2.2). “Microfocus” meant that the focal spot size of the X-ray tube was several
micrometers, in the case of this system, 0.4 μm at minimum, resulting in high sharpness
of high-resolution images. The X-ray source was operated with a tube voltage of 70 kV
and a tube current of 80 μA. The volumetric data obtained from one scan consisted of
464 slices, each containing the cross-sectional image, or tomogram, of the scanned
object in a dimension of 512 × 512 pixels. The voxel size and the slice pitch of the
tomogram were both 61.9 μm under these scanning conditions, and the field of view
was 31.7 mm along the x and y axes and 28.7 mm along the z axis. The scanning time
was 320 s, during which time the scanned object was irradiated and rotated by
approximately 180°. The specimens were set at a constant height for every scan, but the
height was adjusted when a target larva had moved out of the z-axis field of view. The
3D volumetric data acquired from each CT scan was displayed in 2D grayscale images
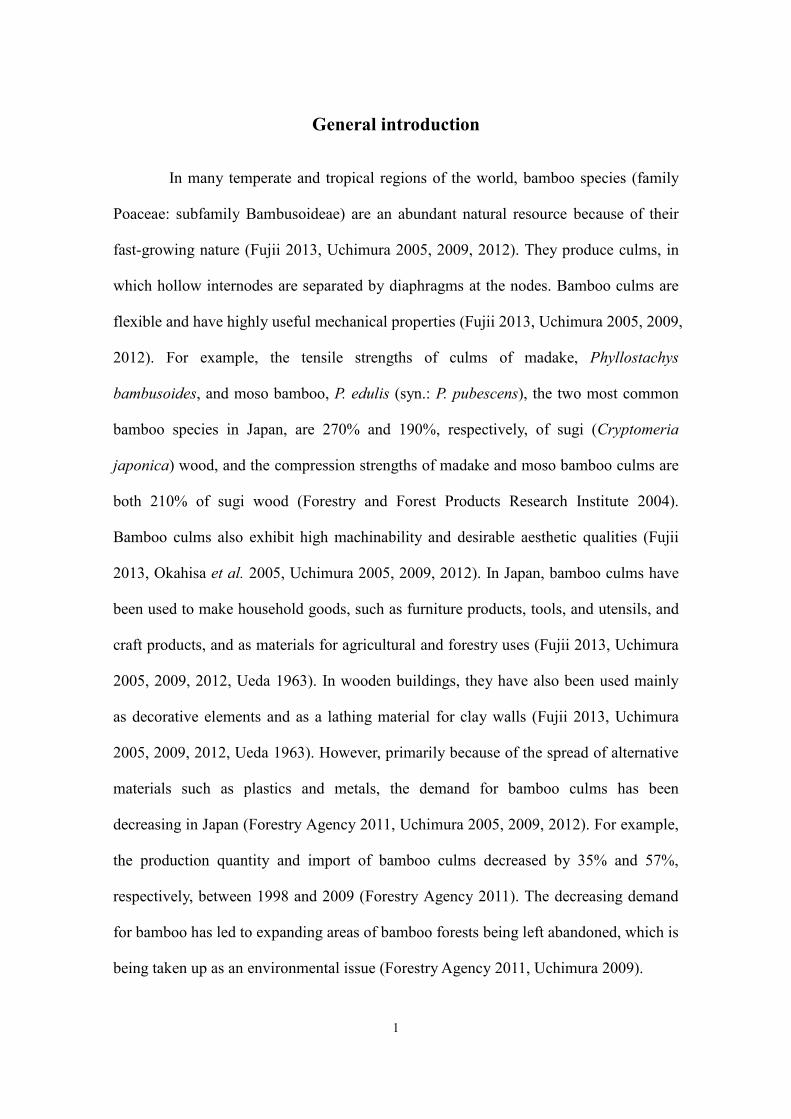
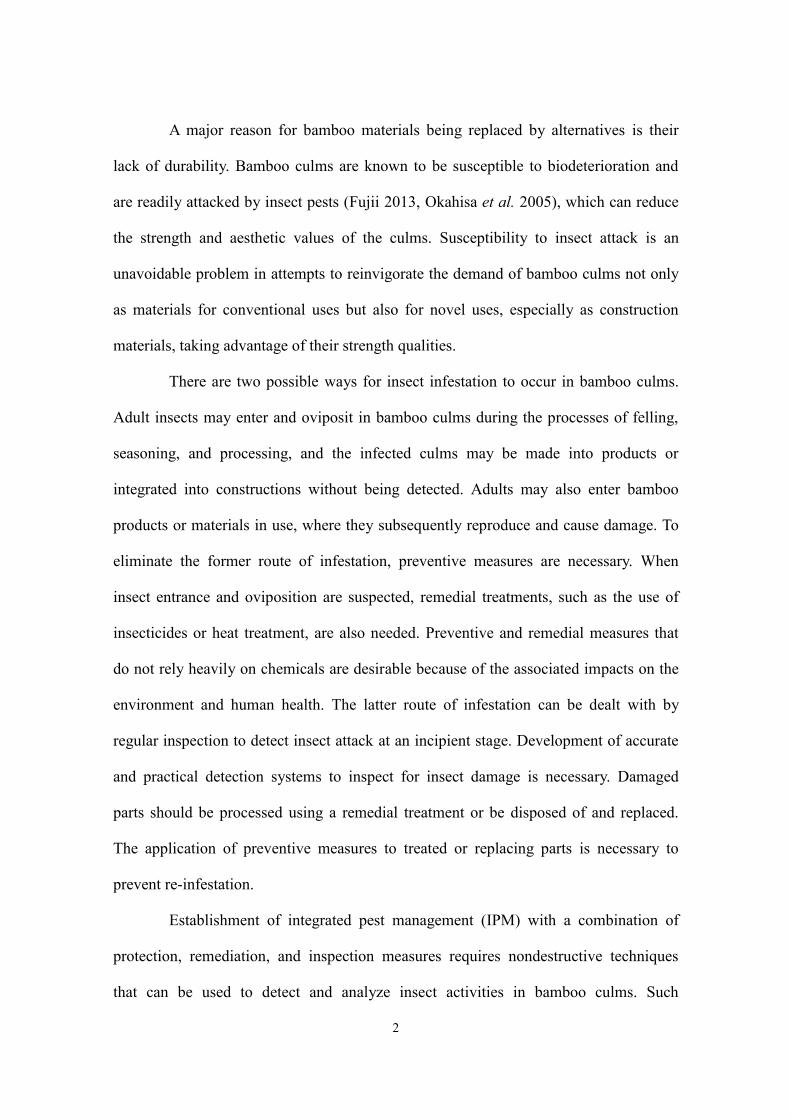
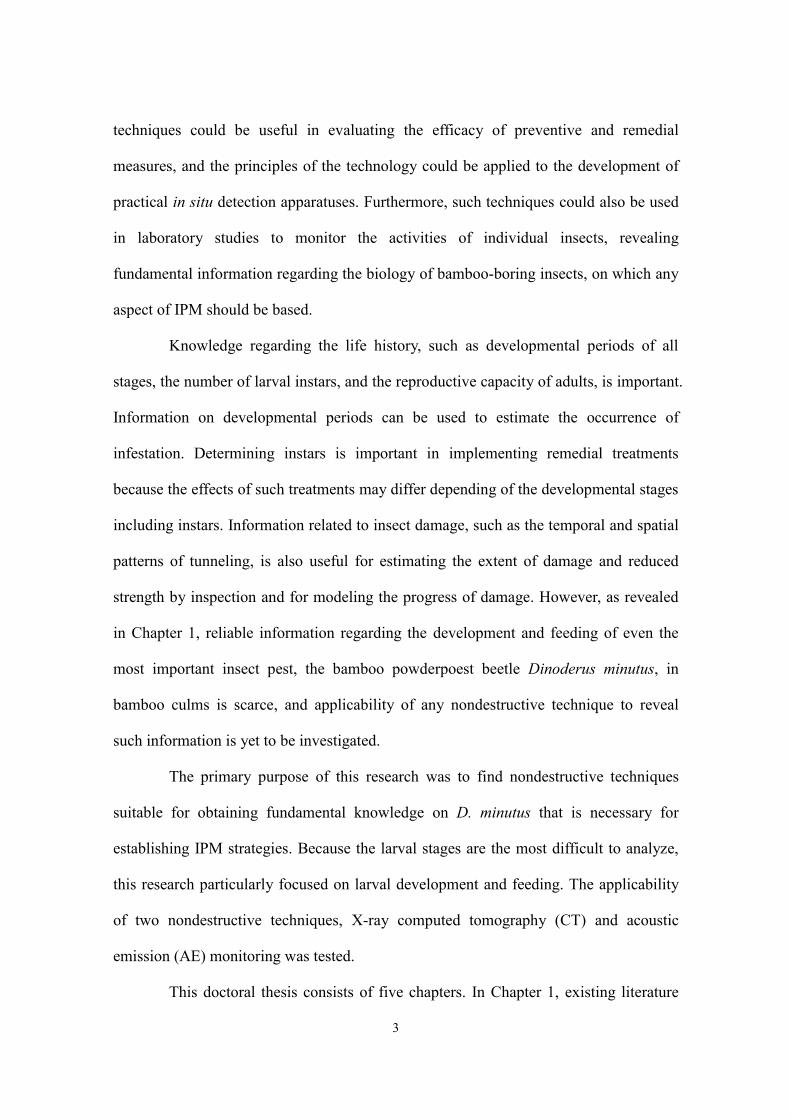
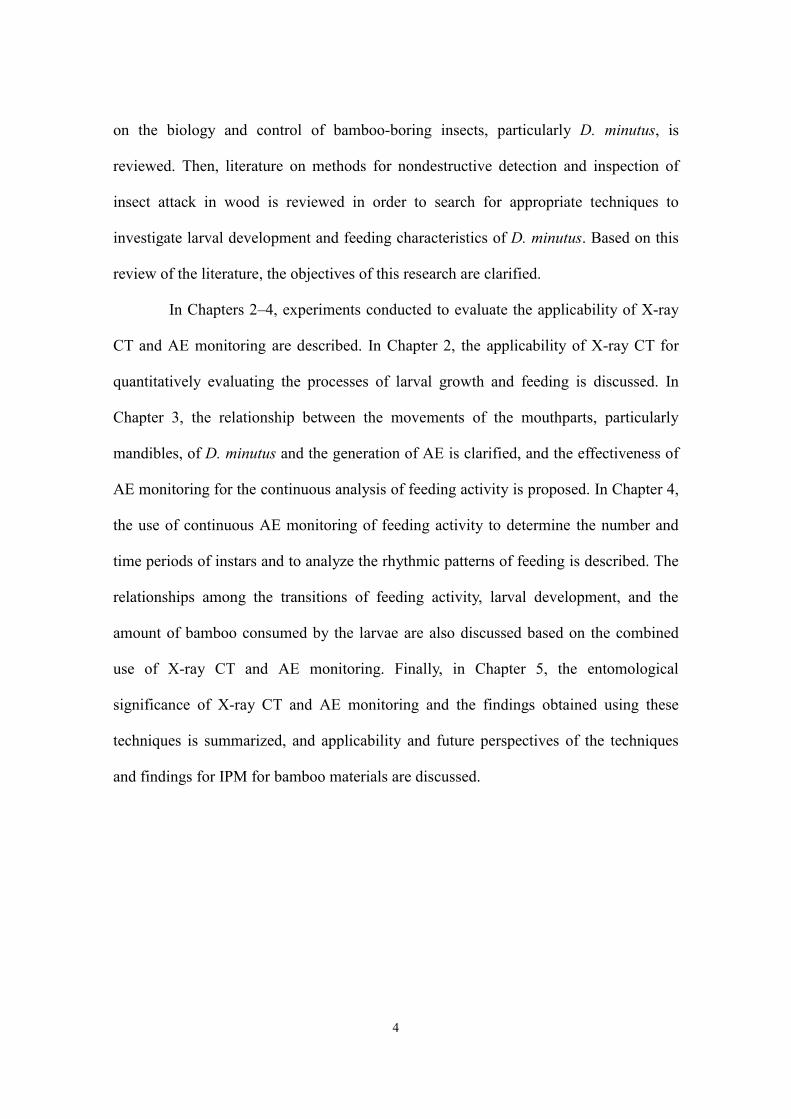
Fig. 2.1. Bamboo piece infested with D. minutus, split into
three specimens. The holes and tunnels seen from
outside were made by adult beetles.
Page 23
19
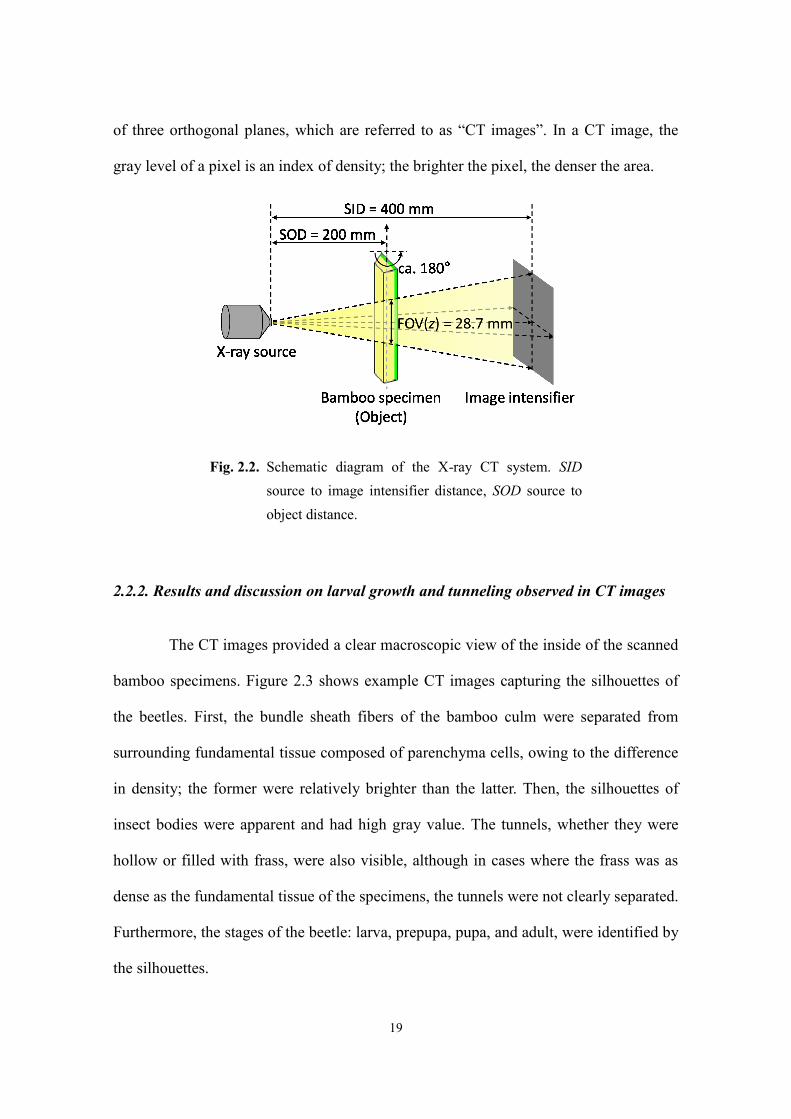
of three orthogonal planes, which are referred to as “CT images”. In a CT image, the
gray level of a pixel is an index of density; the brighter the pixel, the denser the area.
2.2.2. Results and discussion on larval growth and tunneling observed in CT images
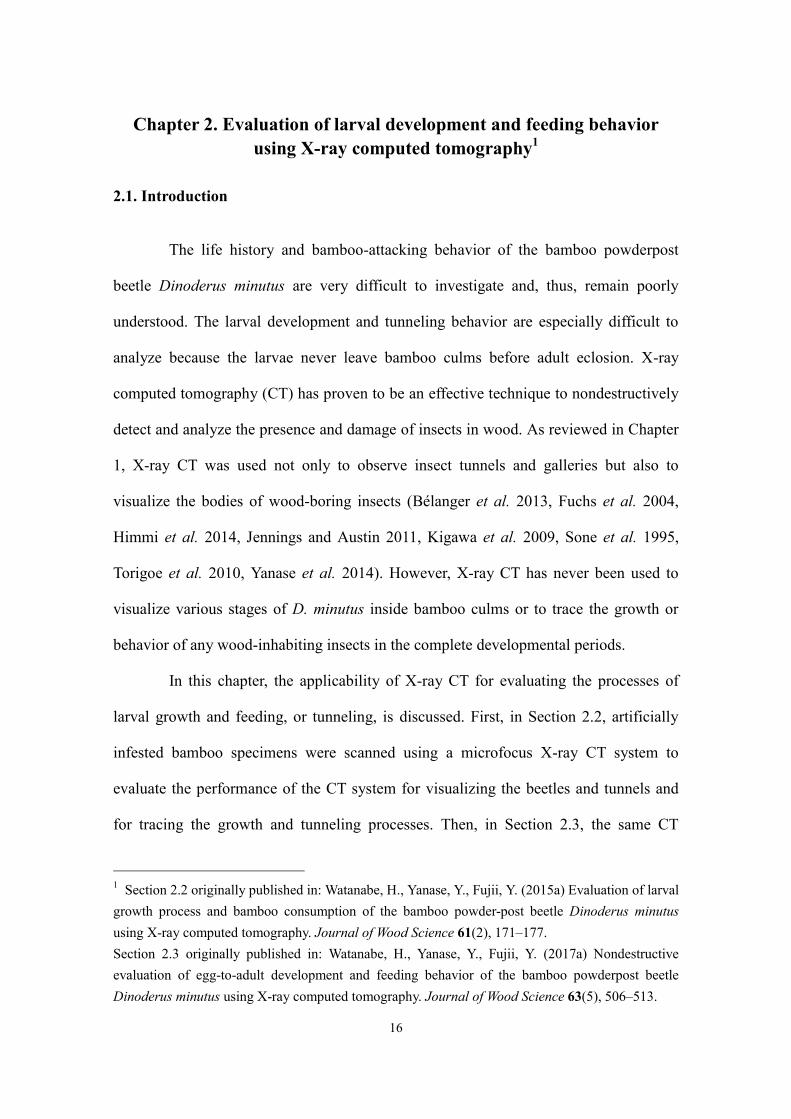
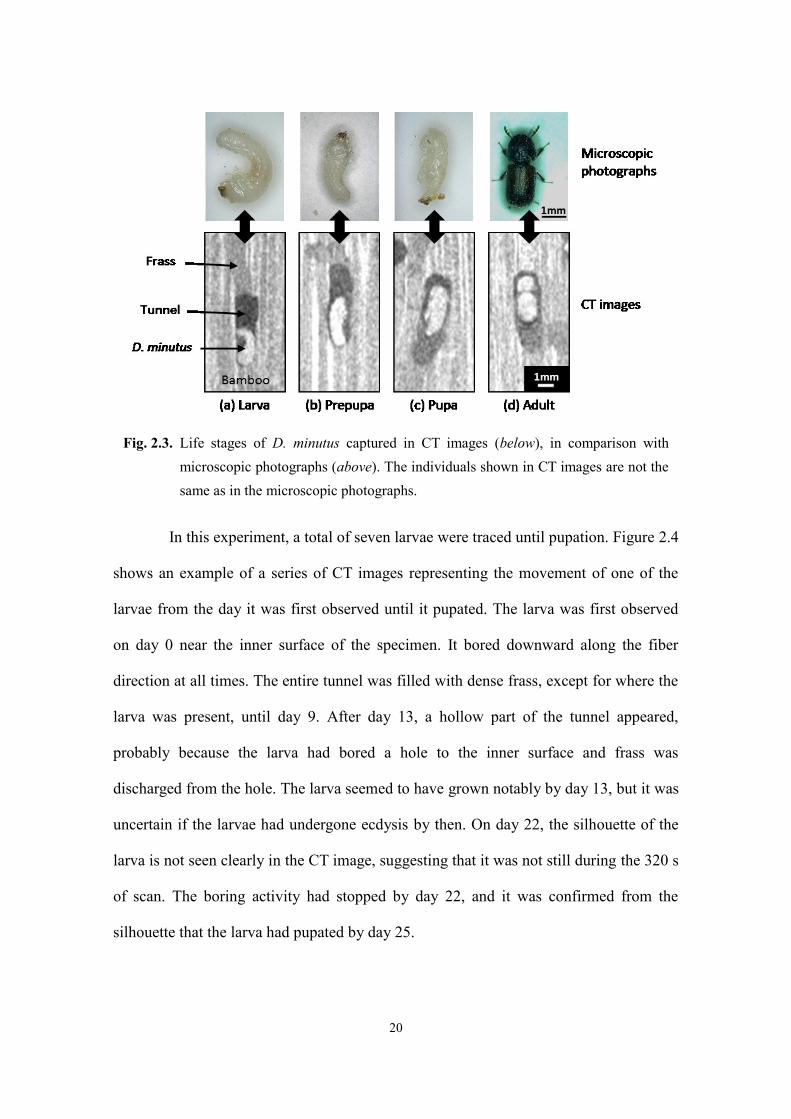
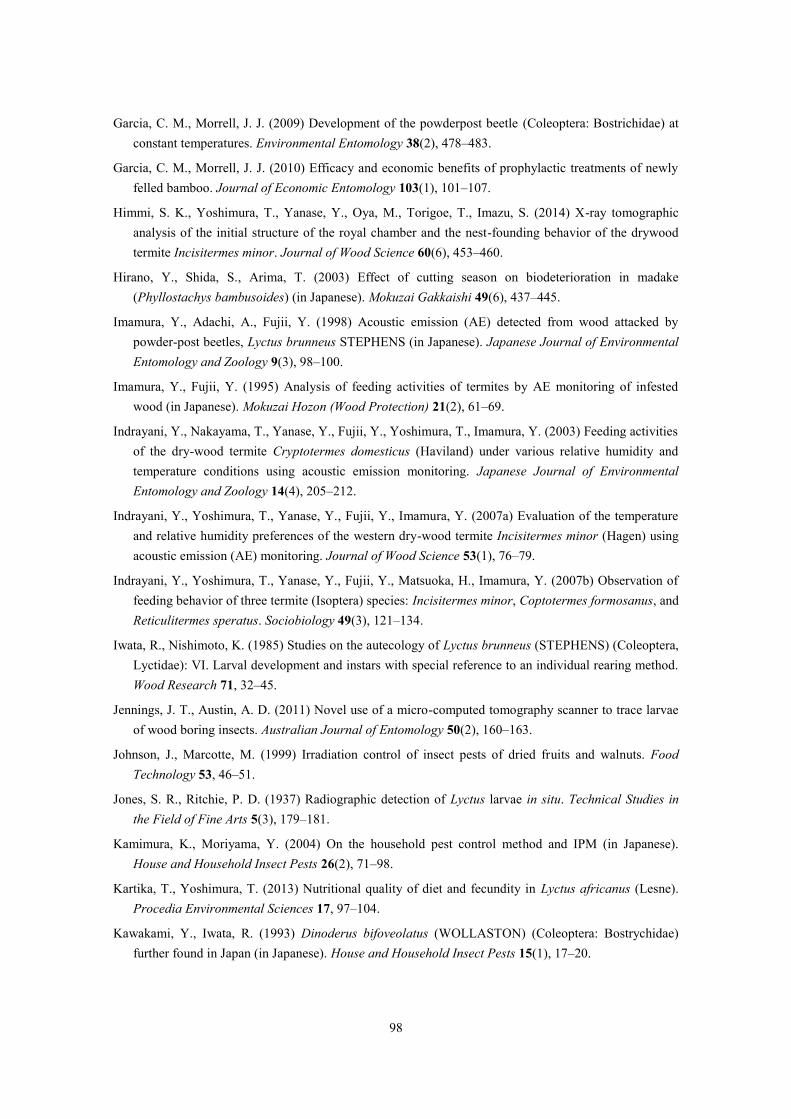
The CT images provided a clear macroscopic view of the inside of the scanned
bamboo specimens. Figure 2.3 shows example CT images capturing the silhouettes of
the beetles. First, the bundle sheath fibers of the bamboo culm were separated from
surrounding fundamental tissue composed of parenchyma cells, owing to the difference
in density; the former were relatively brighter than the latter. Then, the silhouettes of
insect bodies were apparent and had high gray value. The tunnels, whether they were
hollow or filled with frass, were also visible, although in cases where the frass was as
dense as the fundamental tissue of the specimens, the tunnels were not clearly separated.
Furthermore, the stages of the beetle: larva, prepupa, pupa, and adult, were identified by
the silhouettes.
Fig. 2.2. Schematic diagram of the X-ray CT system. SID
source to image intensifier distance, SOD source to
object distance.
Page 24
20
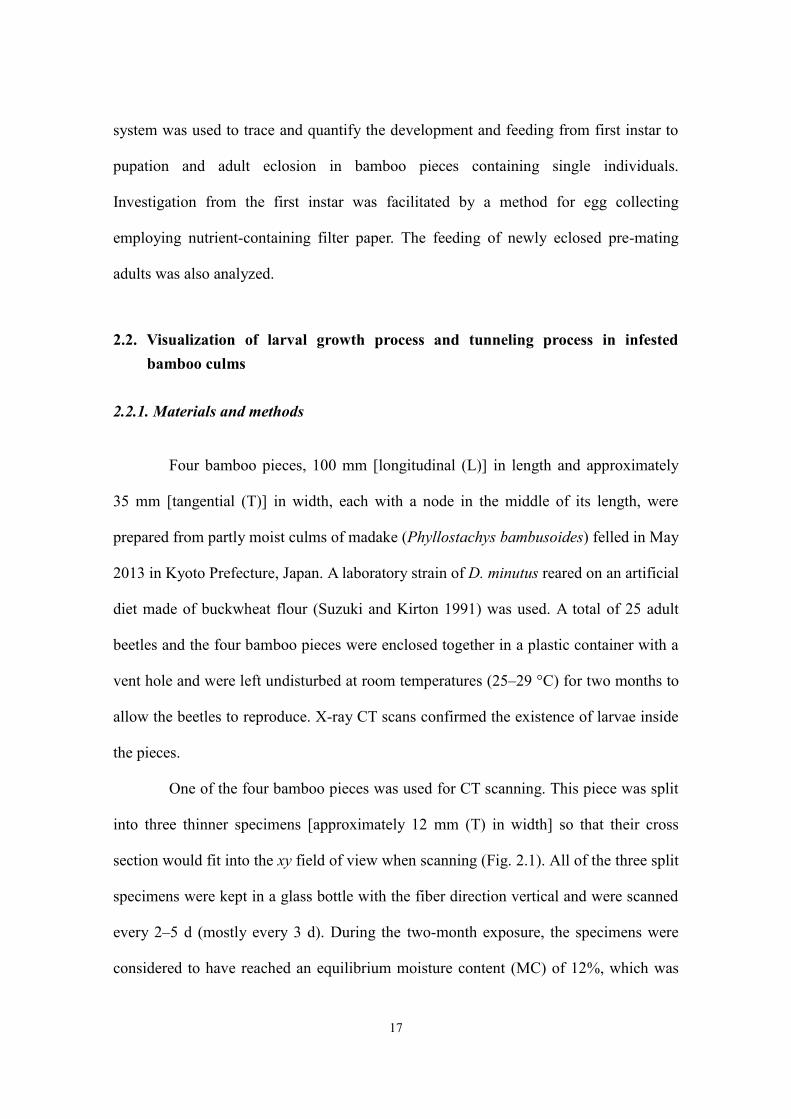
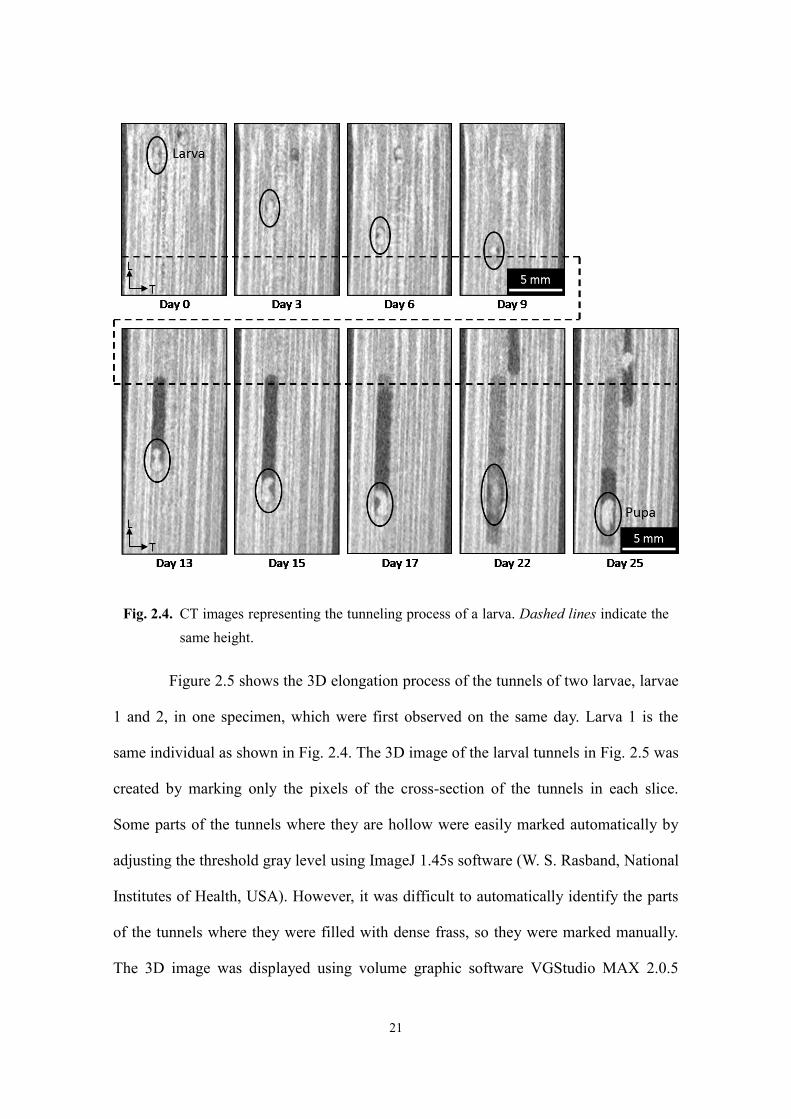
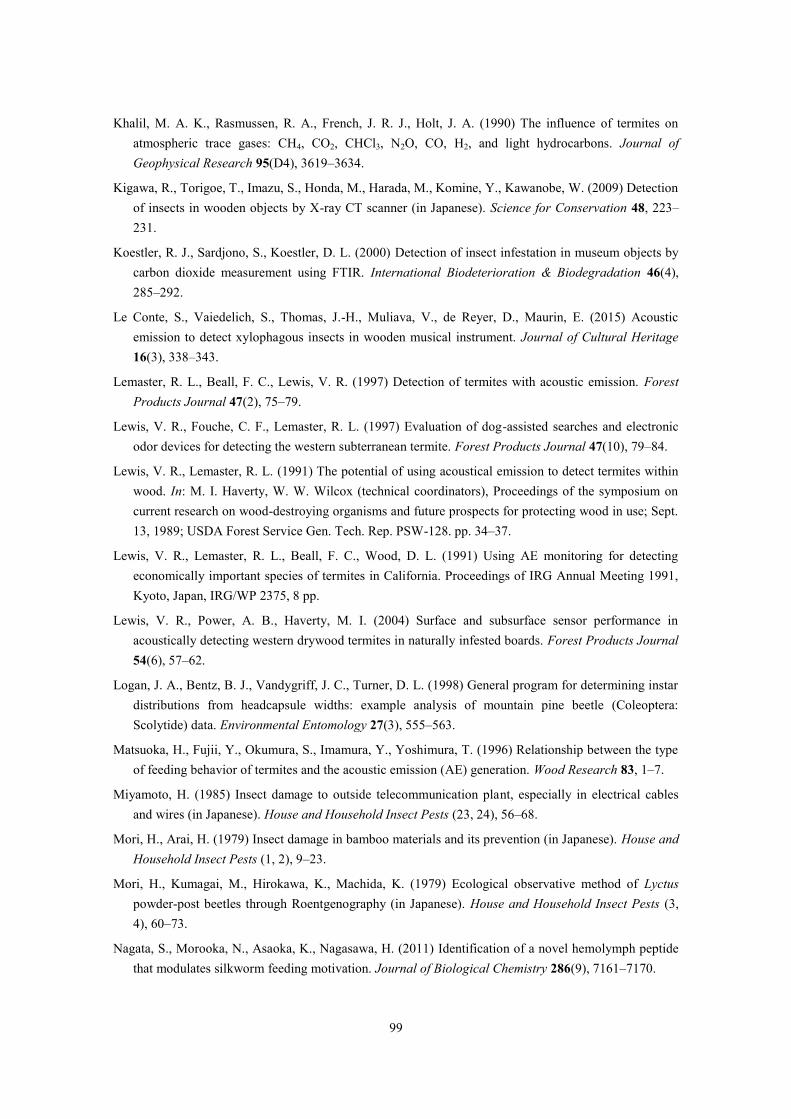
In this experiment, a total of seven larvae were traced until pupation. Figure 2.4
shows an example of a series of CT images representing the movement of one of the
larvae from the day it was first observed until it pupated. The larva was first observed
on day 0 near the inner surface of the specimen. It bored downward along the fiber
direction at all times. The entire tunnel was filled with dense frass, except for where the
larva was present, until day 9. After day 13, a hollow part of the tunnel appeared,
probably because the larva had bored a hole to the inner surface and frass was
discharged from the hole. The larva seemed to have grown notably by day 13, but it was
uncertain if the larvae had undergone ecdysis by then. On day 22, the silhouette of the
larva is not seen clearly in the CT image, suggesting that it was not still during the 320 s
of scan. The boring activity had stopped by day 22, and it was confirmed from the
silhouette that the larva had pupated by day 25.
Fig. 2.3. Life stages of D. minutus captured in CT images (below), in comparison with
microscopic photographs (above). The individuals shown in CT images are not the
same as in the microscopic photographs.
Page 25
21
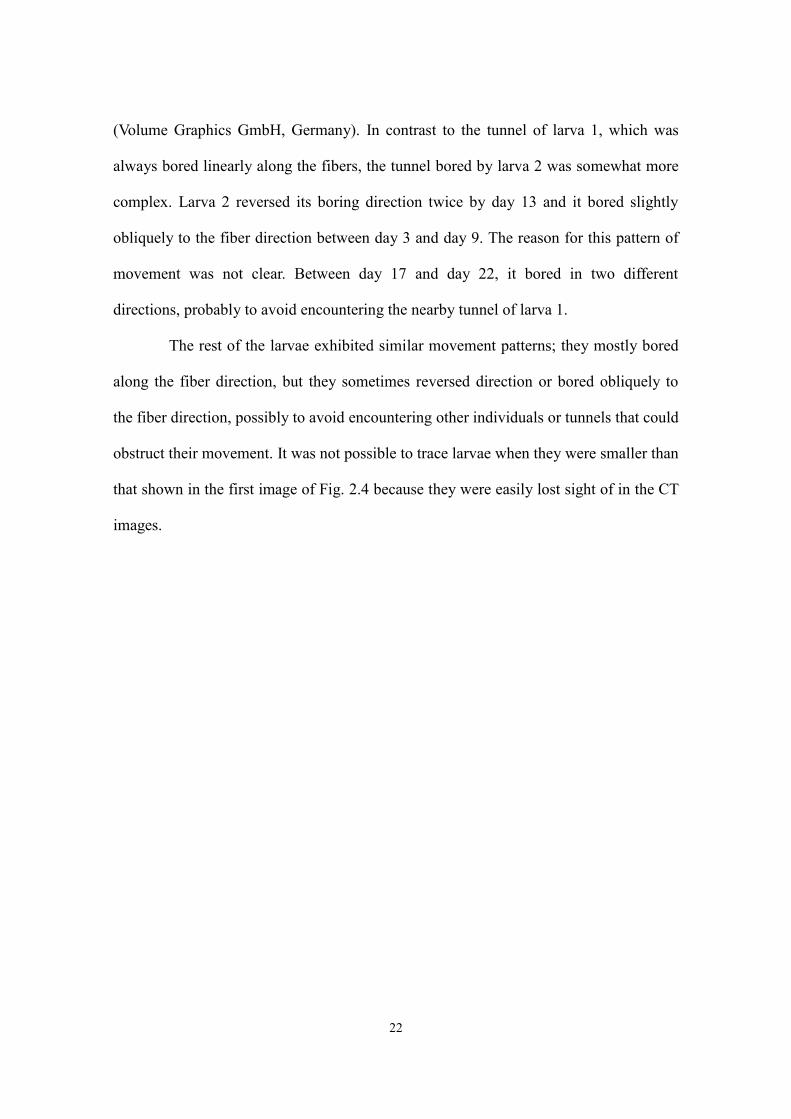
Figure 2.5 shows the 3D elongation process of the tunnels of two larvae, larvae
1 and 2, in one specimen, which were first observed on the same day. Larva 1 is the
same individual as shown in Fig. 2.4. The 3D image of the larval tunnels in Fig. 2.5 was
created by marking only the pixels of the cross-section of the tunnels in each slice.
Some parts of the tunnels where they are hollow were easily marked automatically by
adjusting the threshold gray level using ImageJ 1.45s software (W. S. Rasband, National
Institutes of Health, USA). However, it was difficult to automatically identify the parts
of the tunnels where they were filled with dense frass, so they were marked manually.
The 3D image was displayed using volume graphic software VGStudio MAX 2.0.5
Fig. 2.4. CT images representing the tunneling process of a larva. Dashed lines indicate the
same height.
Page 26
22
(Volume Graphics GmbH, Germany). In contrast to the tunnel of larva 1, which was
always bored linearly along the fibers, the tunnel bored by larva 2 was somewhat more
complex. Larva 2 reversed its boring direction twice by day 13 and it bored slightly
obliquely to the fiber direction between day 3 and day 9. The reason for this pattern of
movement was not clear. Between day 17 and day 22, it bored in two different
directions, probably to avoid encountering the nearby tunnel of larva 1.
The rest of the larvae exhibited similar movement patterns; they mostly bored
along the fiber direction, but they sometimes reversed direction or bored obliquely to
the fiber direction, possibly to avoid encountering other individuals or tunnels that could
obstruct their movement. It was not possible to trace larvae when they were smaller than
that shown in the first image of Fig. 2.4 because they were easily lost sight of in the CT
images.
Page 27
23
The obtained CT data seemed useful for quantitatively analyzing the process of
tunneling and the bamboo consumption by the larvae. Possible methods were
considered and described below. Changes in tunnel length could be easily measured in
CT images. One method for calculating the volume of the tunnel was to accumulate the
number of pixels in each slice that represented the cross section of the tunnel and
convert it to a volume. However, it was often difficult to automatically identify the parts
of the tunnel, as mentioned above, making this approach impractical. The tunnel volume
Fig. 2.5. 3D elongation process of the tunnels of larva 1 (left)
and larva 2 (right; labels italicized) in the same
specimen.
Page 28
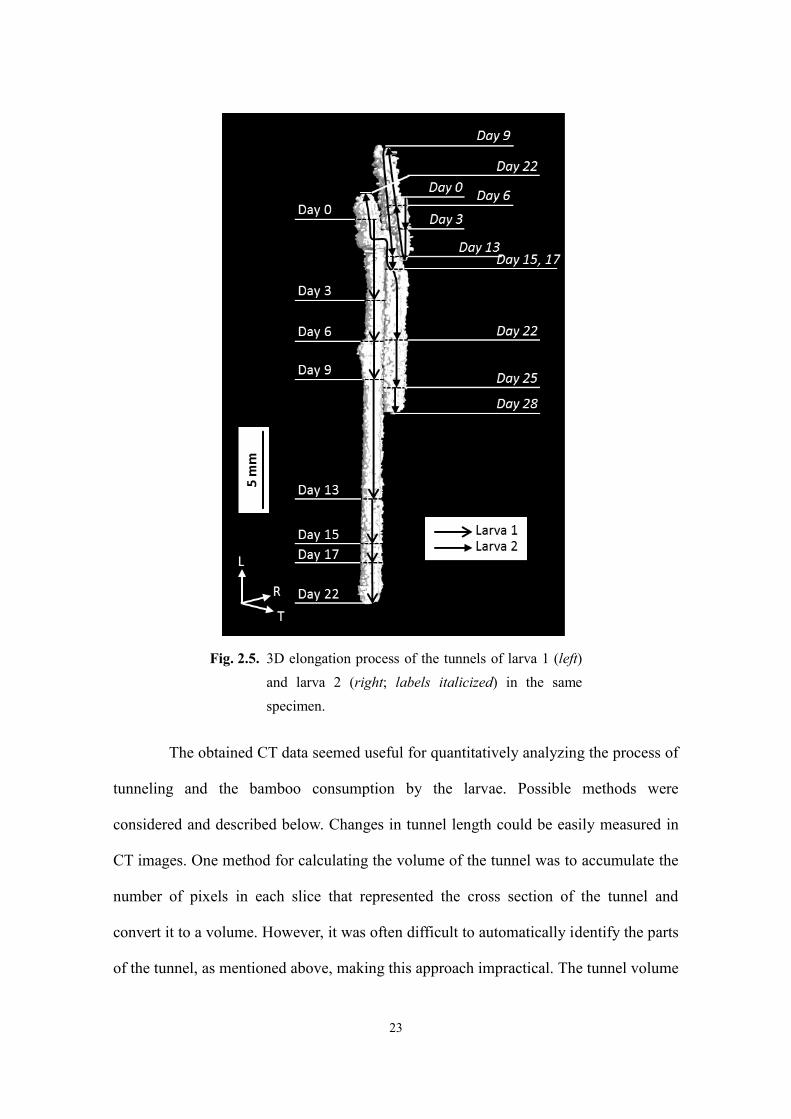
24
could be estimated by assuming that the cross section of the tunnel was elliptic and kept
the same area in a scanning interval. The major and minor axes of the cross section of
the tunnel (an example shown in Fig. 2.6) could be measured to calculate the
cross-sectional area. The volume change from the previous scan could be estimated by
multiplying the cross-sectional area by the increase in tunnel length. Images of the cross
sections near the end of the tunnels were recommended to be used to measure the
cross-sectional area because there was usually no frass around larvae at the end of the
tunnels.
So far, it was shown that the beetles in various developmental stages could be
visualized and the process of larval tunneling was traceable using X-ray CT. Quantified
larval growth and tunneling in the complete larval period will be discussed in the
following section.
Fig. 2.6. Cross section of a larval tunnel. White arrows
represent the two axes that could be used to calculate
the cross-sectional area, assuming it to be elliptical.
Page 29
25
2.3. Evaluation of individual egg-to-adult development and feeding behavior
2.3.1. Egg collecting
Eggs of D. minutus are mainly deposited into bamboo metaxylem vessels
(Garcia and Morrell 2009, Norhisham et al. 2015, Plank 1948, Ueda 1963, Wood
Technological Association of Japan 1961). Collecting such eggs unharmed from
bamboo pieces would be very difficult, and an alternative method was needed. Bletchly
(1960) developed the “veneer technique” to collect eggs of the brown powderpost beetle
Lyctus brunneus. Kartika and Yoshimura (2013) and Baba and Ainara (2014) reported
more convenient techniques utilizing nutrient-containing filter paper to collect eggs of
the powderpost beetle species L. africanus and L. brunneus, respectively. The latter
techniques were adaped for D. minutus. Sheets of filter paper cut into 26 × 65 or 26 ×
20 mm rectangles were soaked in an aqueous suspension containing 10% corn starch
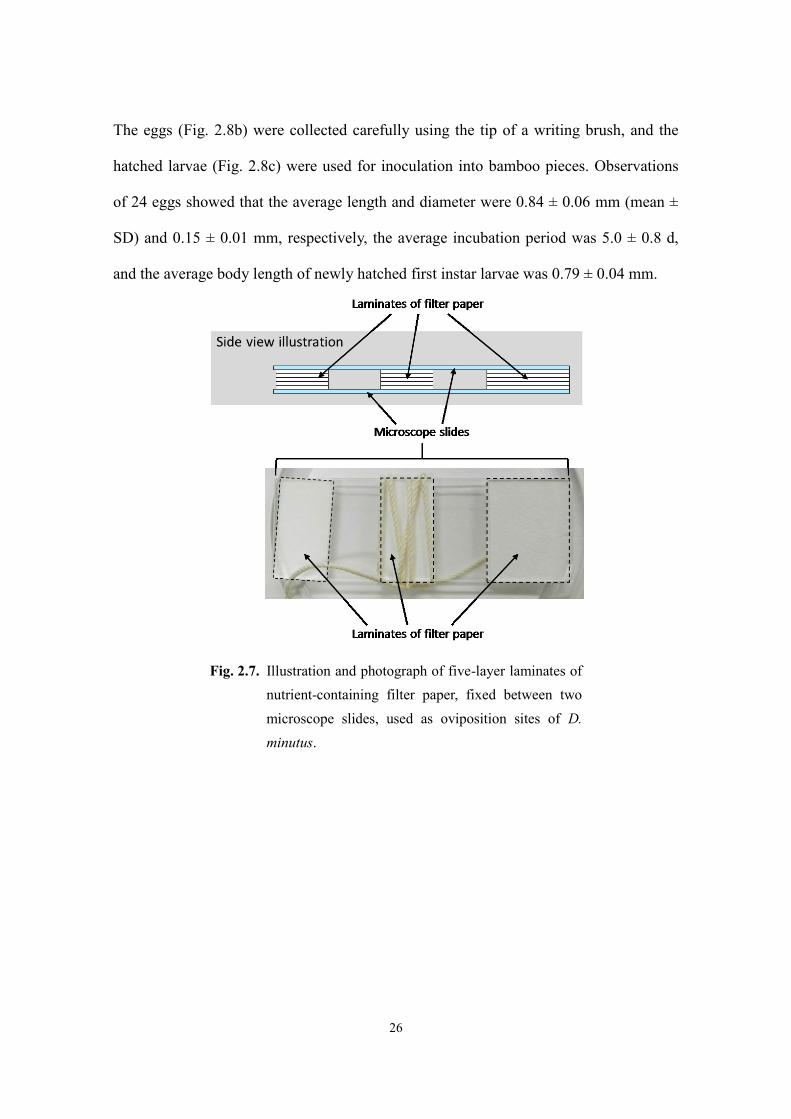
and 10% granulated sugar, and then dried at 60 °C for 1 h. Five-layered laminates of
treated filter paper were formed by folding sheets of 26 × 65 mm four times or stacking
five sheets of 26 × 20 mm. These laminates were fixed between two microscope slides
with a string (Fig. 2.7). The laminates of filter paper were exposed to 10–20 adults of D.
minutus inside Petri dishes and kept in an environmental chamber conditioned at 28 °C
and 65% relative humidity (RH). Adults were obtained from laboratory strains reared on
madake culms. The sexes of adults were not distinguished because adults do not have
apparent morphological sexual characteristics (Abood et al. 2010). Many of the adults
bored into the laminates of filter paper after exposure and, usually within 2 d, the
females began to oviposit along the bored tunnels (Fig. 2.8a) or at the edges of the
laminates. The boring behavior into laminates was not reported for Lyctus spp., which
usually laid eggs at the edges (Baba and Ainara 2014, Kartika and Yoshimura 2013).
Page 30
26
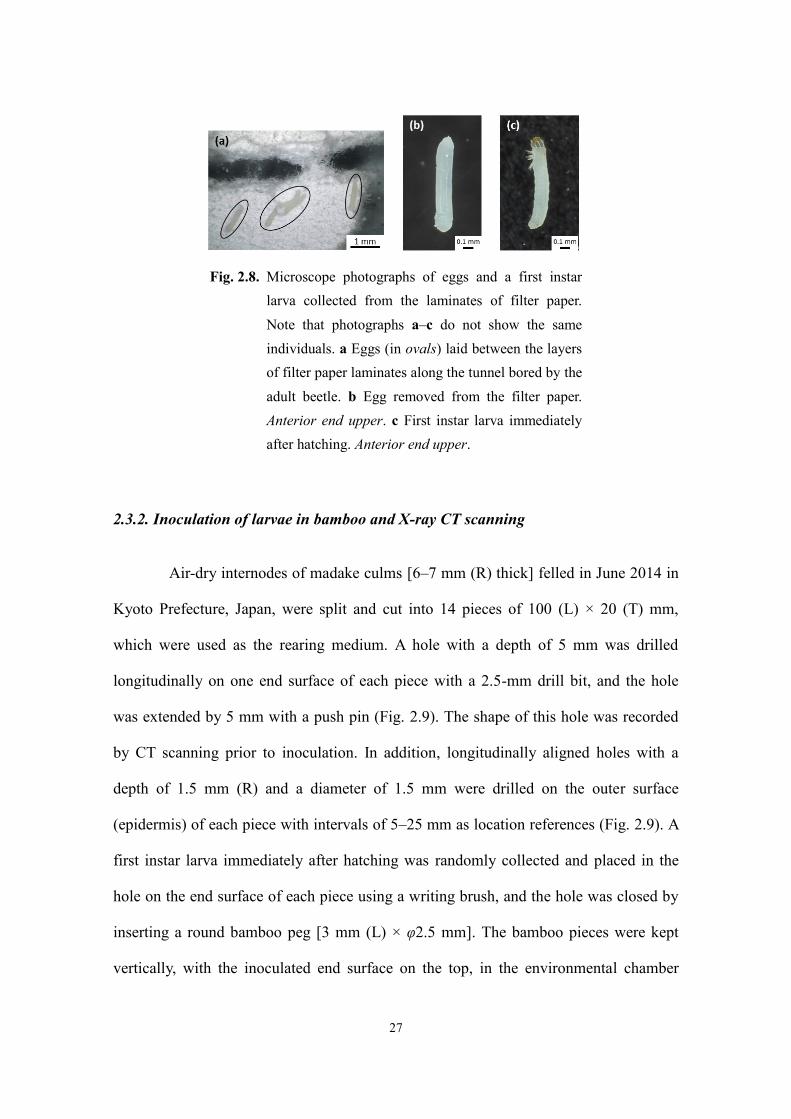
The eggs (Fig. 2.8b) were collected carefully using the tip of a writing brush, and the
hatched larvae (Fig. 2.8c) were used for inoculation into bamboo pieces. Observations
of 24 eggs showed that the average length and diameter were 0.84 ± 0.06 mm (mean ±
SD) and 0.15 ± 0.01 mm, respectively, the average incubation period was 5.0 ± 0.8 d,
and the average body length of newly hatched first instar larvae was 0.79 ± 0.04 mm.
Fig. 2.7. Illustration and photograph of five-layer laminates of
nutrient-containing filter paper, fixed between two
microscope slides, used as oviposition sites of D.
minutus.
Page 31
27
2.3.2. Inoculation of larvae in bamboo and X-ray CT scanning
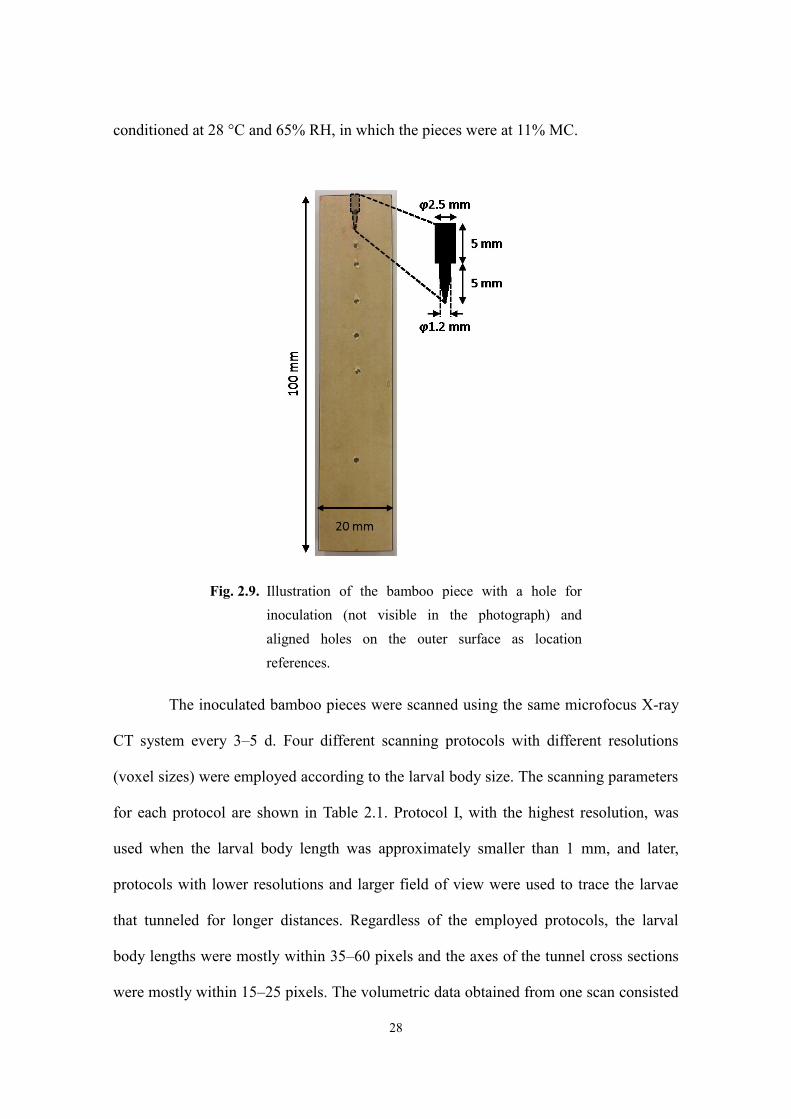
Air-dry internodes of madake culms [6–7 mm (R) thick] felled in June 2014 in
Kyoto Prefecture, Japan, were split and cut into 14 pieces of 100 (L) × 20 (T) mm,
which were used as the rearing medium. A hole with a depth of 5 mm was drilled
longitudinally on one end surface of each piece with a 2.5-mm drill bit, and the hole
was extended by 5 mm with a push pin (Fig. 2.9). The shape of this hole was recorded
by CT scanning prior to inoculation. In addition, longitudinally aligned holes with a
depth of 1.5 mm (R) and a diameter of 1.5 mm were drilled on the outer surface
(epidermis) of each piece with intervals of 5–25 mm as location references (Fig. 2.9). A
first instar larva immediately after hatching was randomly collected and placed in the
hole on the end surface of each piece using a writing brush, and the hole was closed by
inserting a round bamboo peg [3 mm (L) × φ2.5 mm]. The bamboo pieces were kept
vertically, with the inoculated end surface on the top, in the environmental chamber
Fig. 2.8. Microscope photographs of eggs and a first instar
larva collected from the laminates of filter paper.
Note that photographs a–c do not show the same
individuals. a Eggs (in ovals) laid between the layers
of filter paper laminates along the tunnel bored by the
adult beetle. b Egg removed from the filter paper.
Anterior end upper. c First instar larva immediately
after hatching. Anterior end upper.
Page 32
28
conditioned at 28 °C and 65% RH, in which the pieces were at 11% MC.
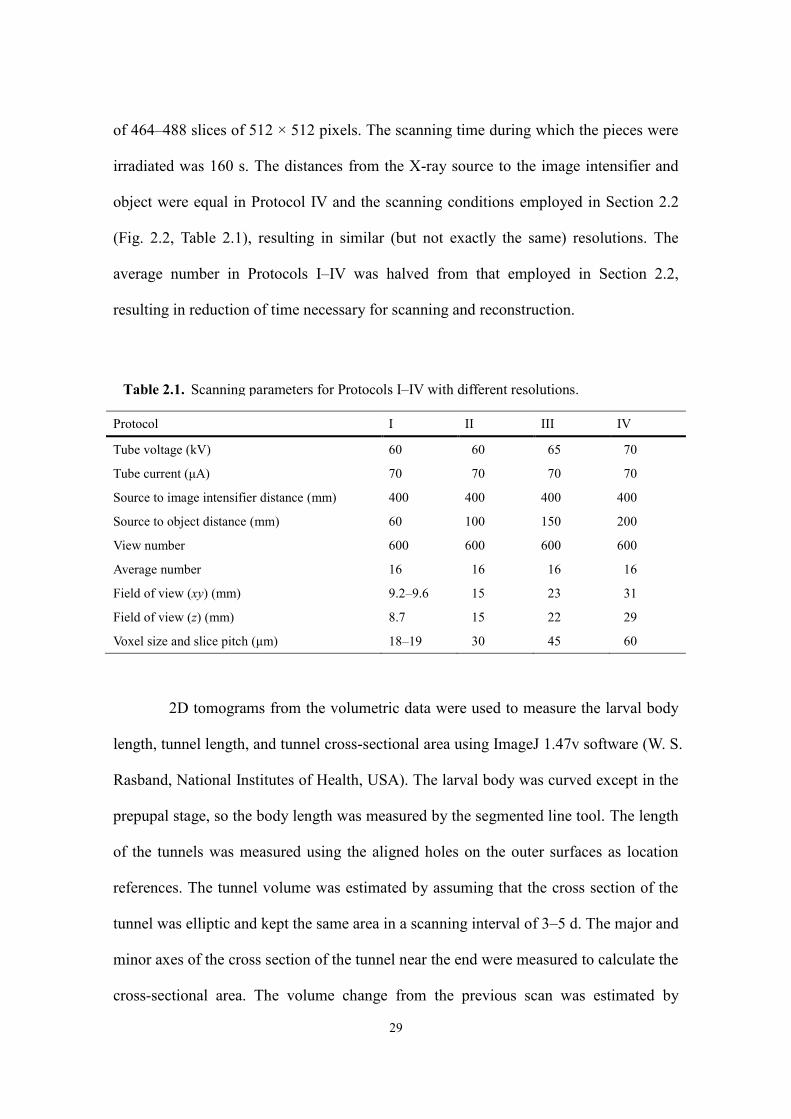
The inoculated bamboo pieces were scanned using the same microfocus X-ray
CT system every 3–5 d. Four different scanning protocols with different resolutions
(voxel sizes) were employed according to the larval body size. The scanning parameters
for each protocol are shown in Table 2.1. Protocol I, with the highest resolution, was
used when the larval body length was approximately smaller than 1 mm, and later,
protocols with lower resolutions and larger field of view were used to trace the larvae
that tunneled for longer distances. Regardless of the employed protocols, the larval
body lengths were mostly within 35–60 pixels and the axes of the tunnel cross sections
were mostly within 15–25 pixels. The volumetric data obtained from one scan consisted
Fig. 2.9. Illustration of the bamboo piece with a hole for
inoculation (not visible in the photograph) and
aligned holes on the outer surface as location
references.
Page 33
29
of 464–488 slices of 512 × 512 pixels. The scanning time during which the pieces were
irradiated was 160 s. The distances from the X-ray source to the image intensifier and
object were equal in Protocol IV and the scanning conditions employed in Section 2.2
(Fig. 2.2, Table 2.1), resulting in similar (but not exactly the same) resolutions. The
average number in Protocols I–IV was halved from that employed in Section 2.2,
resulting in reduction of time necessary for scanning and reconstruction.
Protocol I II III IV
Tube voltage (kV) 60 60 65 70
Tube current (μA) 70 70 70 70
Source to image intensifier distance (mm) 400 400 400 400
Source to object distance (mm) 60 100 150 200
View number 600 600 600 600
Average number 16 16 16 16
Field of view (xy) (mm) 9.2–9.6 15 23 31
Field of view (z) (mm) 8.7 15 22 29
Voxel size and slice pitch (μm) 18–19 30 45 60
2D tomograms from the volumetric data were used to measure the larval body
length, tunnel length, and tunnel cross-sectional area using ImageJ 1.47v software (W. S.
Rasband, National Institutes of Health, USA). The larval body was curved except in the
prepupal stage, so the body length was measured by the segmented line tool. The length
of the tunnels was measured using the aligned holes on the outer surfaces as location
references. The tunnel volume was estimated by assuming that the cross section of the
tunnel was elliptic and kept the same area in a scanning interval of 3–5 d. The major and
minor axes of the cross section of the tunnel near the end were measured to calculate the
cross-sectional area. The volume change from the previous scan was estimated by
Table 2.1. Scanning parameters for Protocols I–IV with different resolutions.
Page 34
30
multiplying the cross-sectional area by the increase in tunnel length.
CT scans were continued after adult eclosion. The bamboo pieces containing
adults were individually kept in glass bottles in the environmental chamber with no light
source.
2.3.3. Results and discussion on larval–pupal development and larval feeding
Of the 14 first instar larvae, three either died or were lost track of by the time of
the first CT scanning. The other 11 individuals all successfully pupated and emerged
into adults. The results and discussion are based on these 11 individuals.
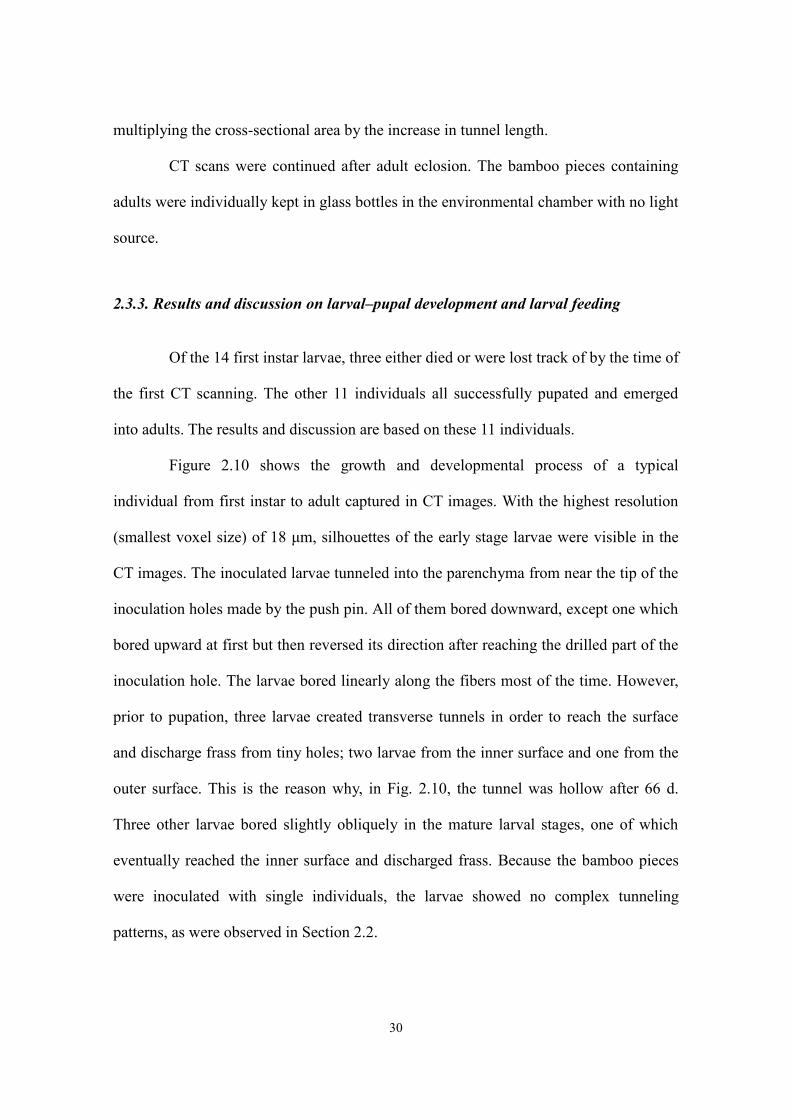
Figure 2.10 shows the growth and developmental process of a typical
individual from first instar to adult captured in CT images. With the highest resolution
(smallest voxel size) of 18 μm, silhouettes of the early stage larvae were visible in the
CT images. The inoculated larvae tunneled into the parenchyma from near the tip of the
inoculation holes made by the push pin. All of them bored downward, except one which
bored upward at first but then reversed its direction after reaching the drilled part of the
inoculation hole. The larvae bored linearly along the fibers most of the time. However,
prior to pupation, three larvae created transverse tunnels in order to reach the surface
and discharge frass from tiny holes; two larvae from the inner surface and one from the
outer surface. This is the reason why, in Fig. 2.10, the tunnel was hollow after 66 d.
Three other larvae bored slightly obliquely in the mature larval stages, one of which
eventually reached the inner surface and discharged frass. Because the bamboo pieces
were inoculated with single individuals, the larvae showed no complex tunneling
patterns, as were observed in Section 2.2.
Page 35
31
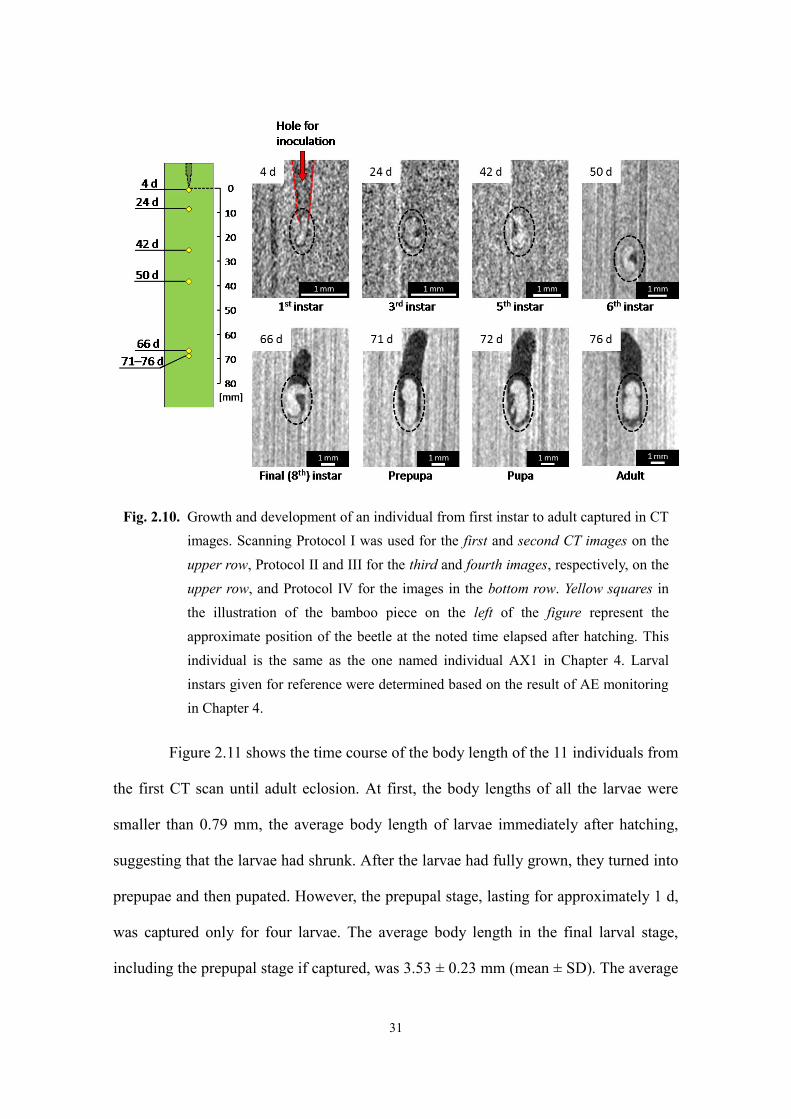
Figure 2.11 shows the time course of the body length of the 11 individuals from
the first CT scan until adult eclosion. At first, the body lengths of all the larvae were
smaller than 0.79 mm, the average body length of larvae immediately after hatching,
suggesting that the larvae had shrunk. After the larvae had fully grown, they turned into
prepupae and then pupated. However, the prepupal stage, lasting for approximately 1 d,
was captured only for four larvae. The average body length in the final larval stage,
including the prepupal stage if captured, was 3.53 ± 0.23 mm (mean ± SD). The average
Fig. 2.10. Growth and development of an individual from first instar to adult captured in CT
images. Scanning Protocol I was used for the first and second CT images on the
upper row, Protocol II and III for the third and fourth images, respectively, on the
upper row, and Protocol IV for the images in the bottom row. Yellow squares in
the illustration of the bamboo piece on the left of the figure represent the
approximate position of the beetle at the noted time elapsed after hatching. This
individual is the same as the one named individual AX1 in Chapter 4. Larval
instars given for reference were determined based on the result of AE monitoring
in Chapter 4.
Page 36
32
body lengths of pupae and adults were 3.42 ± 0.09 mm and 3.18 ± 0.17 mm,
respectively. The average larval duration, calculated as the time from inoculation to the
first observation of either the prepupal or pupal stage, was 61 ± 11 d. In this study, when
discussing larval durations, the larvae were regarded as having pupated when the
silhouettes of prepupae were captured. The total duration of larval and pupal stages,
calculated as the time from inoculation to first observation of the adult stage, was 66 ±
11 d. The average pupal duration, therefore, was estimated to be 5 d. Although the larval
growth was clearly observed, the CT images provided no clear evidence of ecdysis. This
was because continuous analysis of growth or feeding was impracticable by CT
scanning. As an alternative approach, the applicability of acoustic emission (AE) for
continuous monitoring is discussed in Chapters 3 and 4.
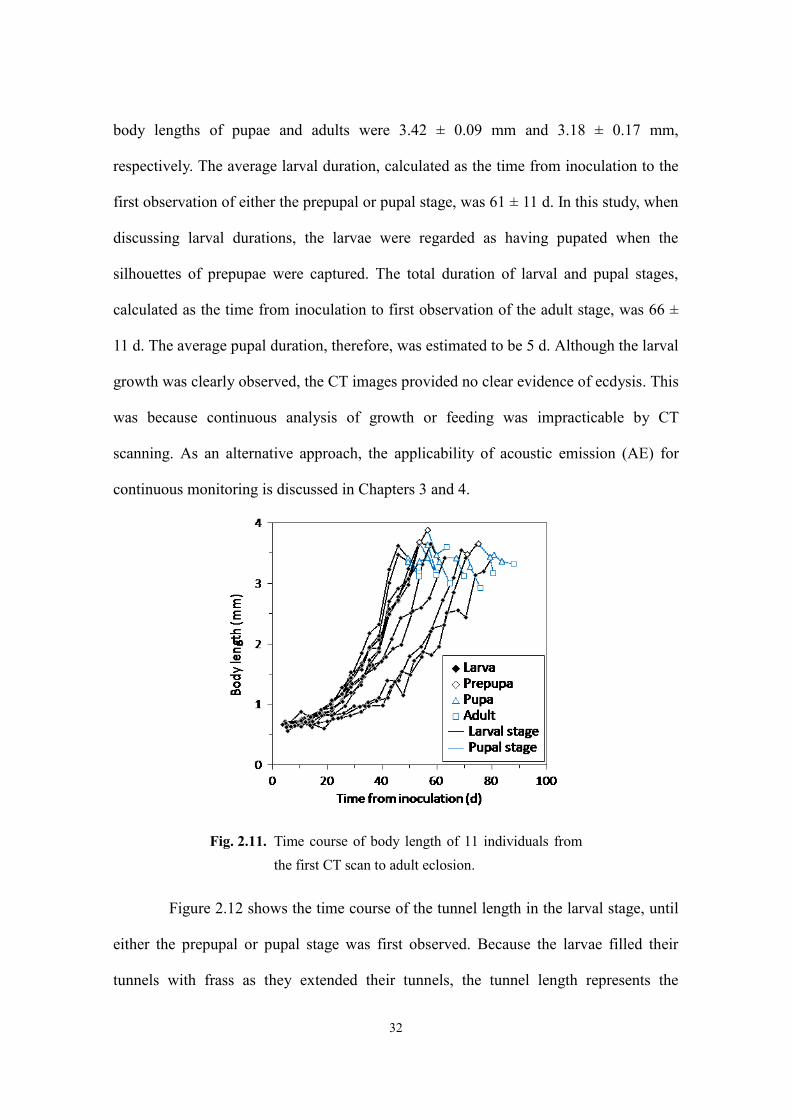
Figure 2.12 shows the time course of the tunnel length in the larval stage, until
either the prepupal or pupal stage was first observed. Because the larvae filled their
tunnels with frass as they extended their tunnels, the tunnel length represents the
Fig. 2.11. Time course of body length of 11 individuals from
the first CT scan to adult eclosion.
Page 37
33
distance they moved. The “tunneling speed” increased as the larvae developed from the
first to final instars, and prior to pupation the tunnel length reached 80.2 ± 4.8 mm. The
average tunneling speed for the entire larval stage was 1.34 ± 0.20 mm/d.
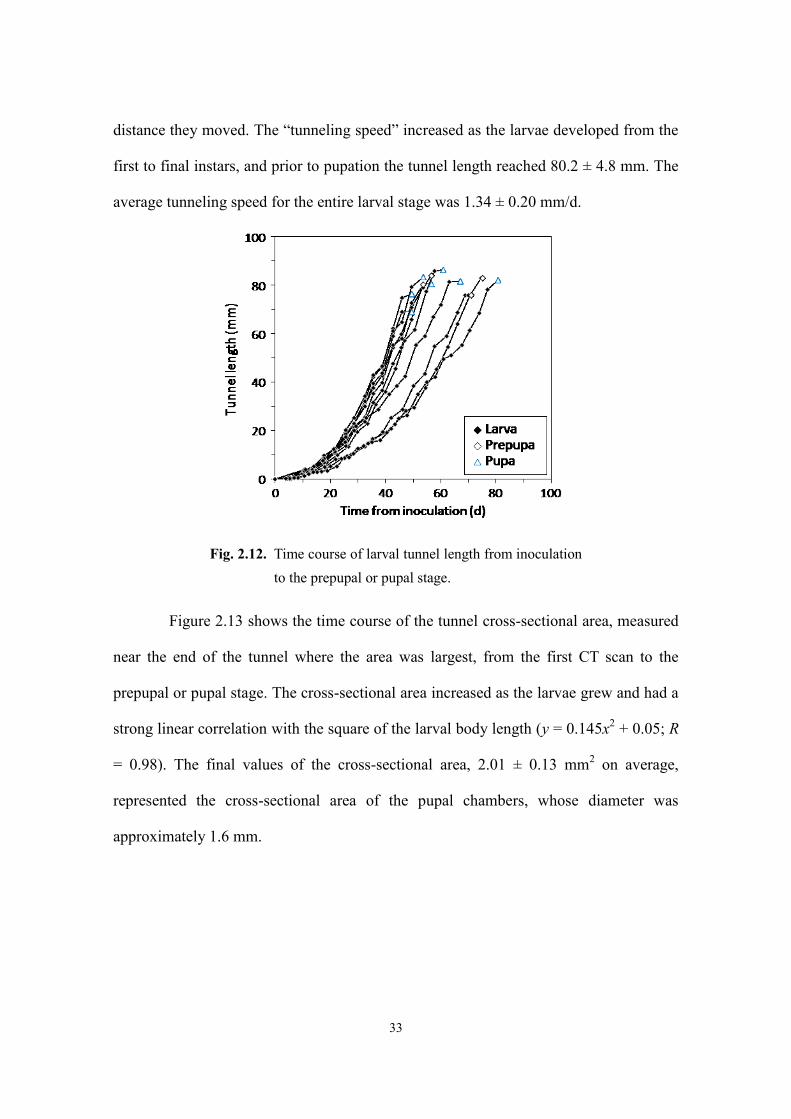
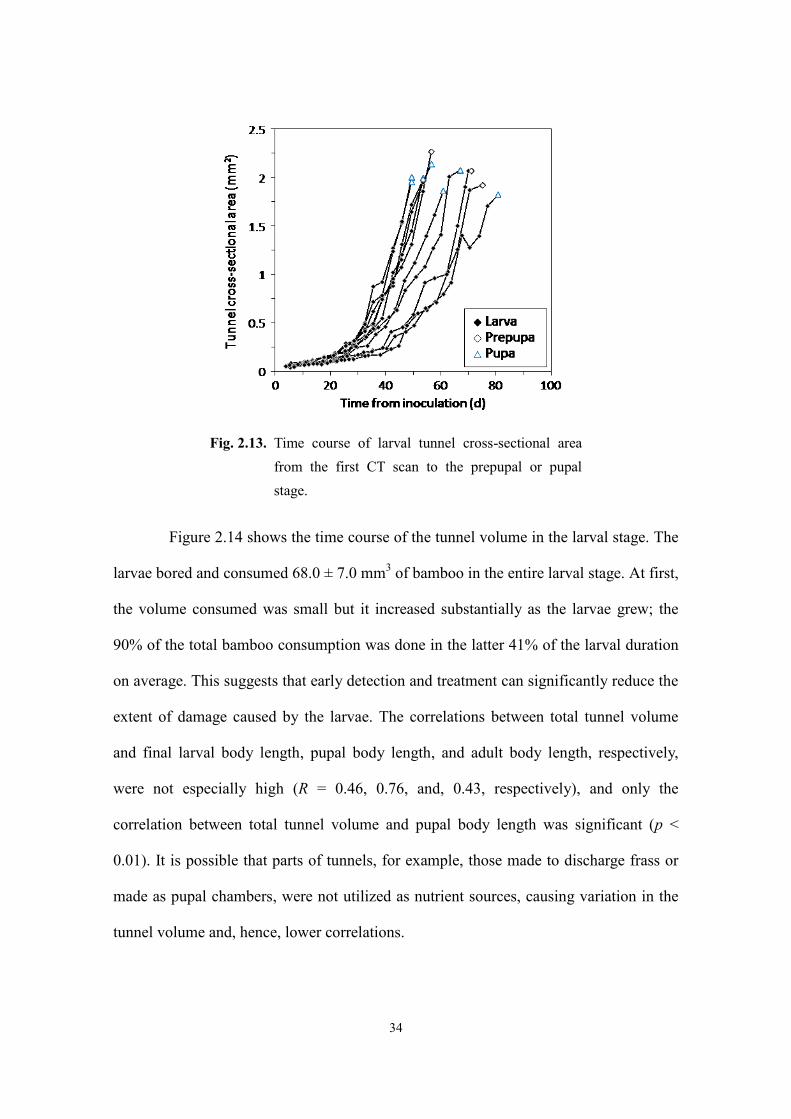
Figure 2.13 shows the time course of the tunnel cross-sectional area, measured
near the end of the tunnel where the area was largest, from the first CT scan to the
prepupal or pupal stage. The cross-sectional area increased as the larvae grew and had a
strong linear correlation with the square of the larval body length (y = 0.145x2 + 0.05; R
= 0.98). The final values of the cross-sectional area, 2.01 ± 0.13 mm2 on average,
represented the cross-sectional area of the pupal chambers, whose diameter was
approximately 1.6 mm.
Fig. 2.12. Time course of larval tunnel length from inoculation
to the prepupal or pupal stage.
Page 38
34
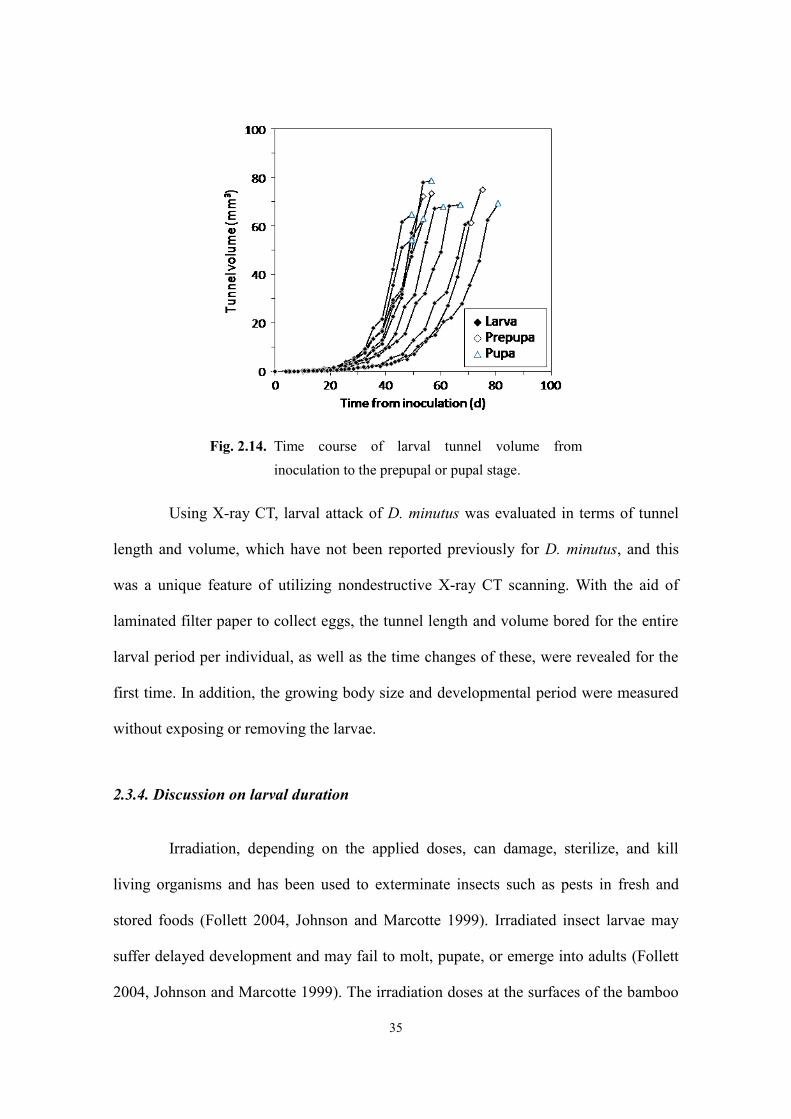
Figure 2.14 shows the time course of the tunnel volume in the larval stage. The
larvae bored and consumed 68.0 ± 7.0 mm3 of bamboo in the entire larval stage. At first,
the volume consumed was small but it increased substantially as the larvae grew; the
90% of the total bamboo consumption was done in the latter 41% of the larval duration
on average. This suggests that early detection and treatment can significantly reduce the
extent of damage caused by the larvae. The correlations between total tunnel volume
and final larval body length, pupal body length, and adult body length, respectively,
were not especially high (R = 0.46, 0.76, and, 0.43, respectively), and only the
correlation between total tunnel volume and pupal body length was significant (p <
0.01). It is possible that parts of tunnels, for example, those made to discharge frass or
made as pupal chambers, were not utilized as nutrient sources, causing variation in the
tunnel volume and, hence, lower correlations.
Fig. 2.13. Time course of larval tunnel cross-sectional area
from the first CT scan to the prepupal or pupal
stage.
Page 39
35
Using X-ray CT, larval attack of D. minutus was evaluated in terms of tunnel
length and volume, which have not been reported previously for D. minutus, and this
was a unique feature of utilizing nondestructive X-ray CT scanning. With the aid of
laminated filter paper to collect eggs, the tunnel length and volume bored for the entire
larval period per individual, as well as the time changes of these, were revealed for the
first time. In addition, the growing body size and developmental period were measured
without exposing or removing the larvae.
2.3.4. Discussion on larval duration
Irradiation, depending on the applied doses, can damage, sterilize, and kill
living organisms and has been used to exterminate insects such as pests in fresh and
stored foods (Follett 2004, Johnson and Marcotte 1999). Irradiated insect larvae may
suffer delayed development and may fail to molt, pupate, or emerge into adults (Follett
2004, Johnson and Marcotte 1999). The irradiation doses at the surfaces of the bamboo
Fig. 2.14. Time course of larval tunnel volume from
inoculation to the prepupal or pupal stage.
Page 40
36
pieces or at the insect body surfaces during CT scans were not measured or estimated,
but by comparing larval durations, the larval development was estimated to be
unaffected by CT scanning. In Chapter 4, based on the results of AE monitoring of the
larval development, it will be presented that the average larval duration of eight
un-irradiated individuals was 64.8 d. The larval duration of irradiated larvae used for CT
scanning was not significantly different from that of un-irradiated larvae (p > 0.1;
Student’s t-test). In addition, all of the successfully inoculated larvae pupated and
emerged without abnormality after repeated CT scans. Therefore, the X-ray irradiation
employed during CT scans was not considered to have hindered the development of the
larvae.
Several previous reports from outside of Japan describe the larval duration of D.
minutus and are summarized here for reference. Plank (1948) reported that, with
monthly average temperatures of 26.0–26.8 °C, the larval duration was 41.4 ± 1.5 d
(mean ± SE, n = 98). Garcia and Morrell (2009) measured larval duration at different
temperatures (15–30 °C) to determine the thermal thresholds and requirements, and at
temperatures close to the experimental condition of this study: 25, 28, and 30 °C, the
larval duration was 51.7 ± 1.2 d (mean ± SE, n = 24), 46.3 ± 0.7 d (mean ± SE, n = 25),
and 43.8 ± 0.5 d (mean ± SE, n = 26), respectively. According to Abood and Norhisham
(2013) and Norhisham et al. (2015), the larval duration of individuals fed with cassava
flour at 27 °C was 52.80 ± 0.31 d (mean ± SE, n = 50) and that of individuals reared on
bamboo at 25 °C was 44.2 ± 0.3 d (mean ± SE, n = 20), respectively. The value of larval
duration found in this study, 61 ± 3 d (mean ± SE, n = 11), was longer than those
reported previously, but these values cannot be simply compared because of underlying
differences in many factors. As Garcia and Morrell (2009) showed, temperature greatly
influences larval development. However, temperature hardly explains the differences
Page 41
37
among these values because of the extremely low correlation (R = 0.04). Other possible
factors may include regional and population differences and differences in species,
nutrient contents, and moisture and other physical conditions of the employed rearing
media. Some Japanese books describe the larval duration of D. minutus to be 20 d (The
Society of House and Household Pests Science, Japan 1995) or 20–40 d (Tokyo
National Research Institute for Cultural Properties 2001, Yamano 1976); however, the
methods of examination are not noted in these books and the validity of these values
cannot be discussed.
The larval duration varied greatly from 49 to 81 d in this experiment. The final
larval body length, pupal body length, and adult body length were not significantly
correlated with larval duration (p > 0.1). This suggests that, although the variation in
larval duration, and hence the variation in rate of development, may be inherent in D.
minutus, each larva is capable of developing into an adult of a certain body size. The
variation in the developmental period may also explain the simultaneous presence of
larval and adult stages throughout the year.
2.3.5. Pre-mating adult feeding
Adult beetles started boring new tunnels within 3 d after eclosion. They made
holes that were smaller than their body size on the inner surfaces of bamboo and
discharged frass from these holes. In 8 ± 1 d (mean ± SD) after eclosion, they made exit
holes on the inner surface, from which frass was also discharged. Even after making exit
holes, the adults usually remained hidden inside the bamboo pieces. When the pupal
chambers were not adjacent to the bamboo inner surface, the adults first bored obliquely
to the fibers to reach the inner surface. Afterwards, most of the adults bored tunnels
Page 42
38
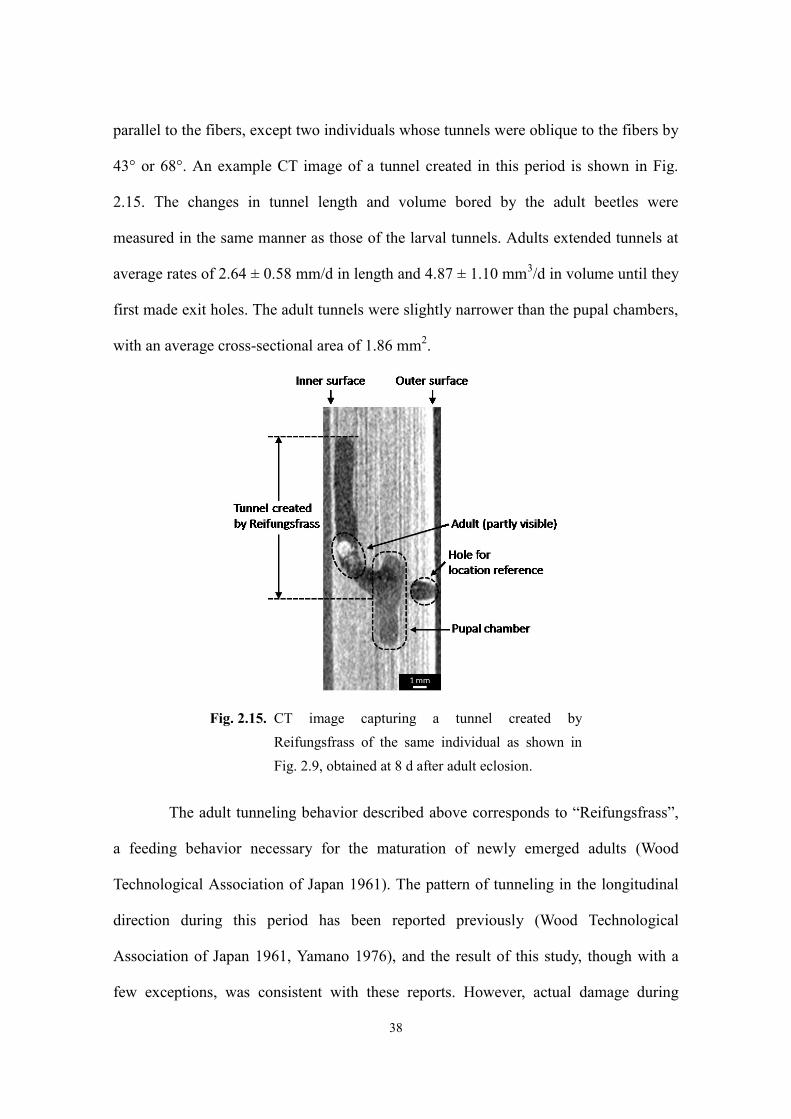
parallel to the fibers, except two individuals whose tunnels were oblique to the fibers by
43° or 68°. An example CT image of a tunnel created in this period is shown in Fig.
2.15. The changes in tunnel length and volume bored by the adult beetles were
measured in the same manner as those of the larval tunnels. Adults extended tunnels at
average rates of 2.64 ± 0.58 mm/d in length and 4.87 ± 1.10 mm3/d in volume until they
first made exit holes. The adult tunnels were slightly narrower than the pupal chambers,
with an average cross-sectional area of 1.86 mm2.
The adult tunneling behavior described above corresponds to “Reifungsfrass”,
a feeding behavior necessary for the maturation of newly emerged adults (Wood
Technological Association of Japan 1961). The pattern of tunneling in the longitudinal
direction during this period has been reported previously (Wood Technological
Association of Japan 1961, Yamano 1976), and the result of this study, though with a
few exceptions, was consistent with these reports. However, actual damage during
Fig. 2.15. CT image capturing a tunnel created by
Reifungsfrass of the same individual as shown in
Fig. 2.9, obtained at 8 d after adult eclosion.
Page 43
39
Reifungsfrass was quantified for the first time.
Mature adults exit the culms and mate, and mated females re-enter bamboo
culms and bore new tunnels in which to lay eggs (Plank 1948, Ueda 1963, Wood
Technological Association of Japan 1961, Yamano 1976). It was reported that female
adults tunnel transversely to the bamboo fibers in the process of oviposition (Plank 1948,
Wood Technological Association of Japan 1961, Yamano 1976). However, details of the
extent of damage they cause during the ovipositional period are unknown, and
nondestructive analysis of the ovipositional behavior is a topic of subsequent research.
2.4. Summary
In this chapter, two series of experiments were described. First, bamboo
specimens artificially infested with D. minutus were scanned using a microfocus X-ray
CT system every 2–5 days. Silhouettes of larvae, pupae, and adults were clearly
recognizable in the CT images, and they were distinguishable from the bamboo, beetle
tunnels, and frass. Then, individuals in separate bamboo pieces were traced from the
first instar using the X-ray CT system with resolutions of 18–60 μm/voxel. Laminates of
filter paper containing sugar and starch were an effective artificial oviposition medium
and facilitated monitoring from the first instar. The collected eggs were 0.84 ± 0.06 mm
(mean ± SD) in length, and the egg duration lasted 5.0 ± 0.8 d. Based on CT images, the
larvae grew to 3.53 ± 0.23 mm in body length and turned into pupae of 3.42 ± 0.09 mm.
The larvae bored tunnels with a length of 80.2 ± 4.8 mm and a volume of 68.0 ± 7.0
mm3 over the larval period of 61 ± 11 d. CT scans were continued after adult eclosion to
analyze pre-mating adult feeding. Newly emerged adults remained in the bamboo pieces
to feed before making exit holes in 8 ± 1 d after adult eclosion. During this period, they
Page 44
40
bored tunnels at rates of 2.64 ± 0.58 mm/d in length and 4.87 ± 1.10 mm3/d in volume.
X-ray CT was an effective tool to nondestructively and quantitatively evaluate the
development and feeding of D. minutus, and a methodology for the nondestructive
evaluation of body size, tunneling behavior, and bamboo consumption in the
egg-to-adult development was developed.
Page 45
41
Chapter 3. Relationship between the movements of the mouthparts and
the generation of acoustic emission2
3.1. Introduction
In the previous chapter, X-ray computed tomography (CT) was shown to be an
effective tool to for nondestructively observing and quantifying the larval growth and
tunneling of the bamboo powderpost beetle Dinoderus minutus. On the other hand,
because of the inability to conduct continuous monitoring, uncertainty remained
regarding the activity of the larvae between the CT scans. Acoustic emission (AE) drew
the author’s attention as an approach to monitor the feeding of larvae continuously. As
reviewed in Chapter 1, AE monitoring has been applied as a nondestructive technique to
detect invisible termite attack in wood and wooden constructions (Fujii et al. 1998,
Yanase et al. 1999, 2001). Fujii et al. (1995) and Matsuoka et al. (1996) directly
confirmed that AE waves were generated by the feeding activity of termites. AE
monitoring was also applied to biological analyses of termite feeding under different
conditions (Imamura and Fujii 1995, Indrayani et al. 2003, 2007a, 2007b). Furthermore,
some studies dealt with AE detected from wood specimens inoculated with larvae of
wood-boring beetles or wooden objects infested by beetles (Creemers 2013, 2015, Fujii
et al. 1992, 1994, Imamura et al. 1998, Le Conte et al. 2015). These previous studies
suggested that the feeding activity of D. minutus should generate AE events, and the
detection of AE waves could allow continuous analysis of their feeding that was not
accomplished by X-ray CT.
2 Originally published in: Watanabe, H., Yanase, Y., Fujii, Y. (2016) Relationship between the
movements of the mouthparts of the bamboo powder-post beetle Dinoderus minutus and the
generation of acoustic emission. Journal of Wood Science 62(1), 85–92. The online publication of
this article (doi: 10.1007/s10086-015-1525-4) contains electronic supplementary material, which is
available to authorized users.
Page 46
42
In order to evaluate the activity of D. minutus in bamboo culms by detecting
AE waves from the bamboo surface, it is essential beforehand to confirm that the
beetles’ activities, most importantly feeding activity, actually produce detectable AE
waves and to clarify the mechanism of AE generation. Although it was directly
confirmed for four termite species that the feeding activity generated AE events (Fujii et
al. 1995, Indrayani et al. 2007b, Matsuoka et al. 1996), no studies focused on the direct
examination of AE events generated by coleopteran species. This chapter describes the
experiment in which the behavior of D. minutus, both larvae and adults, on a small
bamboo specimen was observed using a microscope camera while AE measurement of
the bamboo specimen attached to an AE sensor was conducted simultaneously. The
relationship between the movements of the mouthparts, particularly mandibles, of the
larvae and adults and the generation of AE is discussed.
3.2. Materials and methods
3.2.1. Experimental insects and bamboo specimens
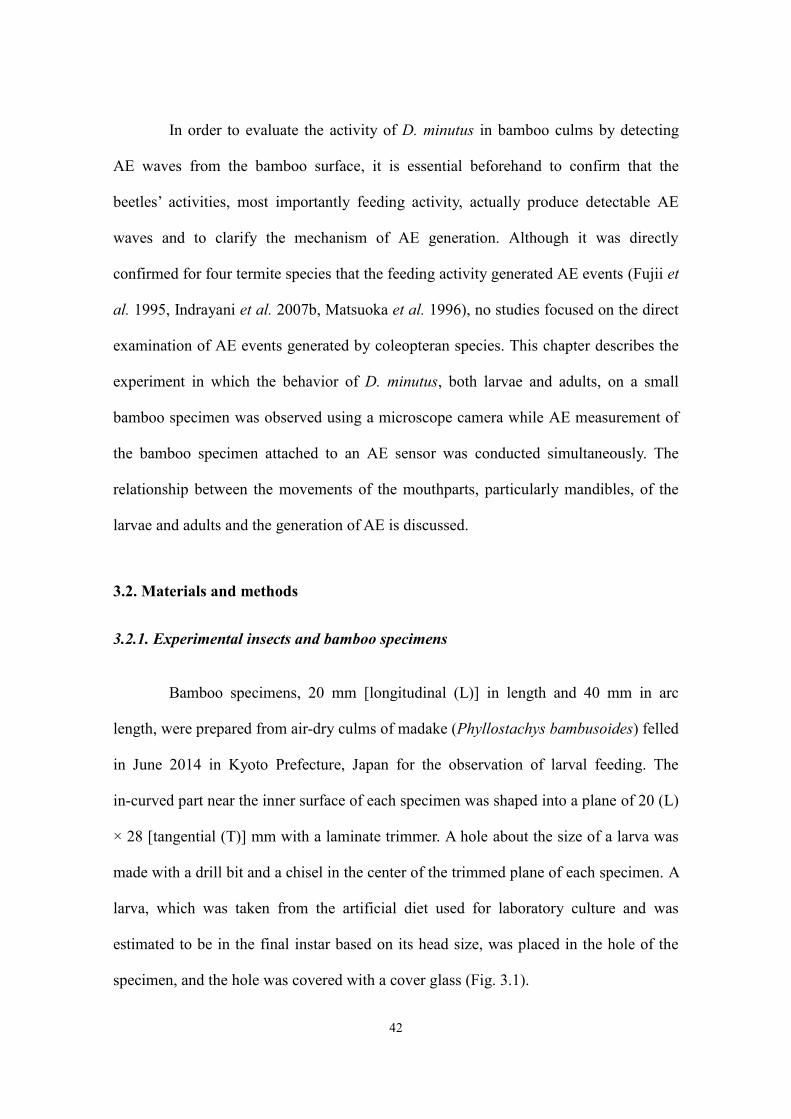
Bamboo specimens, 20 mm [longitudinal (L)] in length and 40 mm in arc
length, were prepared from air-dry culms of madake (Phyllostachys bambusoides) felled
in June 2014 in Kyoto Prefecture, Japan for the observation of larval feeding. The
in-curved part near the inner surface of each specimen was shaped into a plane of 20 (L)
× 28 [tangential (T)] mm with a laminate trimmer. A hole about the size of a larva was
made with a drill bit and a chisel in the center of the trimmed plane of each specimen. A
larva, which was taken from the artificial diet used for laboratory culture and was
estimated to be in the final instar based on its head size, was placed in the hole of the
specimen, and the hole was covered with a cover glass (Fig. 3.1).
Page 47
43
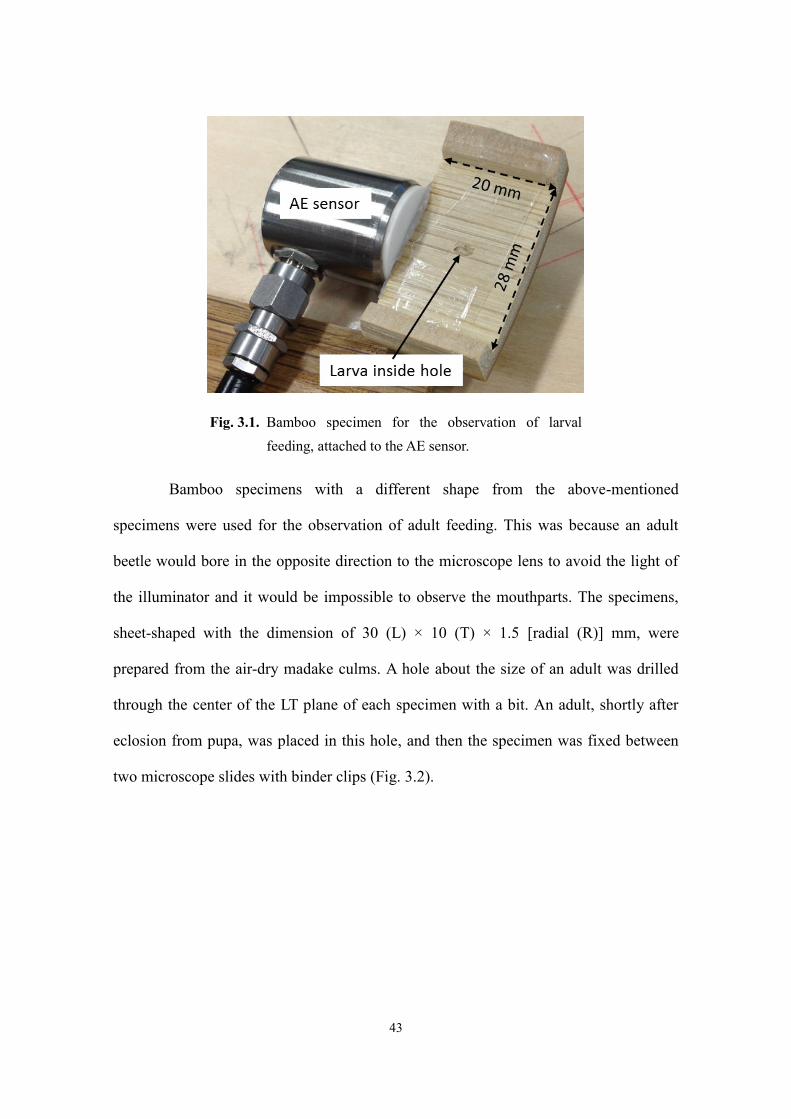
Bamboo specimens with a different shape from the above-mentioned
specimens were used for the observation of adult feeding. This was because an adult
beetle would bore in the opposite direction to the microscope lens to avoid the light of
the illuminator and it would be impossible to observe the mouthparts. The specimens,
sheet-shaped with the dimension of 30 (L) × 10 (T) × 1.5 [radial (R)] mm, were
prepared from the air-dry madake culms. A hole about the size of an adult was drilled
through the center of the LT plane of each specimen with a bit. An adult, shortly after
eclosion from pupa, was placed in this hole, and then the specimen was fixed between
two microscope slides with binder clips (Fig. 3.2).
Fig. 3.1. Bamboo specimen for the observation of larval
feeding, attached to the AE sensor.
Page 48
44
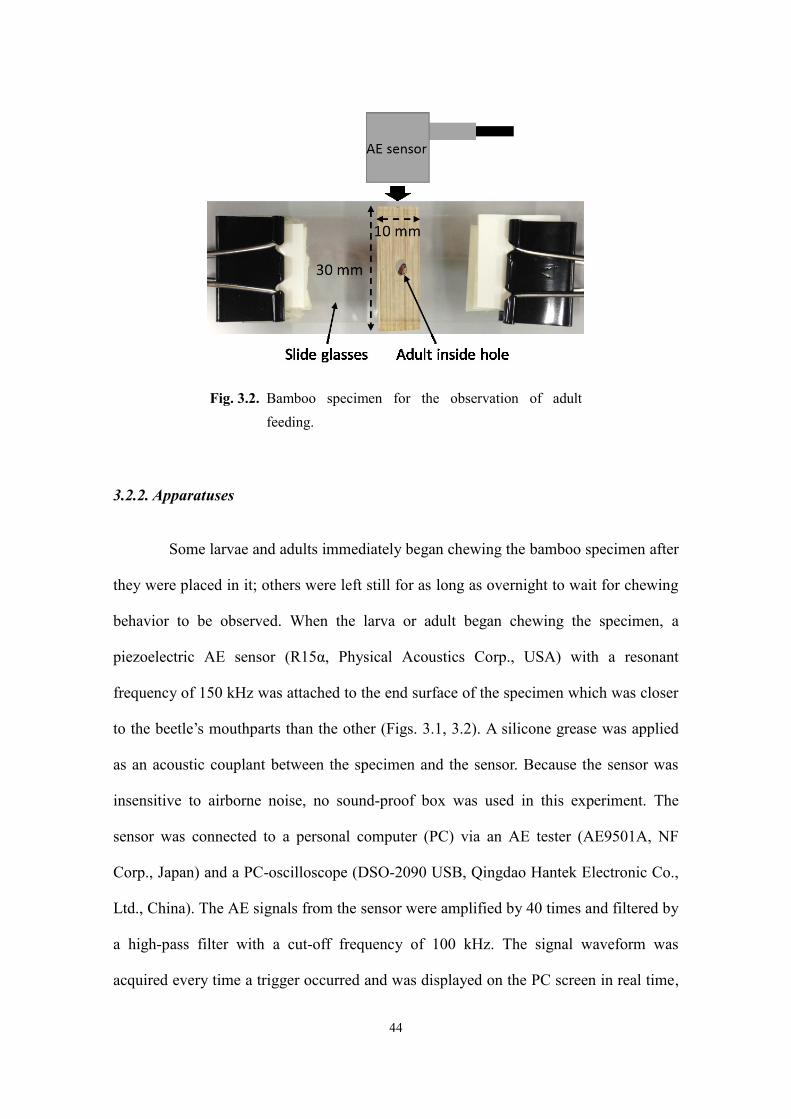
3.2.2. Apparatuses
Some larvae and adults immediately began chewing the bamboo specimen after
they were placed in it; others were left still for as long as overnight to wait for chewing
behavior to be observed. When the larva or adult began chewing the specimen, a
piezoelectric AE sensor (R15α, Physical Acoustics Corp., USA) with a resonant
frequency of 150 kHz was attached to the end surface of the specimen which was closer
to the beetle’s mouthparts than the other (Figs. 3.1, 3.2). A silicone grease was applied
as an acoustic couplant between the specimen and the sensor. Because the sensor was
insensitive to airborne noise, no sound-proof box was used in this experiment. The
sensor was connected to a personal computer (PC) via an AE tester (AE9501A, NF
Corp., Japan) and a PC-oscilloscope (DSO-2090 USB, Qingdao Hantek Electronic Co.,
Ltd., China). The AE signals from the sensor were amplified by 40 times and filtered by
a high-pass filter with a cut-off frequency of 100 kHz. The signal waveform was
acquired every time a trigger occurred and was displayed on the PC screen in real time,
Fig. 3.2. Bamboo specimen for the observation of adult
feeding.
Page 49
45
as shown in Fig. 3.3. Because the trigger level was not constant, the threshold that
defines an AE hit was later determined at 20.5 mV. Therefore, a signal that exceeded
20.5 mV in positive amplitude was counted as an AE hit. The amplitude display range
was 398 mV, meaning that parts of the waveforms that exceeded this range would not be
displayed or measured.
The larva or adult in the specimen was observed by the microscope (VH-5000,
Keyence Corp., Japan), and the video images were displayed on the PC screen in real
time with a resolution of 640 × 480 pixels, as shown in Fig. 3.3. The AE waveforms and
video images were recorded by a screen capturing software (AG-desktop recorder Ver.
1.2.2, T. Ishii) with a frame rate of 16 fps. The experimental set-up is summarized in Fig.
3.4. The experiment was conducted in the laboratory at a temperature of 25 °C. Four
different individual larvae and three different individual adults were used for
observation and analysis.
Fig. 3.3. Oscilloscope display where a signal waveform of
burst emission is captured (left) and microscope
image showing the mouthpart of a larva (right). Note
that both the waveform and the microscope image
have been cropped from the original display.
Page 50
46
A control specimen with no beetle was also used for AE measurement to
examine the presence of noise signals. The number of AE hits detected from the control
specimen within 150 s of measurement was 0–3, suggesting that the noise signals would
hardly affect the results of the experiment.
3.2.3. Measurement of time lags between AE signals and video signals
Possible time lags between AE signals and video signals displayed on the PC
screen in this experimental system were measured using the pencil lead break as a
simulated AE source. The method of the pencil lead break was based on NDIS 2110
(1997). A bamboo specimen [10 mm (L) in length and 40 mm in arc length] was
prepared from the air-dry madake culm. The AE sensor was fixed so that the detection
face would face up, and the specimen was vertically placed on the detection face with
the silicone grease couplant. The pencil lead break was performed six times on the end
surface of the specimen, and this process was filmed by the microscope camera, with
the lens fixed horizontally. On the PC screen, AE signal waveforms and video images
were displayed and captured. As a result, the first frame capturing the broken lead
Fig. 3.4. Schematic diagram of the experimental system.
Page 51
47
appeared 1–2 frames (1.5 frames on average) after the first frame capturing the
waveform originating from the pencil lead break appeared. Therefore, when an AE
waveform was detected in a frame of the recorded video clips of D. minutus feeding, the
next frame or the frame after next was assumed to show the microscope image of the
moment of AE generation.
3.2.4. Analysis
The behavior of the larvae and adults was separated into “chewing” and
“non-chewing”. When the beetle applied its open mandibles to the bamboo specimen,
brought them together medially, and reopened them, such movement of the mandibles
was defined as a “chewing movement”. Any movement of the mandibles in which the
mandibles never touched the specimen was not regarded as a chewing movement. Parts
of the video clips in which the mandibles were unclearly observed were not used for
analysis. Figure 3.5 shows the relationship between the number of AE hits detected in
the “chewing phases” observed in a video clip and the length of the chewing phases.
The number of the chewing movements of the mandibles in each video clip was counted
by visual observation, and the detection of AE hit(s) was examined in each chewing
movement. To support the results of the observation, example video clips (ESM 1–4)
were prepared as electronic supplementary materials. The ESM video clips are
appended to the online publication of the original article (doi:
10.1007/s10086-015-1525-4).
Page 52
48
3.3. Results and discussion
3.3.1. Larval feeding
In the “chewing phases”, the larval mandibles were almost constantly in
chewing movements. Table 3.1 shows the number of chewing movements of the
mandibles and the number of AE hits detected in the chewing phases of the four larvae.
The number of chewing movements observed in the total analysis time T (s) is indicated
by n in Table 3.1. There were two types of chewing movements: those in which one or
more AE hits were detected and those in which no AE hits were detected. The former is
referred to as “AE-generating chewing movements” and the number of them is indicated
by m. The total number of AE hits detected in T is indicated by a.
Fig. 3.5. Relationship between the number of AE hits detected in the chewing phases
observed in each video clip and the length of the chewing phases. Different
individuals are not distinguished in this figure.
Page 53
49
Larva
Number of
chewing
movements
n
Number of
AE-generating
chewing
movements m
Ratio of
AE-generating
chewing
movements
m/n
Number of
AE hits
generated in
chewing
movements
a
AE hits per
AE-generating
chewing
movement a/m
Total
analysis
time T
(s)
Chewing
movements
per second
n/T
I 1229 316 0.26 349 1.1 1461 0.84
II 593 212 0.36 268 1.3 646 0.92
III 180 76 0.42 88 1.2 219 0.82
IV 292 117 0.40 148 1.3 352 0.83
Signals of burst AE were detected in the AE-generating chewing movements of
the mandibles, as shown in the video clip of larva I (ESM 1), and the number of
detected AE hits in the chewing phases was significantly larger than the possible
number of noise signals. The AE waveforms contained the principal frequency
component corresponding to the resonant frequency of the sensor, 150 kHz, although a
wide range of frequencies was estimated to be produced. Figure 3.6 shows an example
series of successive frames of the video clip (ESM 1) capturing the moment of AE
detection and a chewing movement of the mandibles. The mandibles of the larva
gradually came together from the first frame (Fig. 3.6a) to the sixth frame (Fig. 3.6f). A
newly detected AE waveform appears in the third frame (Fig. 3.6c). Since the video
signals were delayed from the AE signals by 1–2 frames, the mandibles are estimated to
have triggered the AE event in the fourth frame (Fig. 3.6d) or fifth frame (Fig. 3.6e).
Table 3.1. Relation between the number of chewing movements of mandibles and AE hits
detected in the chewing phases of the larvae.
Page 54
50
Table 3.1 and ESM 1 also show that AE hits were not always detected in every
chewing movement. The ratio of AE-generating chewing movements m/n was smaller
than 0.5 for any larva (Table 3.1), implying that the majority of chewing movements did
not produce detectable AE hits. However, all AE hits were detected when the mandibles
were in chewing movements, suggesting that AE waves were generated by the chewing
movements of the mandibles. When no AE hit was detected in a chewing movement, the
chewing movement may have produced AE signals that did not exceed the threshold
level. Additionally, the possibility cannot be denied that a movement in which the
mandibles never touched the specimen was regarded as a chewing movement.
Fig. 3.6. Series of frames of the video clip (ESM 1) capturing the moment of AE detection
and a chewing movement of the mandibles of larva I. Each frame consists of the
waveform of the AE signal (left) and the microscope image of the larva (right).
Note that both the waveforms and the microscope images in the video clip have
been cropped from the original video.
Page 55
51
One AE-generating chewing movement usually produced one AE hit. However,
the ratio of detected AE hits to the number of AE-generating chewing movements a/m is
greater than 1 (Table 3.1). This is because more than one hit was detected in some of the
chewing movements, as shown in the distribution of the number of AE hits detected in
one AE-generating chewing movement of larva I (Fig. 3.7). As an example, a chewing
movement in which three AE hits were detected is observed at around 15 s of the video
clip (ESM 1). In some cases, the later AE wave had smaller amplitude than the earlier
wave, and the later wave seemed like the reflection components of the earlier wave.
However, the velocities of AE waves propagating longitudinally in madake culms
measured preliminarily suggested that the reflection components would appear in the
same frame as the original wave under the measurement conditions employed.
Therefore, when more than one AE hit was detected in a chewing movement, the
movement produced more than one AE event. The reasons for this were considered, but
were not clarified.
An example video clip of the “non-chewing phase” of larva I is shown in ESM
2. In this video clip, although the larval body was moving, no chewing movements of
the larval mandibles were observed, and no AE hits were detected. Table 3.2 shows the
Fig. 3.7. Distribution of the number of AE hits detected in one
chewing movement of larva I.
Page 56
52
lengths of the non-chewing phases and the number of AE hits detected in these phases.
Only one hit was detected in the analyzed non-chewing phases. This concluded that
almost all AE hits detected in the chewing phases were produced by the chewing
movements of the mandibles.
Larva Total analysis time (s) Number of AE hits
I 181 1
II 93 0
III 141 0
IV 150 0
Figure 3.8 shows the distribution of the peak-to-peak (P-P) amplitude of the AE
hits detected in the chewing phases of larva I. The P-P amplitude values of detected AE
hits varied greatly, and on average, 21% of the hits detected from all larvae had P-P
amplitude values that were larger than the display range of 398 mV. It is reported that
the amplitude values of AE waves produced by termite species differed among the types
of feeding behavior and “pulling” behavior produced largest amplitude (Indrayani et al.
2007b, Matsuoka et al. 1996). However, in this experiment, no specific pattern of
chewing movements was observed in the behavior of D. minutus larvae when the P-P
amplitude values of AE hits were relatively large. The amplitude may have depended on
the types of bamboo tissue, with different physical or mechanical properties, that were
being bitten at or off by the larva. The occurrence of AE waves that have large
amplitude is crucial in the practical application of AE detection because AE waves with
smaller amplitude would not be detected owing to the attenuation in the long bamboo
Table 3.2. Number of AE hits detected in the non-chewing
phases of the larvae.
Page 57
53
culms.
It was difficult to observe the fragments that were bitten off by the larvae.
However, larva II actually consumed a part of the specimen near its head, and particles
of excreta were produced near its abdomen within 4 h (Fig. 3.9). This suggested that the
chewing behavior discussed thus far was certainly feeding behavior. This also suggested
that larval frass of D. minutus consisted mostly of excrement. It should be noted that, in
contrast to workers or pseudergates of termites which can pull wood fragments off with
the aid of their legs as props (Indrayani et al. 2007b), the short larval legs of D. minutus
appear to have no such function. Although the observed larvae sometimes seemed to be
pulling bamboo fragments after they brought the mandibles together by slightly
withdrawing the head, the removal of bamboo fragments was estimated to rely mostly
on the to-and-fro chewing movements of the mandibles.
Fig. 3.8. P-P amplitude distribution of AE hits detected in the
chewing phases of larva I.
Page 58
54
From the above results, it was directly confirmed that the feeding behavior of
the larvae triggered the generation of AE events. Therefore, AE monitoring can be
applied to the continuous analysis of the feeding of D. minutus larvae.
Fig. 3.9. Part of the bamboo specimen marked with an oval
was consumed by larva II and particles of larval
excreta were produced within 4 h.
Page 59
55
3.3.2. Adult feeding
An example video clip of the chewing phase of adult I is shown in ESM 3.
Figure 3.10 shows an example frame of the video clip (ESM 3). The adults had larger
mandibles than the larvae. The movements of adult mandibles were similar to those of
the larvae, and the video clips were analyzed in the same manner. Table 3.3 shows the
number of chewing movements of the mandibles and the number of AE hits detected in
the chewing phases of the three adults. AE hits were detected in the chewing phases as
the adult chewed the specimen with its mandibles. As in larval chewing movements, AE
hits were not always detected in every chewing movement, and the ratio of
AE-generating chewing movements to all chewing movements m/n was 27–43% (Table
3.3). However, all AE hits were detected when the mandibles were in chewing
movements. One AE-generating chewing movement usually produced one AE hit, but
the ratio of detected AE hits to the number of AE-generating chewing movements a/m is
greater than 1 (Table 3.3) because more than one hit was detected in some of the
chewing movements. The frequency of chewing movements, represented as n/T, was
similar between the larvae (Table 3.1) and adults (Table 3.3). On average, 19% of the
AE hits detected from the adults had P-P amplitude values larger than 398 mV, which
was also similar to the case of the larvae. However, the adults with larger mandibles
may be able to produce AE waves with larger amplitude than the larvae, although it was
unclear from this study.
Page 60
56
Adult
Number of
chewing
movements
n
Number of
AE-generating
chewing
movement m
Ratio of
AE-generating
chewing
movements
m/n
Number of
AE hits
generated
in chewing
movements
a
AE hits per
AE-generating
chewing
movement a/m
Total
analysis
time T
(s)
Chewing
movements
per second
n/T
I 243 86 0.35 101 1.2 233 1.0
II 171 73 0.43 83 1.1 171 1.0
III 243 66 0.27 74 1.1 306 0.79
Table 3.4 shows the lengths of the non-chewing phases and the number of AE
hits detected in these phases. An example video clip of the non-chewing phase of adult I
is shown in ESM 4. No AE hits were detected in the non-chewing phases. Therefore, AE
hits detected from the specimens in the chewing phases were produced by the chewing
movements of the mandibles of the adults.
Fig. 3.10. Frame of the video clip (ESM 3) of adult I. Left
waveform of the AE signal, right microscope image.
Note that both the waveforms and the microscope
images in the video clip have been cropped from the
original video.
Table 3.3. Relation between the number of chewing movements of mandibles and AE hits
detected in the chewing phases of the adults.
Page 61
57
Adult Total analysis time (s) Number of AE hits
I 36 0
II 28 0
III 131 0
3.4. Summary
In the study described in this chapter, the observation of the mandible
movements of D. minutus in the bamboo specimen and AE measurement of the
specimen were conducted simultaneously, in real time. Practically all AE waves were
detected when the larvae or adults were chewing the specimens, confirming that the
chewing movements of the mandibles triggered the generation of AE events. This result
suggests that the detection of AE waves reflects the feeding of D. minutus. Therefore,
this study supports the potential of AE monitoring as a nondestructive tool to evaluate
the feeding of this beetle.
Table 3.4. Number of AE hits detected in the non-chewing
phases of the adults.
Page 62
58
Chapter 4. Combined use of acoustic emission and X-ray computed
tomography to monitor larval feeding activity and development3
4.1. Introduction
In Chapter 2, X-ray computed tomography (CT) was shown to be an effective
tool for nondestructively observing and quantifying the larval growth and tunneling of
the bamboo powderpost beetle Dinoderus minutus. On the other hand, because of the
inability to conduct continuous monitoring, uncertainty remained regarding the activity
of the larvae between the CT scans. Therefore, in Chapter 3, it was demonstrated
directly that the chewing movements of the mandibles of D. minutus in feeding
produced acoustic emission (AE) waves, and the effectiveness of AE monitoring for
continuous analysis of their feeding activity was proposed. In addition, a preliminary
experiment suggested that periods of ecdysis and pupation could be estimated using AE
monitoring (Watanabe et al. 2015b). It was, therefore, suggested that combined use of
AE monitoring and X-ray CT could comprehensively clarify the relationships among
the transitions of feeding activity, larval development, and the amount of bamboo
consumed by the larvae.
This chapter describes AE monitoring of the feeding activity of D. minutus
inside bamboo pieces conducted continuously from the first instar to adult eclosion. The
obtained data were used to nondestructively determine the number of ecdysis events and
the time period of each instar and to discuss the rhythmic patterns of feeding activity.
X-ray CT scanning was used for selected individuals to relate the AE data to the
3
Originally published online in: Watanabe, H., Yanase, Y., Fujii, Y. (2017b) Continuous
nondestructive monitoring of larval feeding activity and development of the bamboo powderpost
beetle Dinoderus minutus using acoustic emission. Journal of Wood Science doi:
10.1007/s10086-017-1678-4, 11 pp.
Page 63
59
developmental stages and bamboo consumption. Several additional experiments were
conducted to directly observe the process of ecdysis, to estimate larval head capsule
widths of all instars, and to discuss the effects of attenuation of AE waves on the AE
monitoring of feeding activity. AE monitoring was continued after adult eclosion to
analyze the pre-mating feeding activity of adult beetles.
4.2. Materials and methods
4.2.1. Preparation of bamboo pieces and inoculation of larvae
Bamboo pieces, 100 [longitudinal (L)] × 20 [tangential (T)] mm, were prepared
from air-dry internodes of madake (Phyllostachys bambusoides) culms, 6–7 mm [radial
(R)] thick, felled in June 2014 in Kyoto Prefecture, Japan. Eggs of laboratory strains of
D. minutus reared on madake culms were collected using laminates of nutrient-
containing filter paper, as described in Chapter 2, and newly hatched first instar larvae
were collected randomly for inoculation into the bamboo pieces. A hole with a depth of
5 mm was drilled longitudinally on one end surface of each bamboo piece with a
2.5-mm drill bit, and the hole was extended by 5 mm with a push pin. A newly hatched
larva was placed individually into this hole, and the hole was closed using a round
bamboo peg. Then, a piezoelectric AE sensor (R15α, Physical Acoustics Corp., USA)
was glued onto the same end surface as where inoculation was performed with a
cyanoacrylate adhesive (Fig. 4.1). After 2 h, the pieces were placed vertically, with the
inoculated end surface on top, in an environmental chamber, and AE measurement was
started. The environmental chamber was conditioned at 28 °C and 65% relative
humidity, where the moisture content (MC) of the bamboo culms was 11%. No light
source was employed throughout the experiment. Also, because the sensors were
Page 64
60
insensitive to airborne noise, no soundproofing measures were employed.
To obtain ten replicates, 17 inoculated pieces were prepared. Of the 17 first
instar larvae, 11 individuals successfully started feeding, but one individual ceased
feeding after the first instar, suggesting that it had died in the process of ecdysis. The
results and discussion are based on the surviving ten individuals.
Of these ten individuals, randomly chosen two individuals, AX1 and AX2,
were also subjected to CT scanning using a microfocus X-ray CT system
(SMX-160CT-SV3S, Shimadzu Corp., Japan), usually with an interval of 3–5 d. Scans
were performed daily when pupation and adult eclosion approached. These two
individuals were included in the 11 individuals used for CT scanning in Section 2.3 of
Fig. 4.1. Illustration of the bamboo piece with a first instar
larva inoculated in the hole and an AE sensor glued
onto the upper end surface.
Page 65
61
Chapter 2. It is advised to refer to Chapter 2 for methods of CT scanning and
measurement of larval tunnel length and volume. The eight individuals that were not
used for CT scanning are referred to as A1–A8.
4.2.2. AE measurement and analysis
AE data were acquired using a 4-channel AE system (DiSP with AEwin,
Physical Acoustics Corp., USA). Each of the AE sensors, with a resonant frequency of
150 kHz, was connected to the system via a preamplifier (1220A, Physical Acoustics
Corp., USA), as outlined in Fig. 4.2. The AE signals detected by the sensor were filtered
by a 100–400 kHz bandpass filter and amplified by 40 dB in the preamplifier and by 20
dB in the system amplifier. The signals were then discriminated at a threshold of 80 dB,
and a burst signal that exceeded this threshold in positive or negative amplitude was
counted as an AE hit. It should be noted that the definition of a hit is slightly different
from that in Chapter 3 because a different measurement system was employed. The time
of detection and amplitude, i.e., the maximum (positive or negative) signal excursion
during the hit, were recorded for each hit. The AE hits were determined using the hit
definition time (HDT) of 100 μs, the hit lockout time (HLT) of 200 μs, and the peak
definition time (PDT) of 40 μs. The amplitude values of AE hits were expressed in dB
with a reference voltage of 1 μV.
Page 66
62
Two parameters were defined to express the AE data in this experiment: hourly
AE hit rate and mean maximum amplitude. Hourly AE hit rate was the number of AE
hits detected in 1 h, and mean maximum amplitude was calculated as the hourly mean
of six maximum amplitude values recorded during 10-min intervals. In addition,
frequency spectra of the time courses of the number of AE hits per 5 min calculated
using fast Fourier transformation (FFT) were used to analyze the periodicity of larval
feeding activity found in this experiment.
After adult eclosion, bamboo pieces containing adults were kept separately in
glass bottles, and AE measurement was continued. The threshold was raised to 85 dB
prior to adult eclosion.
4.2.3. Direct observation of ecdysis and pupation (Additional experiment I)
In order to verify that the larvae underwent ecdysis or pupated during periods
of no AE detection, additional larvae were inoculated in bamboo pieces by placing
inside holes made with a 1.5-mm drill bit and the pieces were subjected to AE
monitoring. When AE detection from these pieces stopped, the larvae were extracted
Fig. 4.2. Schematic diagram of AE measurement system for
bamboo pieces containing D. minutus larvae.
Page 67
63
and the process of ecdysis was observed using a microscope (VH-5000, Keyence Corp.,
Japan). A microscope image of the larva was recorded every 300 s in the environmental
chamber. Two first instar larvae and five larvae in middle or later instars were used for
observation.
4.2.4. Measurement of distance attenuation of elastic waves in bamboo (Additional
experiment II)
The amplitude attenuation of longitudinally propagating elastic waves per unit
distance was measured by inputting continuous waves into bamboo culms of different
lengths. Three bamboo specimens [300 (L) × 20 (T) mm] were prepared from air-dry
internodes of madake culms [6–7 mm (R) thick] at 8–9% MC and with an air-dry
density of 0.87–0.89 g/cm3. Elastic waves were input from one end surface of each
specimen, and the amplitude of the waves was measured at the other end surface. Then,
the length of the specimen was shortened by 50 mm and the same procedure was
repeated four times, until the specimen’s remaining length was 100 mm. The input
signals of continuous sinusoidal waves with a frequency of 150 kHz were generated
using a digital function generator (DF1906, NF Corp., Japan) and were transduced and
transmitted through a piezoelectric actuator (the same model as the AE sensors). In
order to simulate AE waves generated by D. minutus larvae, a push pin was inserted into
the end surface of the specimen, 2 mm below the inner surface, and the transmitter was
fixed to the head of the push pin. A receiver AE sensor was attached to the other end
surface of the specimen, and output signals detected by the receiver were acquired using
an AE tester (AE9501A, NF Corp., Japan). A silicone grease was applied as an acoustic
couplant between the transmitter and the push pin, and between the specimen and the
receiver. The transmitter, the specimen, and the receiver were held together with a
Page 68
64
clamp. The amplitude of the output signals was displayed using a PC-oscilloscope
(DSO-2090 USB, Qingdao Hantek Electronic Co., Ltd., China). The measurement
system is summarized in Fig. 4.3. The attenuation in dB/mm was calculated as the slope
of the regression line relating the amplitude level of the output signals to the
propagation distance (length of the specimen).
4.2.5. Measurement of amplitude of AE generated by larvae of different instars
(Additional experiment III)
In order to discuss the relationship of AE amplitude to larval head size and
instars, AE signals generated by larvae of various body sizes were recorded, with the
propagation distances kept constant. Four newly hatched first instar larvae and 13 larvae
in middle or later instars were individually inoculated in bamboo specimens and the
amplitude of AE hits were recorded. The head capsule widths of the first instar larvae
were measured before AE measurement. The specimens [15 (L) × 20 (T) mm] were
prepared from a single air-dry madake internode [6 mm (R) thick]. A longitudinal hole
with a depth of 5 mm was made on one end surface of each specimen using a push pin
or drill bits (φ1.2–1.4 mm), depending on the larval body size, and a larva was placed in
Fig. 4.3. Schematic diagram of the measurement system for
attenuation of elastic waves in bamboo culms.
Page 69
65
this hole. This resulted in a larva-to-sensor distance of 10 mm. Each specimen was
placed vertically on the face of the AE sensor, with the inoculated end surface on top,
with a silicone grease as an acoustic couplant. AE measurement was conducted using
the AE system (DiSP with AEwin) in the environmental chamber for at least 2 h after
the larva started feeding. The mean value of 12 maximum amplitude values recorded in
10-min intervals during a 2-h period was calculated for each larva. This value is also
referred to as mean maximum amplitude. After AE measurement, each of the middle or
later instar larvae was extracted and killed in 99.5% ethanol. Because the head capsules
of D. minutus larvae were partially hidden in the thoraces, except in the first instar, the
head capsules of these extracted larvae were extruded from the thoraces to measure the
widest part of the capsules.
4.2.6. Estimation of head capsule widths of all instars (Additional experiment IV)
Dyar (1890), who stated that the head capsule width of lepidopterous larvae
follow a regular geometrical progression as they molt, recommended that the head
capsule width of each instar be given in descriptions of larval stages. However, the
larvae monitored inside the bamboo pieces could not be used to measure the head
capsule width. Because the validity of Dyar’s rule has been confirmed in various insect
species including coleopteran species, such as the mountain pine beetle Dendroctonus
ponderosae (Logan et al. 1998) and curculionid weevils Sitona discoideus (Frampton
1986) and Pissodes castaneus (Panzavolta 2007), his rule was applied to D. minutus.
The head capsule widths of 20 newly hatched first instar larvae and 20 final instar
larvae in the prepupal stage were measured, and the growth ratio and the head capsule
width of each instar were calculated. As shown below, the number of instars varied
Page 70
66
between seven and eight. Because the instar types of the prepupae were unknown, the
head capsule width of each instar was estimated for both cases where the prepupae were
all 7-instar type and 8-instar type.
4.3. Results and discussion
4.3.1. Feeding activity and development from the first instar to adult eclosion
Continuous generation of AE started within approximately 1 d after hatching.
The AE hits detected from the bamboo pieces were attributable to larval feeding activity,
based on Chapter 3, and even the activity of the smallest instar was detected.
Considering the possibility of recording noise signals, the larvae were defined to be
“active” when the hourly AE hit rate was 10 or higher, and otherwise they were
regarded as being “inactive”. Figure 4.4 shows the time courses of the hourly AE hit
rate and mean maximum amplitude of two individuals, A1 and AX1, as typical
examples. They started continuous feeding at 0.6 d and 1.0 d, respectively. However,
feeding activity ceased between 3.5 d and 5.5 d in individual A1 and between 5.2 d and
7.3 d in individual AX1, and after that, periods of continuous feeding activity and
periods of inactivity alternated with each other.
Page 71
67
Direct observation (Additional experiment I) confirmed that these periods of
inactivity that lasted for approximately 2 d were due to ecdysis. Figure 4.5 shows the
process of ecdysis of a middle instar larva. Three instances of ecdysis were directly
confirmed for three different larvae in middle or later instars. These larvae underwent
ecdysis 1.1 d after they became inactive on average. They did not consume their skins.
Two other instances of ecdysis of two first instar larvae were also captured, although
both larvae died after ecdysis, probably because of the disturbance. Based on the direct
observation, it was revealed that an active period corresponded to an instar period and
the number of inactive periods represented the number of ecdysis events.
Fig. 4.4. Time courses of hourly AE hit rate and mean
maximum amplitude of individuals A1 and AX1.
Page 72
68
After completing the seventh instar, individual A1 entered a longer inactive
period lasting from 61.5 d to 68.0 d (Fig. 4.4). Individual AX1 underwent an eighth
instar before a long inactive period between 69.7 d and 75.7 d. Daily CT scans of
individuals AX1 and AX2 confirmed that these periods corresponded to prepupal and
pupal stages. Individual AX1 in the final instar became inactive at 69.7 d, and CT scans
confirmed that it turned into a prepupa between 69.9 d and 71.0 d and pupated by 72.1 d.
Direct observation of four final instar larvae showed that they pupated 1.5 d after they
became inactive on average (Additional experiment I). Individual AX1 emerged as an
adult between 74.9 d and 75.8 d. CT scans and AE measurement of individuals AX1 and
AX2 suggested that adult beetles started feeding within approximately 1 d after eclosion.
The feeding activity of adults is discussed in Subsection 4.3.4.
The time courses of the hourly AE hit rate in Fig. 4.4 showed that the larvae
were most active shortly after completing ecdysis, and the activity reduced as the next
ecdysis or pupation approached, in a certain instar after the third instar. The mean
maximum amplitude of AE hits was rather constant in a certain instar. When compared
among instars, both the hourly AE hit rate and mean maximum amplitude tended to
increase with the instar number, suggesting that larger amounts of strain energy were
released by the chewing movements of the mouthparts as the larval head and
Fig. 4.5. Process of ecdysis of a larva. Exuvia is shown in
circles. Image intervals are 300 s.
Page 73
69
mouthparts enlarged. However, after the fifth or sixth instar, these tendencies became
less clear. These patterns of the time courses of the hourly AE hit rate and mean
maximum amplitude were observed in all ten larvae. Possible reasons for these patterns
were that the larvae were actually less active in later instars and/or that attenuation of
AE waves became significant as the larvae moved away from the sensors. This matter is
discussed in the next subsection with reference to the attenuation characteristics of the
AE waves.
Figure 4.6 shows the progression of instars of all ten larvae, as well as the
durations of instars, inactivity due to ecdysis, and prepupal and pupal stages. Five larvae
underwent seven instars (“7-instar type”) and the other five underwent eight instars
(“8-instar type”), suggesting that the number of instars can vary in this species.
Variations in the number of larval instars were reported for related species, for example,
the brown powderpost beetle Lyctus brunneus (Coleoptera: Bostrichidae) (Iwata and
Nishimoto 1985) and the tobacco beetle Lasioderma serricorne (Coleoptera: Anobiidae)
(Niiho 1984). Although other numbers of instars were not found in this study because of
the limitation of the number of AE measurement channels, it is possible that other instar
types of D. minutus were present, with low abundance ratios. The larval duration of
8-instar larvae was significantly longer than that of 7-instar larvae (Student’s t-test, p <
0.01). The adult body length was not significantly different between the instar types
(Student’s t-test, p > 0.05), although the sample sizes may be too small to discuss
differences among instar types. Sexual differences may be one of the factors causing the
difference in the total number of instars. However, the sexes of the employed
individuals were not identified in this experiment, limiting further discussion; the
clarification of sexual differences in larval development is a subject for future analysis.
Page 74
70
The number of instars revealed in this study does not agree with previous
reports on D. minutus. Plank (1948) estimated that D. minutus had four instars based on
mandible lengths and Dyar’s (1890) rule. Abood and Norhisham (2013) found five
instars based on head capsule widths and inspection of exuviae, by rearing larvae
individually using cassava flour. Garcia and Morrell (2009) reported that D. minutus
larvae underwent four instars, but with no clear references to the methods of
determining ecdysis. Some Japanese literatures (The Society of House and Household
Pests Science, Japan 1995, Tokyo National Research Institute for Cultural Properties
2001, Yamano 1976) mention that D. minutus have five larval instars, but without
presenting evidence. The differences between the results of this study and previous
reports may be attributed to the accuracy of the conventional methods or to the
variability of larval development among populations, regions, and rearing conditions. In
addition, the results of this study showed that first instar was the shortest and the final
Fig. 4.6. Durations of larval instars, ecdysis, and prepupal/
pupal stages.
Page 75
71
instars were the longest (Fig. 4.6), which was different from the report of Abood and
Norhisham (2013) who found that the final instar was the shortest. The present results
regarding larval development of D. minutus were rather similar to that of D. ocellaris
reported by Sitaraman (1951). He reared D. ocellaris larvae using maize grain and
found eight larval instars. The fact that the first instar was shorter than the other instars
in D. ocellaris shown in his report also applied to D. minutus in this study. Although the
present results were in disagreement with the previous reports on D. minutus, it was
shown that AE monitoring was an effective novel tool for nondestructively assessing
ecdysis and instars.
The average larval duration and prepupal/pupal duration of the ten individuals
were 66.3 ± 5.7 d (mean ± SD) and 6.2 ± 0.3 d, respectively. The average larval duration
of the un-irradiated individuals, A1–A8, was 64.8 ± 5.3 d. This value was used in
Chapter 2 to show that there was no impact of irradiation on developmental period of
the larvae examined using X-ray CT. It should be noted that the larval durations
measured from CT scanning and AE monitoring can be slightly different; in AE
monitoring, the time from the end of feeding activity in the final instar to pupation,
which was 1.5 d based on Additional experiment I, was not included in the larval
duration.
As Fig. 4.4 shows, again, the hourly AE hit rate was constantly above a certain
level during each instar, suggesting that the larvae were feeding continuously
throughout. However, time courses of the number of AE hits with a higher temporal
resolution exhibited the rhythmic presence of short phases of inactivity alternating with
feeding phases. In insect physiology, such feeding phases preceded and followed by a
“gap” are called “meals” (Bernays and Woods 2000, Nagata and Nagasawa 2006,
Simpson 1982). A typical example is shown in the time course of the number of AE hits
Page 76
72
per 5 min produced by individual A1 between 40 d and 40.5 d in Fig. 4.7a, where meals
lasting approximately 40 min interchange with gaps of approximately 5 min. Figure
4.7b shows the FFT spectrum of the time course of AE hits per 5 min in the sixth instar,
i.e., between 39.2 d and 46.9 d. In this spectrum, the highest peak is found at a
frequency of 35.9 cycles/d, corresponding to a period of 0.67 h. This means that the
activity of the larva had a dominant periodicity with a period of 0.67 h during the sixth
instar. The distribution of intensity around the peak seemed skewed, with more
components on the left (lower-frequency) side of the peak. The periods tended to
lengthen as ecdysis approached and larval activity reduced, though this is not shown in
Fig. 4.7a, and the shape of the distribution around the peak probably reflected this
tendency. For simplification, the skewness is ignored in further discussion. Table 4.1
shows the average dominant period of periodic activity of each instar of all larvae. In
the first and second instars, clear periodicity was not present except in the second instar
of one individual. The periods of cycles tended to shorten as larval instars increased.
The periods were much shorter than 24 h, suggesting that the feeding activity was
independent of circadian rhythms, and the variation of periods within and among instars
and individuals under constant conditions suggested that the rhythm in feeding activity
was endogenous. Feeding patterns with a certain periodicity independent of circadian
rhythms have been reported for nymphs and larvae of several insects, such as the
migratory locust Locusta migratoria (Simpson 1982), tobacco hornworm Manduca
sexta (Bernays and Woods 2000), and silkworm Bombyx mori (Nagata and Nagasawa
2006), and such patterns were estimated to be relevant to endogenous regulatory
mechanisms (Nagata et al. 2011). Therefore, it is suggested that AE monitoring can also
be applied to physiological analysis of the beetles.
Page 77
73
Fig. 4.7. Rhythmic pattern of feeding activity of individual
A1. a Time course of the number of AE hits per 5
min between 40 d and 40.5 d after hatching. b FFT
spectrum of the time course of the number of AE hits
per 5 min during the sixth instar, i.e., between 39.2 d
and 46.9 d. The highest peak, as indicated by an
arrow, was found at the frequency of 35.9 cycles/d.
Page 78
74
Instar Period (mean ± SD) (h)
1 ND
2 2.19 (n = 1)
3 2.04 ± 1.16
4 1.15 ± 0.31
5 0.97 ± 0.32
6 0.76 ± 0.13
7 (of 7-instar larvae) 0.80 ± 0.10 (n = 5)
7 (of 8-instar larvae) 0.77 ± 0.13 (n = 5)
8 0.86 ± 0.11 (n = 5)
SD standard deviation, ND not detected
In summary, AE monitoring was an effective tool for nondestructively
detecting real-time feeding activity of D. minutus and determining the number of
ecdysis events, the duration of instars, and larval and pupal developmental periods. It
should be applicable to other bamboo- and wood-boring insects as well. Real-time
analysis using AE also indicated the presence of rhythms in the temporal transitions of
feeding activity within each instar period, which may reflect the endogenous regulatory
mechanisms of the larvae.
4.3.2. Effects of attenuation of AE waves
In the previous subsection, it was noted that the hourly AE hit rate and mean
maximum amplitude did not increase with larval instars after the fifth or sixth instar
(Fig. 4.4), and it was discussed that the reasons for these patterns may be that the larvae
were actually less active in later instars and/or that attenuation of AE waves became
Table 4.1. Dominant period of the rhythms of feeding activity
in each larval instar, averaged over ten individuals
(n = 10) except where noted.
Page 79
75
significant as the larvae moved away from the sensors. In order to examine the extent of
attenuation in the experimental conditions of this study, the distance attenuation of
elastic waves propagating longitudinally in bamboo culms was measured (Additional
experiment II), and the AE data of individuals AX1 and AX2 were corrected using the
attenuation value. Figure 4.8 shows the relationship between the propagation distance
and amplitude level of 150-kHz output signals for one bamboo specimen. The
amplitude level decreased linearly with propagation distance, and the slope of the
regression line was −0.12. The average longitudinal attenuation of three specimens, at
8–9% MC, was 0.11 dB/mm. Therefore, it was estimated that the amplitude of AE
waves in bamboo culms decrease nearly by this value when using AE sensors with a
resonant frequency of 150 kHz.
The AE data of individuals AX1 and AX2 were then corrected based on the
distance attenuation measured in Additional experiment II. The amplitude of each AE
hit at the source was estimated by compensating for attenuation, using an attenuation
value of 0.1 dB/mm and the supposed propagation distance based on the linear
Fig. 4.8. Relationship between propagation distance and the
amplitude level of output signals of 150-kHz elastic
waves.
Page 80
76
interpolation of the distance between the larva and the sensor measured in X-ray CT
images. The corrected AE hits were discriminated at a new threshold of 90 dB. Figure
4.9 shows the time courses of corrected hourly AE hit rate and mean maximum
amplitude of individual AX1. Both of these AE parameters increased with each instar,
although the hourly AE hit rate at the beginning of the fifth instar was an exception for
unknown reasons. Similar patterns were observed for individual AX2 as well. The
correction based on attenuation indicated that the amplitude of AE waves, and thus the
number of detectable signals (AE hits), always increased as the larvae underwent
ecdysis events although this tendency became seemingly unclear after the fifth or sixth
instar solely because of the attenuation of AE waves.
Fig. 4.9. Time courses of corrected hourly AE hit rate and
mean maximum amplitude of individual AX1. The
correction was based on the estimated attenuation of
AE waves and the distance between the larva and the
sensor.
Page 81
77
In order to further clarify the relationship between larval instars and produced
AE amplitude, AE signals generated by larvae of different instars were measured with a
fixed propagation distance of 10 mm in Additional experiment III. Then, the head
capsule widths of the larvae, except the four first instar larvae, were measured to
estimate their instars. For instar estimation, a lookup table (Table 4.2) showing head
capsule width of each instar calculated from 20 first instar larvae and 20 final instar
larvae was made in Additional experiment IV. This table lists the measured head capsule
widths of the first and final instars, growth ratios calculated based on Dyar’s (1890) rule,
and calculated head capsule widths of intermediate instars for both 7- and 8-instar types.
Figure 4.10a shows the relationship between the head capsule width of larvae and mean
maximum amplitude, the original result of Additional experiment III. Figure 4.10b, c
shows the relationship of mean maximum amplitude to larval instars, estimated based
on Table 4.2 using the arithmetic means of head capsule widths of consecutive instars as
borders. All of the correlations (R = 0.926, 0.974, and 0.973 for Fig. 4.10a–c,
respectively) were significant (p < 0.01), meaning that AE amplitude increased with
larval head size and each instar. In addition, because the patterns in which maximum
amplitude did not increase with each instar were only observed after the fifth or sixth
instar, regression analysis was applied only to the mean maximum amplitude values of
the fifth and later instars. The correlations (R = 0.788 and 0.817 for Fig. 4.10b, c,
respectively) were significant (p < 0.01) in both instar types. Therefore, it was
confirmed that the amplitude of AE waves at their sources increased with head capsule
width and the instar number.
Page 82
78
Instar 7-instar type 8-instar type
Head capsule width (mm) Growth ratio r Head capsule width (mm) Growth ratio r
1 0.119*
1.35**
0.119*
1.29**
2 0.160 0.153
3 0.215 0.198
4 0.290 0.255
5 0.390 0.329
6 0.524 0.424
7 0.706* 0.547
8 – 0.706*
* Mean of 20 measured values
** Calculated from measured head capsule widths of the first and final instars (*) based on Dyar’s rule
Table 4.2. Estimated head capsule width of each larval instar.
Fig. 4.10. Relationship between head capsule width of larvae and mean maximum
amplitude (a) and relationship between larval instars and mean maximum
amplitude on the assumption that the larvae were of 7-instar type (b) and 8-instar
type (c). Dashed lines in b and c are the regression lines using values of all
instars, and red solid lines are the regression lines using values between the fifth
and final instars. Two asterisks (**) denotes that the correlation is significant at
the 0.01 level.
Page 83
79
Overall, it was shown that, when the larvae moved far away from the sensor,
attenuation of AE waves became so significant that the larval activity could be
underestimated. By compensating for attenuation, the correlation of AE amplitude with
larval instars became clearer, reflecting the growth of the larvae. In the application of
AE monitoring for continuous analysis of feeding by bamboo- and wood-boring insects,
attenuation may not be problematic in separating instar periods from inactivity due to
ecdysis or even in separating meals and subsequent (or preceding) gaps as long as the
rearing media are of confined dimensions. However, when quantitatively comparing the
level of feeding activity of different instars or individuals, it is desirable that the
attenuation characteristics be evaluated in some manner, such as demonstrated in
Additional experiment II.
4.3.3. Relationship between cumulative AE hits and bamboo consumption
In Chapter 3, the relationship between the movements of the mandibles of D.
minutus and AE generation was clarified. However, the AE phenomenon is yet to be
related to the actual amount of bamboo consumption by the larvae. In this subsection,
the relationship between the number of AE hits and bamboo consumption is discussed
using individuals AX1 and AX2. The tunnel volumes measured using X-ray CT images
were used to represent bamboo consumption. The tunnel volume bored during each
instar was estimated assuming that the tunnel volume increased linearly with time
between two CT scanning dates and that the larvae did not extend tunnels during
inactive periods of ecdysis. Figure 4.11 shows the relationship between cumulative AE
hits (after correcting based on attenuation) and tunnel volume recorded from hatching
until the end of each instar for the two larvae. The graphs in Fig. 4.11 confirm that the
Page 84
80
bamboo consumption increased as more AE hits were produced, although the
relationship did not seem to be linear. A possible explanation for the rather concave
shape of these curves was the growth of the mandibles; as the larvae enlarged through
ecdysis events, larger amounts of bamboo were consumed by one bite of the mandibles.
In addition, each of the two larvae consumed a total of 68.1 mm3 of bamboo on average,
and the average percentage of bamboo consumption in each instar from first to eighth
was 0.03, 0.3, 1.0, 2.2, 6.0, 14, 27, and 49%, respectively. This indicated that bamboo
consumption increased greatly with each instar and suggests that detection and
treatment in early larval instars would significantly reduce the damage caused by the
larvae.
Fig. 4.11. Relationship between cumulative AE hits (corrected
based on attenuation) and tunnel volume recorded
from hatching until the end of each instar. Ordinal
numbers represent instar numbers, excluding the
first to third instars.
Page 85
81
4.3.4. Pre-mating adult feeding activity
Analysis of pre-mating adult feeding (Reifungsfrass) was continued for
approximately 10 d because, as described in Chapter 2, adults made exit holes in 8 d
after adult eclosion on average. Figure 4.12 shows the time courses of the hourly AE hit
rate and mean maximum amplitude of individual A1, in continuation of Fig. 4.4a. It
should be noted that a higher threshold value was employed for adult monitoring, so the
adult hourly AE hit rate is not comparable with the larval data. As mentioned in
Subsection 4.3.1, adults were considered to have started feeding within appoximately 1
d after eclosion. Figure 4.12 indicates that feeding activity continued almost ceaselessly
during Reifungsfrass, although it was relatively low for 1–2 d after the adults started
feeding. Adults produced AE waves of larger amplitude than the final instar larvae.
Unlike larval feeding, there was no clear periodicity in the time courses of the number
of AE hits per 5 min.
Page 86
82
4.4. Summary
AE monitoring was used to analyze larval feeding and development of D.
minutus from the first instar. AE hits produced by feeding activity were detected, and
the larvae showed almost constant feeding activity every hour during the instar periods
but became inactive during periods of ecdysis and pupation. Therefore, AE monitoring
proved to be an effective tool for measuring larval duration and the number of ecdysis
events. The examined larvae underwent either seven or eight instars in total, which
differed from previous reports on D. minutus. The AE data also indicated the presence
of periodicity in larval feeding; continuous meals were separated by short inactive
Fig. 4.12. Time courses of hourly AE hit rate and mean
maximum amplitude after adult eclosion of
individual A1. It should be noted that, because a
higher threshold value was employed, the adult
hourly AE hit rate is not comparable with the larval
data shown in Fig. 4.4.
Page 87
83
phases (approximately 5 min), with an average dominant period in each instar ranging
between 0.76 and 2.19 h, which possibly reflected the physiology of the larvae. The AE
amplitude increased with each larval instar, but because of the attenuation of AE waves,
this relationship became unclear in later larval stages without additional corrections.
Bamboo consumption increased as cumulative AE hits increased, and the non-linear
relationship between these suggested that more bamboo was consumed by each bite as
the larval instars progressed. The feeding activity of newly emerged adults continued
almost ceaselessly, based on hourly AE hit rate, in the Reifungsfrass period. These
results show that another novel nondestructive methodology for the analysis of feeding
and development of D. minutus has been established.
Page 88
84
Chapter 5. General discussion and future perspectives
5.1. Introduction
This research was designed with the consideration that nondestructive
techniques for detecting and analyzing the development and feeding of bamboo-boring
insects are essential in establishing measures of prevention, remediation, and inspection
to manage insect attack to bamboo materials. The use of two particular techniques,
X-ray computed tomography (CT) and acoustic emission (AE) monitoring, in
evaluating larval development and feeding of the bamboo powderpost beetle Dinoderus
minutus was investigated in the experiments described in Chapters 2–4. In this chapter,
the novelty of these techniques and findings revealed by them is confirmed from the
entomological point of view. Then, it is discussed how X-ray CT and AE monitoring
could be utilized and contribute to the establishment of integrated pest management
(IPM) for bamboo materials.
5.2. Novelty of monitoring using X-ray CT and AE in entomology
Nondestructive analyses by X-ray CT and AE monitoring provided
understanding regarding the growth and development of D. minutus, such as changes in
body size, the number and time period of instars, and larval and pupal developmental
periods. Although these points have been reported previously, conventional methods
employed in previous studies involved either the direct dissection of bamboo culms
used for rearing (Garcia and Morrell 2009, Norhisham et al. 2015, Plank 1948) or the
use of artificial diets (Norhisham et al. 2013). X-ray CT and AE monitoring were
effective tools for clarifying the process of beetle development in natural conditions in a
relatively simple manner. In addition, they could now be used to examine differences, if
Page 89
85
any, between larval development in bamboo culms and that in artificial diets.
X-ray CT and AE monitoring also revealed information regarding the
characteristics of feeding, such as 3D tunneling patterns and temporal transitions in
feeding activity. Quantifying the amount of bamboo consumed by the larvae would be
particularly difficult using other methods, and it was first attained using X-ray CT. Real
time monitoring of feeding activity, as well, was first made possible using AE. The
rhythmic patterns of feeding activity found through AE monitoring may be related to the
physiology of the larvae. In the field of insect physiology, continuous observation of
feeding and other activities of insects was conducted to study the mechanism of the
rhythms in feeding and factors influencing these rhythms (Bernays and Woods 2000,
Nagata and Nagasawa 2006, Simpson 1982). AE monitoring may be a useful tool to
analyze the physiology of the beetles. Furthermore, although not found in larval feeding
activity, AE data could also be used to detect circadian rhythms in beetle activities. In
this case, AE hit rate, the number of AE hits detected in a certain unit of time, could be
directly input to compute the chi-square periodogram, which determines the circadian
period and its statistical significance (Sokolove and Bushell 1978).
X-ray CT and AE monitoring are also promising for analysis of the
ovipositional behavior of D. minutus. Because adult D. minutus lay eggs along
oviposition tunnels made by themselves (Plank 1948, Ueda 1963, Wood Technological
Association of Japan 1961, Yamano 1976), direct observation of this behavior is very
difficult, and related facts, such as the number of eggs laid per female in bamboo culms
and the extent of damage caused during the ovipositional period, are poorly understood.
In the experiments in progress by the author, it was confirmed that eggs laid in bamboo
vascular bundles could be visualized by X-ray CT (Watanabe et al. 2017c). Other
activities of adult males and females can be directly observed when they are outside of
Page 90
86
bamboo culms, but it is generally known that they are only active outside toward
evening (Plank 1948), and they are mostly hidden inside bamboo culms. X-ray CT and
AE monitoring, combined with direct observation of activities outside, could
comprehensively clarify the activity patterns of adult beetles, revealing the entire life
history and feeding behavior in all life stages.
Some of the findings were only revealed by either X-ray CT or AE monitoring,
for example, tunnel volume by the former and instars and ecdysis events by the latter,
and their interrelationship was clarified using the combination of the two techniques.
However, in circumstances where only either one of these techniques is available, X-ray
CT could be devised to estimate the conditions of larval development or feeding
previously revealed solely by AE monitoring, and vice versa. For example, considering
that the inactive periods due to ecdysis lasted approximately 2 d, ecdysis events may be
estimated by CT scans at 1- or 2-day intervals, and bamboo consumption could be
estimated from cumulative AE hits once their relationship is clarified, as in Fig. 4.11.
Therefore, X-ray CT and AE monitoring are novel, effective tools to
nondestructively study the biology, especially the life history and feeding behavior, of D.
minutus in bamboo culms. These tools are also considered to be applicable for the
analysis of other bamboo- and wood-boring insects.
5.3. Usefulness of X-ray CT and AE monitoring in managing D. minutus
5.3.1. Desirable process of IPM for bamboo materials
As explained in “General introduction”, there are two possible ways in which
infestations of bamboo-boring insects occur. The entrance of beetles in the
manufacturing process must be detected before being put into use. This may be
Page 91
87
attempted visually, but more reliable methods of detection are desirable. When the
presence of live beetles is detected, the bamboo culms could be treated with a remedial
measure. Whether or not the culms had been infected, preventive measures should be
applied before being made into products or integrated into constructions. Infestations
that occur in bamboo culms in use should be detected in the early stage by regular
inspection using a reliable apparatus. Damaged parts should be processed using a
remedial measure or be disposed of and replaced, and the application of preventive
measures is necessary to prevent re-infestation. Therefore, development of reliable,
preferably nondestructive detection systems and appropriate preventive and remedial
measures is needed. General chemical and physical control methods for the prevention
and remediation of insect pests that may be applicable to bamboo-boring beetles are
summarized in Table 5.1.
Purpose Chemical control Mechanical/physical control
Remediation
Use of insecticides
Mass trapping using
attractants
Use of growth regulators
Trapping/catching, including
uses of light and adhesive traps
Heating
Chilling
Prevention
Inhibition of infestation
Increasing of materials’
resistance to pests
Inhibition of mating
Sterilization
Evasion of attack
Use of repellents
Blocking
There are two ways in which X-ray CT and AE monitoring could be utilized in
the management of bamboo-boring beetles. They could be used as control measures,
Table 5.1. Typical examples of pest control methods, based on Kamimura and Moriyama
(2004) and Saito et al. (1986)
Page 92
88
and they could be used as laboratory analysis tools to obtain information required for
developing control measures. Applications in both ways are discussed in the following
subsections with D. minutus as an example of a bamboo-boring beetle species.
5.3.2. Application of X-ray CT and AE to inspection of insect attack
The principles of X-ray CT and AE monitoring are applicable to nondestructive
inspection of bamboo culms to determine the presence of insect damage and active
insects, whether application of a remedial treatment is necessary, whether the damaged
culms have enough residual strength to be reused, and whether the remedial treatments
applied to infested culms have been effective.
Inspection using X-ray CT could accurately reveal the number and
developmental stages of beetles present and extent of damage in infested culms.
Repeated scans at certain intervals may be needed to confirm whether the beetles inside
are active or not. The scanning conditions of the protocols employed in Chapter 2 can
be the basis for inspection using X-ray CT. In order to be able to estimate the residual
strength of attacked culms, the relationship with the extent of damage needs to be
clarified.
The waveforms of AE signals generated by D. minutus in Chapter 3, the
relationship between the amplitude and developmental stages clarified in Chapter 4, and
the distance attenuation of elastic waves in bamboo culms measured in the same chapter
are useful in interpreting signals detected from possibly infested culms; they may be
used to determine whether the signals result from active beetles or from other sources,
estimate the severity of attack, and determine the appropriate intervals of measurement
points to place sensors. For example, supposing the measurement system employed in
Page 93
89
the main experiment described in Chapter 4, when a final instar larva produced an AE
wave with amplitude of 120 dB, it would propagate approximately 0.4 m before
attenuating to the threshold level of 80 dB. The presence of rhythms in larval feeding
activity may also be useful in differentiating feeding activity from sporadic or stationary
noise signals. Because of the inactivity due to ecdysis or pupation, AE monitoring may
need to be continued for several days even if AE signals are not detected.
The systems for X-ray CT scanning and AE measurement employed in the
present research could be directly used in laboratory inspection of damaged bamboo
objects or parts. On the other hand, the development of apparatuses for in situ detection
that could be used, for example, in a construction should be pursued in the future.
Portable AE devices employed for termite detection in wooden constructions (Fujii et al.
1998, Yanase et al. 1999, 2001) may be applicable, but optimization of the devices to
bamboo culms, which have hard, round surfaces and different acoustic characteristics
than ordinary wood, is necessary.
5.3.3. Application of X-ray CT and AE as laboratory analysis tools in developing
control measures
X-ray CT and AE monitoring, as laboratory analysis tools, can contribute to the
management of D. minutus in two ways. They can be used to evaluate the efficacy of
preventive and remedial treatments and to reveal entomological knowledge on which
the development of control measures is based.
An example of the former application could be the investigation of optimum
conditions for chemical and physical remedial treatments by detecting the termination
of activity, death, or resumption of activity. The conditions include the concentrations of
active chemical ingredients in chemical treatments or fumigation, and the time and
Page 94
90
temperatures required in heat and chilling treatments. Because D. minutus prefer
bamboo culms slightly moister than in air-dry conditions (Norhisham et al. 2015, Ueda
1963, Wood Technological Association of Japan 1961, Yamano 1976), curing at low
humidity might be another non-chemical remedial treatment that should be investigated
for its effectiveness. Real-time analysis using AE monitoring would be especially
suitable in such investigations. In addition, AE measurement could reveal the threshold
temperature for feeding activity to start, which would be important for in situ inspection
using AE monitoring at low temperatures. AE monitoring could also be used to evaluate
the development- and ecdysis-inhibiting efficacy of certain remedial treatments, such as
use of chemicals or irradiation. Furthermore, the efficacy of methods of mating
disruption and sterilization could probably be evaluated by tracing the ovipositional
behavior of treated females using X-ray CT.
Entomological facts of D. minutus that were or could be revealed by X-ray CT
and AE monitoring could be utilized in IPM as explained below.
Knowing the number of instars is important in remedial treatments. The
efficacy of remedial treatments, such as chemical and heat treatments, may be different
at various stages. The conditions necessary to kill individuals in various instars could be
evaluated by X-ray CT and AE monitoring. Clarification of appropriate conditions could
prevent excessive application of treatments, reducing the cost, negative impacts on
treated bamboo materials, human health, and environment, and the risk of beetles’
acquiring tolerance to active chemicals.
In this research, the durations of egg, larval, and pupal developmental periods
of D. minutus and their bamboo consumption during the larval stages under constant
conditions were determined. However, these durations and amounts are likely to vary
under different conditions, and X-ray CT and AE monitoring could be used to
Page 95
91
investigate the effects of various factors on developmental periods and bamboo
consumption. In general, a linear relationship is satisfied between the reciprocal of a
developmental period (rate of development) of an insect and the temperature at which
development occurs, and this relationship is characterized by two constants, low
developmental threshold temperature and thermal constant. Investigation of the
developmental durations at different temperatures could reveal the two constants for
each stage. The deduced relationship between temperature and developmental period,
which allows estimation of the developmental duration at any temperature, would be
useful in any circumstances for IPM, for example, for estimating the emergence of the
next generation when there is a possibility of re-infestation or estimating the time period
elapsed after the first entrance of mother beetles.
The extent of attack caused by the larvae, which was evaluated in terms of
tunnel length and volume, may also be a function of various conditions, for example,
nutritional conditions of the bamboo culms. Because the contents of starch and other
carbohydrates in bamboo culms fluctuate throughout the year, studies have been
conducted to quantify the fluctuation of the contents of starch and sugars throughout the
year (Garcia and Morrell 2008, Hirano et al. 2003, Okahisa et al. 2006, Yoshimoto and
Morita 1985) and to clarify the relationship of the contents of carbohydrates to the
extent of attack of D. minutus (Garcia and Morrell 2008, Plank and Hageman 1951).
However, only adult entrance was observed in these studies, and other aspects of the life
history such as the number of eggs laid inside culms or damage caused by the
developing larvae were not examined. X-ray CT and AE monitoring could be used to
investigate the effects of nutritional factors on oviposition, larval development, and
extent of attack during these processes. The results could provide a method to estimate
the susceptibility of bamboo culms and be applied to developing novel treatments to
Page 96
92
increase the resistance of bamboo culms. In addition, laboratory efficacy tests of
chemical preventive treatments were evaluated based on adult entrance into culms in
previous studies (Garcia and Morrell 2010, Ninomiya and Kotani 2002, Plank 1950).
X-ray CT and AE monitoring could also be used to evaluate the efficacy of these
treatments in reducing the amount of damage caused during ovipositional and
developmental processes. Furthermore, once the effects of environmental and
nutritional conditions on development and feeding are comprehensively clarified, a
reliable model predicting the progress of infestation and resultant damage to bamboo
culms could be designed.
In Section 5.2, it was explained that X-ray CT and AE monitoring are
promising for investigating the ovipositional behavior and other activities of adults.
Characteristics of oviposition should be considered when developing methods for
inhibiting oviposition, one of the most important keys to protecting bamboo materials.
Understanding the comprehensive patterns of adult activities, such as oviposition,
feeding, and quiescence inside and flight and mating outside, may also facilitate the
development of control measures relevant to adult behavior, including trapping,
mating-inhibition, repelling, and blocking.
Understanding regarding the life history and feeding of D. minutus obtained in
this research may not directly be used to implement IPM, but further investigation of D.
minutus using X-ray CT and AE monitoring could provide information valuable for
developing control measures, such as shown in Table 5.1, leading to the establishment
of IPM for bamboo materials.
Page 97
93
Summary and conclusions
The susceptibility of felled bamboo culms to insect attack is an important
factor limiting their widespread use. The bamboo powderpost beetle Dinoderus minutus
is a major insect pest of bamboo culms. This research was conducted to evaluate the
applicability of X-ray computed tomography (CT) and acoustic emission (AE)
monitoring for nondestructive evaluation of larval development and feeding of D.
minutus in bamboo culms.
In Chapter 1, it was revealed by literature review that the life history and
feeding biology of D. minutus were poorly understood because of the difficulty
observing and analyzing the beetles inside bamboo culms, and nondestructive
techniques appropriate for such usage were needed.
In Chapter 2, X-ray CT was shown to be an effective tool to nondestructively
and quantitatively evaluate the growing body size and extending tunnel size of D.
minutus. The larval tunnels reached 80.2 mm in length and 68.0 mm3 in volume on
average. In Chapter 3, it was directly confirmed that AE waves were generated by the
feeding activity of D. minutus based on direct observation of the mandibles of D.
minutus and AE measurement, suggesting that AE measurement could be used for
continuous, real-time monitoring of feeding activity. In Chapter 4, it was shown that AE
monitoring was useful for nondestructively determining instar periods and ecdysis
events and analyzing rhythms in feeding activity. The larvae underwent seven or eight
instars in total. With a combination of X-ray CT and AE monitoring, the relationship
between the amount of bamboo consumption and the number of AE hits was clarified.
In Chapter 5, the significance of the techniques and obtained results was
discussed. The discussion draws the conclusions that X-ray CT and AE monitoring are
Page 98
94
novel, effective tools to nondestructively study the biology of D. minutus, and that these
techniques will contribute to the integrated pest management for bamboo materials,
both directly as inspection tools and indirectly through monitoring and analysis of insect
biology.
Page 99
95
Acknowledgements
I would like to express my deepest gratitude to Professor Dr. Yoshihisa Fujii,
Laboratory of Wood Processing, Division of Forest and Biomaterials Science, Graduate
School of Agriculture, Kyoto University, for supervising my research for six years. I
owe my research achievements to his kind support, advice, and encouragement
throughout the years.
I would like to express my sincere gratitude to Professor Dr. Tsuyoshi
Yoshimura, Laboratory of Innovative Humano-habitability, Research Institute for
Sustainable Humanosphere, Kyoto University, and Professor Dr. Kenji Matsuura,
Laboratory of Insect Ecology, Division of Applied Bioscience, Graduate School of
Agriculture, Kyoto University, for reviewing the manuscript of this thesis and giving
critical comments.
I would like to express my sincere gratitude to Assistant Professor Dr.
Yoshiyuki Yanase, Laboratory of Wood Processing, Division of Forest and Biomaterials
Science, Graduate School of Agriculture, Kyoto University, for his continued support of
my research and technical help in conducting experiments.
I would like to thank Assistant Professor Yutaka Sawada and Researcher Dr.
Yuko Fujiwara, Laboratory of Wood Processing, Division of Forest and Biomaterials
Science, Graduate School of Agriculture, Kyoto University, for their technical support.
I would also like to thank the members and former members of Laboratory of
Wood Processing, Division of Forest and Biomaterials Science, Graduate School of
Agriculture, Kyoto University, for supporting my laboratory life from 2012 to 2018.
December 2017
Hiroki Watanabe
Page 100
96
References
Abood, F., Norhisham, A. R. (2013) Larval development of the bamboo borer (Dinoderus minutus
Fabricius) using individual rearing method. Pertanika Journal of Tropical Agricultural Science 36(S),
55–66.
Abood, F., Norhisham, A. R., Shahman, M., Andy, A. (2010) Sexual identification of bamboo borer
Dinoderus minutus (Fabricius) (Coleoptera: Bostrychidae). Malaysian Forester 73(1), 1–6.
Acda, M. N. (2008) Insecticidal activity of thiamethoxam against the bamboo powder post beetle
Dinoderus minutus Fabr. (Coleoptera: Bostrichidae). Journal of Pest Science 81(2), 109–113.
Amman, G. D., Rasmussen, L. A. (1969) Techniques for radiographing and the accuracy of the X-ray
method for identifying and estimating numbers of the mountain pine beetle. Journal of Economic
Entomology 62(3), 631–634.
Baba, Y., Ainara, K. (2014) Development of control method for powder post beetle: examination of
inducing oviposition method and evaluation of inhibition efficacy of pesticides for oviposition and
hatching (in Japanese). Mokuzai Hozon (Wood Protection) 40(2), 64–69.
Bélanger, S., Bauce, E., Berthiaume, R., Long, B., Labrie, J., Daigle, L. F., Hébert, C. (2013) Effect of
temperature and tree species on damage progression caused by whitespotted sawyer (Coleoptera:
Cerambycidae) larvae in recently burned logs. Journal of Economic Entomology 106(3), 1331–1338.
Bernays, E. A., Woods, H. A. (2000) Foraging in nature by larvae of Manduca sexta—influenced by an
endogenous oscillation. Journal of Insect Physiology 46(5), 825–836.
Berryman, A. A., Stark, R. W. (1962) Radiography in forest entomology. Annals of the Entomological
Society of America 55(4), 456–466.
Bletchly, J. D. (1960) Studying the eggs of Lyctus brunneus. Timber Technology 68(2247), 29–31.
Brooks, S. E., Oi, F. M., Koehler, P. G. (2003) Ability of canine termite detectors to locate live termites
and discriminate them from non-termite material. Journal of Economic Entomology 96(4), 1259–
1266.
City of Nagoya (2009) Nagashinkuimushi-rui ni tsuite (About bostrychid beetles) (in Japanese).
http://www.city.nagoya.jp/kenkofukushi/page/0000004820.html. Accessed 24 November, 2017.
Creemers, J. G. M. (2013) Use of Acoustic Emission (AE) to detect activity of common European
dry-woodboring insects: some practical considerations. Proceedings of IRG Annual Meeting 2013,
Stockholm, Sweden, IRG/WP 13-10803, 8 pp.
Creemers, J. G. M. (2015) Use of acoustic emission (AE) to detect activity of common European
dry-woodboring insects: practical considerations. Proceedings of the International Symposium
Non-Destructive Testing in Civil Engineering 2015, Berlin, Germany, 8 pp.
Dyar, H. G. (1890) The number of molts of lepidopterous larvae. Psyche 5(175–176), 420–422.
Evans, T. A. (2002) Assessing efficacy of TermatracTM
; a new microwave based technology for
non-destructive detection of termites (Isoptera). Sociobiology 40(3), 575–583.
Fisher, R. C., Tasker, H. S. (1940) The detection of wood-boring insects by means of X-rays. Annals of
Applied Biology 27(1), 92–100.
Page 101
97
Fisher, W. S. (1950) A revision of the North American species of beetles belonging to the family
Bostrichidae. (Miscellaneous Publication No. 698), United States Department of Agriculture,
Washington, D. C., pp. 24–33.
Follett, P. A. (2004) Irradiation to control insects in fruits and vegetables for export from Hawaii.
Radiation Physics and Chemistry 71(1–2), 161–164.
Forestry Agency (2011) Take-kankei-shiryō (Information related to bamboo) (in Japanese).
http://www.rinya.maff.go.jp/j/tokuyou/tokusan/megurujoukyou/pdf/4take.pdf. Accessed 27 Novem-
ber, 2017.
Forestry and Forest Products Research Institute (ed.) (2004) Mokuzai-kōgyō handbook (Handbook for
wood industry) (4th edition) (in Japanese). Maruzen, Tokyo, pp. 194–195.
Frampton, E. R. (1986) Determination of the number of larval instars of Sitona discoideus Gyllenhal
(Coleoptera: Curculionidae) using probit analysis. New Zealand Journal of Zoology 13(1), 107–111.
Fuchs, A., Schreyer, A., Feuerbach, S., Korb, J. (2004) A new technique for termite monitoring using
computer tomography and endoscopy. International Journal of Pest Management 50(1), 63–66.
Fujii, T. (ed.) (2013) Basic science and advanced technologies for industrial applications of bamboo
(popular edition) (in Japanese). CMC Publishing, Tokyo, 236 pp.
Fujii, Y., Fujiwara, Y., Yanase, Y., Okumura, S., Narahara, K., Nagatsuma, T., Yoshimura, T., Imamura,
Y. (2007) Nondestructive detection of termites using a millimeter-wave imaging technique. Forest
Products Journal 57(10), 75–79.
Fujii, Y., Imamura, Y., Iwatsubo, E., Yamamoto, S. (1997) Control of termite attack using trapping
method and acoustic emission (AE) monitoring: a case study at an electric power plant (in Japanese).
Mokuzai Hozon (Wood Protection) 23(3), 111–120.
Fujii, Y., Imamura, Y., Shibata, E. (1994) Detection of acoustic emission (AE) generated by the feeding
activity of Semanotus japonicus LACORDAIRE (in Japanese). Japanese Journal of Environmental
Entomology and Zoology 6(3), 112–118.
Fujii, Y., Imamura, Y., Shibata, E., Noguchi, M. (1992) Feasibility of AE (Acoustic Emission)
monitoring for the detection of the activities of wood destroying insects. Proceedings of IRG Annual
Meeting 1992, Harrogate, UK, IRG/WP 92-2416, 9 pp.
Fujii, Y., Imamura, Y., Yoshimura, T. (1995) Observation of feeding behavior of termite using CCD
camera and its relation to the generation of acoustic emission (AE). Wood Research 82, 47–53.
Fujii, Y., Noguchi, M., Imamura, Y., Tokoro, M. (1990) Using acoustic emission monitoring to detect
termite activity in wood. Forest Products Journal 40(1), 34–36.
Fujii, Y., Yanase, Y., Imamura, Y., Okumura, S., Oka, S. (1998) Detection of termite attack in wooden
buildings with AE monitoring: case study at a traditional Japanese warehouse (in Japanese). Japanese
Journal of Environmental Entomology and Zoology 9(3), 101–105.
Fukuda, K., Otuka, T., Imaizumi, S. (1994) Insect damage of kaya roofing materials and their control
method (in Japanese). Mokuzai Hozon (Wood Protection) 20(4), 195–200.
Garcia, C. M., Morrell, J. J. (2008) Seasonal occurrence of the powderpost beetle, Dinoderus minutus, in
the Philippines. Journal of Tropical Forest Science 20(2), 139–145.
Page 102
98
Garcia, C. M., Morrell, J. J. (2009) Development of the powderpost beetle (Coleoptera: Bostrichidae) at
constant temperatures. Environmental Entomology 38(2), 478–483.
Garcia, C. M., Morrell, J. J. (2010) Efficacy and economic benefits of prophylactic treatments of newly
felled bamboo. Journal of Economic Entomology 103(1), 101–107.
Himmi, S. K., Yoshimura, T., Yanase, Y., Oya, M., Torigoe, T., Imazu, S. (2014) X-ray tomographic
analysis of the initial structure of the royal chamber and the nest-founding behavior of the drywood
termite Incisitermes minor. Journal of Wood Science 60(6), 453–460.
Hirano, Y., Shida, S., Arima, T. (2003) Effect of cutting season on biodeterioration in madake
(Phyllostachys bambusoides) (in Japanese). Mokuzai Gakkaishi 49(6), 437–445.
Imamura, Y., Adachi, A., Fujii, Y. (1998) Acoustic emission (AE) detected from wood attacked by
powder-post beetles, Lyctus brunneus STEPHENS (in Japanese). Japanese Journal of Environmental
Entomology and Zoology 9(3), 98–100.
Imamura, Y., Fujii, Y. (1995) Analysis of feeding activities of termites by AE monitoring of infested
wood (in Japanese). Mokuzai Hozon (Wood Protection) 21(2), 61–69.
Indrayani, Y., Nakayama, T., Yanase, Y., Fujii, Y., Yoshimura, T., Imamura, Y. (2003) Feeding activities
of the dry-wood termite Cryptotermes domesticus (Haviland) under various relative humidity and
temperature conditions using acoustic emission monitoring. Japanese Journal of Environmental
Entomology and Zoology 14(4), 205–212.
Indrayani, Y., Yoshimura, T., Yanase, Y., Fujii, Y., Imamura, Y. (2007a) Evaluation of the temperature
and relative humidity preferences of the western dry-wood termite Incisitermes minor (Hagen) using
acoustic emission (AE) monitoring. Journal of Wood Science 53(1), 76–79.
Indrayani, Y., Yoshimura, T., Yanase, Y., Fujii, Y., Matsuoka, H., Imamura, Y. (2007b) Observation of
feeding behavior of three termite (Isoptera) species: Incisitermes minor, Coptotermes formosanus, and
Reticulitermes speratus. Sociobiology 49(3), 121–134.
Iwata, R., Nishimoto, K. (1985) Studies on the autecology of Lyctus brunneus (STEPHENS) (Coleoptera,
Lyctidae): VI. Larval development and instars with special reference to an individual rearing method.
Wood Research 71, 32–45.
Jennings, J. T., Austin, A. D. (2011) Novel use of a micro-computed tomography scanner to trace larvae
of wood boring insects. Australian Journal of Entomology 50(2), 160–163.
Johnson, J., Marcotte, M. (1999) Irradiation control of insect pests of dried fruits and walnuts. Food
Technology 53, 46–51.
Jones, S. R., Ritchie, P. D. (1937) Radiographic detection of Lyctus larvae in situ. Technical Studies in
the Field of Fine Arts 5(3), 179–181.
Kamimura, K., Moriyama, Y. (2004) On the household pest control method and IPM (in Japanese).
House and Household Insect Pests 26(2), 71–98.
Kartika, T., Yoshimura, T. (2013) Nutritional quality of diet and fecundity in Lyctus africanus (Lesne).
Procedia Environmental Sciences 17, 97–104.
Kawakami, Y., Iwata, R. (1993) Dinoderus bifoveolatus (WOLLASTON) (Coleoptera: Bostrychidae)
further found in Japan (in Japanese). House and Household Insect Pests 15(1), 17–20.
Page 103
99
Khalil, M. A. K., Rasmussen, R. A., French, J. R. J., Holt, J. A. (1990) The influence of termites on
atmospheric trace gases: CH4, CO2, CHCl3, N2O, CO, H2, and light hydrocarbons. Journal of
Geophysical Research 95(D4), 3619–3634.
Kigawa, R., Torigoe, T., Imazu, S., Honda, M., Harada, M., Komine, Y., Kawanobe, W. (2009) Detection
of insects in wooden objects by X-ray CT scanner (in Japanese). Science for Conservation 48, 223–
231.
Koestler, R. J., Sardjono, S., Koestler, D. L. (2000) Detection of insect infestation in museum objects by
carbon dioxide measurement using FTIR. International Biodeterioration & Biodegradation 46(4),
285–292.
Le Conte, S., Vaiedelich, S., Thomas, J.-H., Muliava, V., de Reyer, D., Maurin, E. (2015) Acoustic
emission to detect xylophagous insects in wooden musical instrument. Journal of Cultural Heritage
16(3), 338–343.
Lemaster, R. L., Beall, F. C., Lewis, V. R. (1997) Detection of termites with acoustic emission. Forest
Products Journal 47(2), 75–79.
Lewis, V. R., Fouche, C. F., Lemaster, R. L. (1997) Evaluation of dog-assisted searches and electronic
odor devices for detecting the western subterranean termite. Forest Products Journal 47(10), 79–84.
Lewis, V. R., Lemaster, R. L. (1991) The potential of using acoustical emission to detect termites within
wood. In: M. I. Haverty, W. W. Wilcox (technical coordinators), Proceedings of the symposium on
current research on wood-destroying organisms and future prospects for protecting wood in use; Sept.
13, 1989; USDA Forest Service Gen. Tech. Rep. PSW-128. pp. 34–37.
Lewis, V. R., Lemaster, R. L., Beall, F. C., Wood, D. L. (1991) Using AE monitoring for detecting
economically important species of termites in California. Proceedings of IRG Annual Meeting 1991,
Kyoto, Japan, IRG/WP 2375, 8 pp.
Lewis, V. R., Power, A. B., Haverty, M. I. (2004) Surface and subsurface sensor performance in
acoustically detecting western drywood termites in naturally infested boards. Forest Products Journal
54(6), 57–62.
Logan, J. A., Bentz, B. J., Vandygriff, J. C., Turner, D. L. (1998) General program for determining instar
distributions from headcapsule widths: example analysis of mountain pine beetle (Coleoptera:
Scolytide) data. Environmental Entomology 27(3), 555–563.
Matsuoka, H., Fujii, Y., Okumura, S., Imamura, Y., Yoshimura, T. (1996) Relationship between the type
of feeding behavior of termites and the acoustic emission (AE) generation. Wood Research 83, 1–7.
Miyamoto, H. (1985) Insect damage to outside telecommunication plant, especially in electrical cables
and wires (in Japanese). House and Household Insect Pests (23, 24), 56–68.
Mori, H., Arai, H. (1979) Insect damage in bamboo materials and its prevention (in Japanese). House and
Household Insect Pests (1, 2), 9–23.
Mori, H., Kumagai, M., Hirokawa, K., Machida, K. (1979) Ecological observative method of Lyctus
powder-post beetles through Roentgenography (in Japanese). House and Household Insect Pests (3,
4), 60–73.
Nagata, S., Morooka, N., Asaoka, K., Nagasawa, H. (2011) Identification of a novel hemolymph peptide
that modulates silkworm feeding motivation. Journal of Biological Chemistry 286(9), 7161–7170.
Page 104
100
Nagata, S., Nagasawa, H. (2006) Effects of diet-deprivation and physical stimulation on the feeding
behaviour of the larvae of the silkworm, Bombyx mori. Journal of Insect Physiology 52(8), 807–815.
Nair, K. S. S., Mathew, G., Varma, R. V., Gnanaharan, R. (1983) Preliminary investigations on the
biology and control of beetles damaging stored reeds. (KFRI Research Report 19), Kerala Forest
Research Institute, Peechi, 35 pp.
NDIS 2110 (1997) Method for measurement of sensitivity degradation of acoustic emission transducer (in
Japanese). Japanese Society for Non-Destructive Inspection, Tokyo, Japan.
Niiho, C. (1984) Ecological study of the tobacco beetle, Lasioderma serricorne (F.): II. Growth of
tobacco beetles fed on bread crumbs (in Japanese). Japanese Journal of Applied Entomology and
Zoology 28(4), 209–216.
Ninomiya, S., Kotani, K. (2002) Feeding tests by Dinoderus minutus Fabricius on acetylated bamboo (in
Japanese). Mokuzai Hozon (Wood Protection) 28(4), 135–143.
Nobuchi, A. (1986) Two new discovered species of Bostrychidae (Coleoptera) from Japan (in Japanese).
Mokuzai Hozon (Wood Protection) 12(3), 237–241.
Nobuchi, A. (1992) Identification for timber pests and their allied insects found in house, II (in Japanese).
Mokuzai Hozon (Wood Protection) 18(3), 129–144.
Noguchi, M., Fujii, Y., Owada, M., Imamura, Y., Tokoro, M., Tooya, R. (1991) AE monitoring to detect
termite attack on wood of commercial dimension and posts. Forest Products Journal 41(9), 32–36.
Norhisham, A. R., Abood, F., Rita, M., Hakeem, K. R. (2013) Effect of humidity on egg hatchability and
reproductive biology of the bamboo borer (Dinoderus minutus Fabricius). SpringerPlus 2, 9.
Norhisham, A. R., Faizah, A., Zaidon, A. (2015) Effects of moisture content on the bamboo borer
Dinoderus minutus. Journal of Tropical Forest Science 27(3), 334–341.
Okahisa, Y., Azuma, M., Hikita, Y. (2005) A survey on the architectural use of bamboo in Japan (in
Japanese). Mokuzai Hozon (Wood Protection) 31(2), 57–62.
Okahisa, Y., Yoshimura, T., Imamura, Y. (2006) Seasonal and height-dependent fluctuation of starch and
free glucose contents in moso bamboo (Phyllostachys pubescens) and its relation to attack by termites
and decay fungi. Journal of Wood Science 52(5), 445–451.
Panzavolta, T. (2007) Instar determination for Pissodes castaneus (Coleoptera: Curculionidae) using head
capsule widths and lengths. Environmental Entomology 36(5), 1054–1058.
Plank, H. K. (1948) Biology of the bamboo powder-post beetle in Puerto Rico. (Bulletin No. 44), Federal
Experiment Station in Puerto Rico, Mayaguez, 29 pp.
Plank, H. K. (1950) Studies of factors influencing attack and control of the bamboo powder-post beetle.
(Bulletin No. 48), Federal Experiment Station in Puerto Rico, Mayaguez, 39 pp.
Plank, H. K., Hageman, R. H. (1951) Starch and other carbohydrates in relation to the powder-post beetle
infestation in freshly harvested bamboo. Journal of Economic Entomology 44(1), 73–75.
Robbins, W. P., Mueller, R. K., Schaal, T., Ebeling, T. (1991) Characteristics of acoustic emission signals
generated by termite activity in wood. Proceedings of IEEE 1991 Ultrasonics Symposium, Orlando,
Florida, USA, 1047–1051.
Saito, T., Matsumoto, Y., Hirashima, Y., Kuno, E., Nakashima, T. (1986) Shin-ōyō-konchū-gaku
(Applied entomology: new revision) (in Japanese). Asakura Publishing, Tokyo, p. 121.
Page 105
101
Sanderson, M. G. (1996) Biomass of termites and their emissions of methane and carbon dioxide: a global
database. Global Biogeochemical Cycles 10(4), 543–557.
Schäfer, K., Goergen, G., Borgemeister, C. (2000) An illustrated identification key to four different
species of adult Dinoderus (Coleoptera: Bostrichidae), commonly attacking dried cassava chips in
West Africa. Journal of Stored Products Research 36(3), 245–252.
Scheffrahn, R. H., Robbins, W. P., Busey, P., Su, N.-Y., Mueller, R. K. (1993) Evaluation of a novel,
hand-held, acoustic emissions detector to monitor termites (Isoptera: Kalotermitidae, Rhinotermitidae)
in wood. Journal of Economic Entomology 86(6), 1720–1729.
Simpson, S. J. (1982) Patterns in feeding: a behavioural analysis using Locusta migratoria nymphs.
Physiological Entomology 7(3), 325–336.
Sitaraman, N. L. (1951) Studies on the common bamboo-borer, Dinoderus ocellaris Steph. Part III.
Biology. Proceedings of the Indian Academy of Sciences - Section B 34(3), 148–156.
Sokolove, P. G., Bushell, W. N. (1978) The chi square periodogram: its utility for analysis of circadian
rhythms. Journal of Theoretical Biology 72(1), 131–160.
Sone, K., Mori, T., Ide, M., Setoguchi, M., Yamanouchi, K. (1995) Application of computer tomography
to surveys of the galleries of the oak borer, Platypus quercivorus (MARUYAMA) (Coleoptera:
Platypodidae) (in Japanese). Japanese Journal of Applied Entomology and Zoology 39(4), 341–344.
Stus̆ek, P., Pohleven, F., Capl, D. (2000) Detection of wood boring insects by measurement of oxygen
consumption. International Biodeterioration & Biodegradation 46(4), 293–298.
Sugimoto, A., Inoue, T., Tayasu, I., Miller, L., Takeichi, S., Abe, T. (1998) Methane and hydrogen
production in a termite-symbiont system. Ecological Research 13(2), 241–257.
Suzuki, K., Kirton, L. G. (1991) An evaluation of some cereal and tuber based artificial diets for
laboratory culture of Dinoderus minutus Fabricius (Coleoptera: Bostrychidae) (in Japanese). House
and Household Insect Pests 13(2), 59–65.
The Society of House and Household Pests Science, Japan (ed.) (1995) Kaoku-gaichū-jiten (Encyclopedia
of house and household pests) (in Japanese). Inoue Shoin, Tokyo, 468 pp.
Tokyo National Research Institute for Cultural Properties (ed.) (2001) Bunkazai-gaichū-jiten
(Encyclopedia of insect pests of cultural properties) (in Japanese). Kuba Pro., Tokyo, 231 pp.
Torigoe, T., Kigawa, R., Harada, M., Komine, Y., Imazu, S., Honda, M., Kawanobe, W. (2010)
Investigation of damaged wooden objects and application of X-ray CT to detect insect activity (in
Japanese). Science for Conservation 49, 191–196.
Uchimura, E. (2005) Take to take wo ikasu: take no seitai·kanri to take no riyō (Utilization of bamboo:
ecology and management of bamboo plants and use of bamboo materials) (in Japanese).
(Ringyō-kairyō-fukyū-sōsho No. 148), Zenrinkyou, Tokyo, 196 pp.
Uchimura, E. (2012) Take-shigen no shokubutsu-shi (Flora of bamboo resources) (in Japanese).
Soshinsha, Tokyo, 241 pp.
Uchimura, E. (ed.) (2009) Gendai ni ikasu take-shigen (Utilization of bamboo resources in the present
day) (in Japanese). Soshinsha, Tokyo, 217 pp.
Ueda, K. (1963) Useful bamboo and edible sprout (in Japanese). Hakuyusha, Tokyo, 314 pp.
Page 106
102
Watanabe, H., Yanase, Y., Fujii, Y. (2015a) Evaluation of larval growth process and bamboo
consumption of the bamboo powder-post beetle Dinoderus minutus using X-ray computed
tomography. Journal of Wood Science 61(2), 171–177.
Watanabe, H., Yanase, Y., Fujii, Y. (2015b) Evaluation of larval feeding activity of the bamboo
powder-post beetle Dinoderus minutus using acoustic emission monitoring. International Symposium
on Wood Science and Technology 2015 Abstract Book, Tokyo, Japan, 207.
Watanabe, H., Yanase, Y., Fujii, Y. (2016) Relationship between the movements of the mouthparts of the
bamboo powder-post beetle Dinoderus minutus and the generation of acoustic emission. Journal of
Wood Science 62(1), 85–92.
Watanabe, H., Yanase, Y., Fujii, Y. (2017a) Nondestructive evaluation of egg-to-adult development and
feeding behavior of the bamboo powderpost beetle Dinoderus minutus using X-ray computed
tomography. Journal of Wood Science 63(5), 506–513.
Watanabe, H., Yanase, Y., Fujii, Y. (2017b) Continuous nondestructive monitoring of larval feeding
activity and development of the bamboo powderpost beetle Dinoderus minutus using acoustic
emission. Journal of Wood Science doi: 10.1007/s10086-017-1678-4, 11 pp.
Watanabe, H., Yanase, Y., Fujii, Y. (2017c) Nondestructive analysis of oviposition of the bamboo
powderpost beetle Dinoderus minutus using acoustic emission and X-ray CT. Proceedings of IRG
Annual Meeting 2017, Ghent, Belgium, IRG/WP 17-10889, 8 pp.
Weissling, T. J., Thoms, E. M. (1999) Use of an acoustic emission detector for locating Formosan
subterranean termite (Isoptera: Rhinotermitidae) feeding activity when installing and inspecting
aboveground termite bait stations containing hexaflumuron. Florida Entomologist 82(1), 60–71.
Wood Technological Association of Japan (ed.) (1961) Mokuzai-hozon handbook (Wood protection
handbook) (in Japanese). Shokodo, Tokyo, pp. 357–456.
Wright, C. G. (1960) Biology of the southern lyctus beetle, Lyctus planicollis. Annals of the
Entomological Society of America 53(3), 285–292.
Yaghi, N. (1924) Application of the Rontgen tube to detection of boring insects. Journal of Economic
Entomology 17(6), 662–663.
Yamano, K. (1976) Kenchiku-konchū-ki (Insect pests of buildings) (in Japanese). Sagami Shobo, Tokyo,
286 pp.
Yanase, Y., Fujii, Y., Okumura, S., Imamura, Y., Kozaki, M. (1999) Detection of termite attack in
wooden buildings using AE monitoring: a case study at a house of wooden panel construction (in
Japanese). Japanese Journal of Environmental Entomology and Zoology 10(4), 160–168.
Yanase, Y., Fujii, Y., Okumura, S., Imamura, Y., Yoshimura, T. (1998) Detection of AE generated by the
feeding activity of termites using PVDF (polyvinylidene fluoride) film. Forest Products Journal
48(7/8), 43–46.
Yanase, Y., Fujii, Y., Okumura, S., Imamura, Y., Yoshimura, T. (2000a) Plate-type waveguides for
detecting acoustic emissions generated by termite attacks. Journal of Wood Science 46(3), 243–247.
Yanase, Y., Fujii, Y., Okumura, S., Yoshimura, T. (2012) Detection of metabolic gas emitted by termites
using semiconductor gas sensors. Forest Products Journal 62(7–8), 579–583.
Page 107
103
Yanase, Y., Fujii, Y., Okumura, S., Yoshimura, T., Imamura, Y. (2000b) Development of AE sensor
using PVDF film for detecting termite attack (in Japanese). Journal of the Society of Materials
Science, Japan 49(4), 401–405.
Yanase, Y., Fujii, Y., Okumura, S., Yoshimura, T., Imamura, Y. (2001) Detection of termite attack of
Incisitermes minor (Hagan) using AE monitoring (in Japanese). Japanese Journal of Environmental
Entomology and Zoology 12(2), 53–67.
Yanase, Y., Maruyama, S., Fujii, Y., Okumura, S., Yoshimura, T. (2013a) Detection of hydrogen and
methane emitted by feeding activity of termite under forced ventilation. Japanese Journal of
Environmental Entomology and Zoology 24(3), 97–105.
Yanase, Y., Miura, M., Fujii, Y., Okumura, S., Yoshimura, T. (2013b) Evaluation of the concentrations of
hydrogen and methane emitted by termite using a semiconductor gas sensor. Journal of Wood Science
59(3), 243–248.
Yanase, Y., Mori, T., Yoshimura, T., Fujiwara, Y., Fujii, Y., Torigoe, T., Imazu, S. (2014) Relationship
between porosity in wood attacked by the drywood termite Incisitermes minor and residual bending
strength (in Japanese). Journal of the Society of Materials Science, Japan 63(4), 320–325.
Yasutomi, K., Umeya, K. (1983) Household pests (in Japanese). Zennokyo, Tokyo, 310 pp.
Yoshimoto, T., Morita, S. (1985) Studies on hot-water extractives of bamboo stem (Phyllostachys
pubescens Mazel): seasonal variation of the content of free sugars (in Japanese). Bulletin of the
University of Tokyo Forests 74, 9–15.
Yoshimura, T. (2016) Protection of houses from invasive wood-attacking insects (in Japanese).
Sustainable humanosphere (Japanese ver.) 12, 1–10.
Zimmerman, P. R., Greenberg, J. P., Wandiga, S. O., Crutzen, P. J. (1982) Termites: a potentially large
source of atmospheric methane, carbon dioxide, and molecular hydrogen. Science 218(4572), 563–
565.