132
Symposium 5 – The Nutrition Society Symposium Muscle Wasting with Age – A New Challenge in Nutritional Care Part 1 – The Underlying Factors

Symposium 5 – The Nutrition Society Symposium Muscle Wasting with Age – A New Challenge in Nutritional Care Part 1 – The Underlying Factors

© University of Reading 2008 www.reading.ac.uk
Department of Food and Nutritional
Sciences
13 January 2012
Ageing and Taste Dr Lisa Methven
Food and Sensory Scientist
Lisa Methven, Food & Nutritional Sciences, UoR 3
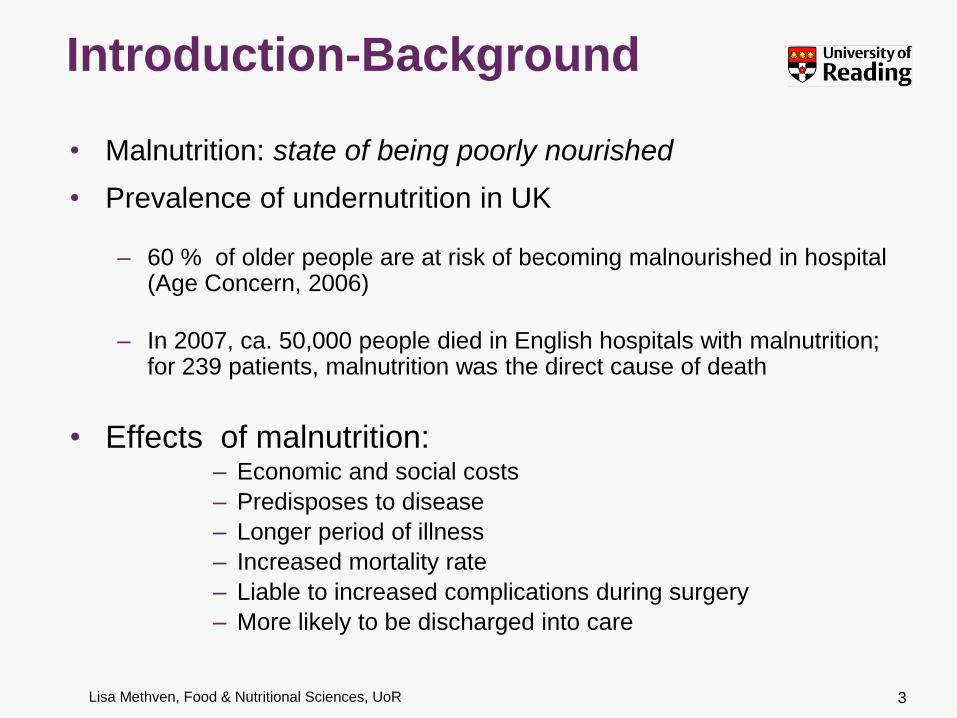
Introduction-Background
• Malnutrition: state of being poorly nourished
• Prevalence of undernutrition in UK
– 60 % of older people are at risk of becoming malnourished in hospital (Age Concern, 2006)
– In 2007, ca. 50,000 people died in English hospitals with malnutrition; for 239 patients, malnutrition was the direct cause of death
• Effects of malnutrition: – Economic and social costs
– Predisposes to disease
– Longer period of illness
– Increased mortality rate
– Liable to increased complications during surgery
– More likely to be discharged into care

Lisa Methven, Food & Nutritional Sciences, UoR 4
Background - Causes
• Why is malnutrition common among older people?
Physiological
Psychological
Socio-economic
• Taste as a factor in the management of nutrition
– (Scott and Verhagen 2000)
Diminished sensory ability: Taste and smell
deterioration caused by ageing or due to
medication and illness

Lisa Methven, Food & Nutritional Sciences, UoR
Literature on Taste Detection & Age
5
Participants Findings
Bales et al.,
1986
YP (n=30) ( 18-30, av. 24)
OP (n=32) (60+, av. 73)
Salt detection ↑ 3.8x
Sweet (sucrose) detection ↑ 1.4x
Drewnowski
et al., 1996
YP (n=24) (20-30)
OP (n=24) (60-75)
Salt detection YP=OP
Fukunaga et
al., 2005
YP (n=30) (18-29, av. 24)
OP (n=30) (65-85, av. 75)
Sweet (sucrose), Salt and Sour (tartaric) all ↑significantly
Bitter (quinine) variable
Kaneda et al.,
2000
YP (n=20) (20-40, av. 29)
OP (n=20) (59-75, av. 67)
Detection thresholds ↑, except sweet.
Matsuda and
Doty, 1995
YP (n=12) ( 20-29, av. 24)
OP (n=12) (70-79, av. 75)
Salt detection ↑
Mavi and
Ceyhan, 1999
YP (n=30) ( 17-25, av. 20)
OP (n=24) (60-80, av. 69)
Bitter detection ↑
Mojet et al.,
2001, 2003
YP (n=22) (19-33, av. 25)
OP (n=21) (60-75, av. 65)
Detection thresholds ↑, more severe for Salty and Umami.
Sweetness (aspartame) and Bitter (quinine) detection YP=OP.
Above threshold : Decreased intensity for salty & sweet, but not sour, bitter or umami.
Ng et al.,
2004
YP (n=26) ( 21-34)
Middle-Aged (n=13) (36-61)
OP (n=24) (69-94)
Taste thresholds ↑> 70 years
Receputo et
al., 1996
Centenarians (n=20) (av. 103)
OP (n=20) (av. 71)
YP (n=20) (av. 28)
Taste was severely reduced in centenarians cf OP and YP
Wayler et al.,
1990
YP (n=30) (55-65)
OP (n=37) (65-78)
Suprathreshold: OP needed larger change in NaCl concentration to perceive

Lisa Methven, Food & Nutritional Sciences, UoR
• Morphological changes - decrease in receptor numbers
• Functional changes of gustatory cells
• Neural noise hypothesis – the signal to noise ratio in the brain is
lowered by decrease in signal intensity and increase in spontaneous
firing from the taste receptor cells.
• Stimulus persistence hypothesis – the signal from the taste cells
continues to be sent to the brain even when stimulus falls below
threshold.
• Perceptual noise hypothesis - Repetitive neural firing from the taste
cells makes brain unable to ignore irrelevant signals.
• Disinhibition hypothesis – cognitive inaccuracies make individual
unable to retrieve information from memory and connect with current
signals from taste cells
• Significant increase in salt and MSG threshold for the patients.
6
Taste Thresholds:
Why They May Increase with Age
Lisa Methven, Food & Nutritional Sciences, UoR
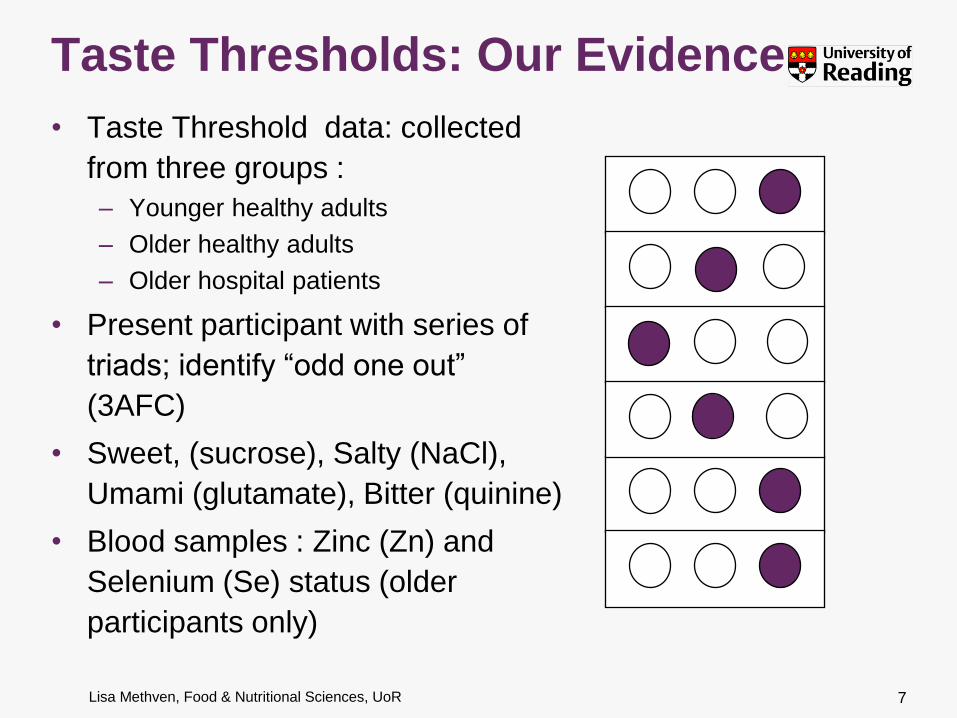
• Taste Threshold data: collected
from three groups :
– Younger healthy adults
– Older healthy adults
– Older hospital patients
• Present participant with series of
triads; identify “odd one out”
(3AFC)
• Sweet, (sucrose), Salty (NaCl),
Umami (glutamate), Bitter (quinine)
• Blood samples : Zinc (Zn) and
Selenium (Se) status (older
participants only)
• Significant increase in salt and MSG
threshold for the patients.
7
Taste Thresholds: Our Evidence

Lisa Methven, Food & Nutritional Sciences, UoR
Taste Threshold Variability
8
0
10
20
30
40
50
0.08 0.2 0.7 2.1 6.3 18.9 ≥56.8
Fre
qu
en
cy (
%)
Salt (NaCl) Detection Threshold (mM)
Salt Taste Detection Thresholds
Older Volunteers (%) Older Patients (%)
0
5
10
15
20
25
30
35
0.08 0.2 0.7 2.1 6.3 18.9 ≥56.8
Fre
qu
en
cy (
%)
Umami (MSG) detection threshold (mM)
Umami (glutamate) Detection Thresholds
Older Volunteers (%) Older Patients (%)
0
5
10
15
20
25
30
35
0.0008 0.002 0.005 0.013 0.03 0.08 ≥0.2
Fre
qu
ncy
(%
)
Bitter (quinine) detection threshold (mM)
Bitter (quinine) Detection Thresholds
Older Volunteers (%) Older Patients (%)
Lisa Methven, Food & Nutritional Sciences, UoR
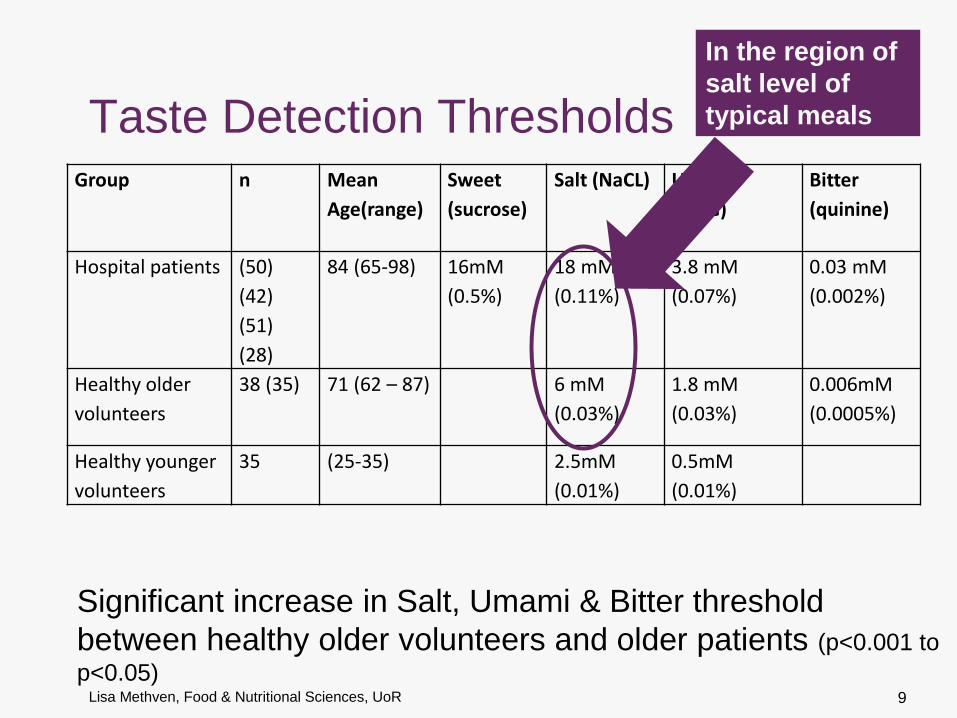
Taste Detection Thresholds Group n Mean
Age(range)
Sweet
(sucrose)
Salt (NaCL) Umami
(MSG)
Bitter
(quinine)
Hospital patients (50)
(42)
(51)
(28)
84 (65-98) 16mM
(0.5%)
18 mM
(0.11%)
3.8 mM
(0.07%)
0.03 mM
(0.002%)
Healthy older
volunteers
38 (35) 71 (62 – 87) 6 mM
(0.03%)
1.8 mM
(0.03%)
0.006mM
(0.0005%)
Healthy younger
volunteers
35 (25-35) 2.5mM
(0.01%)
0.5mM
(0.01%)
9
Significant increase in Salt, Umami & Bitter threshold
between healthy older volunteers and older patients (p<0.001 to
p<0.05)
In the region of
salt level of
typical meals

Lisa Methven, Food & Nutritional Sciences, UoR
Zinc & Selenium Status Variability
10
0
10
20
30
40
50
60
<0.8 0.8-1.14 1.15-1.4 >1.4
Fre
qu
ecn
y (%
)
Selenium (µmol/L)
Selenium Status
Older Patients Healthy Older Volunteers
0
10
20
30
40
50
60
70
80
<8 8-12 13-17 >17
Fre
qu
en
cy (
%)
Zinc (µmol/L)
Zinc Status
Patients Healthy Volunteers

Lisa Methven, Food & Nutritional Sciences, UoR
Zinc & Selenium Status
11
Group n Mean
Age(range)
Zn (µmol/L) % below
reference
Se
(µmol/L)
% below
reference
HADS
Hospital
patients
34 84
(71 – 93)
11 ± 6.4 19% 0.8 ± 0.39 56% 13 ± 8
Healthy
older
volunteers
38 71
(62 – 87)
13 ± 1.4 0% 1.2 ± 0.21 3% 7 ± 4
Reference
range
8-17 0.8-1.4
significance < 0.0001 < 0.0001 < 0.0001
Mean serum Zn and Se levels significantly lower for patients.
Anxiety & depression scores (not suprisingly) higher for
patients

Lisa Methven, Food & Nutritional Sciences, UoR
Zinc & Selenium : a reason to supplement ?
12
• Zinc deficiency reduces taste acuity
Zn required for taste cell growth
• Selenium required by thyroid hormones & effects
neurotransmitter activity
May affect mood; thereby affecting food consumption directly;
or may increase taste thresholds.

Lisa Methven, Food & Nutritional Sciences, UoR
Zinc & Selenium : Previous studies
13
Zenith study (Stewart-Knox 2005)
n = 199 in Zn supp. Study
Healthy older volunteers
Salt taste acuity improved
Mean serum Zn pre-intervention 13µmol/L Maybe more effective with patients ? (our patient mean 11µmol/L; but with 73% lower)
Patient study (Gosney 2008)
n = 50 in Se supp. study
Improved mood, decreased anxiety
Mean serum Se pre-intervention 1.0 µmol/L
Healthy Older Volunteers (Rayman, 2005)
n = 501 in Se supp. study
No affect on mood
Improved mood, decreased anxiety
Mean serum Se pre-intervention 1.2 µmol/L
Zinc Selenium
Lisa Methven, Food & Nutritional Sciences, UoR
Taste Enhancement of Food for
Older Hospital Patients
14

Lisa Methven, Food & Nutritional Sciences, UoR
Background- Previous studies
• Schiffman et al. : Flavour and/or monosodium glutamate (MSG) led
to increased food consumption among older people, increased
salivary flow, improved immunity and muscle strength
• Bellisle et al. (1998): older people preferred food with MSG
• Toyama et al. (2008): consumption of food with MSG improved
routine function and quality of life of older patients
• Essed et.al. (2009): no effect on intake and liking of soup enhanced
with MSG
• Essed et.al. (2007): no effect of 16 week flavour /and or MSG
addition to animal protein on dietary intake and nutritional status of
nursing home elderly
15
Enhancement of umami taste of food for older
people in order to increase consumption

Lisa Methven, Food & Nutritional Sciences, UoR 16
Our approach…
AIM
• Improve the palatability of savoury foods for older hospital patients in order to stimulate appetite and increase consumption.
Hypothesis
• Taste enhancement will increase liking and consumption.
• Taste sensitivity affects their liking and consumption.
Approach
• Enhancement of savoury characteristics using naturally occurring tastants in hospital food to levels preferred by older people
Natural ingredients

Lisa Methven, Food & Nutritional Sciences, UoR 17
Our approach…
Use of natural ingredients rich in umami taste
compounds
Maximum levels of “UMAMI” ingredients in a meat dish
Keep Sodium levels constant

Lisa Methven, Food & Nutritional Sciences, UoR
The Umami Taste
• Characteristic taste of Glutamate (MSG) and 5’-nucleotides
• Multiple Receptors (Chaudhari, 2009, Am J Clin Nutr, 90, 1S-5S)
• Specific L- glutamate receptors on the tongue, and in
stomach
– mGluR1
– mGluR4
• Less specific heterodimer T1R1 + T1R3
– responds to amino acids AND ribonucleotides
• Synergy between the umami amino acids & ribonucleotides
• Enhancement of savoury volatile flavours : greater activation
shown in cortex taste-olfactory convergence regions of the brain
by fMRI (McCabe & Rolls, 2007, E J Neuroscience, 25, 1855-1864)
18

Lisa Methven, Food & Nutritional Sciences, UoR
Umami and Older People • Dry mouth due to diminished salivation
– Umami stimulation increases salivary flow (Hodson and Linden, 2006;
Schiffman et al.)
• Reduced appetite due to diminished sensory ability
– Umami sensitivity strongest correlation with human appetite (Shi et
al, 2004)
– Preference for umami is affected by nutritional status (Murphy, 1987)
• Gastric dysfunction
– Stimulating gastric function through gastric L-glutamate receptors (Toyoma et al, 2008)
– Chronic atrophic gastritis
• MSG supplementation of meals was reported to increase
basal and maximal acid output to normal amounts and
improved appetite (Kochet et al)
– Delayed gastric emptying
• MSG in combination with protein rich foods increased gastric
emptying rate (Zai et al, 2009)
19

Lisa Methven, Food & Nutritional Sciences, UoR
Umami Amino Acids & Ribonucleotides
20
Aspartic acid
Glutamic acid
Inosine
monophosphate
Guanosine
monophosphate
Adenosine
monophosphate

Lisa Methven, Food & Nutritional Sciences, UoR
Recipe development
chemical analysis
Sensory profiling
Trained sensory panel (n=10, mean age 46 )
Consumer study 1
Younger (n=31, age 21-32, mean 25)
Older (n=32, age 62-83, mean 73)
Consumer study 2
Older (n=35, age 62-87, mean 71)
Hospital study
Older hospital patients
(n=31, age 65-92, mean 84)
21
Methodology

Lisa Methven, Food & Nutritional Sciences, UoR 22
NHS Basic minced meat
recipe
Minced meat (42%)
+
Sunflower oil (1%)
+
Onion puree(8.6%)
+
Garlic puree (0.7%)
+
Cornflour (1.7%)
+
Water (beef stock) (43%)
+
Tomato puree (30%TS)
(2.8%)
+
Salt (0.2)
Instructions
1. Heat oil
2. Brown beef
3. Cook onion
4. Add garlic tomato puree
5. Add salt
6. Add beef stock and
simmer
7. Add cornflour
Additional Ingredients :
MSG
Yeast extracts (maxarome, gistex)
Mycoscent (mycoprotein)
Soy sauce (Kikkoman Low Salt)
(SS)
Tomato puree
Honzokuri miso paste (Low Salt)
Shiitake (70oC extract)
Concentrated Tomato Extract
Optimisation of Recipe
Maximum possible levels of ingredients
Sodium levels kept constant for all recipes
(0.2%)

Lisa Methven, Food & Nutritional Sciences, UoR
Hospital study: Methods
23
• Which samples? Control vs Enhanced cottage pies
• Enhanced pie: Soy Sauce and Concentrated Tomato Extract
(SS+CTE)
• Enhanced gravy : soy sauce (SS)
• Where? Elderly Care Wards in one NHS Trust Fund
• Volunteers? 31 older (age>65) patients (11 Male and 20
Female)
• Protocol
• Consent
• Screening
• Liking and preference test on minced meat
• Measurement of consumption of the two cottage pies during lunch time
Lisa Methven, Food & Nutritional Sciences, UoR
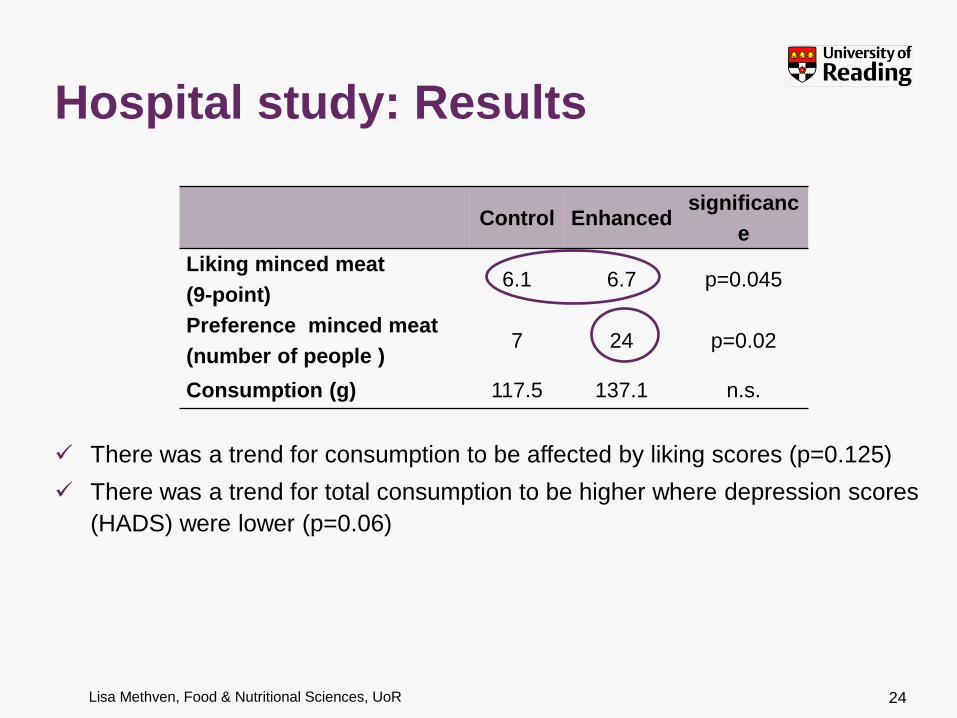
Control Enhanced significanc
e
Liking minced meat
(9-point) 6.1 6.7 p=0.045
Preference minced meat
(number of people ) 7 24 p=0.02
Consumption (g) 117.5 137.1 n.s.
24
There was a trend for consumption to be affected by liking scores (p=0.125)
There was a trend for total consumption to be higher where depression scores
(HADS) were lower (p=0.06)
Hospital study: Results

Lisa Methven, Food & Nutritional Sciences, UoR
• Consenting & bias to the “least frail”
• Two plates confusing / difficult to handle / overwhelming
• Lunch time too early, volunteers were not hungry
• Some people stated that preferred one sample but decided to eat
more of the other one ?!
• Older people score liking high to please the researcher
• Repeat exposure may affect consumption of enhanced meals –
not taken into account here
Challenges/Limitations
25

Lisa Methven, Food & Nutritional Sciences, UoR 26
• Thresholds increase with age & illness/medication. Salt thresholds
increased more than glutamate.
→ Logical approach to enhance umami taste of food for older
people
• Natural ingredients successfully used to enhance the taste of food
• Majority of patients preferred enhanced minced meat
• No significant differences in consumption of the different samples
• Consumption can be affected by mood
• More factors need to be taken into account apart from taste in
order to increase consumption for older hospital patients
Conclusions

Lisa Methven, Food & Nutritional Sciences, UoR
Acknowledgements Dr Maria Dermiki
Students J. Willway (MSc)
L. Binks (MSc)
J. Kidman (BSc)
C. Anderson (BSc)
RBH NHS Trust Catering:
W. Robinson, J. Fitzgerald, J. Swift
RBH NHS Clinical: Professor of Elderly Care Medicine M. A. Gosney
Heston Blumenthal
Volunteers
Sensory panel 27
Thank
you

Steve Harridge
Muscle loss in old age: Is it all due to ageing?
BAPEN 2011

Some background thoughts on human ageing...
• Being physically active (and eating well) is the default position for maintaining good physiological function – “Exercise is not a mere variant of the condition of rest, it is the essence
of the machine”. Barcroft, J. (1934)
• It follows that exercise should be not be viewed as a positive intervention, more that “sedentariness” is a negative intervention
• The effects of sedentariness are not predicable (but usually negative) and distort the effects of the inherent ageing process on physiological function
• Our understanding of the changes in physiological function due to ageing per se is incomplete, as we are unable to separate out inactivity factors from the inherent ageing process
Lazarus & Harridge 2007, 2010, 2011
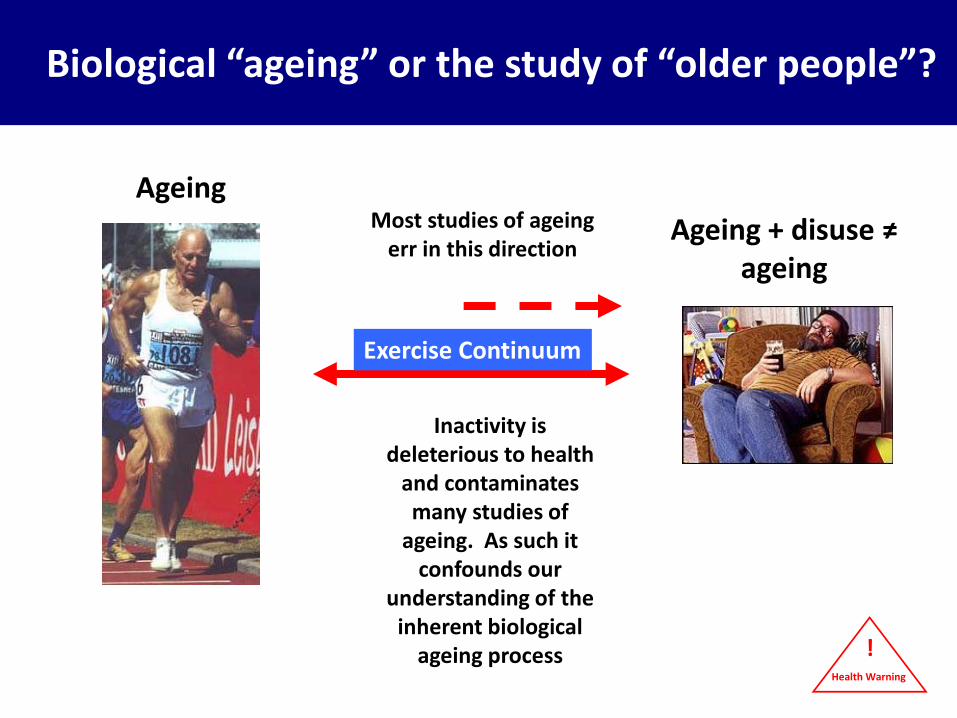
What population should we use? Biological “ageing” or the study of “older people”?
Ageing + disuse ≠ ageing
Most studies of ageing err in this direction
Inactivity is deleterious to health
and contaminates many studies of
ageing. As such it confounds our
understanding of the inherent biological
ageing process
Ageing
Exercise Continuum
Health Warning
!

Some more background thoughts...
• We do not know the optimal type, intensity or volume of exercise needed to maintain good physiology throughout the lifespan
• It is undoubtedly true that one type of exercise will not be optimal for all physiological systems and that specific exercise of one type may favour a particular system
• The longitudinal study of individuals who maintain very high levels of physical activity will help us to understand more about inherent ageing on physiological function
• This talk will consider primarily what we know about the muscles of “typical” older people..
Lazarus & Harridge 2007, 2010, 2011
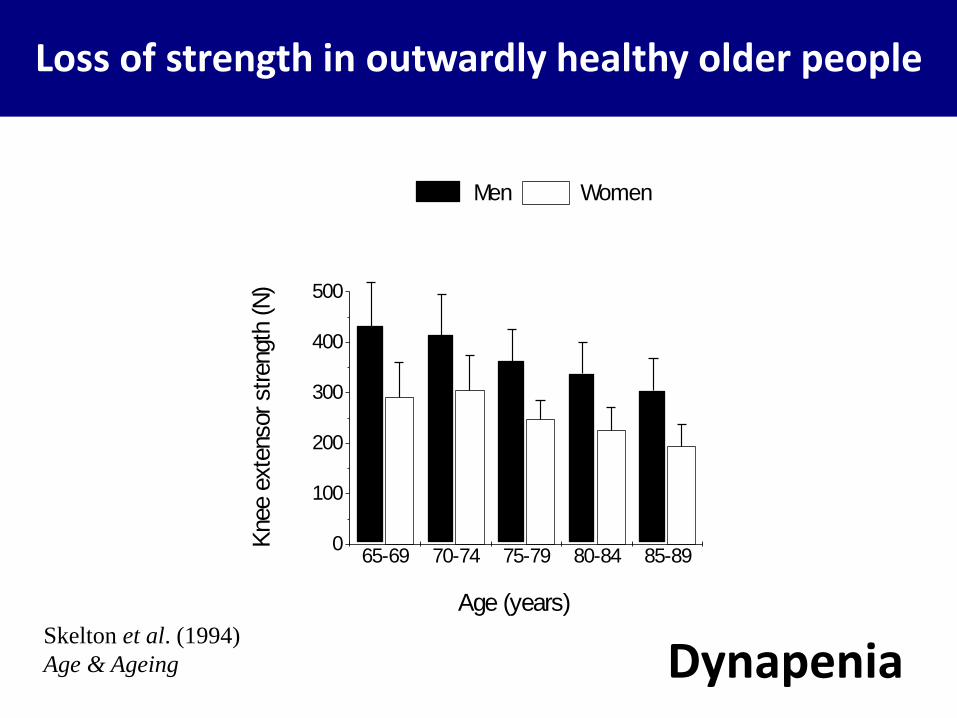
65-69 70-74 75-79 80-84 85-890
100
200
300
400
500
Knee e
xte
nsor strength
(N
)
Age (years)
Men Women
Skelton et al. (1994)
Age & Ageing
Loss of strength in outwardly healthy older people
Dynapenia

0 10 20 30 40 50 60 70 800
20
40
60
80
100
120
140
Po
wer
(W
atts
)
Torque (Nm))
0 1 2 3 4 5 60
20
40
60
80
100
120
140
0
20
40
60
80
100
120
140
Po
wer (W
atts)
Young Elderly
To
rqu
e (N
m)
Angular Velocity (rad s-1
)
Power deficit for the same torque Same torque
requirement
Harridge & Young (1996)
Data from Harridge & White (1993)
Young ■ Old ○
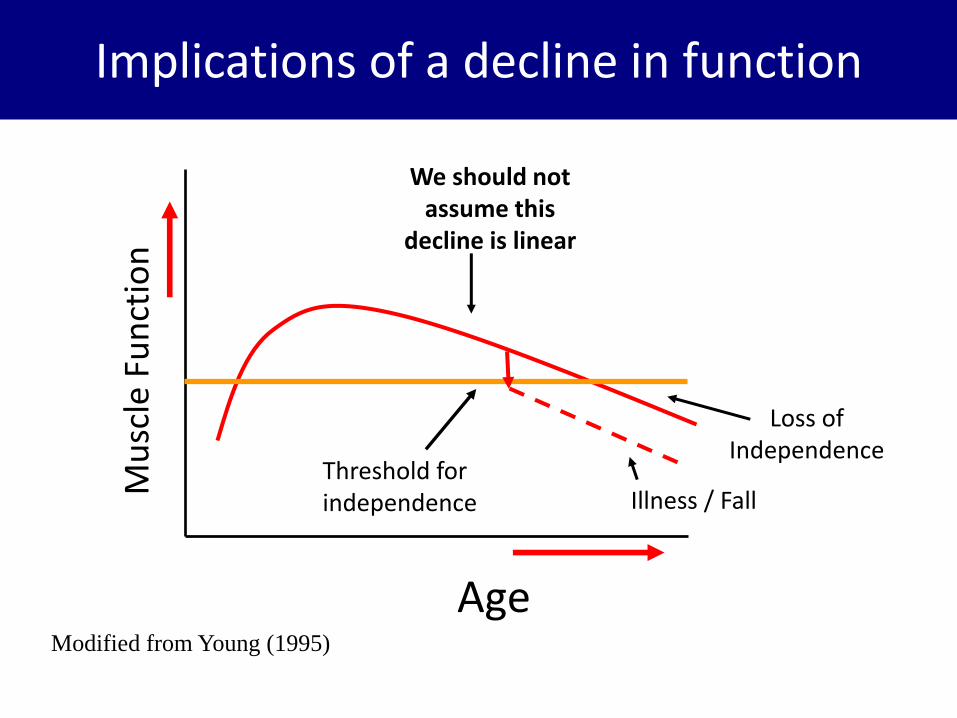
Mu
scle
Fu
nct
ion
Age
Loss of Independence
Threshold for independence
Modified from Young (1995)
Implications of a decline in function
Illness / Fall
We should not assume this
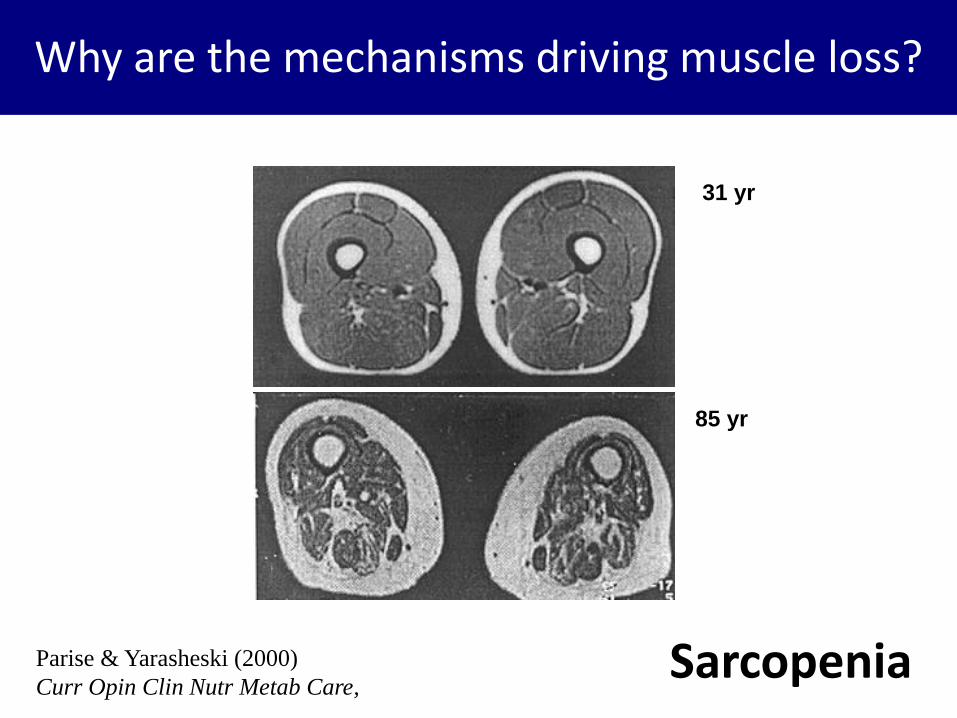
decline is linear

The main (but not only) problem….
Parise & Yarasheski (2000)
Curr Opin Clin Nutr Metab Care,
85 yr
31 yr
Sarcopenia

Functions of skeletal muscle:
• Biological machine
• Endogenous source of heat
• Dynamic metabolic store
• Protective padding
• Metabolic regulation
Why is muscle loss important?

CSA STRENGTH0
20
40
60
80
100
% o
f Y
oung
YOUNG OLD The decline in isometric knee extensor force can be greater than the decline in quadriceps CSA
Young et al. (1985)
Specific Force Loss
?

No specific force loss in endurance trained elderly
D’Antona et al. (2007)

Decline in specific force appears to relate to decreased activity
D’Antona et al. (2007)

Why are older muscles smaller?
Parise & Yarasheski (2000)
Curr Opin Clin Nutr Metab Care,
85 yr
31 yr
Sarcopenia

McComas (1996)
motor unit / fibre number
Lexell et al. (1988)

Snijders et al. (2009) F
orc
e / P
ow
er
Velocity
MHC-IIA
MHC-I
Old age is associated with fast fibre atrophy
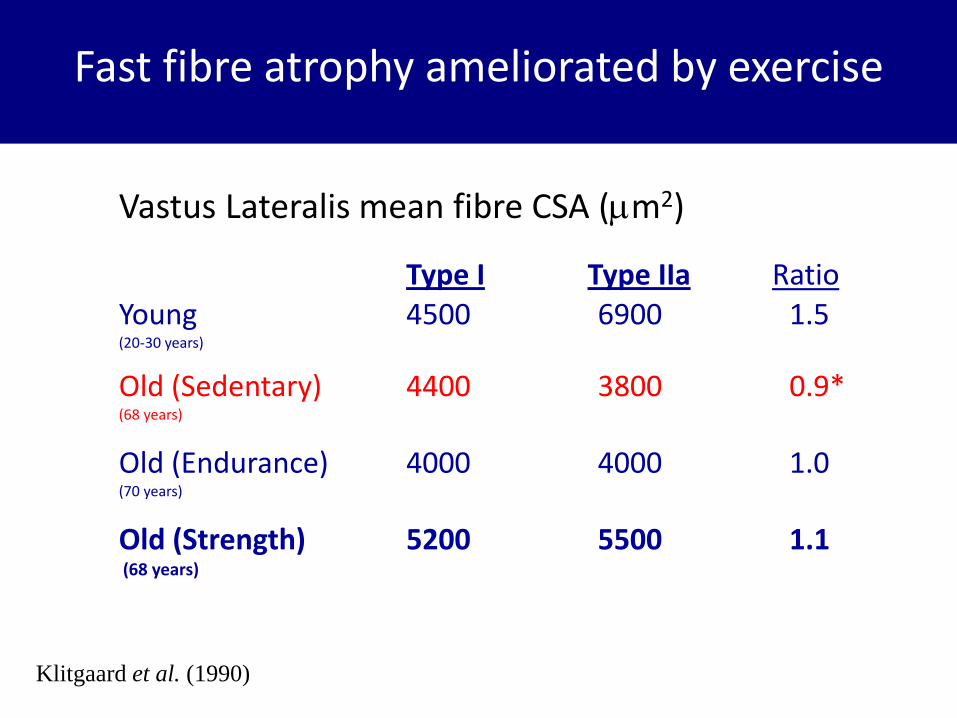
Fast fibre atrophy ameliorated by exercise
Vastus Lateralis mean fibre CSA (m2)
Type I Type IIa Ratio Young 4500 6900 1.5 (20-30 years)
Old (Sedentary) 4400 3800 0.9* (68 years)
Old (Endurance) 4000 4000 1.0 (70 years)
Old (Strength) 5200 5500 1.1 (68 years)
Klitgaard et al. (1990)

Master weightlifters
i) Absolute values
Age (Yrs)
0 40 50 60 70 80 90
We
igh
t lif
ted
(kg
)
0
40
60
80
100
120
140
160
180
□ Clean & Jerk
Snatch
55kg

Pearson et al. (2001)
Med Sci Sport. Ex.
Modified Nottingham Power Rig
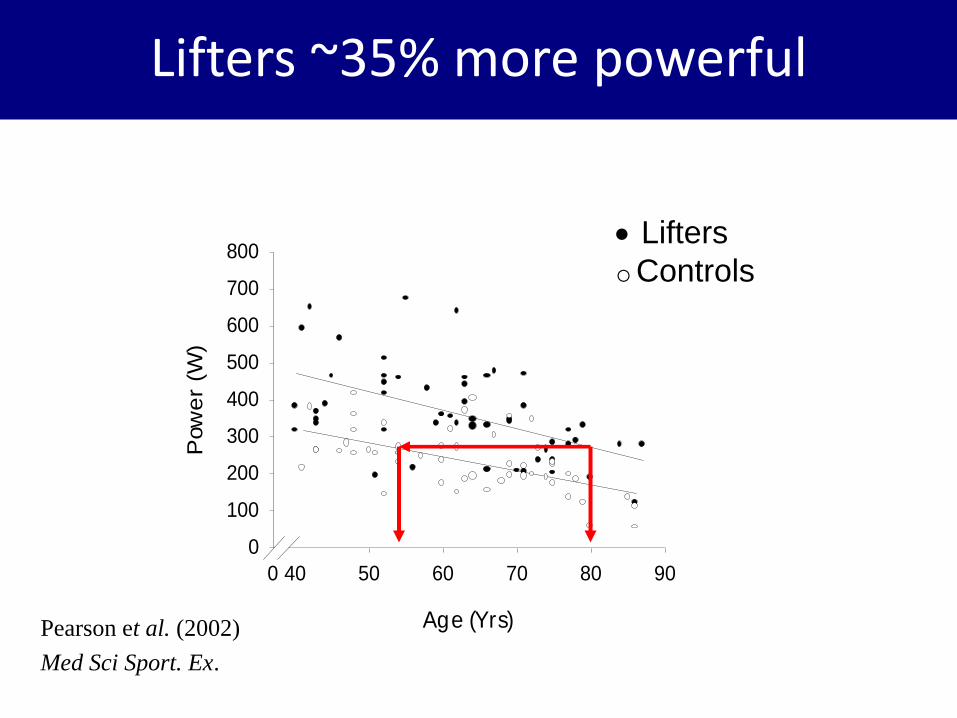
Average power
Age (Yrs)
0 40 50 60 70 80 90
Pow
er
(W)
0
100
200
300
400
500
600
700
800 Lifters
Controls
Pearson et al. (2002)
Med Sci Sport. Ex.
Lifters ~35% more powerful
Why are the mechanisms driving muscle loss?
Parise & Yarasheski (2000)
Curr Opin Clin Nutr Metab Care,
85 yr
31 yr
Sarcopenia

Candidates for Sarcopenia include…
• level of “anabolic” hormones
– (e.g. GH/IGF-I, Testosterone, etc)
• Metabolic changes
– ( reactive O2 species)
• Inflammation and cytokines (“inflamageing”)
– ( TNFα etc., degredation)
• Anabolic resistance to feeding and exercise
– ( protein synthesis)
• regeneration from exercise induced damage
– (compromised satellite cell behaviour)

Rennie et al. (2010)
Basal rate of protein synthesis unchanged in healthy elderly muscle

Cuthbertson et al. (2005)
FASEB
(g)
sensitivity of aged muscle to amino acids?

Cuthbertson et al. (2005)
FASEB
(g)
sensitivity of aged muscle to amino acids?

Post-prandial muscle protein synthetic response
Pennings et al. (2011)
Am. J. Clin. Nutr.

Kumar V et al. (2009) J Physiol. 2009
sensitivity of aged muscle to exercise?

Hasten et al. (2000)
Am J Physiol 278:E620-E626
Similar increases in muscle protein synthesis rates in young and old men and women 2 weeks (5 x per week)

Can we improve mass & function in older people?

4 males 85 - 92 years
7 females 85 - 97 years
12 weeks - 3 times per week
3 x 6 x 80% 1-RM
Harridge et al. (1999) Harridge et al. (1999)
Can we restore mass and function?

Pre Post0
20
40
60
80
*
*
Activation (
%)
Pre Post0
2
4
6
8
10
12
14
16
18
1-R
M (
kg)
Pre Post0
50
100
150
200
MV
C (
N)
Pre Post0
5
10
15
20
25
30
35C
SA
(cm
2)
Adaptations to strength
training in very elderly
people – similar to
young
Harridge et al. (1999)
Adaptation to 12 weeks strength training

25N
2s
Pre-training Post-training
92 year old male
Very old muscle can hypertrophy
Harridge et al. (1999)
Muscle & Nerve

Borst (2003) Age and Ageing

Candidates for Sarcopenia include…
• level of “anabolic” hormones
– (e.g. GH/IGF-I, Testosterone, etc)
• Metabolic changes
– ( reactive O2 species)
• Inflammation and cytokines (“inflamageing”)
– ( TNFα etc., degredation)
• Anabolic resistance to feeding and exercise
– ( protein synthesis)
• regeneration from exercise induced damage
– (compromised satellite cell behaviour)

Conboy et al. (2005)
Parabiotic mice – conjoined circulation

Satellite cell “niche” regulates satellite cell behaviour
Local milieu “bathing” satellite cell
Local environment influencing satellite cell includes: - Blood - Extra cellular matrix - Interstitial fluid - Adjacent myofibres

Comparable studies in humans??
?
Parabiotic pairing?
♥

In vitro model of muscle & systemic milieu

Satellite Cell
1. Obtain sample of muscle from
young and elderly people
Enzyme Digest
In vitro human muscle / circulatory system
2. Obtain serum from
young & elderly people
3. Culture cells
(myoblasts)

Cells stained with antibodies to desmin (muscle, green) and Ki-67 (proliferating cells, pink) and nuclei (blue).
Human myoblasts cultured in human serum
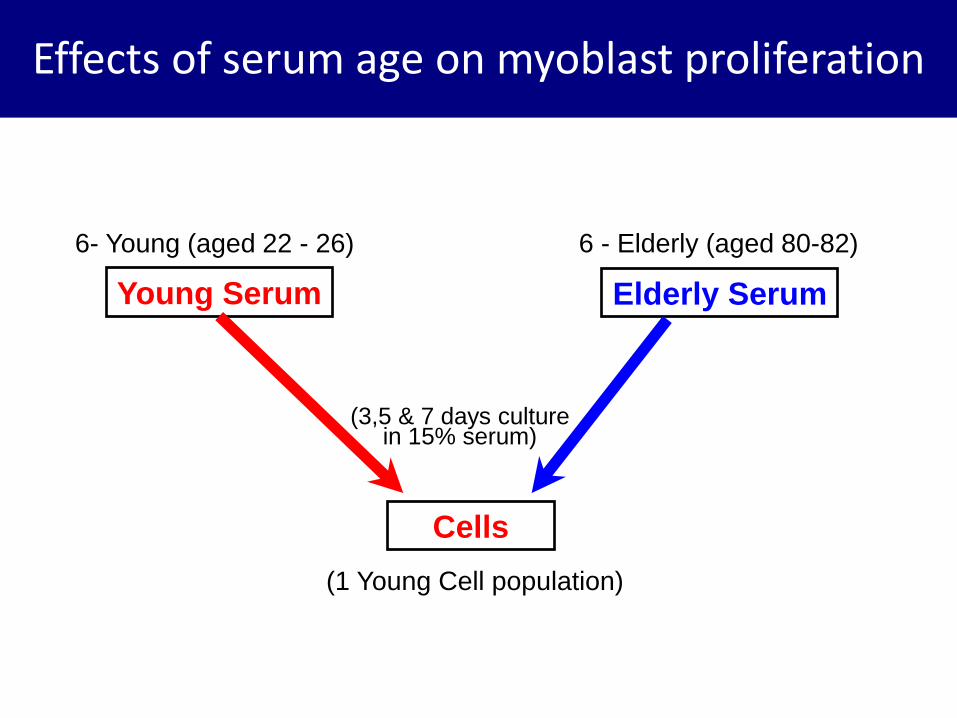
Cells
(1 Young Cell population)
6 - Elderly (aged 80-82)
Elderly Serum Young Serum
6- Young (aged 22 - 26)
15% Serum
Effects of serum age on myoblast proliferation
(3,5 & 7 days culture in 15% serum)

No effect of serum age on proliferation at D5
0
10
20
30
40
50
60
70
80
90
100
Elderly Serum Young Serum
% l
abell
ed c
ell
sDesmin Ki67 Desmin, Ki67
Mean ±SE
George et al. (2010)
Experimental Gerontology

0
20
40
60
80
100
Day 0 Day 1 Day 2 Day 3 Day 4 Day 5 Day 7% la
be
lle
d c
ell
s
MHCb)
GM
Myogenin
MHC
No effect of age of cell donor on differentiation
Old Young
% L
abe
lled
cel
ls
% L
abel
led
cel
ls
hoechst
MHC Mature
Myotubes
Alsharidah et al.
In preparation

• Muscle mass, strength and power decline with increasing age. This is associated with decreased physical function and an increased risk of falls
• The rate at which loss occurs due to “ageing” is difficult to identify due to:
– Inappropriate cohorts which confound interpretation of biological ageing
– Reliance on cross-sectional studies
• Muscle is sensitive to disuse, but there is an inherent ageing effect, as those who maintain high levels of physical training show a declines in function
• Anatomically muscle loss appears to be due to a loss of muscle fibres (motor units) & the atrophy of type II fibres
Summary

• Older peoples muscles may exhibit “anabolic resistance” to feeding and exercise
• Human muscles satellite cells show no age related impairment in behaviour
• High resistance training is the most effective means for improving muscle mass and function in older people
Summary

Muscle
Str
ength
Age
Threshold for
independence
Training
Move to a new
“slope”, but with
similar rate of
decline?
Years of
“functional” gain
Harridge & Saltin (2007)
Encyclopaedia of Gerontology
Strength training: the elixir of muscle youth?

Acknowledgements
Norman Lazarus Cristiana Velloso Tomasz George
Mansour Alsharidah Chibeza Agley
Steve Pearson Mahjabeen Hameed
Matt Cobbold Richard Orrell
Roger Woledge Archie Young
Bengt Saltin Ann Kryger
Michael Kjaer Jesper Andersen Peter Schjerling


Ageing and the gut John McLaughlin
Manchester University/
Hope Hospital, Salford UK
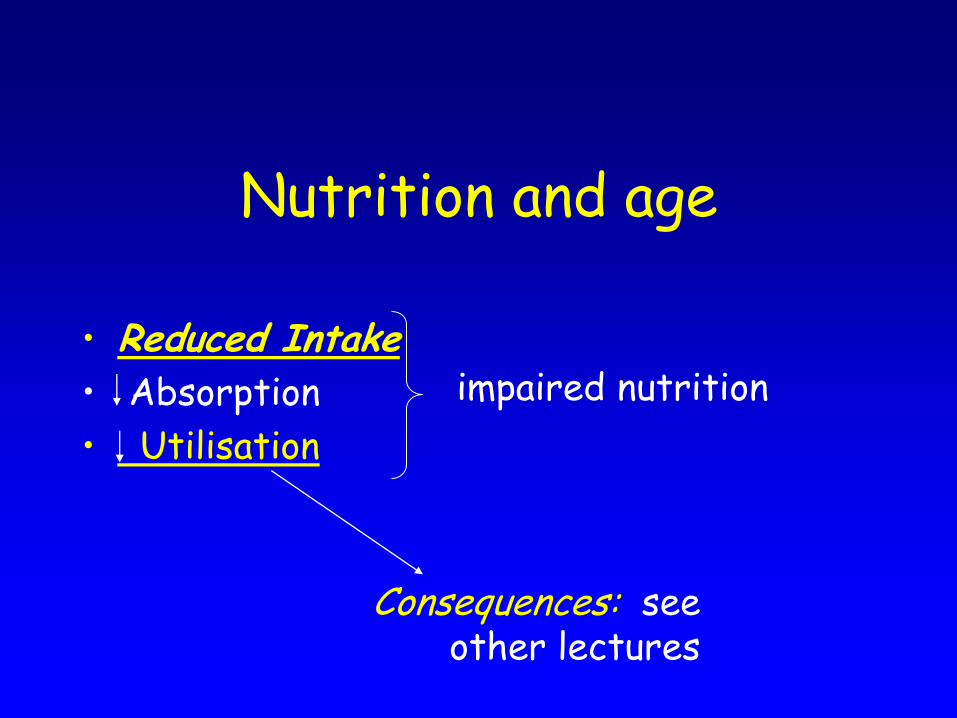
Nutrition and age
• Reduced Intake
• Absorption
• Utilisation
impaired nutrition
Consequences: see other lectures

Nutrition and age
• Reduced Intake
• Absorption
• Utilisation
impaired nutrition
WHAT DO WE KNOW?

REALLY, most problems arise before anything needs absorption in the gut…
• Poverty, poor
mobility, isolation, cognitive loss…
• Dry mouth – drugs
• Dentition and dentures
• Weak mastication
• Sore mouth
• Anorexia/nausea
• Dysphagia – Oropharyngeal
• Neurological?
– Oesophageal • Motility
• Stricture
• Cancer
• Candida
• Reflux
Gut function broadly preserved with healthy
ageing
• Limited impact on nutrition if feeding is maintained
• GI diseases prevalent in the elderly


Animals are designed for survival
• Maximal absorption of nutrients is essential – Biological and evolutionary pressure is of
food scarcity
– And not cooked/processed/biologically safe
– So human gut is highly over-efficient • Age is not a major limitation in health
…Gut epithelium self-replaces every 4-7 days so no ‘wear and tear’ ageing
Not so for muscle/nerve/immune cells

Gut has 2 conflicting roles
• Digestion and absorption: get food and water in
» Versus
• Barrier function: keep microbes and toxins out
Do these change with age?

Ageing and the stomach 1
• Hypochlorhydria: reduced acid – Atrophic gastritis/surgery – H.pylori principally responsible,
not age (high % prevalence is a cohort effect
of Hp acquired in childhood) – PPI/H2RAs Predispose to bacterial overgrowth
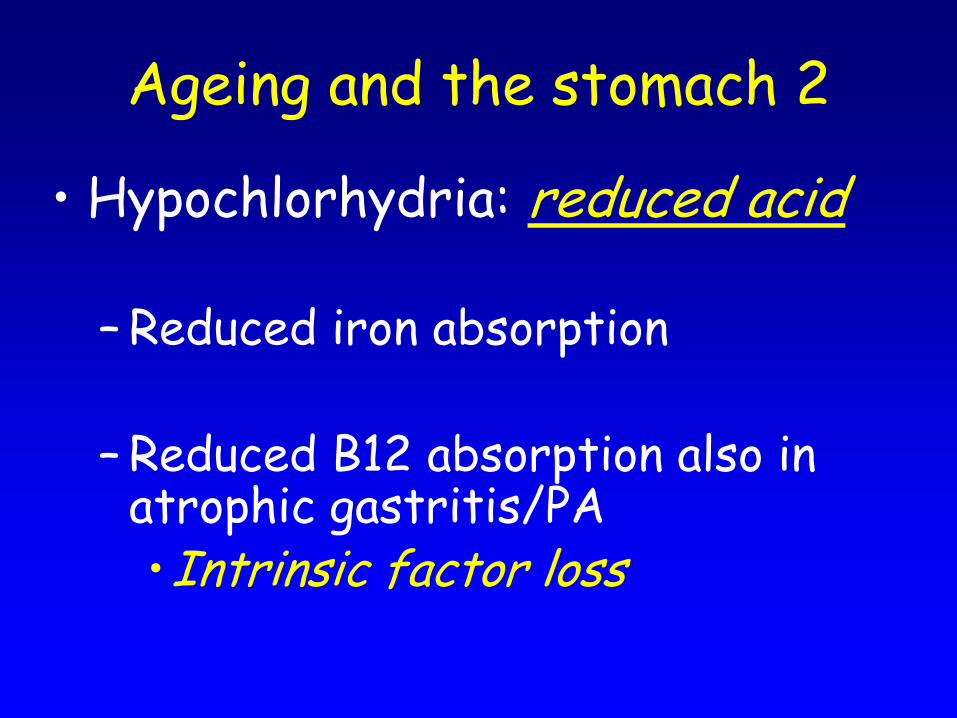
Ageing and the stomach 2
• Hypochlorhydria: reduced acid
– Reduced iron absorption
– Reduced B12 absorption also in atrophic gastritis/PA •Intrinsic factor loss

X X X Epithelium
Gastric acid secretion Stretch/ Amino acids
G-cell ECL
H+
parietal
Gastrin Histamine
+ +
+
H+ (pH < 3.5)
+
D-cell
Somatostatin
-
Lumen
+
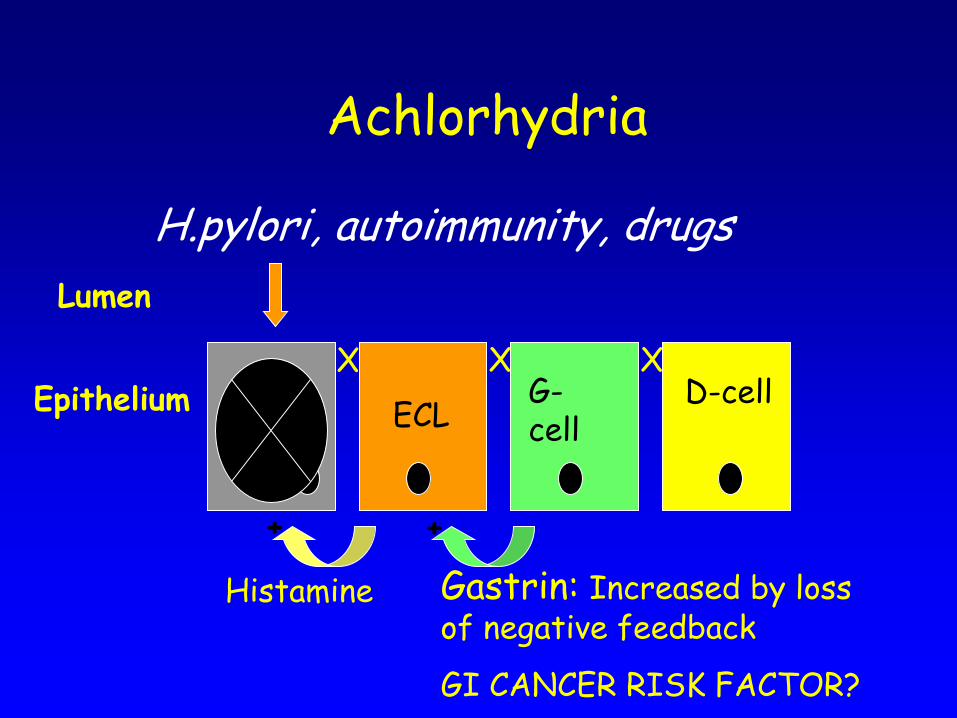
X X X Epithelium
Achlorhydria
G-cell ECL
Gastrin: Increased by loss of negative feedback
GI CANCER RISK FACTOR?
Histamine
+ +
D-cell
Lumen
H.pylori, autoimmunity, drugs

Gastric emptying • Increasingly slow with age
– eg increased CCK responses with age
• May potentiate sensation of satiety post-prandially – Persistent gastric distension: full for longer
– Slower delivery of nutrients prolonging intestinal satiety signals
– ?Sentisised sensory nerve endings in inflammation
– ? Altered neuropeptide signalling
• Nitrite etc formation enhances UGI cancer risk?


Motility and age • Gastric emptying slows
– Drug delivery consequences
• Small bowel motility: largely preserved unless intercurrent disease – Diabetes, Drugs, Hypothyroidism…
• Colonic transit tends to slow – water absorption, constipation…
consequent symptoms
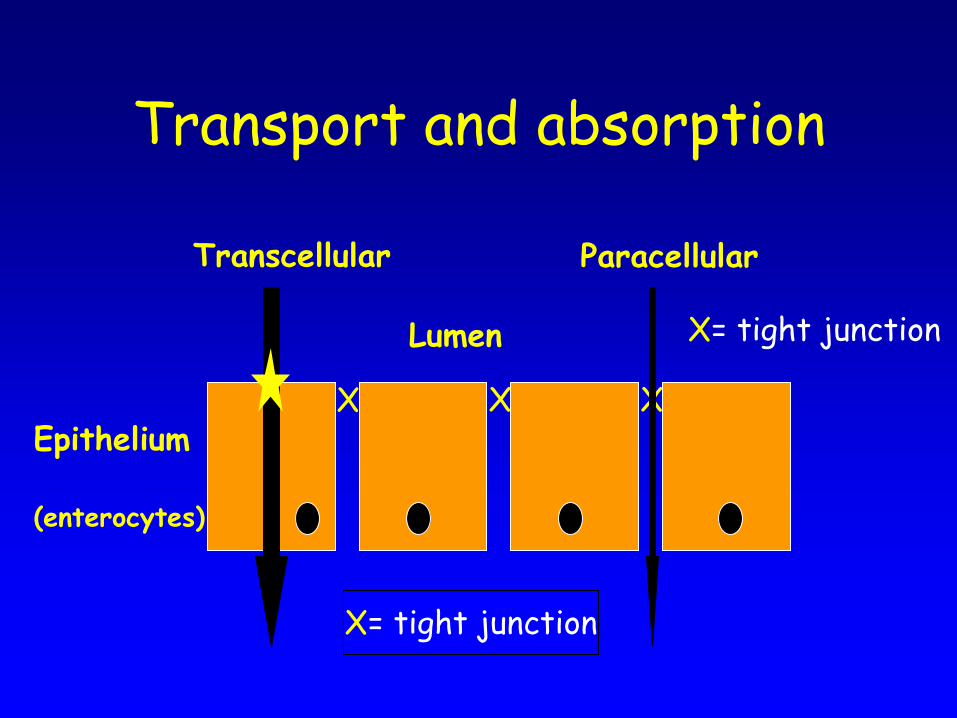
X X X Epithelium
(enterocytes)
Transport and absorption
X= tight junction
X= tight junction
Lumen
Transcellular Paracellular

Ageing has little impact on small bowel nutrient transport
• Villus/crypt architecture preserved • Reduced transporter molecules/mg
bowel • But little evidence for absorptive organs
‘simply’ failing with age: – Small intestine has reserve capacity++ – Absorption time probably prolonged – eg 72 hour faecal fat excretion not affected
by age
And if fat can be absorbed, anything can…

Small bowel is lined by highly adapted cells
• Differentiation from crypt stem cells – Absorptive enterocytes (~90%)
• Transporters +++
• TRANSPORT DEFECTS UNLIKELY TO CONTRIBUTE TO SARCOPAENIA
• Calcium/zinc absorption maybe age limited
– Secretory cells also (~10%) • Endocrine (as previous talk)
• Goblet cells (mucus: reduced in age)
• Paneth cells (defence: age effects unclear)

Gut diseases cause malabsorption in the elderly
– Enterocyte loss or damage •Bacterial overgrowth
–Jejunal diverticulosis
•Flat mucosa of any cause: –villous atrophy inc coeliac
•Ischaemia • Crohn’s •Drugs

Gut diseases cause malabsorption in the elderly
– Pancreatic/biliary insufficiency:
fat and fat soluble vitamins – Fistulas and short bowel:
increasingly common in the elderly as access to safe surgery / anaesthesia have become less age restricted

Ageing and the gut
• Adaptation after injury is impaired – Surgery
– Infection/inflammation
– Radiotherapy
• Adaptation normally driven by
– Growth factors (EGF, KGF, trefoil peptides)
– GLP-2 via enteric neuronal plexuses • Targets?

Normal epithelium depends on immune/bacterial
interactions
• Gnotobiotic (germ free) animals
– Mice – Zebra fish
• T cell receptor a knockout mice: reduced
endocrine cell numbers
Reduced crypt proliferation, abnormal enterocytes

Human beings as ‘metaorganisms’
‘….derived from millennia of co-evolution with their own indigenous intestinal microbiota. In the light of the metaorganism hypothesis a more holistic view of the process of human ageing has been suggested where the ageing of the microbial counterpart is regarded as important’. Biagi 2010
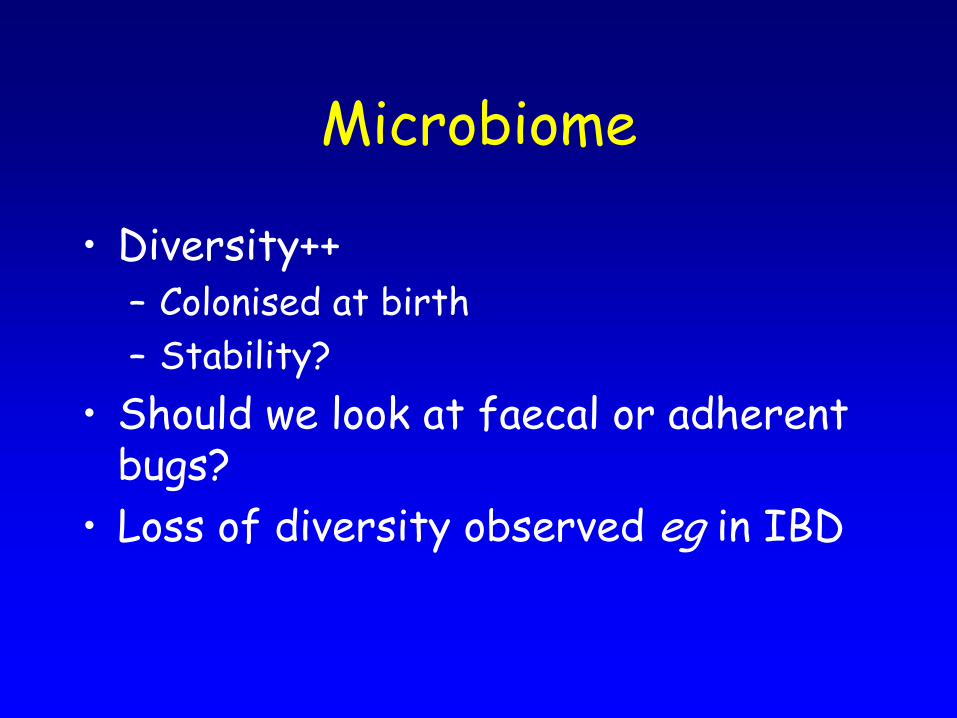
Microbiome
• Diversity++ – Colonised at birth
– Stability?
• Should we look at faecal or adherent bugs?
• Loss of diversity observed eg in IBD

Microbiome: ageing effects?
– Limited and conflicting data
– No global or consistent change
– Increased pathobiont numbers • eg Staphylococci, Enterococci
– Reduced numbers/diversity of Bifidobacteria sp • ‘Health promoting’
– Magnified by antibiotic use • C. difficile
– Prebiotics/probiotics?
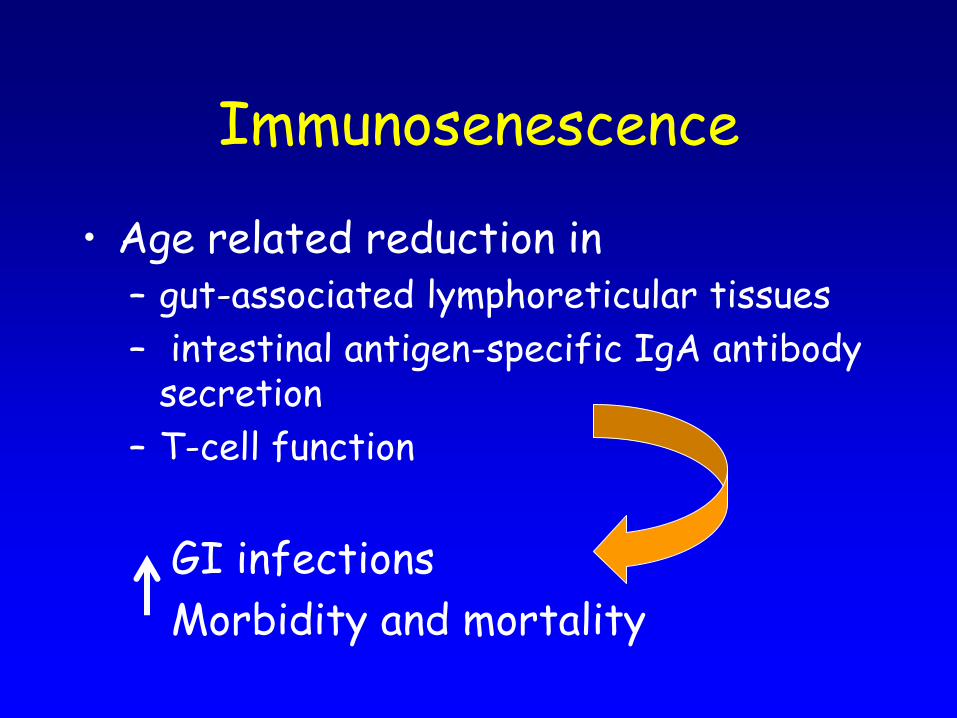
Immunosenescence
• Age related reduction in – gut-associated lymphoreticular tissues
– intestinal antigen-specific IgA antibody secretion
– T-cell function
GI infections
Morbidity and mortality

Immune system tolerates gut bacteria
• Normal proximal GI tract is not sterile – Stomach: 104 cfu/g – Small bowel: jejunum 105-7 cfu/g; ileum 107-108
– Colon:1010-1011
• Small bowel overgrowth: – Defective mucosal immunity – Hypo/achlorhydria – Diverticulosis – Fistulae, strictures – Stasis: hypomotility
cfu: colony forming units

Is B.O.G. important?
• 490 elderly inpatients • 11% malnourished …of whom 44% had occult malabsorption …of whom 71% had B.O.G. • Antibiotics lead to weight gain, rise in Hb,
rise in protein/Ca++
• But also find B.O.G. in healthy old people with no malabsorption

What is the mechanism of malabsorption in B.O.G.?
• Enterocyte damage – Fused microvilli – Endoplasmic reticulum abnormalities – Reduced glucose uptake in isolated brush
border vesicles
• Brush border enzyme loss • Bile salt deconjugation • Inflammation: IL6

X X X Epithelium
(enterocytes)
Transport and absorption
X= tight junction
X= tight junction
Lumen
Transcellular Paracellular
X X X Epithelium
(enterocytes)
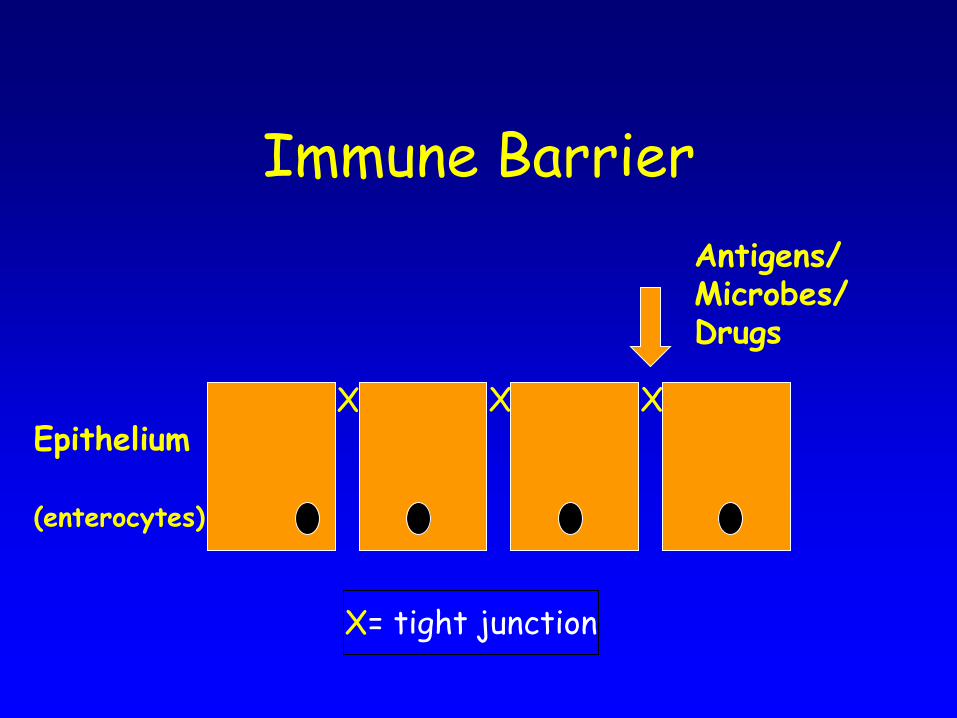
Immune Barrier
X= tight junction
Antigens/ Microbes/ Drugs

X X Epithelium
(enterocytes)
Paracellular pathway is leaky in inflammation/malnutrition
X= tight junction
Lumen
Transcellular Paracellular
Antigens

‘Inflamm-aging’
May drive age related pathology eg sarcopenia,
neurodegeneration?
Gut microbiome/immunity/ leakiness could be key
factors

Concluding speculation
– Neuroendocrine changes • reduced appetite
– Microbiome modifcation or bacterial overgrowth
– Reduced barrier function
All contribute to systemic inflammatory/
metabolomic responses?

Thank you


An investigation the relationship between
nutritional risk of elderly patients with dementia and
behavioural problems at mealtimes for patients with
dementia.
M.Mc.Keon1,2, S.Faherty2, C.Glennon1, G. Flanagan- Rughoobur1, M.ORegan3 and M.McDonnell-Naughton2 1Community Nutrition & Dietetics Service, Health Service Executive Dublin Mid-Leinster, Republic of Ireland, 2 Department of Nursing and Health Science, Athlone Institute of Technology, Republic of Ireland, 3Department of Statistics, Trinity College Dublin, Republic of Ireland.
114

Background
Currently there are almost 44,000 people in
Ireland with dementia.
It is estimated this number will double and in
thirty years it will treble making dementia is
one of the most important health issues of
our time. (Alzheimer's society of Ireland 2011)
115

Background
People with dementia may suffer from anorexia, under nutrition and involuntary weight loss (Aselage MB & Amella EJ 2010).
Studies indicate that unintentional weight loss may increase mortality and reduce resistance to infections
(Barker L, Gout BS &Crowe TC, 2011).
116

Background
Feeding difficulties have been identified as one of the main factors that contribute to weight loss and poor nutritional status in people with dementia
(Dunne A. 2010)
117
Background
Previous research has looked into the behaviours that patients exhibit when eating but it is not known how these behaviours are related to nutritional status.
118

Aim of study
This study aims to examine the frequency of feeding difficulties seen among older people with dementia in a primary care setting in the Republic of Ireland.
119

Aim of study
It also investigates if these difficulties are related to the nutritional status
120

Methodology
121

Assessment of nutritional risk
MUST MNA
122
Methodology
The Edinburg Feeding and
evaluation questionnaire (ED-
FED-Q) was used to categorise
and measure behavioural
problems at mealtimes. (Watson & Keller, 2006)
123
Results
Eight seven percent (87/100) of
patients who met the study criteria
(i.e. greater than 65 years old with a
diagnosis of dementia) were deemed
eligible and consented to take part in
the study.
124

Results
Table 1: Results of the ED-FED Questionnaire (5)
ED-FED Questionnaires Results**
Never
n %
Sometimes
n %
Often
n %
Does the patient require close supervision while eating?
Does the patient require physical help while feeding?
Is there any spillage while feeding?
Does the patient leave food on the plate?
Does the patient ever refuse to eat?
Turn head away while being fed?
Refuse to open mouth?
Spit out food?
Leave mouth open (leaving food to drop out)?
Refuse to swallow?
4 5
6 7
9 10
33 38
36 41
37 43
41 47
47 54
45 52
53 61
41 47
39 45
45 52
23 27
28 32
27 31
31 36
22 25
27 31
25 28
42 48
42 48
33 38
31 36
23 27
23 26
15 17
18 21
15 17
9 10
*Note percentages are rounded off to the nearest whole number
**An ED-FED score of 10 or more indicates a high level of behavioural problems.
125

Results
The Ed FED-Q was found to be
significantly correlated with both the
‘MUST’ and the ‘MNA’ categories of
nutritional risk (P<0.01).
126

Results
80 % (28/35) of participants who were categorised at high risk of malnutrition according to the ‘MUST’ had an Ed-FED score of >10.
There is a negative linear relationship between the ‘MNA’ and the Ed-FED (r=-.706, P<0.01).
127

Conclusions
There is an important relationship
between feeding difficulties and risk of
malnutrition among elderly people with
dementia.
128

Conclusions
Malnutrition has negative effects to the individual in terms of clinical outcome and quality of life.
The negative clinical outcome in turn increase health service utilisation costs significantly.
129

Conclusions
It is therefore imperative that behavioural problems at mealtimes that are related to malnutrition be closely scrutinized, and considered.
Especially when planning nutritional intervention, training and policy.
130

Acknowledgements
Dr. Mary Mc Donnell- Naughton
Dr. Shelia Faherty
Dr. Myra O Regan
Ms. Corina Glennon
MS. Grainne Flanagan Rughoobur
131


