19
Elizabeth Coler University of California Santa Cruz
| Date post: | 21-Jan-2018 |
| Category: |
Documents |
| Upload: | elizabeth-coler |
| View: | 43 times |
| Download: | 4 times |
Elizabeth Coler
University of California Santa Cruz
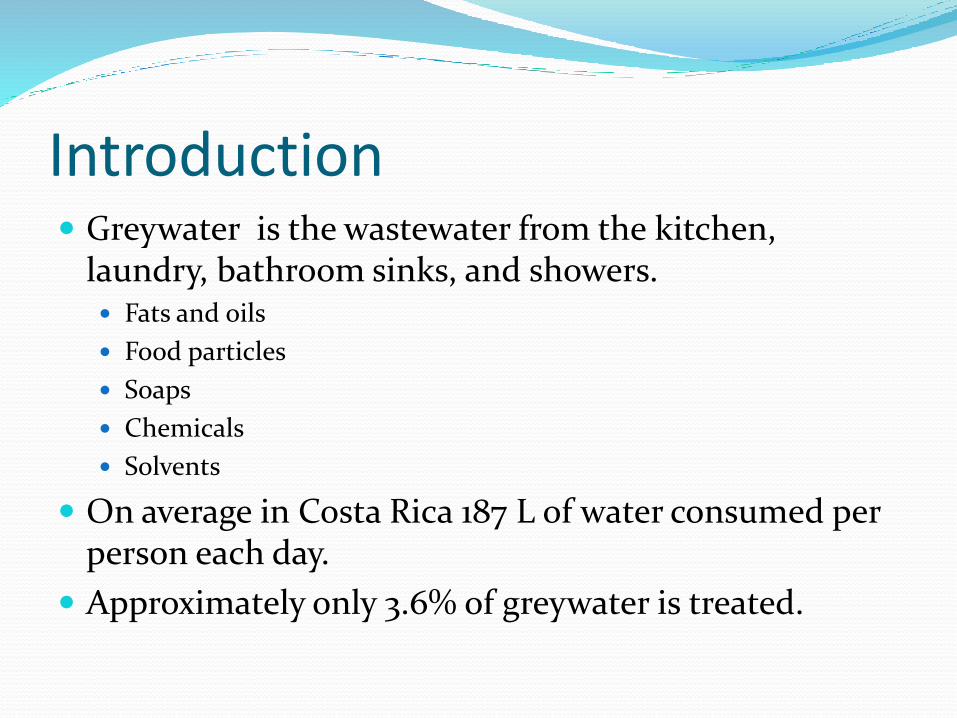
Introduction Greywater is the wastewater from the kitchen,
laundry, bathroom sinks, and showers. Fats and oils
Food particles
Soaps
Chemicals
Solvents
On average in Costa Rica 187 L of water consumed per person each day.
Approximately only 3.6% of greywater is treated.
Questions
How does the quality of greywater compare before and after treatment?
How do the results of this treatment differ between the diverse systems at various locations?
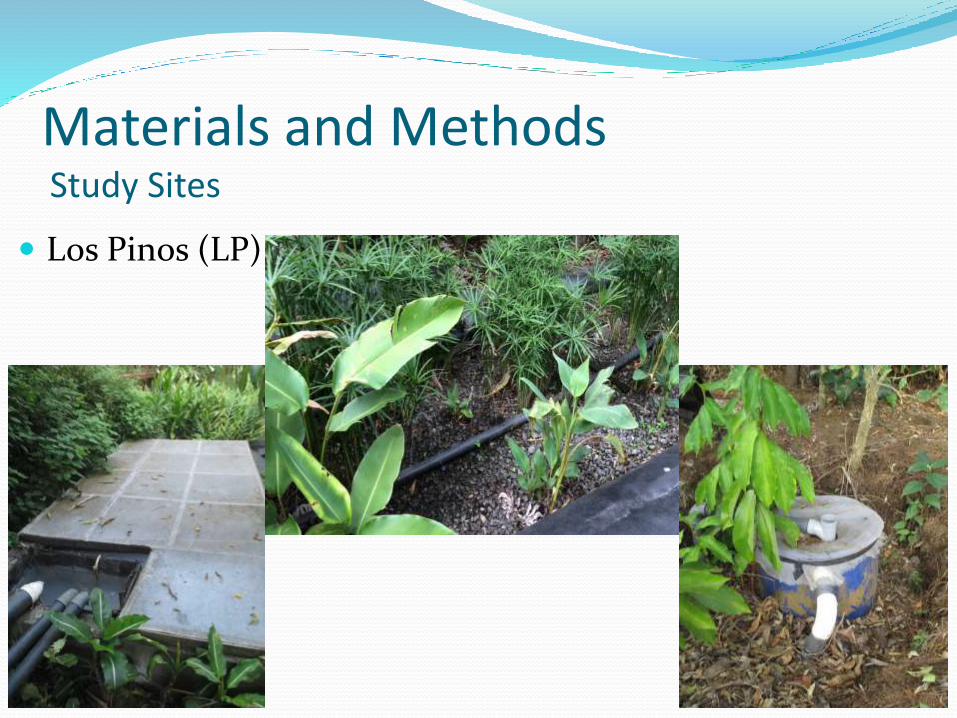
Materials and Methods Study Sites
Los Pinos (LP)
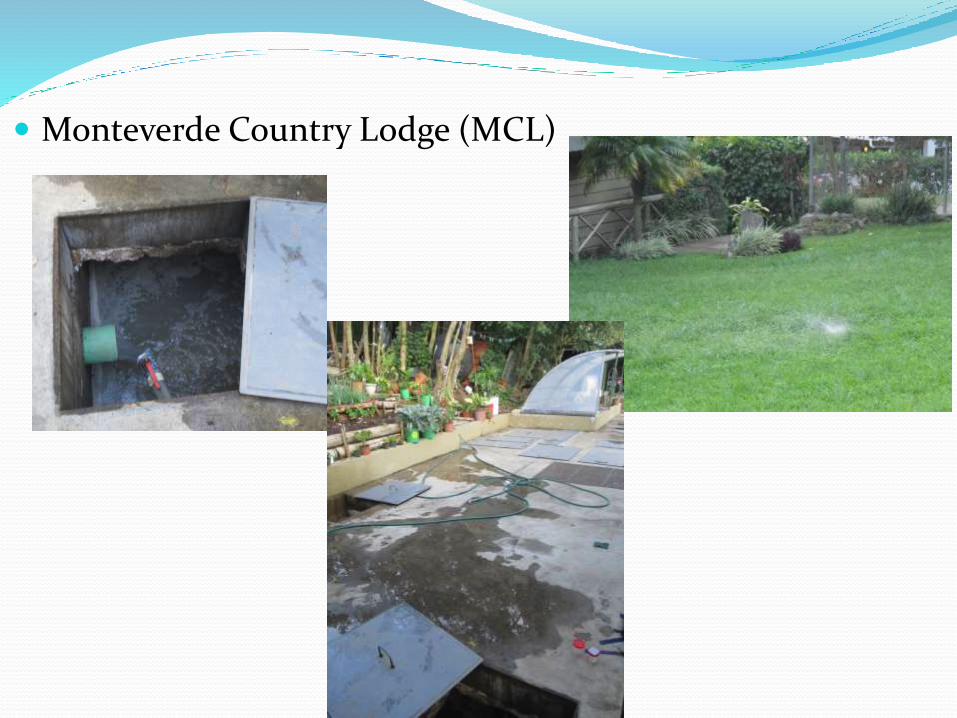
Monteverde Country Lodge (MCL)
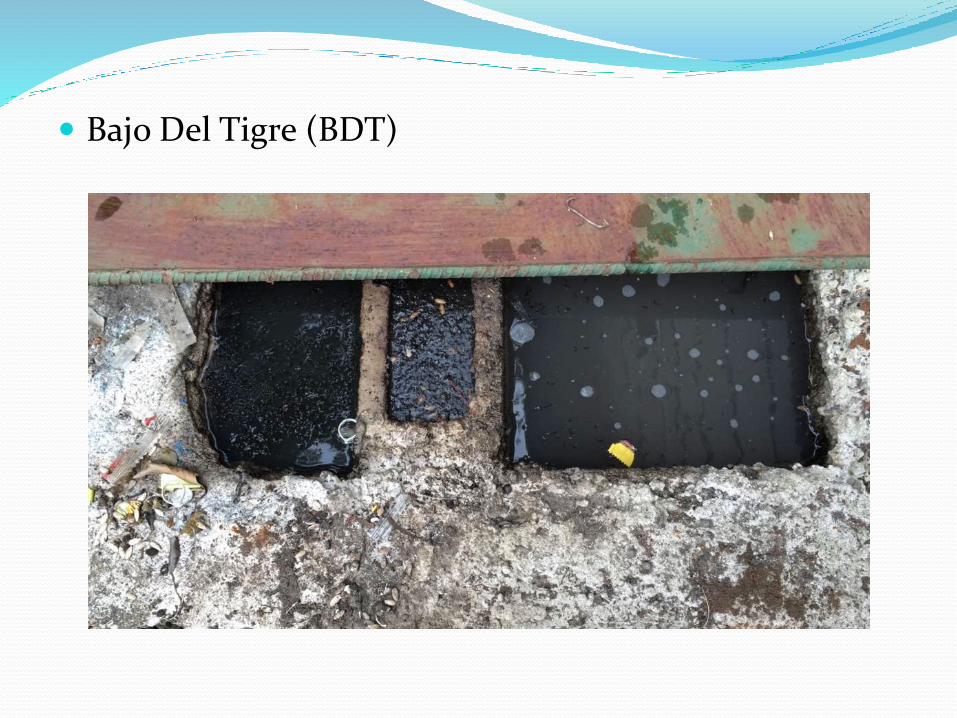
Bajo Del Tigre (BDT)
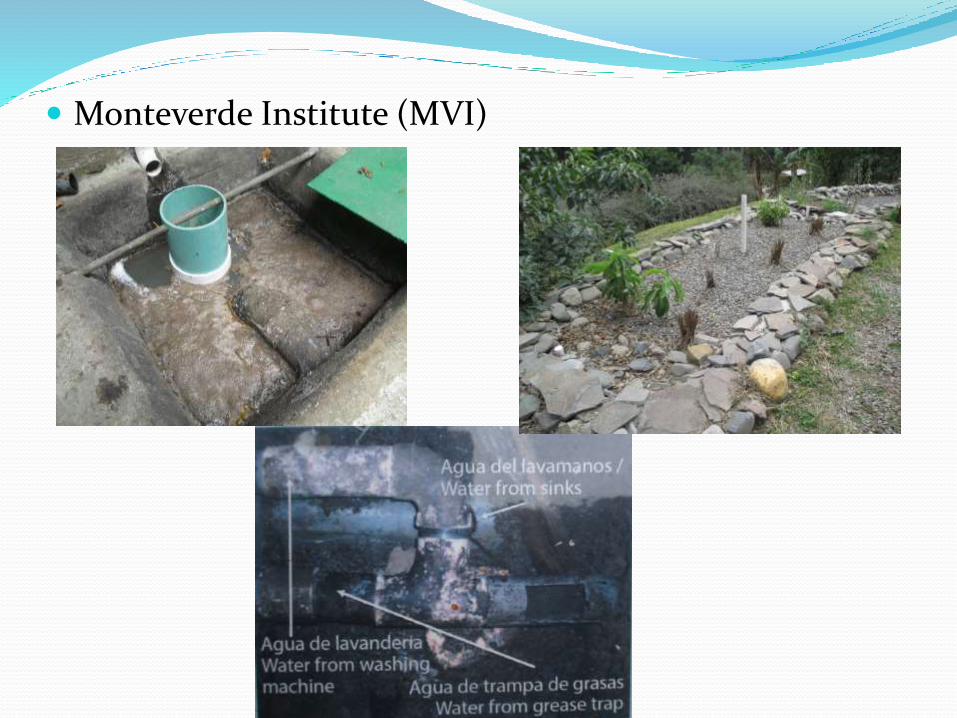
Monteverde Institute (MVI)
Data Collection and Analysis
Samples collected once a day at each site, before and after treatment
Tests conducted in lab YSI- pH
Specific ConductivityConductivityTotal Dissolved SolidSalinityTemperatureDissolved Oxygen
Test Kit- Nitrate Nitrogen
Statistical analysis Paired T-tests for before and after Kruskal Wallis to compare after samples
Results
0
1
2
3
4
5
6
7
8
9
LP MCL BDT MVI
Ave
rag
e p
HBefore Treatment
After Treatmenta a
b
c
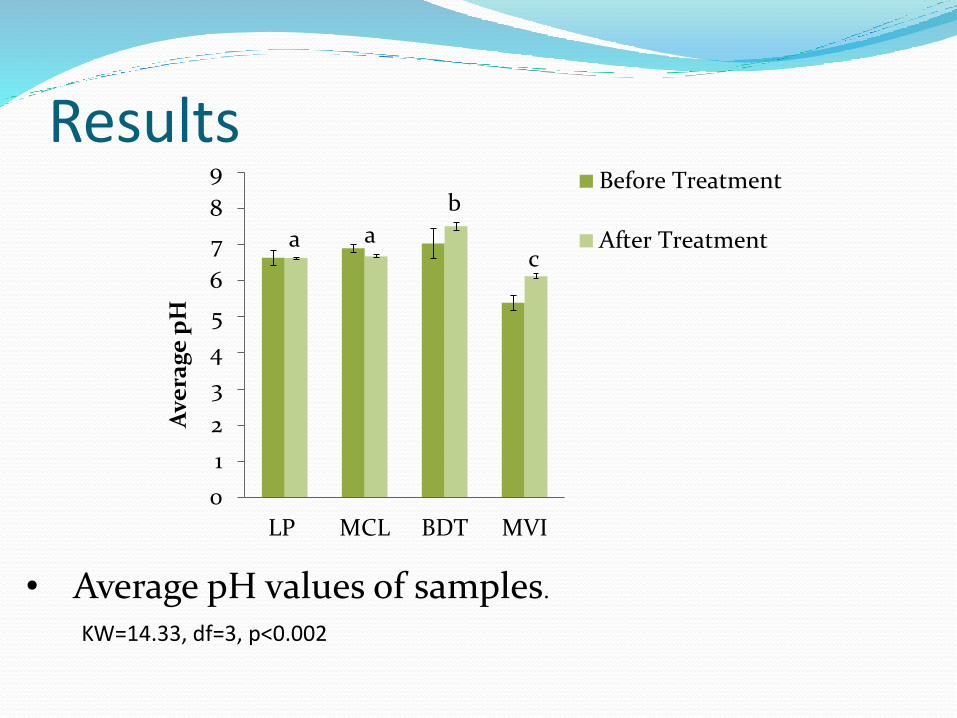
• Average pH values of samples.
KW=14.33, df=3, p<0.002
Discussion Most pH values within
expected range: 6.5-8.4 (Morel and Diener 2006)
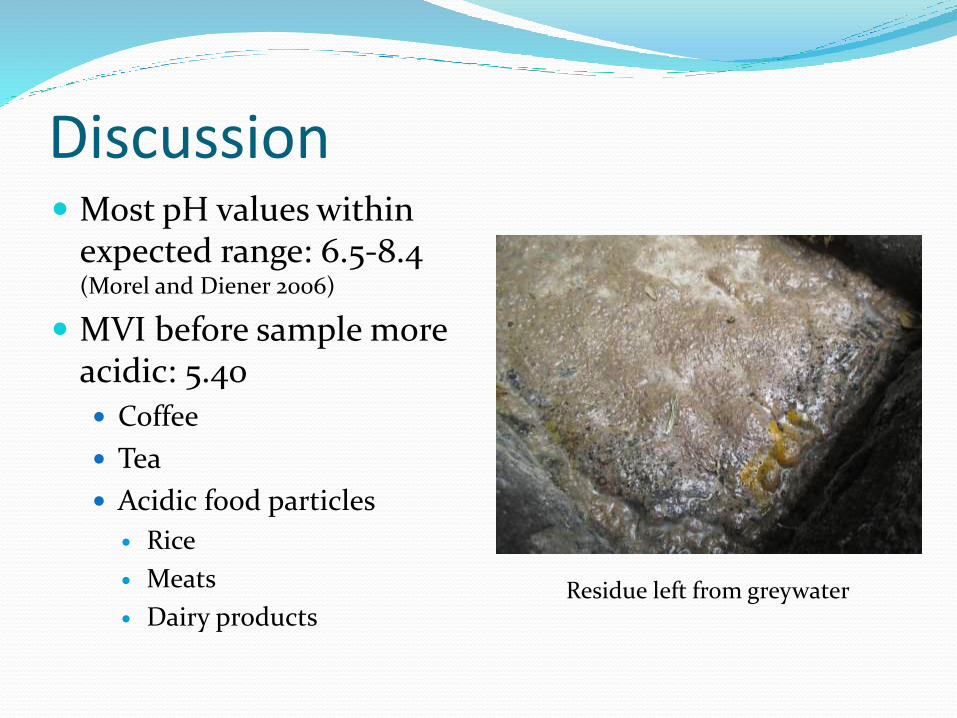
MVI before sample more acidic: 5.40
Coffee
Tea
Acidic food particles
Rice
Meats
Dairy productsResidue left from greywater
0
0.2
0.4
0.6
0.8
LP MCL BDT MVI
S.
Co
nd
uct
ivit
y (m
S/c
m^
c)
aa
a
b
0
0.2
0.4
0.6
0.8
LP MCL BDT MVI
Co
nd
uct
ivit
y (m
S/c
m)
aa
a
b
0
0.1
0.2
0.3
0.4
0.5
LP MCL BDT MVI
To
tal
Dis
solv
ed
S
oli
ds
(g/L
)
aa
a
0
0.1
0.2
0.3
0.4
LP MCL BDT MVI
Sa
lin
ity
(pp
t)
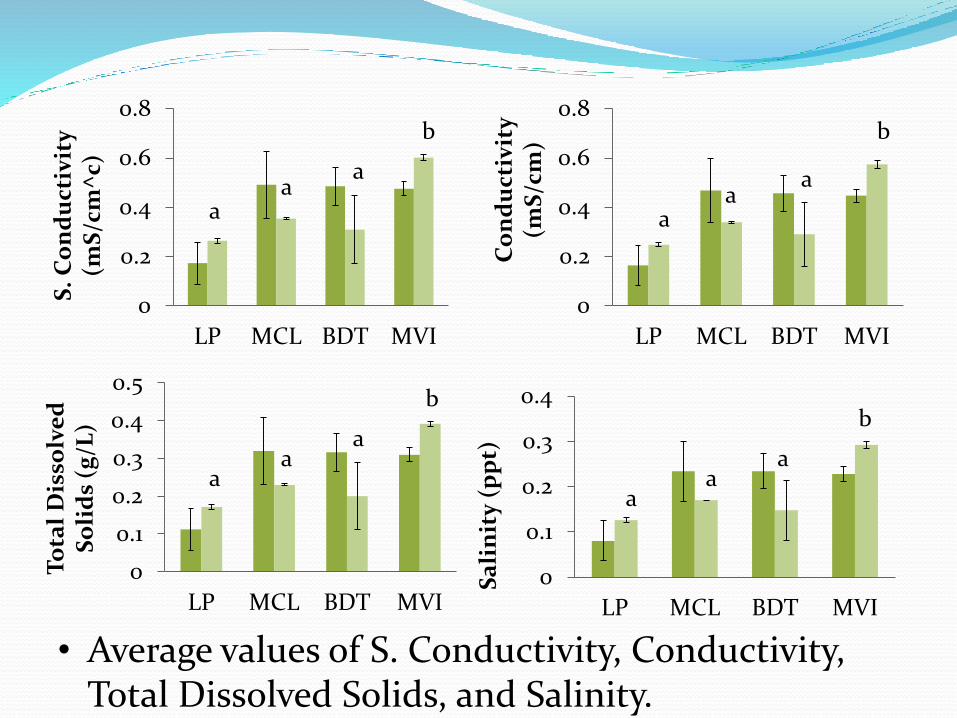
• Average values of S. Conductivity, Conductivity, Total Dissolved Solids, and Salinity.
b
aa
a
b
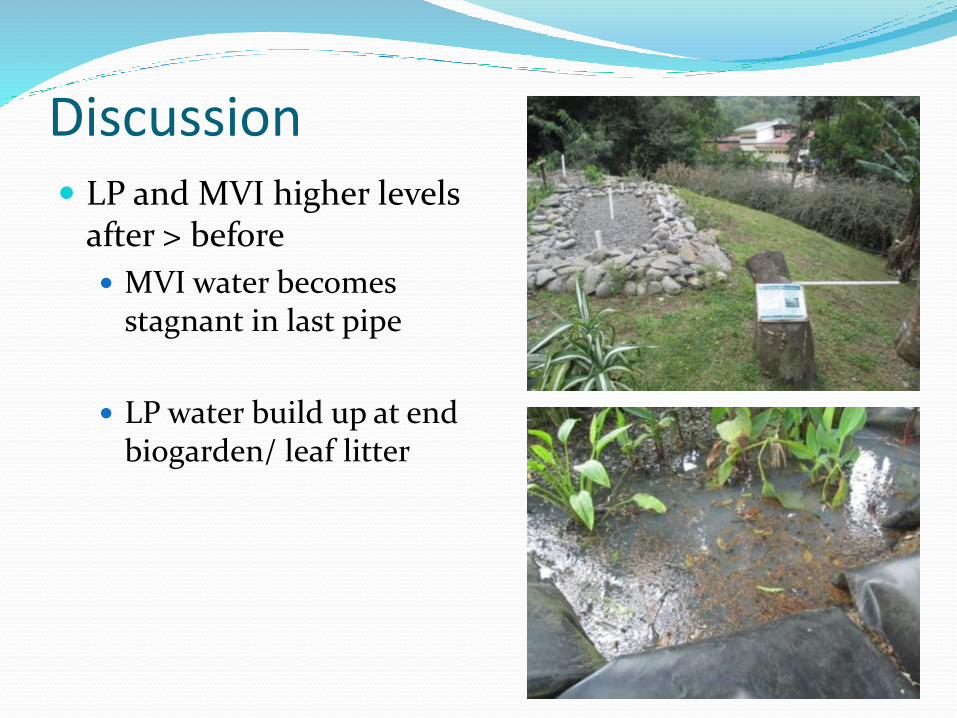
Discussion LP and MVI higher levels
after > before
MVI water becomes stagnant in last pipe
LP water build up at end biogarden/ leaf litter
19.5
20
20.5
21
21.5
22
22.5
23
23.5
LP MCL BDT MVI
Te
mp
era
ture
(*C
) a
b
c
a
0
2
4
6
8
10
12
LP MCL BDT MVID
isso
lve
d O
xyg
en
(m
g/L
)
aa
b
a
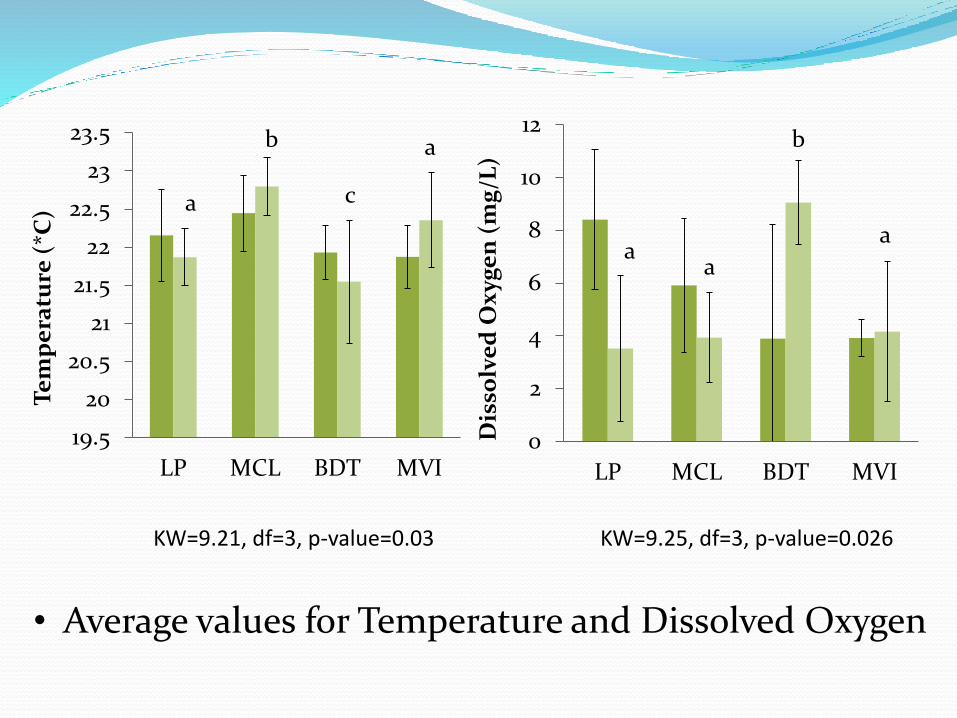
• Average values for Temperature and Dissolved Oxygen
KW=9.21, df=3, p-value=0.03 KW=9.25, df=3, p-value=0.026
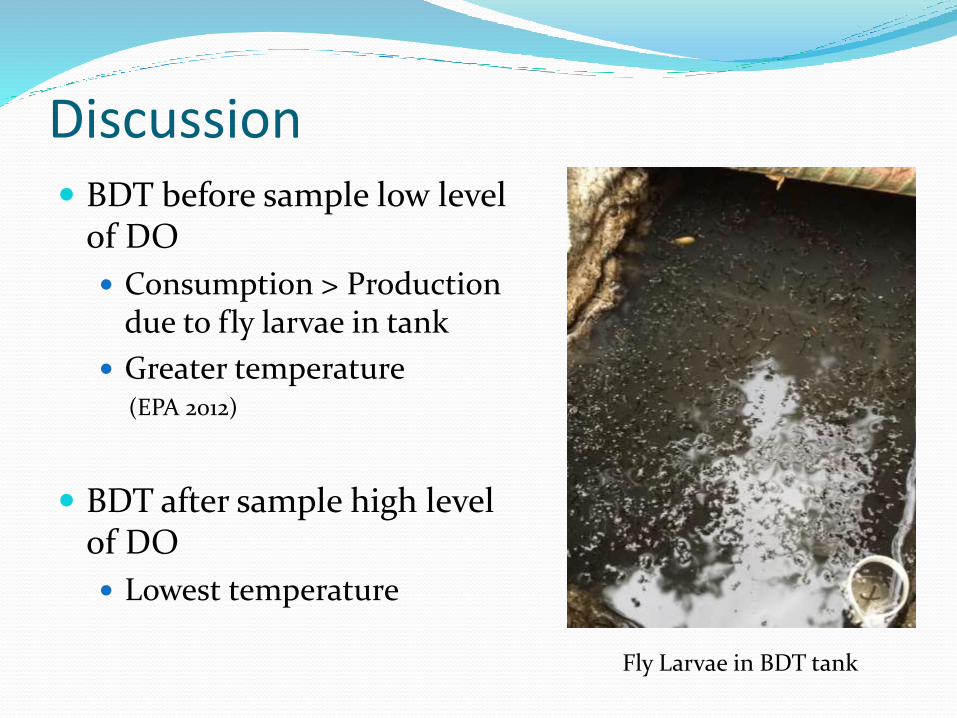
Discussion BDT before sample low level
of DO
Consumption > Production due to fly larvae in tank
Greater temperature (EPA 2012)
BDT after sample high level of DO
Lowest temperature
Fly Larvae in BDT tank
0
0.2
0.4
0.6
0.8
1
1.2
LP MCl BDT MVI
Nit
rate
Nit
rog
en
(m
g/L
)
a
b
a
a
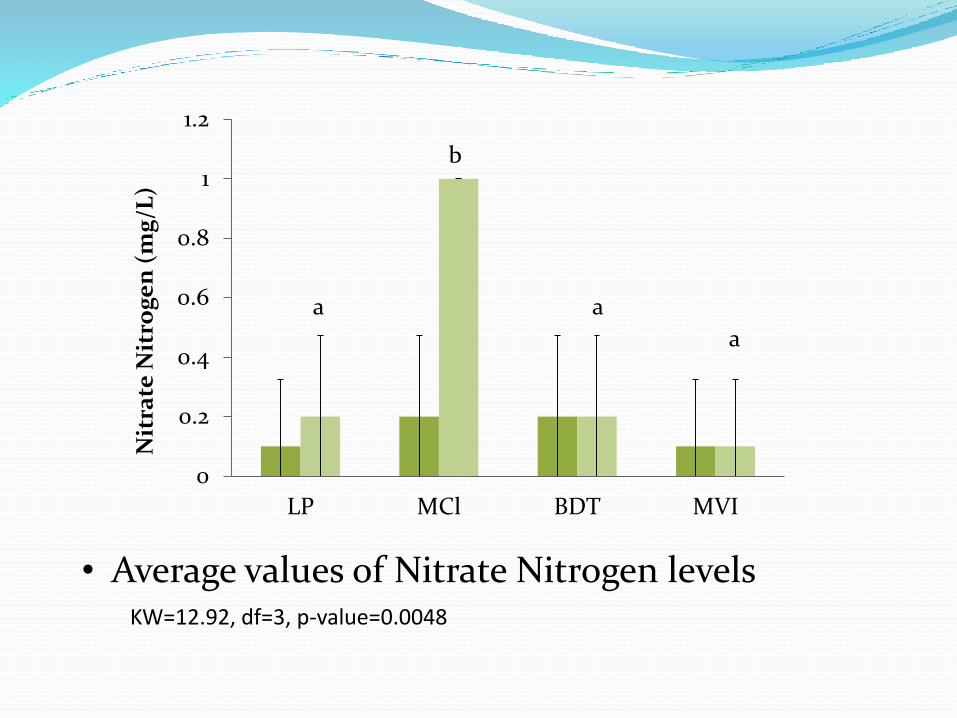
• Average values of Nitrate Nitrogen levelsKW=12.92, df=3, p-value=0.0048
Discussion
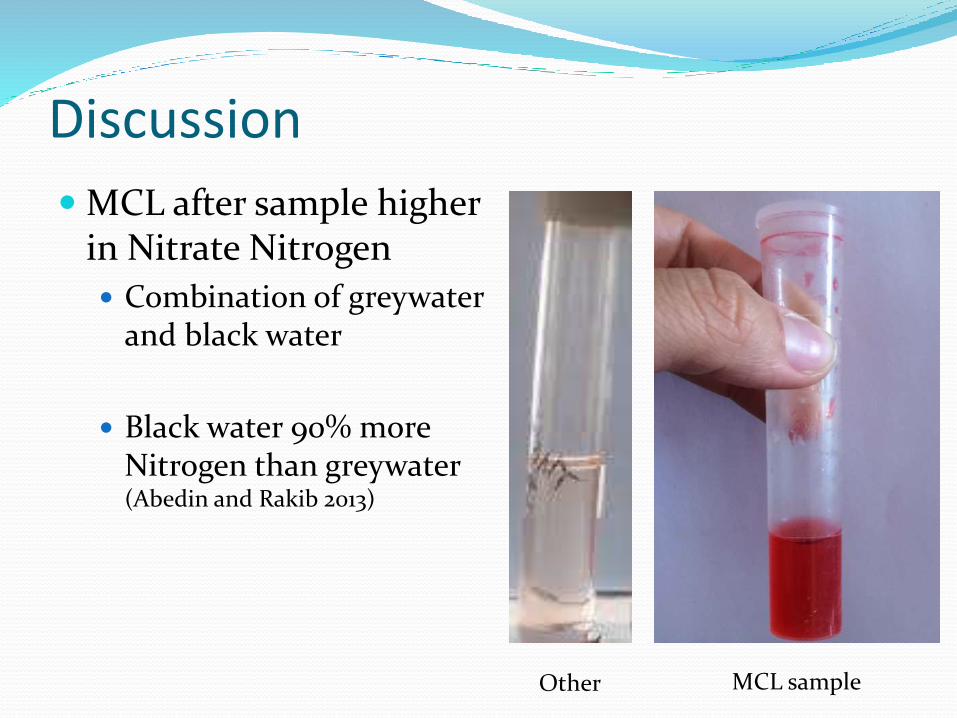
MCL after sample higher in Nitrate Nitrogen
Combination of greywater and black water
Black water 90% more Nitrogen than greywater (Abedin and Rakib 2013)
MCL sampleOther
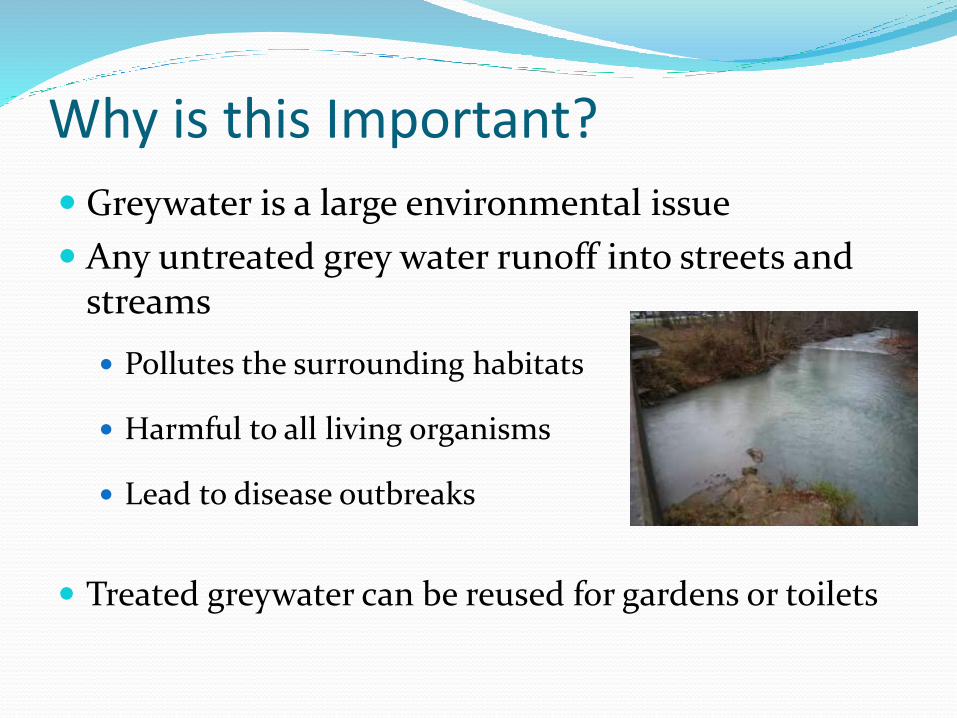
Why is this Important?
Greywater is a large environmental issue
Any untreated grey water runoff into streets and streams
Pollutes the surrounding habitats
Harmful to all living organisms
Lead to disease outbreaks
Treated greywater can be reused for gardens or toilets

Acknowledgements Sofia
Emilia
Danielle
Jorge
Rafael (Los Pinos)
Monteverde Institute
Monteverde Country Lodge
Bob (Bajo Del Tigre)