HAL Id: hal-00925501 https://hal.archives-ouvertes.fr/hal-00925501 Submitted on 9 Jan 2014 HAL is a multi-disciplinary open access archive for the deposit and dissemination of sci- entific research documents, whether they are pub- lished or not. The documents may come from teaching and research institutions in France or abroad, or from public or private research centers. L’archive ouverte pluridisciplinaire HAL, est destinée au dépôt et à la diffusion de documents scientifiques de niveau recherche, publiés ou non, émanant des établissements d’enseignement et de recherche français ou étrangers, des laboratoires publics ou privés. Synchronous machine faults detection and isolation for electro-mechanical actuators in aeronautics Garance Vinson, Michel Combacau, Thomas Prado To cite this version: Garance Vinson, Michel Combacau, Thomas Prado. Synchronous machine faults detection and iso- lation for electro-mechanical actuators in aeronautics. IFAC International Symposium on Fault De- tection Supervision and Safety of Technical Processes, Aug 2012, Mexico, Mexico. 6p., 2012. <hal- 00925501>
Transcript
HAL Id: hal-00925501https://hal.archives-ouvertes.fr/hal-00925501
Submitted on 9 Jan 2014
HAL is a multi-disciplinary open accessarchive for the deposit and dissemination of sci-entific research documents, whether they are pub-lished or not. The documents may come fromteaching and research institutions in France orabroad, or from public or private research centers.
L’archive ouverte pluridisciplinaire HAL, estdestinée au dépôt et à la diffusion de documentsscientifiques de niveau recherche, publiés ou non,émanant des établissements d’enseignement et derecherche français ou étrangers, des laboratoirespublics ou privés.
Synchronous machine faults detection and isolation forelectro-mechanical actuators in aeronautics
Garance Vinson, Michel Combacau, Thomas Prado
To cite this version:Garance Vinson, Michel Combacau, Thomas Prado. Synchronous machine faults detection and iso-lation for electro-mechanical actuators in aeronautics. IFAC International Symposium on Fault De-tection Supervision and Safety of Technical Processes, Aug 2012, Mexico, Mexico. 6p., 2012. <hal-00925501>
∗ CNRS LAAS, 7 av du Colonel Roche, Univ de Toulouse, LAAS-UPS,31400 Toulouse, France and Messier-Bugatti-Dowty, 78140Velizy-Villacoublay, France (Tel: +33-146-29-8343, e-mail:
[email protected]).∗∗ CNRS LAAS, 7 av du Colonel Roche, Univ de Toulouse,
LAAS-UPS, 31400 Toulouse, France (e-mail:[email protected])∗∗∗ Messier-Bugatti-Dowty, 78140 Velizy-Villacoublay, France (e-mail:
Abstract: The reported work is the design of a Fault Detection and Isolation systemfor permanent magnet synchronous machine (PMSM). Two main faults occurring on thesemachine are identified as inter-turns short-circuit and rotor single pole demagnetization, andcharacterized. An analytical model of synchronous machines is developed and simulated usingMatlab Simulink. This model allows simulating nominal and faulty motor behaviour. It isparameterizable and is able to simulate several stages of the two degradation. Specific indicatorsare proposed for each fault. They do not require additional material or sensors since they arebased on the signals already monitored for the machine control. To illustrate the method anapplication is made on an innovative 12-slots 10-poles PMSM that becomes more and morepopular in aeronautics, and on a 9-slots 8-poles PMSM used in critical application as braking.
Facing the growth of the air transport demand, theenvironmental issues and the competition between air-craft manufacturers, the aerospace industry is lookingfor safer, cleaner and cheaper aircrafts. Beside the majorstep changes occurring in engines, structures and aerody-namics, improvement of efficient secondary power systemsoffers promising advances. In this area, flight control andlanding gears actuation appear as major power consumersthat makes them a key driver for the sizing of the re-dundant aircraft power networks. As power is conveyedwithout mass transfer with electrical wires, power-by-wirehas evident advantages against pneumatic or hydraulicpower distribution.
The electrification of aeronautical actuation systems islinked to another concern of Aircraft manufacturers. In-deed requirements are increasing regarding operationalavailability of equipment and a more efficient manage-ment of the maintenance. To achieve this, two familiesof solution can be combined: during design with the de-velopment of fault tolerant or fault resistant components,and during operational life with health monitoring. Thislatest appears as a very promising solution. However,implementing mature health monitoring features cannotbe achieved without significantly improving the knowledgeof the components wear and failures to enable proposingsolutions for early fault detection, diagnosis and prognosis.
This paper specifically deals with FDI (fault detection andisolation). This process consists in (1) the detection ofan abnormal behaviour of the system under study and(2) the identification of the fault, this last task dwells inidentifying which component is involved and what faultoccurred at which level. It determines the health of thesystem and its components.
FDI’s basic principle is to compare the real behaviour ofthe system with the expected behaviour that comes from asystem model. Comparison is firstly made with the modelof nominal operation during the detection stage. If thereis a difference between observed and simulated nominalbehaviours, then identification process takes place andcomparison is done with faults models. To assess the con-sistency between real and expected behaviours, indicatorsare used. These indicators are based on the informationavailable on the system e.g. on the observations comingfrom the sensors. For each fault, a battery of indicatorsis used whose values vary in a well-known way when thefault occurs; this is the fault signature. This signatureis identified from a model of the system including faultsmodels. This model might be analytical, numerical, orboth, depending on the knowledge available on the faultysystem.
The reported work is the design of a FDI system forPMSM and the application on two types of machines, a12-slots 10-poles synchronous machine and a 9-slots 8-
poles used in safe critical aerospace actuation, e.g. forlanding gear extension and retraction or for brakes. Firstthe context of the study and the needs will be described.Second the two main faults occurring on PMSM will beidentified and characterized. Third detection and diagnosiswill be discussed. Finally a conclusion will summarize thecontribution and point out plans for future work.
2. ISSUE PRESENTATION
2.1 The 12-slots 10-poles and 9-slots 8-poles synchronousmachines
In the domain of PMSM, modular topology becomes moreand more popular [Nierlich]. The two studied machines are3-phases radial flux machines with non-overlapped coilsand surface mounted permanent magnet. In the 12-slots10-poles PMSM coils are wound around a single tooth inthe sequence [C+ B- A+ C- B+ A-].There are two sectionsrepeating themselves with a negative periodicity. In the 9-slots 8-poles machine there are two coils a slot and theyare wound in the sequence [A+ A- A+ B+ B- B+ C+ C-C+].
2.2 A generic PMSM model
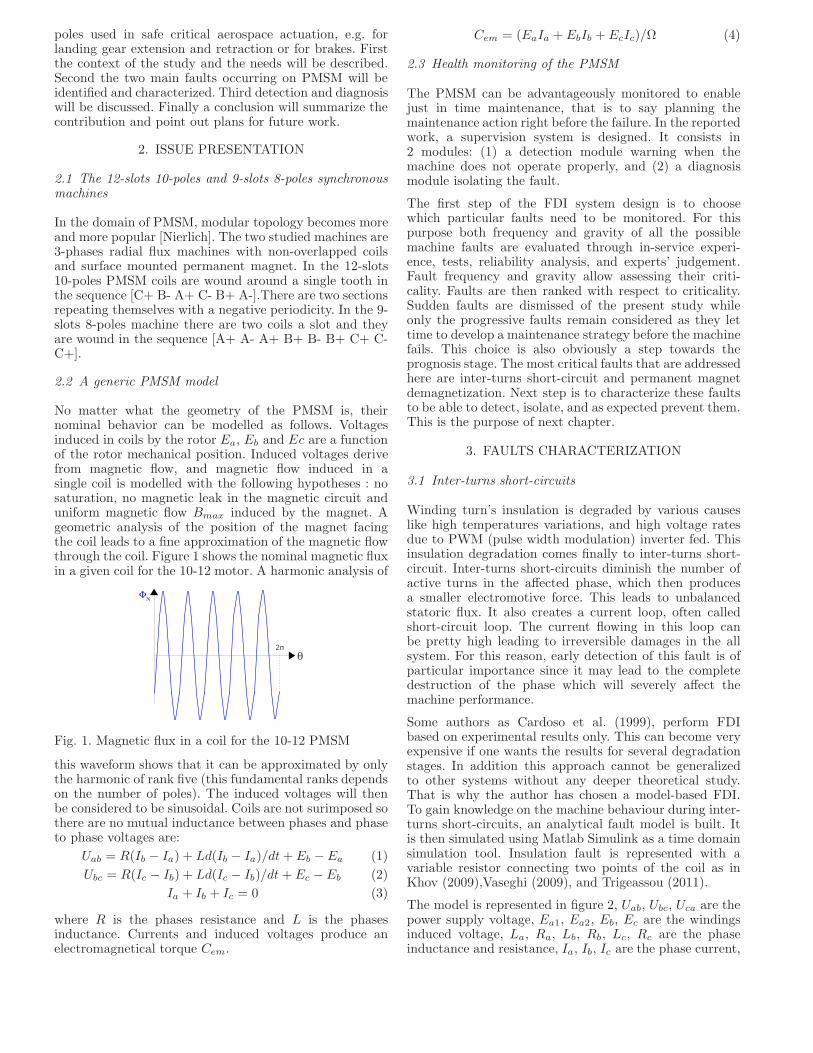
No matter what the geometry of the PMSM is, theirnominal behavior can be modelled as follows. Voltagesinduced in coils by the rotor Ea, Eb and Ec are a functionof the rotor mechanical position. Induced voltages derivefrom magnetic flow, and magnetic flow induced in asingle coil is modelled with the following hypotheses : nosaturation, no magnetic leak in the magnetic circuit anduniform magnetic flow Bmax induced by the magnet. Ageometric analysis of the position of the magnet facingthe coil leads to a fine approximation of the magnetic flowthrough the coil. Figure 1 shows the nominal magnetic fluxin a given coil for the 10-12 motor. A harmonic analysis of
Fig. 1. Magnetic flux in a coil for the 10-12 PMSM
this waveform shows that it can be approximated by onlythe harmonic of rank five (this fundamental ranks dependson the number of poles). The induced voltages will thenbe considered to be sinusoidal. Coils are not surimposed sothere are no mutual inductance between phases and phaseto phase voltages are:
Uab = R(Ib − Ia) + Ld(Ib − Ia)/dt+ Eb − Ea (1)
Ubc = R(Ic − Ib) + Ld(Ic − Ib)/dt+ Ec − Eb (2)
Ia + Ib + Ic = 0 (3)
where R is the phases resistance and L is the phasesinductance. Currents and induced voltages produce anelectromagnetical torque Cem.
Cem = (EaIa + EbIb + EcIc)/Ω (4)
2.3 Health monitoring of the PMSM
The PMSM can be advantageously monitored to enablejust in time maintenance, that is to say planning themaintenance action right before the failure. In the reportedwork, a supervision system is designed. It consists in2 modules: (1) a detection module warning when themachine does not operate properly, and (2) a diagnosismodule isolating the fault.
The first step of the FDI system design is to choosewhich particular faults need to be monitored. For thispurpose both frequency and gravity of all the possiblemachine faults are evaluated through in-service experi-ence, tests, reliability analysis, and experts’ judgement.Fault frequency and gravity allow assessing their criti-cality. Faults are then ranked with respect to criticality.Sudden faults are dismissed of the present study whileonly the progressive faults remain considered as they lettime to develop a maintenance strategy before the machinefails. This choice is also obviously a step towards theprognosis stage. The most critical faults that are addressedhere are inter-turns short-circuit and permanent magnetdemagnetization. Next step is to characterize these faultsto be able to detect, isolate, and as expected prevent them.This is the purpose of next chapter.
3. FAULTS CHARACTERIZATION
3.1 Inter-turns short-circuits
Winding turn’s insulation is degraded by various causeslike high temperatures variations, and high voltage ratesdue to PWM (pulse width modulation) inverter fed. Thisinsulation degradation comes finally to inter-turns short-circuit. Inter-turns short-circuits diminish the number ofactive turns in the affected phase, which then producesa smaller electromotive force. This leads to unbalancedstatoric flux. It also creates a current loop, often calledshort-circuit loop. The current flowing in this loop canbe pretty high leading to irreversible damages in the allsystem. For this reason, early detection of this fault is ofparticular importance since it may lead to the completedestruction of the phase which will severely affect themachine performance.
Some authors as Cardoso et al. (1999), perform FDIbased on experimental results only. This can become veryexpensive if one wants the results for several degradationstages. In addition this approach cannot be generalizedto other systems without any deeper theoretical study.That is why the author has chosen a model-based FDI.To gain knowledge on the machine behaviour during inter-turns short-circuits, an analytical fault model is built. Itis then simulated using Matlab Simulink as a time domainsimulation tool. Insulation fault is represented with avariable resistor connecting two points of the coil as inKhov (2009),Vaseghi (2009), and Trigeassou (2011).
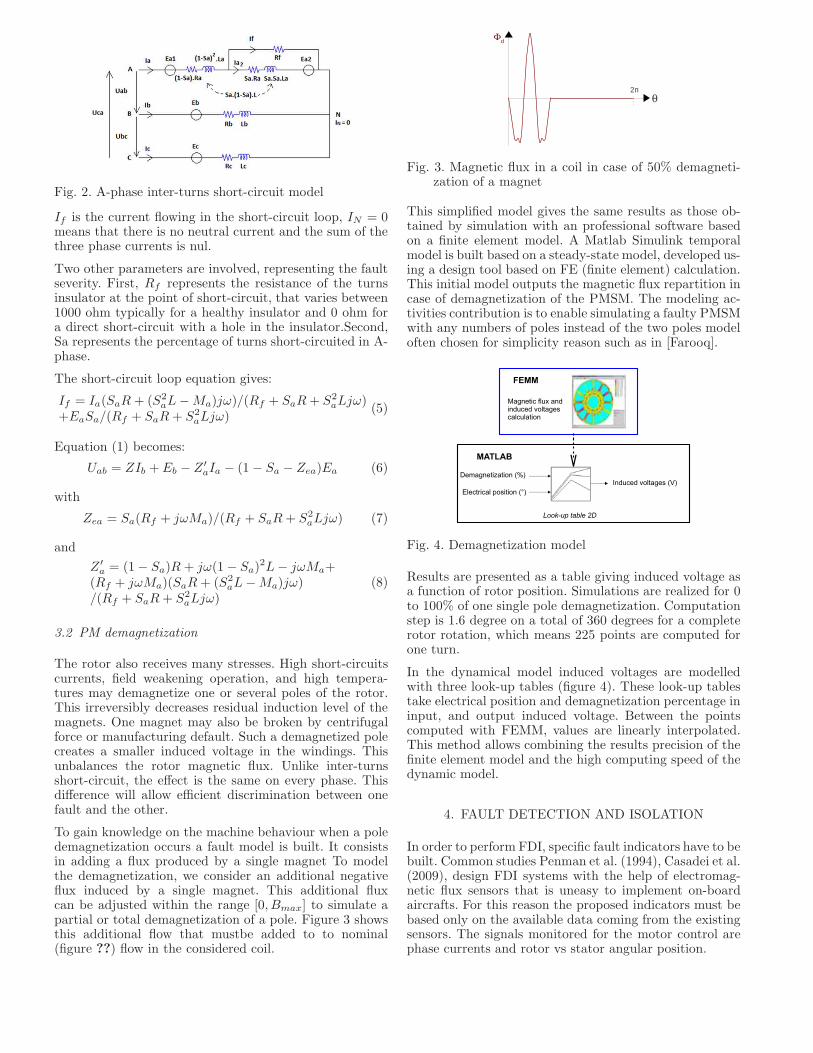
The model is represented in figure 2, Uab, Ubc, Uca are thepower supply voltage, Ea1, Ea2, Eb, Ec are the windingsinduced voltage, La, Ra, Lb, Rb, Lc, Rc are the phaseinductance and resistance, Ia, Ib, Ic are the phase current,
Fig. 2. A-phase inter-turns short-circuit model
If is the current flowing in the short-circuit loop, IN = 0means that there is no neutral current and the sum of thethree phase currents is nul.
Two other parameters are involved, representing the faultseverity. First, Rf represents the resistance of the turnsinsulator at the point of short-circuit, that varies between1000 ohm typically for a healthy insulator and 0 ohm fora direct short-circuit with a hole in the insulator.Second,Sa represents the percentage of turns short-circuited in A-phase.
The short-circuit loop equation gives:
If = Ia(SaR + (S2
aL−Ma)jω)/(Rf + SaR+ S2
aLjω)+EaSa/(Rf + SaR+ S2
aLjω)(5)
Equation (1) becomes:
Uab = ZIb + Eb − Z ′
aIa − (1 − Sa − Zea)Ea (6)
with
Zea = Sa(Rf + jωMa)/(Rf + SaR+ S2
aLjω) (7)
and
Z ′
a = (1− Sa)R + jω(1− Sa)2L− jωMa+
(Rf + jωMa)(SaR+ (S2
aL−Ma)jω)/(Rf + SaR+ S2
aLjω)(8)
3.2 PM demagnetization
The rotor also receives many stresses. High short-circuitscurrents, field weakening operation, and high tempera-tures may demagnetize one or several poles of the rotor.This irreversibly decreases residual induction level of themagnets. One magnet may also be broken by centrifugalforce or manufacturing default. Such a demagnetized polecreates a smaller induced voltage in the windings. Thisunbalances the rotor magnetic flux. Unlike inter-turnsshort-circuit, the effect is the same on every phase. Thisdifference will allow efficient discrimination between onefault and the other.
To gain knowledge on the machine behaviour when a poledemagnetization occurs a fault model is built. It consistsin adding a flux produced by a single magnet To modelthe demagnetization, we consider an additional negativeflux induced by a single magnet. This additional fluxcan be adjusted within the range [0, Bmax] to simulate apartial or total demagnetization of a pole. Figure 3 showsthis additional flow that mustbe added to to nominal(figure ??) flow in the considered coil.
Fig. 3. Magnetic flux in a coil in case of 50% demagneti-zation of a magnet
This simplified model gives the same results as those ob-tained by simulation with an professional software basedon a finite element model. A Matlab Simulink temporalmodel is built based on a steady-state model, developed us-ing a design tool based on FE (finite element) calculation.This initial model outputs the magnetic flux repartition incase of demagnetization of the PMSM. The modeling ac-tivities contribution is to enable simulating a faulty PMSMwith any numbers of poles instead of the two poles modeloften chosen for simplicity reason such as in [Farooq].
Fig. 4. Demagnetization model
Results are presented as a table giving induced voltage asa function of rotor position. Simulations are realized for 0to 100% of one single pole demagnetization. Computationstep is 1.6 degree on a total of 360 degrees for a completerotor rotation, which means 225 points are computed forone turn.
In the dynamical model induced voltages are modelledwith three look-up tables (figure 4). These look-up tablestake electrical position and demagnetization percentage ininput, and output induced voltage. Between the pointscomputed with FEMM, values are linearly interpolated.This method allows combining the results precision of thefinite element model and the high computing speed of thedynamic model.
4. FAULT DETECTION AND ISOLATION
In order to perform FDI, specific fault indicators have to bebuilt. Common studies Penman et al. (1994), Casadei et al.(2009), design FDI systems with the help of electromag-netic flux sensors that is uneasy to implement on-boardaircrafts. For this reason the proposed indicators must bebased only on the available data coming from the existingsensors. The signals monitored for the motor control arephase currents and rotor vs stator angular position.
4.1 Inter-turns short-circuit indicators
The analytical study of the short-circuited electrical motorallows the author to build indicators based on phasecurrents.Induced voltages have a 2π/3 phase-shift, and so dophase voltages. Eb and Ubc are then expressed as: Eb =Eaexp(j2π/3) and Ubc = Uabexp(j2π/3).
The relationship between phase currents can be expressedas: Ib = XbIa and Ic = XcIa. In a healthy situation, thevalue of these coefficients are: Xbnom = exp(j2π/3) andXcnom = exp(−j2π/3).
Induced voltages and phase to phase voltages are linked bythe relations: Ea = XeUab, Eb = XeUbcandEc = XeUca.
To find out the relationship between Ib and Ia. To do soIa is expressed as a function of Uab in two different ways.Firstly, equation (6) gives Ia = Z2Uab whith
Z2 = (1 − (exp(j2π/3)− (1− Sa − Zea))Xe)/(ZXb − Z ′
Ia/Ianom is then known from equations (9) and (12) andthe analytical form is given by Ia/Ianom = Z2/Z1.
Finally, the short-circuited loop current If is characterizedas opposed to Ia. Indeed equation (5) leads to If = XfIawith
Xf = (SaR+ (S2
aL−Ma)jω + SaXe/Z2)/((Rf + SaR+ S2
aLjω))(13)
All the currents Ib, Ic, If and Ianom are known from theirrelationship to Ia, and these relationships are a functionof the short-circuit intensity characterized by Rf and Sa.
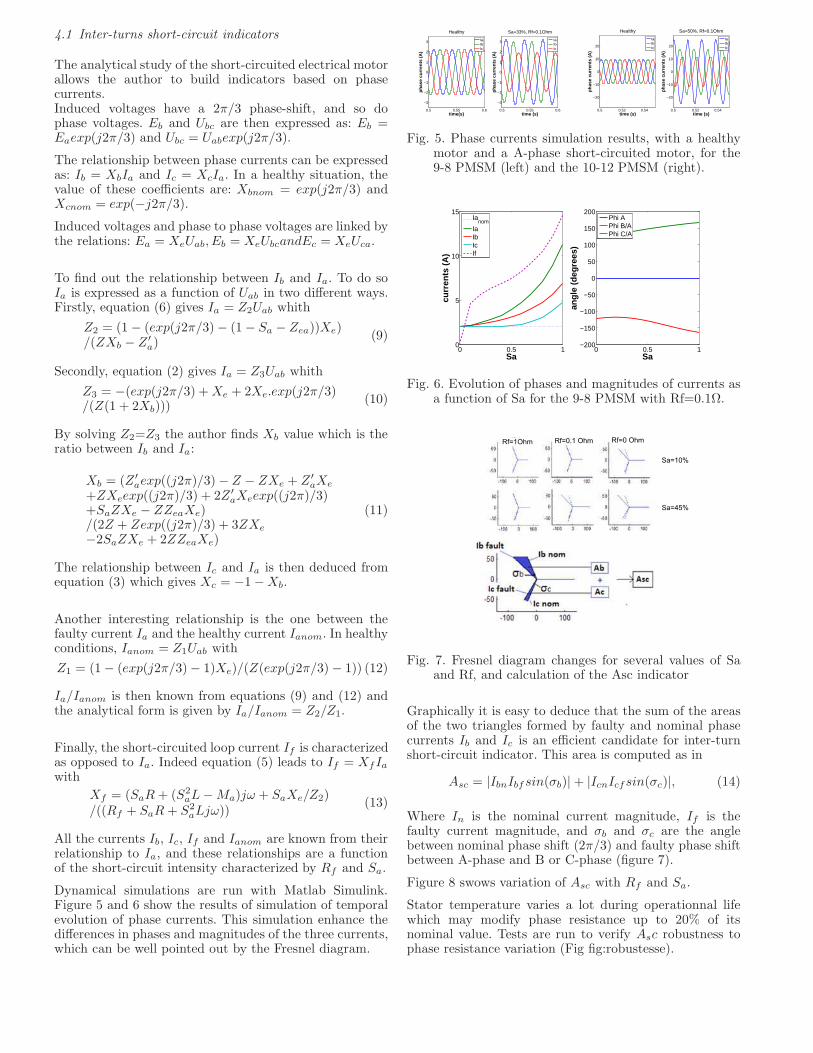
Dynamical simulations are run with Matlab Simulink.Figure 5 and 6 show the results of simulation of temporalevolution of phase currents. This simulation enhance thedifferences in phases and magnitudes of the three currents,which can be well pointed out by the Fresnel diagram.
0.5 0.55 0.6
−3
−2
−1
0
1
2
3
Healthy
time(s)
phas
e cu
rren
ts (
A)
IaIbIc
0.5 0.55 0.6
−3
−2
−1
0
1
2
3
Sa=33%, Rf=0.1Ohm
time (s)
phas
e cu
rren
ts (
A)
IaIbIc
0.5 0.52 0.54
−20
−10
0
10
20
Healthy
time (s)
phas
e cu
rren
ts (
A)
IaIbIc
0.5 0.52 0.54
−20
−10
0
10
20
Sa=50%, Rf=0.1Ohm
time (s)
phas
e cu
rren
ts (
A)
IaIbIc
Fig. 5. Phase currents simulation results, with a healthymotor and a A-phase short-circuited motor, for the9-8 PMSM (left) and the 10-12 PMSM (right).
0 0.5 10
5
10
15
Sa
curr
ents
(A
)
Ianom
IaIbIcIf
0 0.5 1−200
−150
−100
−50
0
50
100
150
200
Sa
angl
e (d
egre
es)
Phi APhi B/APhi C/A
Fig. 6. Evolution of phases and magnitudes of currents asa function of Sa for the 9-8 PMSM with Rf=0.1Ω.
Fig. 7. Fresnel diagram changes for several values of Saand Rf, and calculation of the Asc indicator
Graphically it is easy to deduce that the sum of the areasof the two triangles formed by faulty and nominal phasecurrents Ib and Ic is an efficient candidate for inter-turnshort-circuit indicator. This area is computed as in
Asc = |IbnIbfsin(σb)|+ |IcnIcfsin(σc)|, (14)
Where In is the nominal current magnitude, If is thefaulty current magnitude, and σb and σc are the anglebetween nominal phase shift (2π/3) and faulty phase shiftbetween A-phase and B or C-phase (figure 7).
Figure 8 swows variation of Asc with Rf and Sa.
Stator temperature varies a lot during operationnal lifewhich may modify phase resistance up to 20% of itsnominal value. Tests are run to verify Asc robustness tophase resistance variation (Fig fig:robustesse).
0 0.1 0.2 0.3 0.4 0.5 0.6 0.7 0.8 0.9 10
5
10
15
20
25
Sa
Asc
9−8 PMSM
Rf=0 OhmRf=0,1 OhmRf=1 Ohm
0 0.05 0.1 0.15 0.2 0.25 0.3 0.35 0.4 0.45 0.50
5
10
15
20
25
Sa
Asc
10−12 PMSM
Rf=0 OhmRf=0,1 OhmRf=1 Ohm
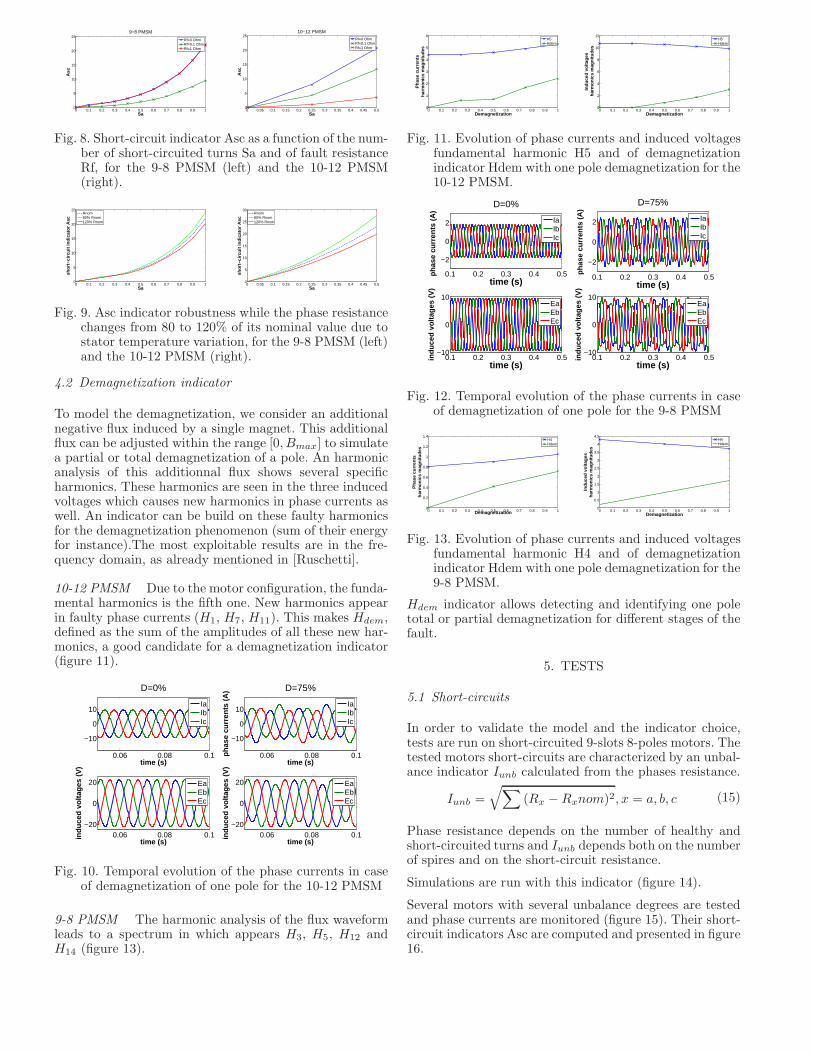
Fig. 8. Short-circuit indicator Asc as a function of the num-ber of short-circuited turns Sa and of fault resistanceRf, for the 9-8 PMSM (left) and the 10-12 PMSM(right).
0 0.1 0.2 0.3 0.4 0.5 0.6 0.7 0.8 0.9 10
5
10
15
20
25
Sa
shor
t−ci
rcui
t ind
icat
or A
sc
Rnom80% Rnom120% Rnom
0 0.05 0.1 0.15 0.2 0.25 0.3 0.35 0.4 0.45 0.50
5
10
15
20
25
30
Sa
shor
t−ci
rcui
t ind
icat
or A
sc
Rnom80% Rnom120% Rnom
Fig. 9. Asc indicator robustness while the phase resistancechanges from 80 to 120% of its nominal value due tostator temperature variation, for the 9-8 PMSM (left)and the 10-12 PMSM (right).
4.2 Demagnetization indicator
To model the demagnetization, we consider an additionalnegative flux induced by a single magnet. This additionalflux can be adjusted within the range [0, Bmax] to simulatea partial or total demagnetization of a pole. An harmonicanalysis of this additionnal flux shows several specificharmonics. These harmonics are seen in the three inducedvoltages which causes new harmonics in phase currents aswell. An indicator can be build on these faulty harmonicsfor the demagnetization phenomenon (sum of their energyfor instance).The most exploitable results are in the fre-quency domain, as already mentioned in [Ruschetti].
10-12 PMSM Due to the motor configuration, the funda-mental harmonics is the fifth one. New harmonics appearin faulty phase currents (H1, H7, H11). This makes Hdem,defined as the sum of the amplitudes of all these new har-monics, a good candidate for a demagnetization indicator(figure 11).
0.06 0.08 0.1
−10
0
10
time (s)
D=0%
IaIbIc
0.06 0.08 0.1−20
0
20
time (s)
indu
ced
volta
ges
(V)
EaEbEc
0.06 0.08 0.1
−10
0
10
time (s)
phas
e cu
rren
ts (
A)
D=75%
IaIbIc
0.06 0.08 0.1−20
0
20
time (s)
indu
ced
volta
ges
(V)
EaEbEc
Fig. 10. Temporal evolution of the phase currents in caseof demagnetization of one pole for the 10-12 PMSM
9-8 PMSM The harmonic analysis of the flux waveformleads to a spectrum in which appears H3, H5, H12 andH14 (figure 13).
0 0.1 0.2 0.3 0.4 0.5 0.6 0.7 0.8 0.9 10
1
2
3
4
5
6
Demagnetization
Pha
se c
urre
nts
harm
onic
s m
agni
tude
s
H5Hdem
0 0.1 0.2 0.3 0.4 0.5 0.6 0.7 0.8 0.9 10
2
4
6
8
10
12
Demagnetization
Indu
ced
volta
ges
har
mon
ics
mag
nitu
des
H5Hdem
Fig. 11. Evolution of phase currents and induced voltagesfundamental harmonic H5 and of demagnetizationindicator Hdem with one pole demagnetization for the10-12 PMSM.
0.1 0.2 0.3 0.4 0.5
−2
0
2
time (s)
phas
e cu
rren
ts (
A)
D=0%
IaIbIc
0.1 0.2 0.3 0.4 0.5−10
0
10
time (s)
indu
ced
volta
ges
(V)
EaEbEc
0.1 0.2 0.3 0.4 0.5
−2
0
2
time (s)
phas
e cu
rren
ts (
A)
D=75%
IaIbIc
0.1 0.2 0.3 0.4 0.5−10
0
10
time (s)
indu
ced
volta
ges
(V)
EaEbEc
Fig. 12. Temporal evolution of the phase currents in caseof demagnetization of one pole for the 9-8 PMSM
0 0.1 0.2 0.3 0.4 0.5 0.6 0.7 0.8 0.9 10
0.2
0.4
0.6
0.8
1
1.2
1.4
Demagnetization
Pha
se c
urre
nts
harm
onic
s m
agni
tude
s
H4Hdem
0 0.1 0.2 0.3 0.4 0.5 0.6 0.7 0.8 0.9 10
0.5
1
1.5
2
2.5
3
3.5
4
4.5
Demagnetization
Indu
ced
volta
ges
harm
onic
s m
agni
tude
s
H4Hdem
Fig. 13. Evolution of phase currents and induced voltagesfundamental harmonic H4 and of demagnetizationindicator Hdem with one pole demagnetization for the9-8 PMSM.
Hdem indicator allows detecting and identifying one poletotal or partial demagnetization for different stages of thefault.
5. TESTS
5.1 Short-circuits
In order to validate the model and the indicator choice,tests are run on short-circuited 9-slots 8-poles motors. Thetested motors short-circuits are characterized by an unbal-ance indicator Iunb calculated from the phases resistance.
Iunb =√
∑
(Rx −Rxnom)2, x = a, b, c (15)
Phase resistance depends on the number of healthy andshort-circuited turns and Iunb depends both on the numberof spires and on the short-circuit resistance.
Simulations are run with this indicator (figure 14).
Several motors with several unbalance degrees are testedand phase currents are monitored (figure 15). Their short-circuit indicators Asc are computed and presented in figure16.
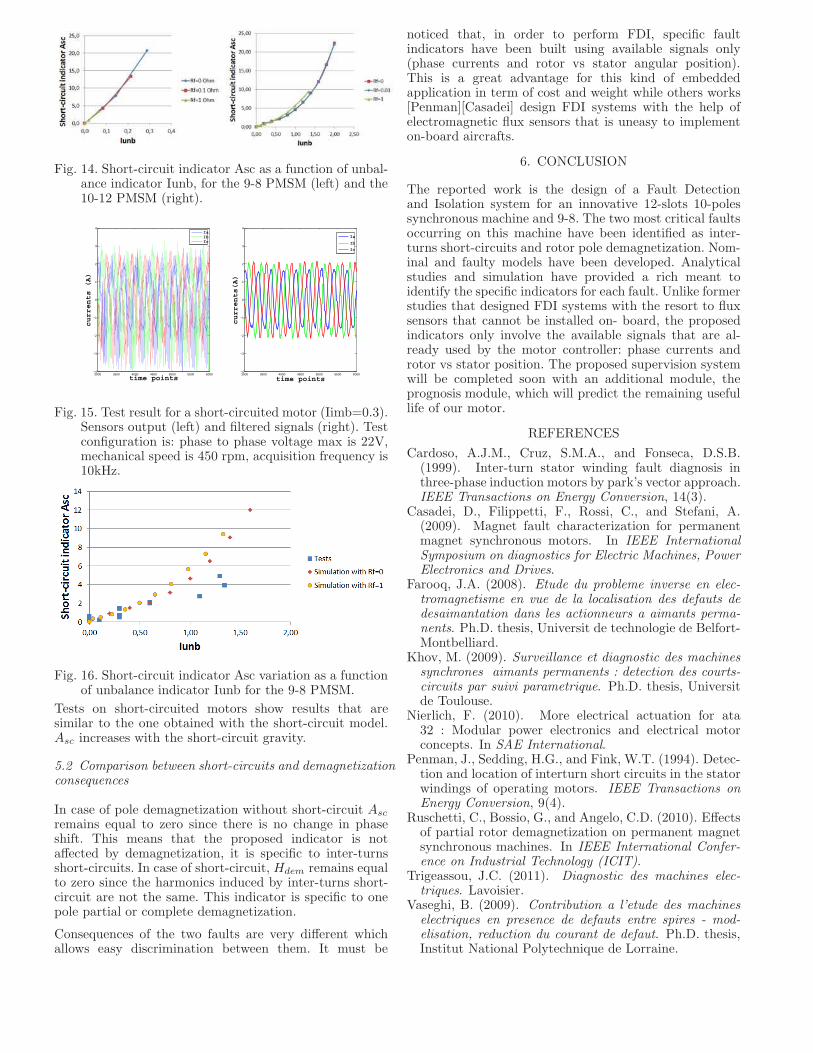
Fig. 14. Short-circuit indicator Asc as a function of unbal-ance indicator Iunb, for the 9-8 PMSM (left) and the10-12 PMSM (right).
3000 3500 4000 4500 5000 5500 6000−4
−3
−2
−1
0
1
2
3
4
time points
currents (A)
Ia
Ib
Ic
3000 3500 4000 4500 5000 5500 6000−4
−3
−2
−1
0
1
2
3
4
time points
currents(A)
Ia
Ib
Ic
Fig. 15. Test result for a short-circuited motor (Iimb=0.3).Sensors output (left) and filtered signals (right). Testconfiguration is: phase to phase voltage max is 22V,mechanical speed is 450 rpm, acquisition frequency is10kHz.
Fig. 16. Short-circuit indicator Asc variation as a functionof unbalance indicator Iunb for the 9-8 PMSM.
Tests on short-circuited motors show results that aresimilar to the one obtained with the short-circuit model.Asc increases with the short-circuit gravity.
5.2 Comparison between short-circuits and demagnetizationconsequences
In case of pole demagnetization without short-circuit Asc
remains equal to zero since there is no change in phaseshift. This means that the proposed indicator is notaffected by demagnetization, it is specific to inter-turnsshort-circuits. In case of short-circuit, Hdem remains equalto zero since the harmonics induced by inter-turns short-circuit are not the same. This indicator is specific to onepole partial or complete demagnetization.
Consequences of the two faults are very different whichallows easy discrimination between them. It must be
noticed that, in order to perform FDI, specific faultindicators have been built using available signals only(phase currents and rotor vs stator angular position).This is a great advantage for this kind of embeddedapplication in term of cost and weight while others works[Penman][Casadei] design FDI systems with the help ofelectromagnetic flux sensors that is uneasy to implementon-board aircrafts.
6. CONCLUSION
The reported work is the design of a Fault Detectionand Isolation system for an innovative 12-slots 10-polessynchronous machine and 9-8. The two most critical faultsoccurring on this machine have been identified as inter-turns short-circuits and rotor pole demagnetization. Nom-inal and faulty models have been developed. Analyticalstudies and simulation have provided a rich meant toidentify the specific indicators for each fault. Unlike formerstudies that designed FDI systems with the resort to fluxsensors that cannot be installed on- board, the proposedindicators only involve the available signals that are al-ready used by the motor controller: phase currents androtor vs stator position. The proposed supervision systemwill be completed soon with an additional module, theprognosis module, which will predict the remaining usefullife of our motor.
REFERENCES
Cardoso, A.J.M., Cruz, S.M.A., and Fonseca, D.S.B.(1999). Inter-turn stator winding fault diagnosis inthree-phase induction motors by park’s vector approach.IEEE Transactions on Energy Conversion, 14(3).
Casadei, D., Filippetti, F., Rossi, C., and Stefani, A.(2009). Magnet fault characterization for permanentmagnet synchronous motors. In IEEE InternationalSymposium on diagnostics for Electric Machines, PowerElectronics and Drives.
Farooq, J.A. (2008). Etude du probleme inverse en elec-tromagnetisme en vue de la localisation des defauts dedesaimantation dans les actionneurs a aimants perma-nents. Ph.D. thesis, Universit de technologie de Belfort-Montbelliard.
Khov, M. (2009). Surveillance et diagnostic des machinessynchrones aimants permanents : detection des courts-circuits par suivi parametrique. Ph.D. thesis, Universitde Toulouse.
Nierlich, F. (2010). More electrical actuation for ata32 : Modular power electronics and electrical motorconcepts. In SAE International.
Penman, J., Sedding, H.G., and Fink, W.T. (1994). Detec-tion and location of interturn short circuits in the statorwindings of operating motors. IEEE Transactions onEnergy Conversion, 9(4).
Ruschetti, C., Bossio, G., and Angelo, C.D. (2010). Effectsof partial rotor demagnetization on permanent magnetsynchronous machines. In IEEE International Confer-ence on Industrial Technology (ICIT).
Trigeassou, J.C. (2011). Diagnostic des machines elec-triques. Lavoisier.
Vaseghi, B. (2009). Contribution a l’etude des machineselectriques en presence de defauts entre spires - mod-elisation, reduction du courant de defaut. Ph.D. thesis,Institut National Polytechnique de Lorraine.