Syngas-based Annex concepts in comparison with CO 2 -based Power-to-X concepts within pulverized coal combustion power plants Dipl.-Ing. Christian Wolfersdorf Institute of Energy Process Engineering & Chemical Engineering 15th June 20, Cologne, Germany Background Process Description Modelling Results Cost Estimation Summary
Transcript
Syngas-based Annex concepts in comparison with CO2-based Power-to-X concepts within
pulverized coal combustion power plants
Dipl.-Ing. Christian Wolfersdorf Institute of Energy Process Engineering & Chemical Engineering 15th June 20, Cologne, Germany
Background Process Description
Modelling Results
Cost Estimation Summary
Pumped Hydro
Renewables
Oil
NG SC
NG CC
Hard Coal
Lignite
Nuclear
2
Electricity generation – Example Germany
Jürgensen et al., Biomass and Bioenergy, 2014, 66, 126-132
Sources:
→ Challenges:→ Flexibility improvement of fossil-fueled power plants→ Concepts for excess electricity storage in countries with high Renewables share
Installed capacity in GW(el,net) Electricity generation in TWh(el)
2000 0.13
2010 0.42
2020 1.1–13
Excess Electricity in TWh(el)
Energy concept of the Federal Government, Germany, 2010
Wünsch et al., Maßnahmen zur nachhaltigen Integration von Systemen zur gekoppelten Strom- und Wärmebereitstellung in das neue Energieversorgungssystem, Prognos AG, 2013
Background
Background
Flexibility and part load capability of existing fossil fueled power plants (significant remaining lifetime) are limited
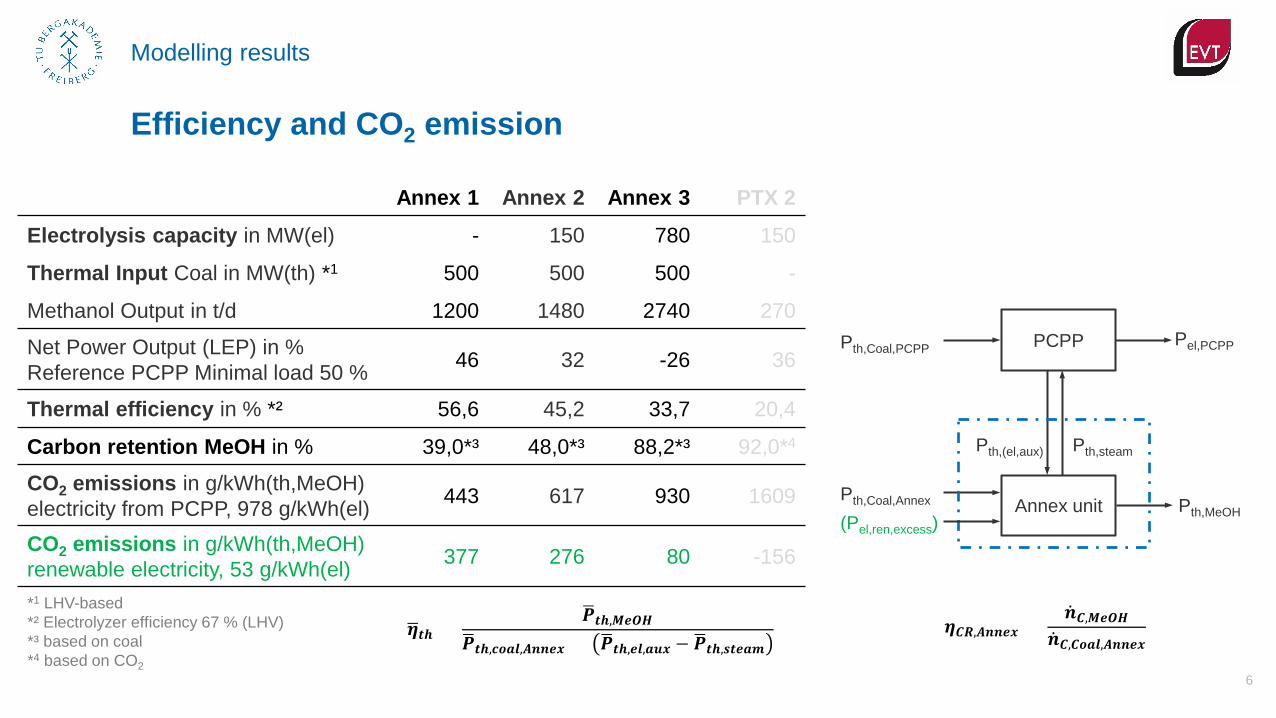
Net Power Output (LEP) in % Reference PCPP Minimal load 50 % 46 32 -26 36
Thermal efficiency in % *² 56,6 45,2 33,7 20,4
Carbon retention MeOH in % 39,0*³ 48,0*³ 88,2*³ 92,0*4
CO2 emissions in g/kWh(th,MeOH) electricity from PCPP, 978 g/kWh(el) 443 617 930 1609
CO2 emissions in g/kWh(th,MeOH) renewable electricity, 53 g/kWh(el) 377 276 80 -156
*1 LHV-based*² Electrolyzer efficiency 67 % (LHV)*³ based on coal*4 based on CO2
54% 69%53%
26%53%
20% 28%
23%
15%
23%
24%
22%
57%
22%
70%
0
500
1.000
1.500
2.000
2.500
16%
80%
Cost estimation
8
Concept Methanol production in t/d Electrolysis capacity in MW(el) Full load hours Electrolysis in h/a
CTX1 1200
- 5830
Annex1 1200
- 5830
Annex2 1480 150
5830
Annex3 2740 780
5830
Annex2 1480 150
5830
PTX2 270 150
5830
PTX2 123 150
2660
Bar
e Er
ecte
d C
osts
(201
5)
in €
/kW
(th,M
eOH
)
Equipment Costs
8th International Freiberg Conference, 12 – 16 June 2016
Infrastructure and auxiliary equipment
Electrolysis unit and gas storage
Gas cleanup, synthesis and upgrading
Coal handling, gasification and ASU
-27 % +89 %
0
200
400
600
800
1.000
1.200
24 €/MWh(el)
19,6 €/MWh(el)
Cost estimation
9
Methanol price range 150-525 €/t
Concept Methanol production in t/d Electrolysis capacity in MW(el) Full load hours Electrolysis in h/a
Leve
lized
Met
hano
l cos
t (2
015)
in €
/t M
eOH
Source: Methanex, Methanol Prices, 2006-2016
Methanol Costs
CTX1 1200
- 5830
Annex1 1200
- 5830
Annex2 1480 150
5830
Annex3 2740 780
5830
Annex2 1480 150
5830
PTX2 270 150
5830
PTX2 123 150
2660
8th International Freiberg Conference, 12 – 16 June 2016
PTX2 270 150
5830
Electricity and fuel in €/t MeOH
CAPEX and other OPEX in €/t MeOH
0 €/MWh(el)
-18 %
70% 80% 90% 100% 110% 120% 130% 140%
Cost estimation
10
Methanol Costs – Sensitivity
(1 – availability) 11,3 %
construction time 3 years
interest rate 10 %
methanol capacity 268 t/d
electricity price LEP 23,86 €/MWh(el) HEP 34,86 €/MWh(el)
Parameter Reference value Reference PTX2
- 50 %
- 50 %
- 50 %
+ 50 %
- 50 %
+ 50 %
+ 50 %
+ 50 %
- 50 %
+ 50 %
Methanol cost (2015)
Summary
11 8th International Freiberg Conference, 12 – 16 June 2016
Annex and PTX concepts improve flexibility of electricity generation from lignite: • Power sink → net power output reduction from 50 % (PCPP) to 32 / 36 % (Annex 2 / PTX 2)
without lifetime-consuming start-up/Shut-down processes• Electrolysis unit needs high availability for cost reduction
Electrolysis capacity (Annex) ↑ • Power sink ↑, 𝜂𝜂𝐶𝐶𝐶𝐶 ↑• Specific CAPEX ↓• Total investment costs ↑• �̅�𝜂𝑡𝑡𝑡 ↓
12 8th International Freiberg Conference, 12 – 16 June 2016
Project HotVeGasII: Project number 0327773G • Participating companies
− EnBW Kraftwerke AG− RWE Power AG, Forschung und Entwicklung− Vattenfall Europe Generation AG− AIR LIQUIDE Forschung und Entwicklung GmbH− Siemens Fuel Gasification Technology GmbH & Co. KG
• Participating research partners:− TU München, Institute for Energy Systems− TU Bergakademie Freiberg, Institute of Energy Process Engineering and Chemical Engineering− Forschungszentrum Jülich GmbH, Institute of Energy and Climate Research (IEK-2)− GTT-Technologies, Gesellschaft für Technische Thermochemie und –physik mbH
Project CODY: Project number 03ET7063 • Participating companies