A S WE MOVE INTO THE POST-2015 ERA OF THE SUSTAINABLE DEVELOPMENT GOALS (SDGS), THE WORLD FACES MANY SEEM- INGLY INTRACTABLE PROBLEMS. Malnutrition should not be one of them. Countries that are determined to make rapid advances in malnutrition reduction can do so, and the incentives to improve nutrition are strong. Good nutrition provides a vital foundation for human development, central to meeting our full potential. When nutrition status improves, it leads to a host of positive outcomes for individuals and families. Many more children will live to see their fifth birthdays, their growth will be less disrupted, and they will gain in height and weight. They will learn more in school be- cause their brain function is not impaired. As a result of this posi- tive early environment, as adults they will have better jobs and get ill less often. Older adults will age more healthily and live longer. SYNOPSIS
Transcript
AS WE MOVE INTO THE POST-2015 ERA OF THE SUSTAINABLE DEVELOPMENT GOALS (SDGS), THE WORLD FACES MANY SEEM-
INGLY INTRACTABLE PROBLEMS. Malnutrition should not be one of them. Countries that are determined to make rapid advances in malnutrition reduction can do so, and the incentives to improve nutrition are strong. Good nutrition provides a vital foundation for human development, central to meeting our full potential. When nutrition status improves, it leads to a host of positive outcomes for individuals and families. Many more children will live to see their fifth birthdays, their growth will be less disrupted, and they will gain in height and weight. They will learn more in school be-cause their brain function is not impaired. As a result of this posi-tive early environment, as adults they will have better jobs and get ill less often. Older adults will age more healthily and live longer.
SYNOPS I S
2
Common sense tells us that when these human-scale experiences are aggregated up, communities and nations benefit. Overall, the evidence is growing: good nutrition is an essential driver of sustainable development (Figure 1).
The opposite of good nutrition—“bad” nutrition—takes many forms: children and adults who are little more than skin and bone, children so stunted that they look three years old when they are really six, people who can’t fight infection because their diets lack nutrients, and peo-ple who are more likely to suffer from strokes because they are obese or whose blood vessels collapse because they have diabetes.
These multiple forms of malnutrition have common causes: poor-quality diets, weak care for mother and child, insufficient access to health services, and unsanitary, un-healthy environments.
Despite the incentives to overcome malnutrition, it remains a problem of staggering size worldwide. Malnu-trition affects all countries. Almost one in three people on the planet experience it. For every country it represents a substantial drag on sustainable development. Efforts to combat it are gathering momentum and are beginning to deliver results, but turning the tide of decades of neglect will not be easy. While some forms of malnutrition, such as stunting, are showing modest but uneven declines, other forms, such as anemia in women of reproductive age, are stagnant. And still others, such as overweight and obesity, are increasing.
We know that combatting malnutrition in all of its complexity will require an array of actions. First, the
political environment needs to be made conducive to reducing malnutrition. Citizens can create and sustain the momentum for change and hold governments and other actors accountable for the extent and effectiveness of their actions. Second, nutrition cannot be addressed in isolation; policies and practices in the many sectors that can affect nutrition positively should do so. People working in sectors from education to agriculture to climate change need to understand what they can do to reduce malnutrition and why it is in their interest to do so. Finally, high-impact, targeted nutrition interventions must reach the people that need them. At present the gaps between delivery and need are large. These actions will take different forms in different countries. But while we know more than ever about how to combat malnutrition, too little of this knowl-edge is being acted upon.
The Global Nutrition Report (GNR) is produced by an Independent Expert Group, at the request of a Stake-holder Group, and is the collective effort of more than 70 authors. It is the only comprehensive report on all forms of malnutrition in all countries. The 2015 report has a more balanced focus on malnutrition in all its forms and a deep-er focus on climate change, food systems, and the roles and accountability of business than the 2014 report.
The GNR is intended to be a spur and a guide to further action. Summarized here, the report tells us how much progress the world is making on reducing malnutrition in all its forms, what governments and their partners need to do to accelerate that progress, and how citizens can hold all stakeholders to account for their efforts to do so.
Associated Press
3
PROGRESS IN REDUCING MALNUTRITIONTwo sets of global targets exist for nutrition, both ratified by the world’s health ministers at the World Health Assem-bly (WHA) in 2012-2013. The first set relates to maternal and child nutrition. Here the world is making some prog-ress, albeit too slowly and unevenly. The second set relates to adult overweight and diabetes. Here the world is failing to meet the global target of halting the rise in the preva-lence of these conditions.
MATERNAL AND CHILD NUTRITIONTo measure countries’ progress on maternal and child nutrition, data on five of the six WHA global targets are tracked: stunting, wasting, and overweight among children
under age 5; anemia in women 15–49 years of age; and rates of exclusive breastfeeding for infants younger than 6 months of age.
Nearly every country (70 of the 74 for which data exist) is on course to meet at least one of the five global targets. This breadth of performance is good news. However, only one country (Kenya) is on course to meet all five WHA maternal and child nutrition targets, and only four (Co-lombia, Ghana, Vanuatu, and Vietnam) are on course to meet four targets (Table 1).
Target by target, countries’ performance varies tremen-dously (Figure 2). Only 3 percent of countries are on course to meet the anemia target, whereas 41 percent of coun-tries (32 of 78) are on course to meet the target on exclu-
FIGURE 1 The economic benefits to improved nutrition: new estimates since the 2014 GNR
Brazil Europe
USA
What % of healthcare expenses go to OBESITY TREATMENT?
De Oliveira et al. 2015
2%2–4%5–20%
MalawiWhat is the cost of existing stunting?
AUC/WFP 2015
10%OF ANNUAL GDP
Brazil What happens when infants are breastfed >12 months?
Victora et al. 2015
INCOME INCREASES BY 33%
DRC, Mali, Nigeria & TogoWhat are the returns to scaling up nutrition-specific interventions?
World Bank 2015
COMPOUND RATES OF RETURN >13%
LOW AND MIDDLE income countries
What are the returns to scaling up nutrition interventions?
COMPOUND RATE OF RETURN 10%
IFPRI 2014a
BENEFIT-COST RATIO16:1
40
THE SCALE OF MALNUTRITION
While the numbers of people affected by different types of malnutrition cannot be simply summed (because a single per-son can suffer from more than one type of malnutrition), the scale of malnutrition is staggering:
• 2 billion people experience micronutrient malnutrition;
• 1.9 billion adults are overweight or obese;
• 161 million children under age 5 are too short for their age (stunted), 51 million don’t weigh enough for their height (wasted), and 42 million are overweight—none of these children are growing healthily;
• 794 million people are estimated to be calorie deficient; and
• 1 in 12 adults worldwide have Type 2 diabetes.
In many countries, only a minority of children are growing healthily. In Bangla-desh, Democratic Republic of the Congo, Ethiopia, Nigeria, and Pakistan, for exam-ple, the percentage of children under 5 who are not stunted or wasted ranges between 43 and 48 percent.
sive breastfeeding. For the three targets relating to children under 5—stunting, wasting, and overweight—the share of countries that are on course increased between 2014 and 2015. Progress on stunting is particularly noteworthy: the share of countries on course to meet the target rose from one-fifth (22 percent) to one-third (34 percent). Great
progress has been made in countries such as Bangladesh, Cambodia, Ethiopia, Ghana, India, and Kenya, but prog-ress is uneven and could be faster, as successes in Brazil, China, and Vietnam have shown.
How did these countries do it? We don’t know defini-tively, but the common denominators were strong political commitment; a supportive context with notable poverty reduction; improvements in women’s empowerment; improved food supply; greater access to improved health, water, and sanitation facilities; and improved performance of specific nutrition practices and programs.
ADULT OVERWEIGHT, OBESITY, AND DIABETESThe second set of global targets for nutrition aim to halt the rise in adult overweight, obesity, and diabetes. But the latest modeled estimates from the World Health Organi-zation (WHO) paint a bleak picture. No countries are on course to meet all three targets (overweight, obesity, and diabetes); no countries are on track to meet even two of the targets. Only five countries are on course to meet one target (Djibouti, Iceland, Malta, Nauru, and Venezuela are all on course for diabetes). And 185 countries are off course on all three.
Overall global progress on the eight WHA nutrition indicators is mixed (Figure 3). The data on overweight, obesity, and diabetes remind us of the size of challenge faced, but the data on under-5 growth, particularly stunt-ing, reminds us of what can be achieved with the right focus, the right interventions and policies, and sustained commitment—all backed up by strong mechanisms for holding stakeholders accountable.
TABLE 1 Number of countries on course to meet WHA Global Nutrition Targets by 2025 Number of targets Number of countries on course
5 1 Kenya
4 4 Colombia, Ghana, Vanuatu, Vietnam
3 12 Algeria, Benin, Bolivia, Burundi, El Salvador, Georgia, Jordan, Liberia, Republic of Moldova, Swaziland, Uganda, Zimbabwe
2 33 Albania, Azerbaijan, Bangladesh, Burkina Faso, Cambodia, Central African Republic, Democratic Republic of the Congo, Dominican Republic, Gambia, Guinea-Bissau, Guyana, Honduras, Kazakhstan, Kyrgyzstan, Lao People’s Democratic Republic, Lesotho, Malawi, Mauritania, Mongolia, Namibia, Nepal, Nicaragua, Niger, Peru, Rwanda, Serbia, Sudan, Suriname, Tajikistan, Tunisia, Turkey, United Republic of Tanzania, Zambia
1 20 Armenia, Belize, Bosnia and Herzegovina, Cameroon, Congo (Republic of the), Côte d’Ivoire, Egypt, Ethiopia, Guinea, Haiti, Indonesia, Jamaica, Montenegro, Nigeria, Pakistan, Senegal, Sierra Leone, Somalia, Syria, Togo
0 4 Iraq, Mozambique, Thailand, Sao Tome and Principe
Source: Authors.
Note: The targets are for stunting, wasting, and overweight among chil-dren under age 5; anemia in women 15–49 years of age; and rates of exclu-sive breastfeeding for infants 0–6 months of age. The data for anemia are the same as those presented in the Global Nutrition Report 2014.
Panos/A. Trayler-Smith
5
CALL TO ACTION Presidential and prime ministerial offices of countries that are off course to meet the World Health Assembly’s Global Targets to improve maternal, infant, and young child nutrition should convene inclusive consultations to discuss the challenges of meeting the targets, what course cor-rections they can make, and what support they need. The findings should be reported at the 2016 Nutrition for Growth (N4G) Summit hosted by the Government of Brazil in Rio de Janeiro and at any equivalent global or regional reporting opportunity. All countries should establish national nutrition targets, based on recog-nized global targets. Countries should follow up these target commitments with stronger monitoring.
ACTIONS FOR ACCELERATING PROGRESSBecause the forces that cause malnutrition are powerful and multisectoral, they need to be counteracted by forces that are at least as powerful and wide-reaching. The GNR identifies seven areas of action, involving a large set of stakeholders, to accelerate malnutrition reduction.
First, the political environment for malnutrition reduc-tion has to be generated. Second, high-impact nutrition interventions need to reach more people. Third, sectors that are supportive of nutrition improvement must become active drivers of it. Fourth, policies to create healthy food environments need to be implemented. Fifth, more fund-ing is needed to scale up nutrition actions. Sixth, new part-
FIGURE 2 Countries on course to meet global targets, 2014 and 2015 data
Under-5 stunting Under-5 overweight Under-5 wasting Exclusive breastfeeding Anemia, women 15–49 years old
% o
f cou
ntrie
s on
trac
k
2014
201539
24
55 63
5967
32
5 5
Source: Authors.
Note: The data for anemia are the same as those presented in the Global Nutrition Report 2014. Total number of countries with data available to make this assessment are (1) Under-5 stunting (n=109 in 2014; 114 in 2015); (2) Under-5 overweight (n=99 in 2014; 109 in 2015); (3) Under-5 wasting (n=123 in 2014; 130 in 2015); (4) Exclusive breastfeeding (n=78); (5) Anemia (n=185).
FIGURE 3 Global dashboard for 8 global nutrition targets
39601579
63
84
8
115
67
39
5
32
63
242224
180
1036
190
193
185 53
3
Stunting children under 5
Wasting children under 5
Overweight children under 5
Anemia, women age 15–49 years
Exclusive breastfeeding, 0–6 months
Adult overweight + Obesity (BMI≥ 25)
Adult obesity (BMI≥ 30)
Adult diabetes high blood sugar
GLOBAL TARGET
MISSING DATA OFF COURSE, LITTLE/NO PROGRESS OFF COURSE, SOME PROGRESS ON COURSEON COURSE, AT RISK
NUMBER OF COUNTRIES AT VARIOUS STAGES OF PROGRESS AGAINST GLOBAL TARGETS ON NUTRITION
Source: Authors.
6
ners need to be engaged in the fight against malnutrition. Finally, accountability needs to be strengthened to reassure investors and citizens alike that efforts will have a positive impact on nutrition status.
BUILD A POLITICAL ENABLING ENVIRONMENT FOR MALNUTRITION REDUCTIONCountries that have reduced malnutrition quickly have done so within a strongly supportive political environment, usually with norms set by leaders in government. For example, in Maharashtra, a large state in India, a statewide Nutrition Mission was an important contributor to that state’s dramatic declines in stunting between 2006 and 2012. In Peru, a strong coalition of civil society groups led presidential candidates to publicly pledge to reduce malnu-trition. In Brazil, reductions in stunting are associated with the strong leadership and policies of the Lula government.
But commitment is not enough. For a truly enabling environment, commitment must be associated with strong demand, pressure for action, investments in implementa-tion capacity, and engagement across sectors to develop new initiatives. Together these four elements create a strong enabling environment for nutrition improvement. Measurement of such environments, while still in its infan-cy, is advancing rapidly with a suite of indicators includ-ing the Nutrition Landscape Information System (NLIS), the Hunger and Nutrition Commitment Index (HANCI), the Healthy Food Environment Policy Index (Food Epi), the Global Database on the Implementation of Nutrition Action (GINA), and the Scaling Up Nutrition (SUN) move-ment’s institutional transformation indicators.
At a global level, the SDG framework should be a key component of an enabling framework for nutrition. Despite evidence that improved nutrition is a driver of sustainable development, nutrition remains underrepre-
sented in the SDGs. First, in 2014 we reported that out of 169 SDG targets, nutrition is mentioned in only one; this situation has not changed. Second, at the time of writing of this report, overweight and obesity are not mentioned once in the entire SDG document. Finally, none of the three implementation targets for SDG 2 (“End hunger, achieve food security and improved nutrition, and promote sustainable agriculture”) mention nutrition actions.
CALL TO ACTION Leaders of the international finance institutions and the United Nations, mem-bers of Scaling Up Nutrition Lead Group, and other national nutrition champions should advocate strongly for the SDG Nutrition Indicators—proposed by the UN Standing Committee on Nutrition and supported by a broad group of civil society organizations—to be included in the indicator set put forward to the UN Statistical Commission by the end of 2015.
ENSURE NUTRITION INTERVENTIONS REACH THE PEOPLE WHO NEED THEMWe know which interventions are proven to reduce undernutrition; what we don’t know is whether they are reaching the people who need them. Data on the cover-age of specific undernutrition interventions—that is, the share of eligible people who are benefitting from the inter-vention—are limited. Of 12 proven interventions, 3 have internationally comparable coverage data, 3 have data collected on proxy indicators, and 6 have no internationally comparable data collected. Of the 6 interventions that do have coverage data, only 13 countries collect data on all of them. Existing data on these 6 interventions show that coverage varies widely between interventions and between and within countries.
FIGURE 4 Are people receiving nutrition-specific interventions?
87
80
57
50
35
29
29
13
1
Children 6–59 months who receive full coverage of Vitamin A supplements (n=63)
Children 12–15 months who are fed breastmilk (n=76)
Households consuming adequately iodized salt (n=40)
Early initiation of breastfeeding (proportion of children who were put tothe breast within 1 hour of birth)
Infants 0–5 months who were exclusively breastfed (n=84)
Proportion of pregnant women who received iron-folte supplementationfor 90+ days (n=28)
Children 6–23 months who receive minimum dietary diversity (n=41)
Children 6–23 months who receive a minimum acceptable diet (n=39)
Children 0–59 months with diarrhea who receive zinc treatment (n=27)
% OF PEOPLE IN EACH COUNTRY WHO NEED AN INTERVENTION AND RECEIVE IT (COVERAGE). MEDIAN FOR COUNTRIES WITH DATA
Source: Authors.
7
RECRUIT MORE SECTORS IN THE DRIVE TO IMPROVE NUTRITION Many sectors—agriculture; education; health; water, sani-tation, and hygiene; social protection—are important indi-rect drivers of nutrition because they affect the underlying drivers of malnutrition. The Framework for Action that emerged from the 2014 International Conference on Nu-trition (ICN2) pointed to this important role. These sectors can generate substantial positive impacts if they design policies and programs with attention to their effects on nutrition drivers. The nationwide reach and high levels of funding for these sectors increase their potential impact. To realize this potential, the nutrition community must contin-ue to clearly define not only the role these sectors can play in improving nutrition, but also the benefits they will reap. Table 2 provides examples of the potential mutual benefits accruing from greater sensitivity to nutrition needs.
CREATE HEALTHY FOOD ENVIRONMENTS Policies can promote healthy eating by making healthy food choices more available, affordable, and attractive. Such policies include nutrition labeling, restrictions on food marketing, taxes and subsidies on foods to encour-age healthy choices, school meal standards, limits on the percentage of certain ingredients in processed foods, greater availability of healthier foods in retail outlets, and links between school feeding programs and local farmers. While evidence of the benefits of healthy food environ-ments is less extensive than it is for programs targeting undernutrition, it is clear that the food environment has potential to improve eating patterns. Yet most countries have not implemented the comprehensive suite of policies needed, and no low-income countries have tried such measures. In a sample of 67 countries that have imple-mented these interventions, 63 percent are high-income
countries; 27 percent, upper-middle-income countries; and 10 percent, lower-middle-income countries.
CALL TO ACTION Governments, international agencies, civil society organizations, and businesses should implement the ICN2 Framework for Action, which addresses malnutrition in all its forms. To encour-age action, FAO and WHO should, by the end of 2016, develop objective and verifiable indicators for deter-mining how well the Framework for Action is being implemented. Civil society should raise awareness and mobilize support for implementing the framework and highlight areas where progress is lagging. To encour-age a focus on malnutrition in all its forms, researchers should identify actions that can do double duty and address both undernutrition and obesity/nutrition-relat-ed noncommunicable diseases synergistically.
INCREASE FUNDING FOR NUTRITION AND MAXIMIZE ITS IMPACTSpeeding up nutrition improvements will require govern-ments and aid donors to increase their nutrition spending and deliver greater impact per dollar, rupee, or birr.
Governments currently spend only a tiny share of their budgets on nutrition—as far as we know, for data are scarce. Preliminary estimates of national budget shares for nutrition are newly available from 30 countries. Fourteen of these countries have estimates of nutrition-sensitive in-vestments (that is, investments whose main objective is not improving nutrition but which can increase people’s food and nutrition security). In these countries, nutrition-sen-sitive allocations average 1.32 percent. Most countries spend even less on nutrition-specific interventions (Figure 4), whose primary goal is to improve nutrition. For 12
TABLE 2 Benefits of increasing the nutrition focus of different sectors
SectorExample of how to make sector more nutrition-focused Example of sectoral benefits
Example of benefits for nutrition outcomes
Agriculture Invest in R&D for nutritious foods, such as pulses, fruits, and vegetables.
Supports transition to more diverse agricultural system and higher-value crops.
More than 2 billion people are micronu-trient deficient; inadequate consumption of fruits and vegetables is associated with noncommunicable diseases.
Education Introduce incentives to keep girls in school to delay age at marriage and first birth.
Make nutrition education and food skills man-datory in school curriculum and provide healthy meals in school.
Increased attendance is necessary to improve educational attainment.
Better nutrition improves attentiveness and learning in schools.
Higher age at first pregnancy is correlated with more positive birth outcomes. Nu-trition education and skills foster healthy diets.
Safety nets Combine cash transfers with behavior-change communication for infant and young-child feeding and for healthy eating.
Helps break intergenerational cycle of poverty as well as reduce current poverty.
Improved nutrition requires behavior change and income transfers.
Water, sanitation, and hygiene
Focus on reducing infants’ and children’s ingestion of dirt and feces.
Blocks previously invisible pathways to pathogen intake, which is good for all in community.
Lower infectious disease burdens allow people to use nutrients for growth.
Source: Authors.
8
out of 14 countries, allocations to nutrition-specific line items are less than or equal to 0.2 percent of government budgets.
Aid donors can also do better. Donors’ disbursements on nutrition-specific interventions nearly doubled between 2012 and 2013—from US$0.56 billion to US$0.94 billion. However, of 29 members of the Development Assistance Committee (DAC) of the Organisation for Economic Co-operation and Development (OECD), only 16 reported nutrition-specific spending greater than US$1 million in 2013. Six reported spending less than US$1 million, and 7 reported no nutrition-specific spending.
Donors spend more on nutrition-sensitive interventions than on nutrition-specific ones. For 2013, nutrition-sensi-tive disbursements totaled nearly US$3 billion. The 2013 data from the EU and World Bank, however, are miss-ing. The inclusion of these figures would likely put total nutrition-sensitive disbursements closer to US$4 billion, or 3 percent of official development assistance (ODA), and bring total ODA nutrition-specific and nutrition-sensitive spending close to US$5 billion, or 4 percent of ODA.
How much more should governments and donors spend? An analysis from Results for Development Institute (R4D) and the World Bank suggests that achieving the WHA stunting target in 37 high-burden countries would require more than doubling government domestic spend-ing on proven stunting interventions through 2025 and more than quadrupling ODA to such interventions over the same period.
Capacity—including leadership at all levels—is vital for scaling up nutrition action and nutrition impact, but little is known about when lack of capacity is a bottleneck and what investments are most effective for addressing it.
CALL TO ACTION Governments and donors spend far too little to meet global nutrition targets by 2025. Accordingly, governments should—at a mini-mum—double the share of their budgets allocated to improving nutrition. Donor spending on nutrition will also need to more than double. To justify calls for more funding, governments and donors should continue to invest in ways of delivering better nutri-tion outcomes with existing funding, demonstrating improvements in quality and effectiveness of inter-ventions. Governments should continue to document their nutrition spending and engage with researchers to determine costs of nutrition strategies. Donors should report their disbursements, and civil society organizations should continue to call for transparent budgets. Governments and donors should increase their work with researchers to estimate appropriate budget allocations to obesity and nutrition-related noncommunicable diseases.
ENGAGE NEW ACTORS IN FIGHT AGAINST MALNUTRITIONTo accelerate improvements in nutrition, we need to broaden the range of sectors that recognize their stake in reducing malnutrition and then act on it. Two sectors that are hiding in plain sight and have not received as much at-tention as they should are climate change and food systems.
Climate changeGiven that disease, food, and climate are intimately linked, any agreement reached at the United Nations Conference on Climate Change (COP21) in November 2015 could present opportunities for those involved in nutrition and climate change to work together to advance their overlap-ping agendas. The evidence suggests multiple pathways
FIGURE 5 How stunting varies by month of birth for Indian children under age 3
-1.0
-0.8
-0.6
-0.4
-0.2
0.0
0.2
MONTH OF BIRTH
1992 1998 2005
Janua
ry
Februa
ryMarc
hApri
lMay Jun
eJul
yAug
ust
Septem
ber
October
November
December
Heig
ht-fo
r-age
Z-s
core
of c
hild
ren
unde
r age
3, r
elat
ive
to D
ecem
ber
Source: Adapted from results in Lohksin and Radyakin (2012).
Note: Data come from three rounds of the National Family Health Survey and are for households with two or more children under age 3. Winter = Decem-ber–March; summer = April–June; monsoon = July–September; autumn = October–November.
through which climate change influences nutrition. These pathways—physical, biological, social, and economic—are outlined in the report. For the poorest groups in society, seasonal fluctuations in food access and drivers of infec-tious disease remain a reality. These cycles have a profound effect on nutrition status, season by season (Figure 5). This vulnerability of nutrition to regular weather cycles provides a stark indicator of the vulnerability of certain populations to the weather extremes that climate change is expected to unleash.
Different diets drive different production systems and have different greenhouse gas emissions and resource footprints. On average, meat-rich diets tend to have larger footprints. Dietary choices that are good for health can also be good for the planet, and more could be done to foster production systems that both improve human nutrition and reduce greenhouse gas emissions. Countries are beginning to incorporate climate change considerations into national nutrition plans. But there are major gaps in data, knowl-edge, policy, and practice that need to be rapidly filled if win-win opportunities for improving nutrition while mitigat-ing and adapting to climate change are to be realized.
CALL TO ACTION By the time of the United Nations Conference on Climate Change (COP21) in November 2015, the climate change and nutrition communities should form alliances to meet com-mon goals. The Intergovernmental Panel on Climate Change (IPCC) should form a group comprising nutrition, health, and climate experts to assess the climate-nutrition literature and define new research and policy agendas. Governments should build cli-mate change explicitly into their national nutrition and health strategies. And civil society should use existing networks to build climate change–nutrition alliances to advocate for nutrition at the COP21 and other leading climate change events and processes.
Food systemsIn 2014, the Second International Conference on Nutrition highlighted the critical role of food systems for malnu-trition in all its forms. Growing evidence on the rise of obesity and nutrition-related noncommunicable disease, even among populations suffering from undernutrition, makes it increasingly clear that food systems are drivers of nutrition outcomes. But how to make food systems more nutrition friendly? The first step is to take the nutrition “temperature” of different food systems to assess how they need to be modified. Establishing outcome indica-tors for food systems can guide policymakers in fostering nutrition-friendly and sustainable food systems while also helping citizens hold their governments accountable for their policy choices.
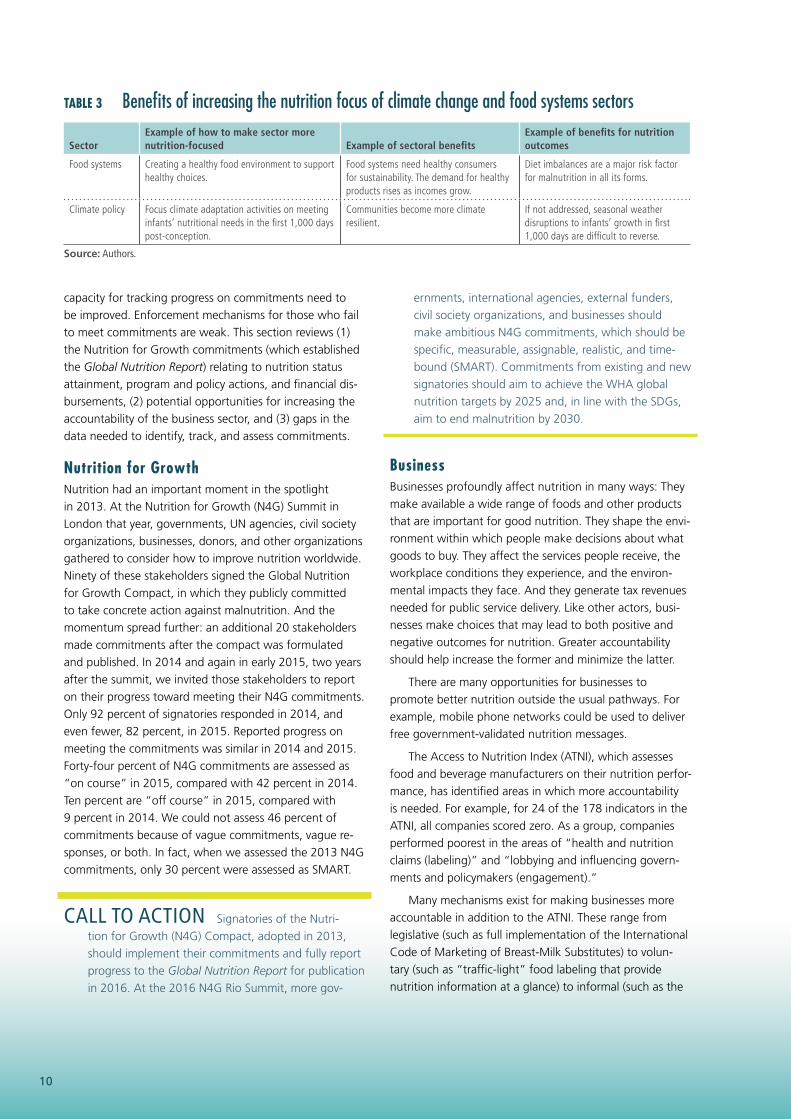
Like the sectors already discussed that have begun to incorporate nutrition sensitivity, the climate change and food systems policy communities need to be informed about the mutual benefits of incorporating nutrition con-siderations into policy design (Table 3).
CALL TO ACTION Building on the food systems focus of the 2014 Second International Conference on Nutrition, global food systems initiatives should, by the end of 2016, propose indicators of the impact of food systems on nutrition and health outcomes.
STRENGTHEN ACCOUNTABILITY IN NUTRITIONStronger mechanisms are urgently needed to ensure that nutrition commitments result in action and spur potential new champions and investors to make greater efforts for nutrition. Nutrition stakeholders need to strengthen the link from commitments to measurable outcomes. Too few nutrition commitments are specific, measurable, assign-able, realistic, and time-bound (SMART). Databases and
Panos/M. Ostergaard
10
capacity for tracking progress on commitments need to be improved. Enforcement mechanisms for those who fail to meet commitments are weak. This section reviews (1) the Nutrition for Growth commitments (which established the Global Nutrition Report) relating to nutrition status attainment, program and policy actions, and financial dis-bursements, (2) potential opportunities for increasing the accountability of the business sector, and (3) gaps in the data needed to identify, track, and assess commitments.
Nutrition for GrowthNutrition had an important moment in the spotlight in 2013. At the Nutrition for Growth (N4G) Summit in London that year, governments, UN agencies, civil society organizations, businesses, donors, and other organizations gathered to consider how to improve nutrition worldwide. Ninety of these stakeholders signed the Global Nutrition for Growth Compact, in which they publicly committed to take concrete action against malnutrition. And the momentum spread further: an additional 20 stakeholders made commitments after the compact was formulated and published. In 2014 and again in early 2015, two years after the summit, we invited those stakeholders to report on their progress toward meeting their N4G commitments. Only 92 percent of signatories responded in 2014, and even fewer, 82 percent, in 2015. Reported progress on meeting the commitments was similar in 2014 and 2015. Forty-four percent of N4G commitments are assessed as “on course” in 2015, compared with 42 percent in 2014. Ten percent are “off course” in 2015, compared with 9 percent in 2014. We could not assess 46 percent of commitments because of vague commitments, vague re-sponses, or both. In fact, when we assessed the 2013 N4G commitments, only 30 percent were assessed as SMART.
CALL TO ACTION Signatories of the Nutri-tion for Growth (N4G) Compact, adopted in 2013, should implement their commitments and fully report progress to the Global Nutrition Report for publication in 2016. At the 2016 N4G Rio Summit, more gov-
ernments, international agencies, external funders, civil society organizations, and businesses should make ambitious N4G commitments, which should be specific, measurable, assignable, realistic, and time-bound (SMART). Commitments from existing and new signatories should aim to achieve the WHA global nutrition targets by 2025 and, in line with the SDGs, aim to end malnutrition by 2030.
BusinessBusinesses profoundly affect nutrition in many ways: They make available a wide range of foods and other products that are important for good nutrition. They shape the envi-ronment within which people make decisions about what goods to buy. They affect the services people receive, the workplace conditions they experience, and the environ-mental impacts they face. And they generate tax revenues needed for public service delivery. Like other actors, busi-nesses make choices that may lead to both positive and negative outcomes for nutrition. Greater accountability should help increase the former and minimize the latter.
There are many opportunities for businesses to promote better nutrition outside the usual pathways. For example, mobile phone networks could be used to deliver free government-validated nutrition messages.
The Access to Nutrition Index (ATNI), which assesses food and beverage manufacturers on their nutrition perfor-mance, has identified areas in which more accountability is needed. For example, for 24 of the 178 indicators in the ATNI, all companies scored zero. As a group, companies performed poorest in the areas of “health and nutrition claims (labeling)” and “lobbying and influencing govern-ments and policymakers (engagement).”
Many mechanisms exist for making businesses more accountable in addition to the ATNI. These range from legislative (such as full implementation of the International Code of Marketing of Breast-Milk Substitutes) to volun-tary (such as “traffic-light” food labeling that provide nutrition information at a glance) to informal (such as the
TABLE 3 Benefits of increasing the nutrition focus of climate change and food systems sectors
SectorExample of how to make sector more nutrition-focused Example of sectoral benefits
Example of benefits for nutrition outcomes
Food systems Creating a healthy food environment to support healthy choices.
Food systems need healthy consumers for sustainability. The demand for healthy products rises as incomes grow.
Diet imbalances are a major risk factor for malnutrition in all its forms.
Climate policy Focus climate adaptation activities on meeting infants’ nutritional needs in the first 1,000 days post-conception.
Communities become more climate resilient.
If not addressed, seasonal weather disruptions to infants’ growth in first 1,000 days are difficult to reverse.
Source: Authors.
11
global monitoring network INFORMAS). However, given the relative capacities of some governments and large corporations, implementation and enforcement of these mechanisms are likely to be weak.
Moving business activity toward more positive nu-tritional outcomes will require a number of elements, including
1. leadership to bring all parties to the table to generate a shared understanding of opportunities, roles, and responsibilities (via the establishment of a time-bound commission),
2. more transparent actions by businesses and those working with them (such as a register of public-private partnerships or the adoption of a Nutrition Business Transparency Initiative),
3. more robust evidence on the influence of different types of businesses on nutrition outcomes (for example, from new dedicated research programs),
4. metrics and criteria to guide decisions about appro-priate engagement of governments and international agencies with businesses (ATNI is one example of what can be achieved to shed more light on business conduct and disclosure),
5. stronger government frameworks for regulating businesses, and
6. stronger accountability and enforcement mechanisms (such as the establishment of a fund to support govern-ment efforts to implement legislation).
CALL TO ACTION Once the WHO Framework of Engagement with Non-State Actors is finalized, the four large UN agencies most concerned with nutrition—Food and Agriculture Organization (FAO), UNICEF, World Food Programme (WFP), and WHO—
together with other relevant international bodies, should establish an inclusive, time-bound commission to clarify the roles and responsibilities of business in nutrition.
Data gapsData are the currency of accountability. While some data gaps have been filled since 2014—we now have more data on governments’ budget allocations for nutrition, for example—many data gaps remain large. For example, only 74 of 193 countries have sufficient data to be able to assess their progress on five global maternal and child nutrition targets (Figure 6).
Data are missing in other important areas too. We need more data on the coverage rates of nutrition in-terventions, the nutrition sensitivity of nutrition actions in other sectors, and the enabling political environment. High-income countries need to provide more nutrition data to UN databases. A particular priority should be collection of more data on the diets of 6- to 23-month-olds, given the severe and lifelong consequences of poor diets during this stage of development. And researchers need to pay more attention to the seasonality of data collection, if the nutrition effects of a changing climate are to be anticipat-ed and addressed—a child’s nutrition status should not be determined by its month of birth.
CALL TO ACTION Countries, donors, and agencies should work with the technical nutrition community to identify and prioritize the data gaps that are preventing action, and invest in the capacity needed to fill those gaps. All countries, including high-income countries, should reach out to UN agen-cies to facilitate the conversion of their own data into international databases compiled by the UN agencies.
FIGURE 6 Number of countries that have data to assess progress on five WHA targets, 2015
Note: The five indicators are stunting, wasting, and overweight among children under 5, exclusive breastfeeding, and anemia in women of reproductive age. Total number of countries is 193.
SIGNIFICANT ACHIEVEMENTS ARE POSSIBLE BY 2030Often parents have to make terrible choices—which child to take to the health clinic, which child will eat the best food, or which child will drink the cleanest water. Policy-makers do not have to make such choices; they can reduce malnutrition in all its forms. The recent progress seen in reducing stunting likely reflects concerted interventions—namely, the focus on the first 1,000 days. Now this kind of focus should be applied to improving the diets of adoles-cent girls and women and to reducing adult overweight and obesity. Progress can be made in reducing malnutrition in all its forms: countries that are determined to make rap-id advances in malnutrition reduction can do so. The Glob-al Nutrition Report provides pointers to the many policy, program, and investment opportunities available to make
these advances, as well as numerous examples of countries that have surprised the world with their swift progress.
In 2016, three years after the groundbreaking London N4G Summit, Brazil will host the Rio N4G Summit. An enormous amount has been accomplished since 2013, and we should be proud of this. But it is not enough. During the lead-up to the 2016 summit, governments, businesses, civil society groups, foundations, multilateral agencies, and concerned citizens need to make new commitments that can be announced in August in Rio de Janeiro.
These commitments must be SMART and breathtak-ingly ambitious; those experiencing malnutrition do not need fuzzy or timid commitments. Almost one in three of us who share this planet today are experiencing malnutri-tion. The pledges should be for nothing less than to end malnutrition. It’s a choice.
Lawrence Haddad (cochair), International Food Policy Research Institute, Washington, DC; Corinna Hawkes (cochair) Independent, UK; Emorn Udom-kesmalee (cochair), Mahidol University, Bangkok, Thailand; Endang Achadi, University of Indonesia, Jakarta; Arti Ahuja, Women and Child Development, Odisha, India; Mohamed Ag Bendech, Food and Agriculture Organization of the United Nations, Rome; Komal Bhatia, Institute of Development Studies, Brighton, UK; Zulfiqar Bhutta, University of Toronto, Canada; Monika Blossner, World Health Organization, Geneva; Elaine Borghi, World Health Organi-zation, Geneva; Kamilla Eriksen, University of Cambridge, UK; Jessica Fanzo, Johns Hopkins University, Baltimore; Patrizia Fracassi, Scaling Up Nutrition Secretariat, Switzerland; Laurence M. Grummer-Strawn, World Health Organization, Geneva; Elizabeth Kimani, African Population and Health Research Centre, Nairobi, Kenya; Julia Krasevec , UNICEF, New York, NY; Natasha Ledlie, International Food Policy Research Institute, Washington, DC; Yves Mar-tin-Prével, Institut de recherche pour le développement, Marseille, France; Purnima Menon, International Food Policy Research Institute, New Delhi; Eunice Nago Koukoubou, University of Abomey-Calavi, Benin; Holly Newby, UNICEF, New York, NY; Rachel Nugent, University of Washington, Seattle; Stineke Oenema, Interchurch organization for development cooperation (ICCO) Alliance, Utrecht, Netherlands; Leonor Pacheco Santos, University of Brasilia, Bra-zil; Judith Randel, Development Initiatives, Bristol, UK; Jennifer Requejo, Partnership for Maternal, Newborn & Child Health, World Health Organization, Geneva; Tara Shyam, Institute of Development Studies, Brighton, UK; Boyd Swinburn, University of Auckland, New Zealand.
All contributors are members of the Independent Expert Group for the Global Nutrition Report 2015, except Komal Bhatia, Mokina Blossner, Elaine Borghi, Kamilla Eriksen, Jessica Fanzo, Julia Krasevec, Natasha Ledlie, and Tara Shyam, who have been a day-to-day part of the writing team.
This is a peer-reviewed publication. Any opinions stated herein are those of the authors and are not necessarily representative of or endorsed by the International Food Policy Research Institute or any of the partner organizations involved in the Global Nutrition Report. The boundaries and names used do not imply official endorsement or acceptance by the International Food Policy Research Institute.
INTERNATIONAL FOOD POLICY RESEARCH INSTITUTEA world free of hunger and malnutrition