Page 1
MQP BXT 0901
System Engineer Account
Logistics Dashboard (SEALD)
A Major Qualifying Project
submitted to the Faculty
of the
WORCESTER POLYTECHNIC INSTITUTE
in partial fulfillment of the requirements for the
Degree of Bachelor of Science
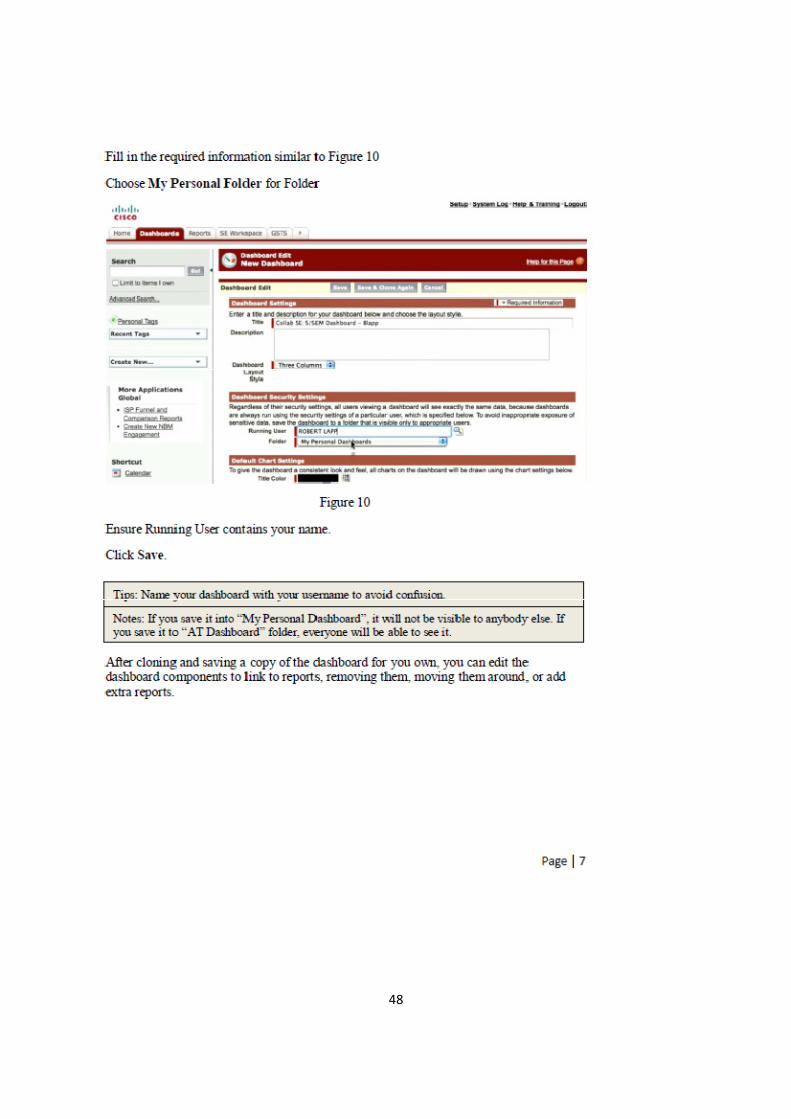
by
Nhi Dao, MIS
Rui Dai, MIS
Brian Ketterer, MIS
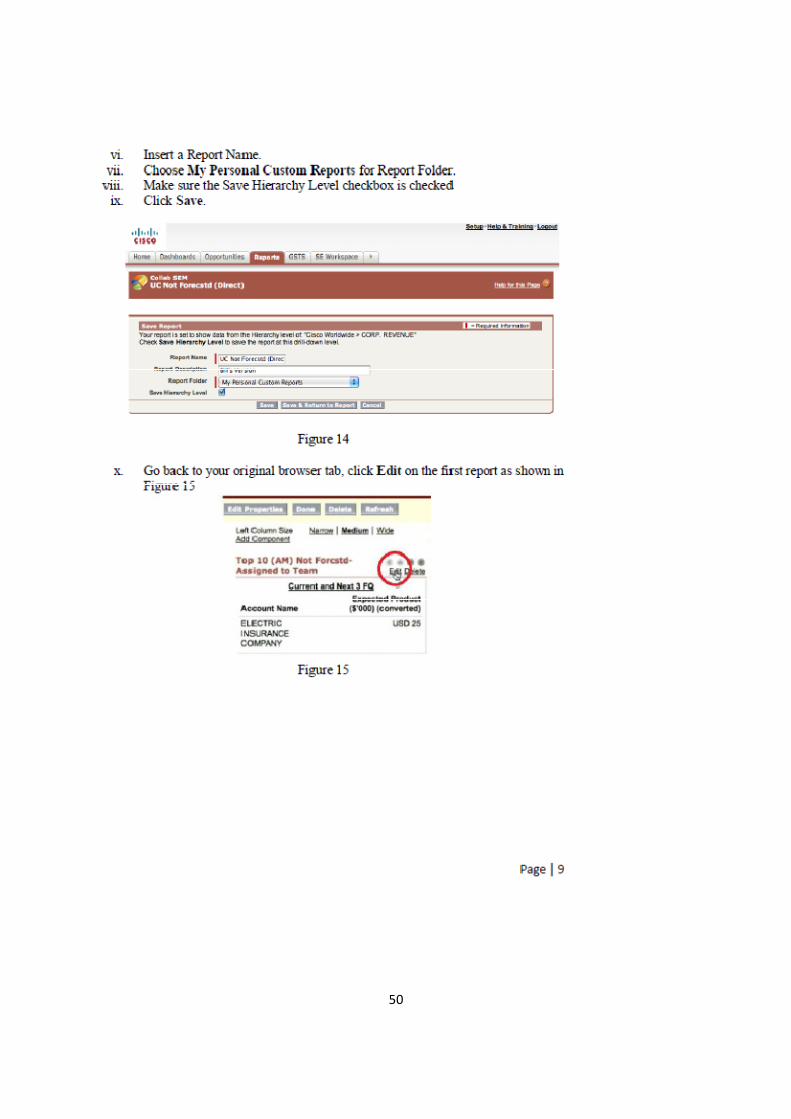
John Russo, MIS
Date: March 21, 2010
Sponsored by:
Robert Lapp, Jr.
Cisco Systems, Inc
Approved by:
Professor Bengisu Tulu, Advisor
Page 2
i
Abstract
The absence of a standard method to track sales assistance requests lead to wasted resources,
collaboration road blocks, and an inability to track key metrics in Cisco. This project aimed to alleviate
such issues by implementing dashboards and reports in Cisco’s Salesforce.com portal, using agile
development methodology. The project concluded with interviews with end users, the results of which
provided useful insights for a better system adoption.
Page 3
ii
Executive Summary
Cisco did not have a standard method to track sales assistance requests, which lead to wasted
resources, collaboration road blocks, and an inability to assess performance. To solve some of these
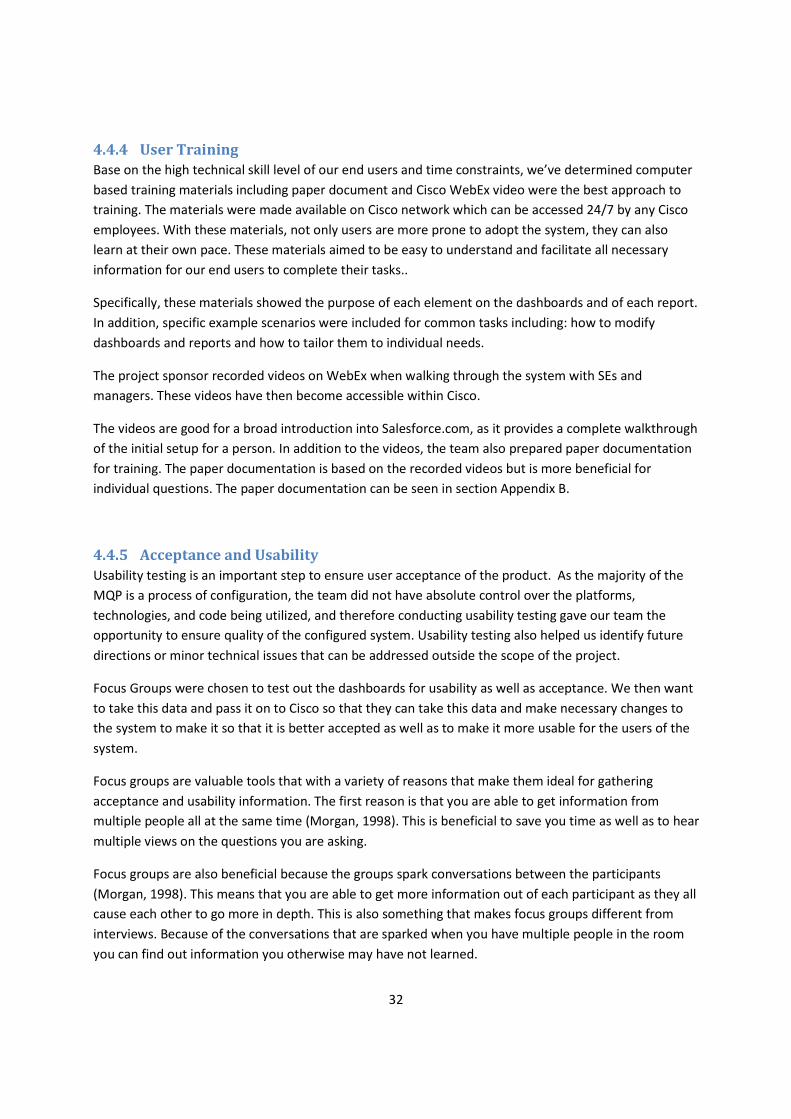
issues, the MQP team designed two dashboards and their underlying reports in Salesforce.com (SFDC).
These dashboards were created for the System Engineer Managers (SEMs) and System Engineers (SEs)
(1) to enable effective and efficient resource allocation, (2) to improve collaboration between AM & SE,
and (3) to enable SEMs to better monitor opportunities.
The goal with the new dashboard system was to have Account Managers (AMs) enter the opportunities
into SFDC, and then in SFDC have the AMs assign the newly entered opportunities to the SE needed for
the opportunity. With this new system the AMs would have one single system to assign SEs to
opportunities and the SEs would have one single system to check the opportunities they were working
on, all of which visible to the SEMs.
To start the project, we first completed background research regarding business intelligence, CRM
systems, and the Texas Resource Optimization Pilot (TROP), which was a test system developed
internally at Cisco to improve expertise utilization. We held formal meetings with our sponsor to identify
the appropriate information and graphics to be presented on the dashboards and reports.
Using these requirements, we developed a user interface prototype of the dashboards in Excel and used
this visual representation to collect initial feedback. We also used this prototype in our first presentation
to receive additional feedback from SEs and SEMs; and modified the prototype accordingly until the
requirements were clarified.
When requirements gathering and design phases were complete, we moved on to the implementation
phase. We decided to use agile development methodology for our system due to the short time frame
of our project. This methodology allowed us to create reports and receive feedback on the reports
quickly while actively and closely interacting with business users. We continued to update the
dashboards and reports until they met the needs of the users. The dashboards were finished by early
2010 and became immediately available for SEMs and SEs for business use. In early February there were
15 managers and 80-85 engineers using the system. The initial adoption rate was estimated to be above
the 50% level.
After go-live date, we decided to collect formal user feedback. We believed that focus groups would be
the most optimal method for such purpose. We prepared a focus-group invitation email that was sent to
all SEs and SEMs by our sponsor. Due to low response rate to our invitation, we decided to move
forward with personal interviews instead of focus groups. The interviews were a success even though
they were not our original plans. One SEM and two SEs participated in our interviews and offered us
valuable perspectives.
This project was a necessary and critical step for Cisco to improve the visibility of sales and support
activities. The investigation of the user feedback was able to provide Cisco with additional and valuable
recommendations regarding the system. Some of the major recommendations for the system are to
Page 4
iii
drive adoption and ensure quality data and usage of the system, to continue to work with SFDC to
customize and provide enhancements for the system, and to implement domain integration within the
system.
Page 7
vi
Acknowledgements
We would like to extend our deep and sincere appreciation to our project sponsor, Cisco Systems, who
has supported our project throughout. We would also like to thank all the Cisco employees, including Bill
Lapp, Jon Grady, Dan Jones, and many others who we have talked to and consulted with. Without their
involvement, commitment, and support, this project would not have been possible.
We also appreciate our project advisor, Professor Bengisu Tulu, who has offered us generous and
valuable advice and guidance. Her support and encouragement have tremendously helped us conculde
this project with success.
Last but not the least, we would like to thank the Department of Management at Worcester Polytechnic
Institute for having provided us with this remarkable and challenging senior project experience to
conclude our college study.
Page 8
vii
Authorship and Contributions
This project deliverable presents both the collective and individual works of the project team members.
The team has contributed collectively to the following sections: Abstract, Planning Phase, Design Phase,
Implementation Phase, SEM Dashboard, SE Dashboard, Rollout Timeline, and Acceptance and Usability.
Individually, Brian Ketterer took the responsibility to write CRM in the Cloud, Requirements Gathering,
User Training, Executive Summary, and Focus Group Interviews. John Russo took the responsibility to
write Introduction, Cisco History, Competitive Landscape, Enterprise Networking, Unified
Communications, CRM and Web 2.0, and Systems Development Life Cycle. Nhi Dao took the
responsibility to write Salesforce.com (SFDC), Current Product and Services, Cisco’s use on SFDC, Impact
of CRM in the Organization, and Training Material. Rui Dai took the responsibility to write Texas
Resource Optimization Pilot, Business Intelligence, CRM Interfaces for Effective Decision Making, Agile
development, and Requirements.
Page 9
viii
Table of Contents
Abstract .......................................................................................................................................................... i
Executive Summary ....................................................................................................................................... ii
Sponsor Letter .............................................................................................................................................. iv
Acknowledgements ...................................................................................................................................... vi
Authorship and Contributions .................................................................................................................... vii
List of Figures ................................................................................................................................................ x
List of Tables ............................................................................................................................................... xii
1 Introduction .......................................................................................................................................... 1
2 Background ........................................................................................................................................... 2
2.1 Cisco History .................................................................................................................................. 2
2.2 Competitive Landscape ................................................................................................................. 3
2.2.1 Enterprise Networking .......................................................................................................... 4
2.2.2 Unified Communications ....................................................................................................... 6
2.3 Texas Resource Optimization Pilot ............................................................................................... 7
2.4 Salesforce.com (SFDC) ................................................................................................................ 10
2.4.1 Current Product and Services ............................................................................................. 11
2.4.2 Cisco’s use on SFDC ............................................................................................................. 11
2.5 Business Intelligence ................................................................................................................... 12
2.5.1 Importance and Future ....................................................................................................... 12
2.5.2 Related Technologies .......................................................................................................... 12
2.6 CRM Literature Review ............................................................................................................... 13
2.6.1 CRM Interfaces for Effective Decision Making .................................................................... 13
2.6.2 CRM in the Cloud ................................................................................................................ 14
2.6.3 CRM and Web 2.0 ............................................................................................................... 14
2.6.4 Impact of CRM in the Organization ..................................................................................... 15
3 Methodology ....................................................................................................................................... 16
3.1 Systems Development Life Cycle ................................................................................................ 16
3.2 Agile development ...................................................................................................................... 17
4 Results ................................................................................................................................................. 18
4.1 Planning Phase ............................................................................................................................ 18
4.2 Analysis Phase ............................................................................................................................. 19
Page 10
ix
4.2.1 Requirements Gathering ..................................................................................................... 19
4.2.2 Requirements ...................................................................................................................... 19
4.3 Design Phase ............................................................................................................................... 20
4.4 Implementation Phase ................................................................................................................ 21
4.4.1 SEM Dashboard ................................................................................................................... 23
4.4.2 SE Dashboard ...................................................................................................................... 28
4.4.3 Rollout Timeline .................................................................................................................. 31
4.4.4 User Training ....................................................................................................................... 32
4.4.5 Acceptance and Usability .................................................................................................... 32
5 Conclusions ......................................................................................................................................... 37
6 Bibliography ........................................................................................................................................ 39
Appendix A Project plan ......................................................................................................................... 41
Appendix B Training Material ................................................................................................................. 42
Appendix C Focus Group Interview ........................................................................................................ 53
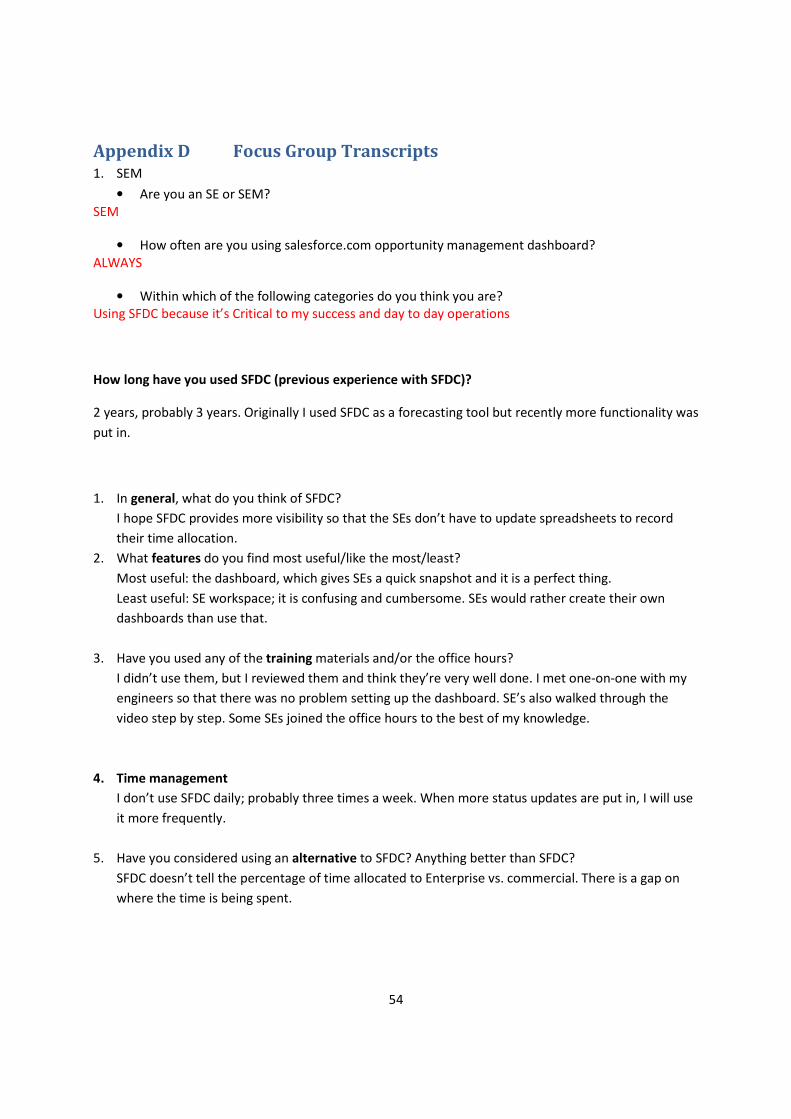
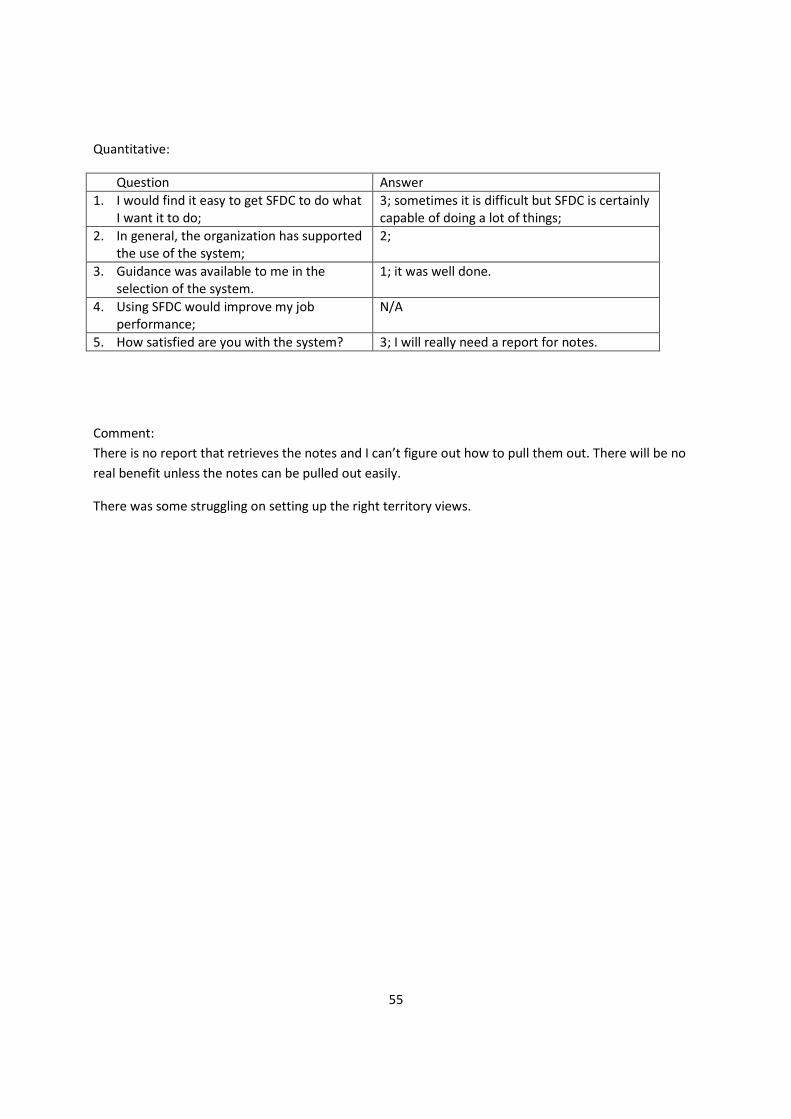
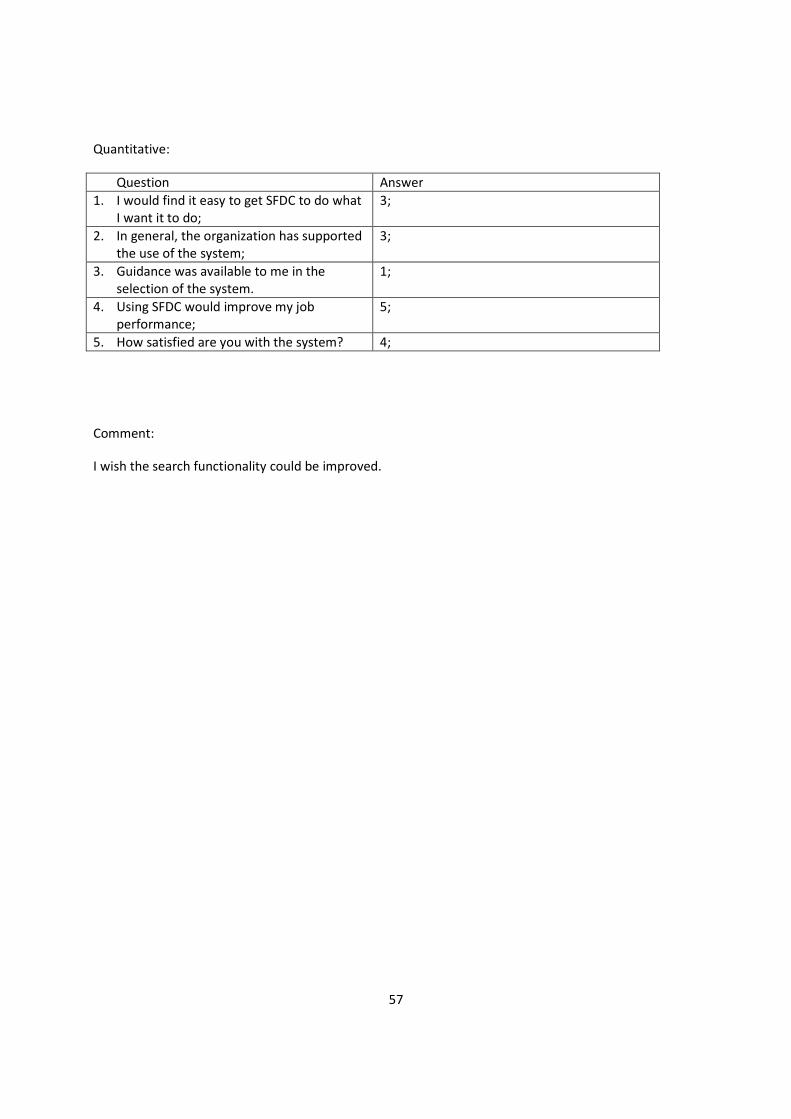
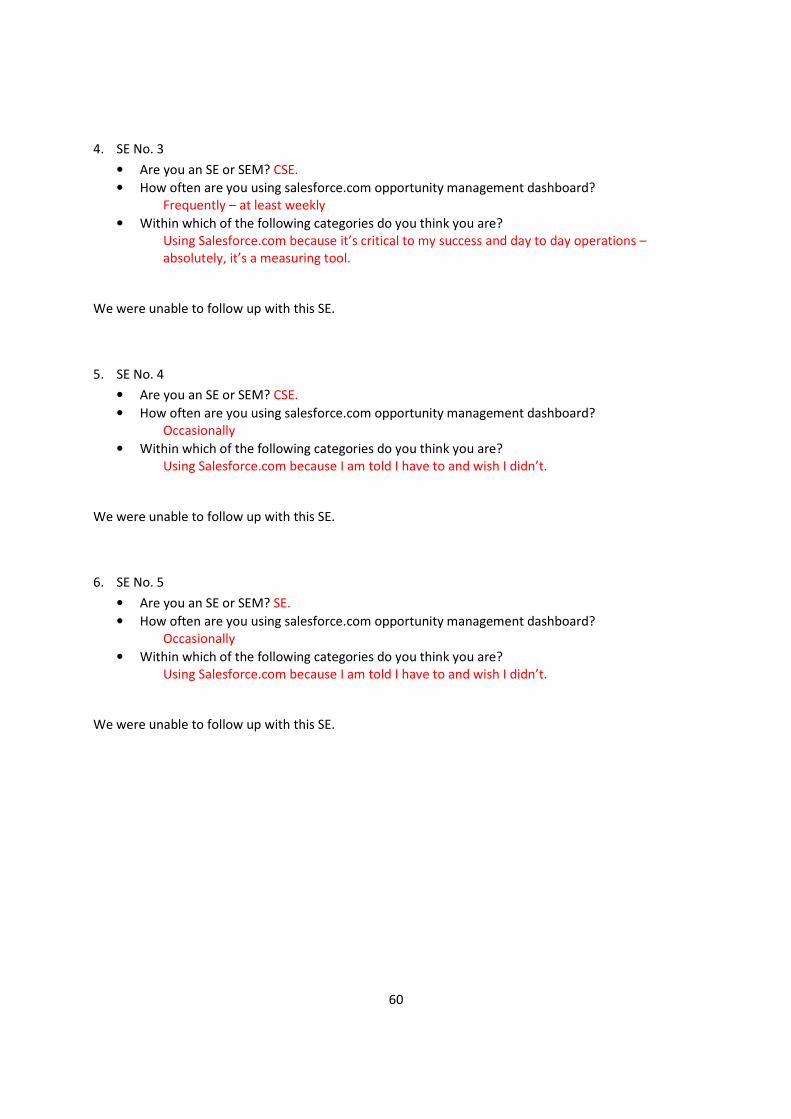
Appendix D Focus Group Transcripts ..................................................................................................... 54
Page 11
x
List of Figures
Figure 1. Magic Quadrant for Enterprise LAN (Global). ................................................................................ 4
Figure 2. Magic Quadrant for Wireless LAN Infrastructure (Global). ........................................................... 5
Figure 3: Magic Quadrant for Network Access Control ................................................................................ 6
Figure 4: Magic Quadrant for Unified Communications ............................................................................... 7
Figure 5. TX Expert Optimization Pilot. ......................................................................................................... 8
Figure 6. TROP requests in Utopia. ............................................................................................................... 8
Figure 7. TROP discussions. ........................................................................................................................... 9
Figure 8. Expert Locator. ............................................................................................................................. 10
Figure 9. SEM Dashboard Mockup .............................................................................................................. 20
Figure 10. SE Dashboard Mockup ............................................................................................................... 20
Figure 11. SEM Dashboard Overview. ......................................................................................................... 22
Figure 12. SE Dashboard Overview. ............................................................................................................ 22
Figure 13. Top 10 AM Not Forecasted ........................................................................................................ 23
Figure 14. Top 10 AM Upside ...................................................................................................................... 23
Figure 15. Top 10 AM Commit .................................................................................................................... 23
Figure 16. Top 10 PSS Not Forecasted ........................................................................................................ 24
Figure 17. Top 10 PSS Upside ...................................................................................................................... 24
Figure 18. Top 10 PSS Commit .................................................................................................................... 24
Figure 19. Top 10 AM Not Forecasted - Uncovered ................................................................................... 24
Figure 20. Top 10 AM Upside - Uncovered ................................................................................................. 24
Figure 21. Top 10 AM Commit - Uncovered ............................................................................................... 24
Figure 22. # of opportunities per technology. ............................................................................................ 25
Figure 23. # of Opps assigned to team by segment. ................................................................................... 25
Figure 24. Revenue assigned to team by segment. .................................................................................... 25
Figure 25. # of opps assigned to team by region. ....................................................................................... 26
Figure 26. Revenue assigned to team by region. ........................................................................................ 26
Figure 27. Top 10 Stalled Deals - SE Assigned ............................................................................................. 26
Figure 28. Total Revenue per SE. ................................................................................................................ 27
Figure 29. # of Opportunities Completed by SE. ......................................................................................... 27
Figure 30. Assigned Opportunities by SE Name. ......................................................................................... 27
Figure 31. Opportunities vs. SE Assigned. ................................................................................................... 27
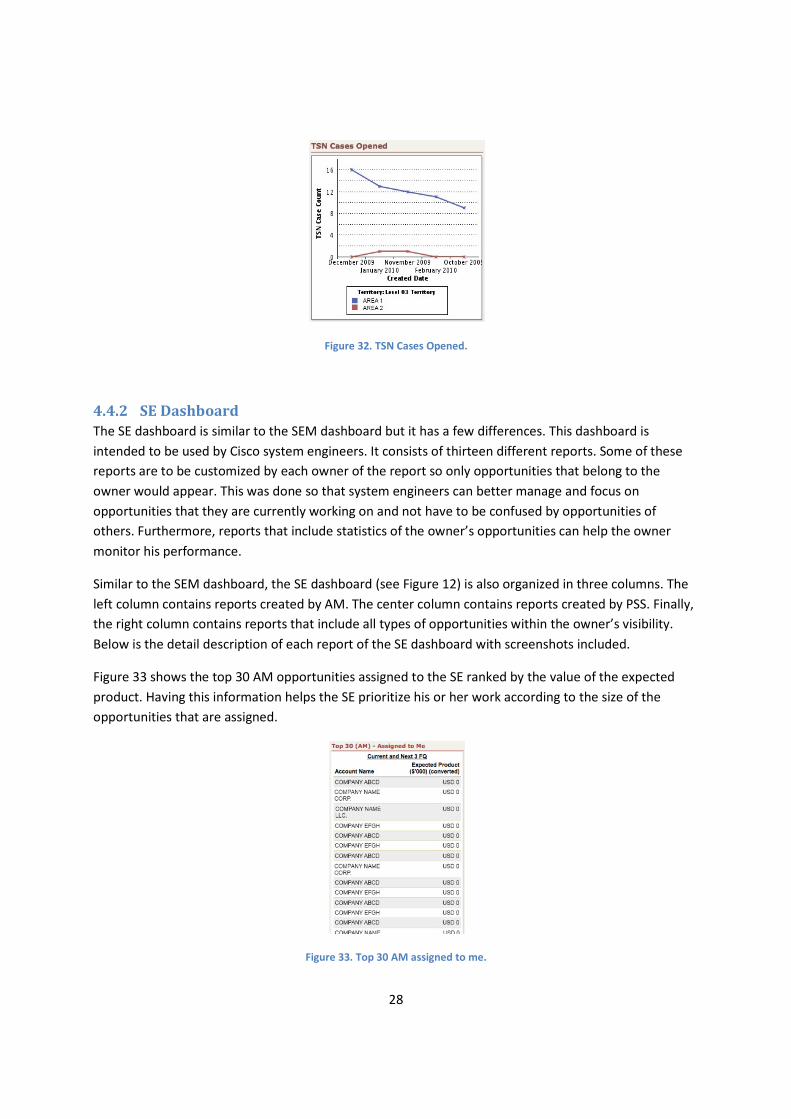
Figure 32. TSN Cases Opened. .................................................................................................................... 28
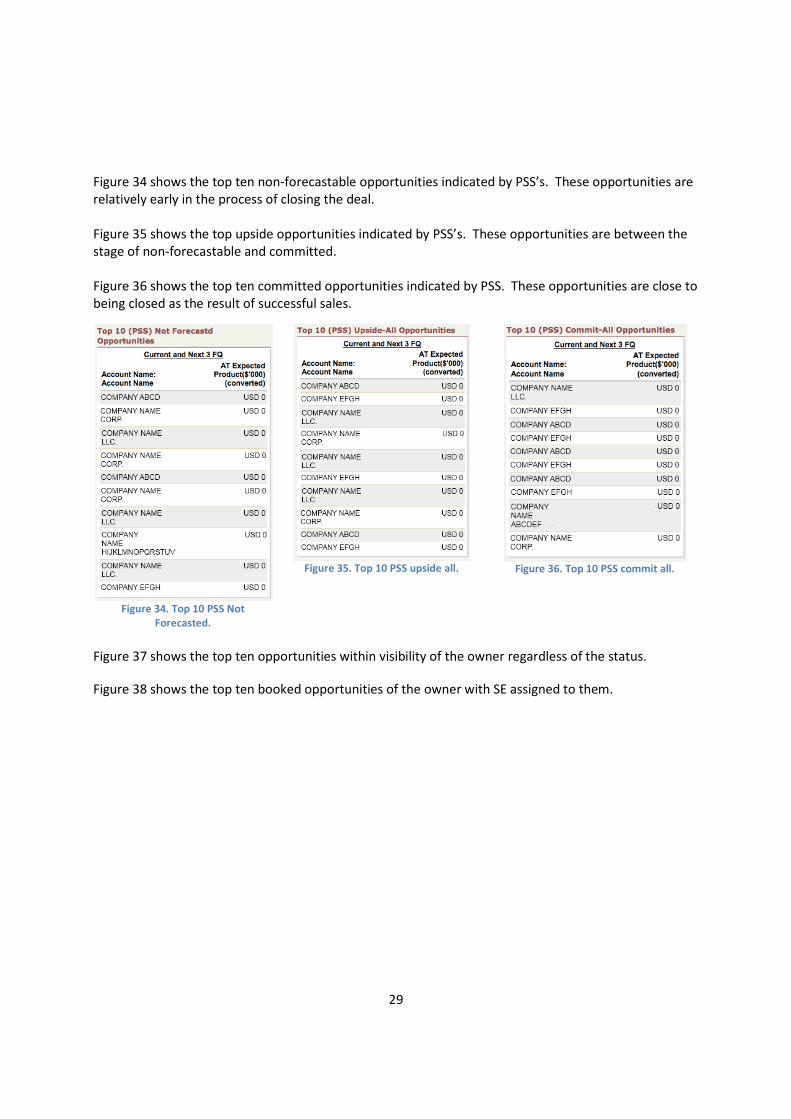
Figure 33. Top 30 AM assigned to me......................................................................................................... 28
Figure 34. Top 10 PSS Not Forecasted. ....................................................................................................... 29
Figure 35. Top 10 PSS upside all.................................................................................................................. 29
Figure 36. Top 10 PSS commit all. ............................................................................................................... 29
Figure 37. Opportunities in my visibility. .................................................................................................... 30
Figure 38. Your booked opportunities. ....................................................................................................... 30
Figure 39. Your booked opps. ..................................................................................................................... 30
Page 12
xi
Figure 40. Top 10 stalled deals - SE assigned. ............................................................................................. 30
Figure 41. Your opportunities Lost. ............................................................................................................ 31
Figure 42. Opportunities lost by competitor. ............................................................................................. 31
Figure 43. TSN Cases for ops w/ Deal ID. .................................................................................................... 31
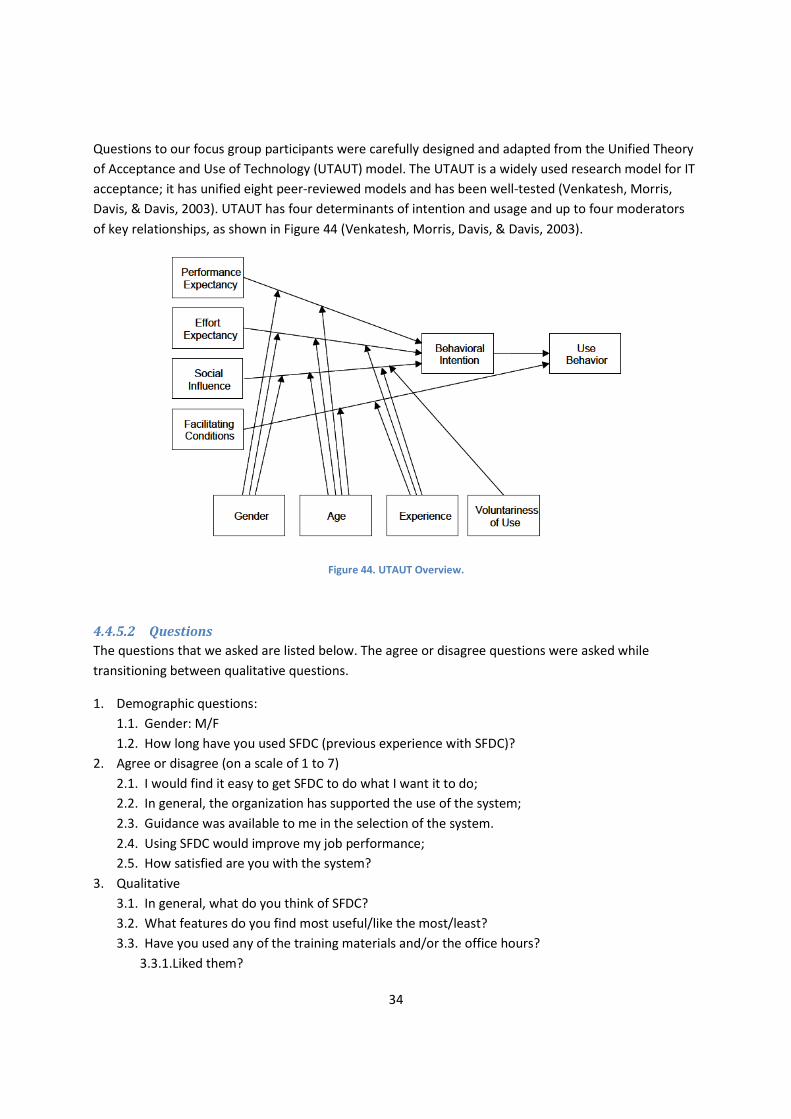
Figure 44. UTAUT Overview. ....................................................................................................................... 34
Page 13
xii
List of Tables
Table 1. Focus Group Protocol. ................................................................................................................... 36
Page 14
1
1 Introduction Cisco Systems is a large multinational corporation that employs more than 66,000 employees. As the
world leading supplier of computer networking products, systems and services Cisco was able to
generate $39 billion of revenue for the 2008 fiscal year (Cisco Systems, 2009). Cisco serves three main
market segments: large organizations which need complex and complete networking solutions which
often link various geographically dispersed networks and technologies and require intensive support
processes; as well as small and medium sized business whose major needs include internet connectivity
and small local area networks (LANs) (Cisco Systems, 2009).
Cisco’s ability to remain a viable company is directly dependant on its ability to deal with the various
risks faced by the organization. These risks stem from a wide variety of sources including its operations,
competitors and rapidly changing market conditions (Hoover's, 2010). The following excerpt was
adapted from Cisco’s 2009 Annual Report to Shareholders to expand on Cisco's targeted resource
realignment.
Cisco's fiscal strategy for 2009 was centered on increasing the role of intelligent networks;
collaboration and Web 2.0 technologies; the network as a platform; and resource management
and realignment. Also key to Cisco's strategy for weathering the economic downturn is its ability
to move into adjacent markets, those product markets that are similar, related or adjacent to
those in which Cisco is currently active. The movement into adjacent markets has been achieved
through the realignment of resources as well as the reduction of aggregate expenses. A major
market identified by Cisco has been the virtualization market which is quickly disrupting the
current form and function of the enterprise data center. This market transition is being brought
on by the convergence of networking, computing, storage, and software technologies. Cisco
hopes to capitalize on this market transition through various products and solutions including
the Cisco Unified Computing System and the Cisco Nexus product families. Other adjacent
markets which Cisco is focusing its attention include those related to the increased role of video,
collaboration and networked Web 2.0 technologies. These markets have the benefit of
expanding faster than Cisco had originally predicted, thus holding a greater sales potential in the
near term as well as driving increased network growth which should aid Cisco's routing and
networking products (Cisco Systems, Inc., 2009).
Problem Statement
Currently Cisco has not implemented a sales wide customer relationship management (CRM) system.
Such a system if designed and implemented properly would have a two-fold benefit: first it would
ensure customer's requests are handled in a more efficient and timely manner. Second it would provide
a hard set of data driven metrics that would allow Cisco to objectively determine how well they are
mitigating the risks outlined in its 10-K and the strategy set forth in the announcement to shareholders.
Our project is a continuation of the Texas Resource Optimization Pilot (TROP) brought about by an
internal Cisco study that revealed a number of issues regarding Cisco’s Expertise Utilization processes.
Page 15
2
The primary symptoms identified were sub-optimal (i) resource utilization, (ii) collaboration and (iii)
expertise access. The primary cause of this was identified as the lack of a common system to track
account and expertise requests. Without such a system it is difficult to compile the data required to
calculate relevant business metrics across departments, determine organizational effectiveness and best
practices. Another root cause was determined to be the restrictive organizational silos that experts were
placed in. This often meant that when a request for assistance was received the closest suitable
resource was not assigned to the task. As a result the experts spend more time on the road and less
time in front of customers than is possible with a more efficient collaboration model. This is a major
contributor to the estimated 300% head count growth Cisco would have to sustain to meet customers’
needs with its current coverage model. A solution to this problem will decrease costs by reducing travel,
which will increase the number of customers Cisco experts will be able to meet with. This will result in
greater revenue and increased customer satisfaction, all while improving the quality of life for Cisco
experts by allowing them to spend less time on the road.
Project Objectives
The solution to this problem is a properly designed, managed and deployed CRM System. The WPI
project team will focus on the System Engineer (SE) and System Engineer Manager (SEM) dashboards,
built on Salesforce.com, which will meet the following objectives:
• Enable effective and efficient resource allocation
• Simplify the ability for SEs to engage themselves to opportunities
• Increase visibility of SEs to SEMs and AMs
• Increase visibility of opportunities to SEMs and SEs
The goal of this report is to give the reader a strong understanding of the accomplishments of the MQP
team and the implications of the project for Cisco. This will be accomplished by first giving the reader an
understanding of Cisco as a company and the market it operates in followed by an overview of the
technologies relevant to the project. This will be followed by an explanation of the agile development
methodology, our rationale for its use and the progression of the project following the methodology.
The report ends with an overview of the implemented dashboards, the acceptance and usability findings
regarding the dashboards and our final recommendations to Cisco on how to move forward from this
point.
2 Background
2.1 Cisco History
Cisco was founded in December 1984 by two Stanford University scientists, Len Bosack and Sandy Lerner
(Cisco Systems, 2009). During the first years of Cisco’s existence Len and Sandy were assisted by the
company’s two other employees Greg Staz and Kirk Lougheed. These four spent the early years of Cisco
trying to enable communicate between separate networks. In 1986 Cisco became the first company to
offer a commercially available multiprotocol router when it was released for the TCP/IP (Transmission
Page 16
3
Control Protocol/Internet Protocol) protocol suite. In under a year Cisco was selling $250,000 worth of
routers per month with only 8 employees. The commercial market for internetworking began to develop
in the late 1980’s with Cisco in a prime position to seize control of much of the market. To seize this
opportunity Cisco would require an infusion of capital from an outside source. This need opened the
door to venture capitalist Donald T. Valentine of Sequoia Capital. Before Valentine would invest, he
required the owners to surrender a controlling stack of the company to him, thus making him
chairperson in which power he promptly hired John Morgridge as the company’s new president and
CEO. The new CEO built up Cisco direct sales force and support teams that allowed Cisco to seize control
of the market. “Cisco's sales jumped from $183.2 million in fiscal 1991 to $339.6 million in 1992, and net
income grew from $43.2 million to $84.4 million during the same period. In 1992, Fortune magazine
rated Cisco as the second fastest growing company in the United States. In its role as the leading
internetworking router provider, Cisco could redefine and expand the market as it grew.” (Cisco
Systems, 2009)
Cisco made its first acquisition in September 1993, acquiring Crescendo Communications for $95 million.
Crescendo had pioneered products for Copper Distributed Data Interface (CDDI), and the development
of asynchronous transfer mode (ATM) technology. Less than a year later Cisco made its second
acquisition, Newport Systems Solutions for $93 million in stock. Newport’s primary product was the
LAN2LAN product line of software used in linking LANs. In January of 1995 John Chambers was named
CEO of Cisco. Chambers strategy was to step up the pace of the company acquisitions to keep ahead of
its rivals and fill in gaps in its product line with the eventual goal of becoming a one stop shop for
networking solutions. Between 1995 and 1996 Cisco completed 11 acquisitions including a $4.67 billion
takeover of StrataCom, Inc., a leading supplier of ATM and Frame Relay WAN switching equipment. The
latter of which was of particular importance as telecommunication companies needed to rapidly
increase the capacity of their networks. Trying to maintain this blistering pace of acquisitions Cisco
acquired 15 more companies in 1997 and 1998, becoming the undisputed king of the networking world,
a title they carry on to this day.
Due in part to the frenzied bull market tacking place in the arena of high tech stock Cisco was able to
surpass a market value of $450 billion in early 2000. For a brief period during March of 2000 Cisco’s
market capitalization reached $555 billion making it the most valuable company in the world. While
many companies would be content with this level of success Cisco soldiered on acquiring 25 companies
during the 2000 alone (Cisco Systems, 2009). Cisco still remains one of the most valuable companies in
the world today with a market cap of approx $108 billion and was voted as NASDAQ’s “Stock of the
Decade.” (Cisco Systems, 2009)
2.2 Competitive Landscape
Cisco is a leader in the enterprise networking market and is looking to expand its dominance into Unified
Communications. Fierce competition due to a contracting economy is a leading factor in Cisco’s 8.7%
decrease in revenue (Gartner, 2007). This is a trend that should quickly reverse as the economy
rebounds and companies look to invest more money into their technical infrastructure. Even though
Cisco is a currently the leader in enterprise networking it must continue to provide the most innovative
in efficient solutions in the market because of the price premium associated with Cisco products. Cisco
Page 17
4
claims its high initial costs which are often one and a half to two times higher than competitors bids are
offset by a lower cost of ownership and long term benefits.
2.2.1 Enterprise Networking
This analysis of Cisco’s position and competition in the enterprise networking market will focus on
Gartner’s Magic Quadrant analysis of three sub-markets: Enterprise LAN, Wireless LAN (WLAN)
Infrastructure, and Network Access Control.
LAN switching has been established as a mature market, but its importance is increasing as more
companies look towards virtualization and collaboration software to improve the productivity of their
employees. Traditionally LAN infrastructure is also one of the largest networking expenditure for
companies generating total global revenue for business-class products of $16.1 billion for 2007 a value
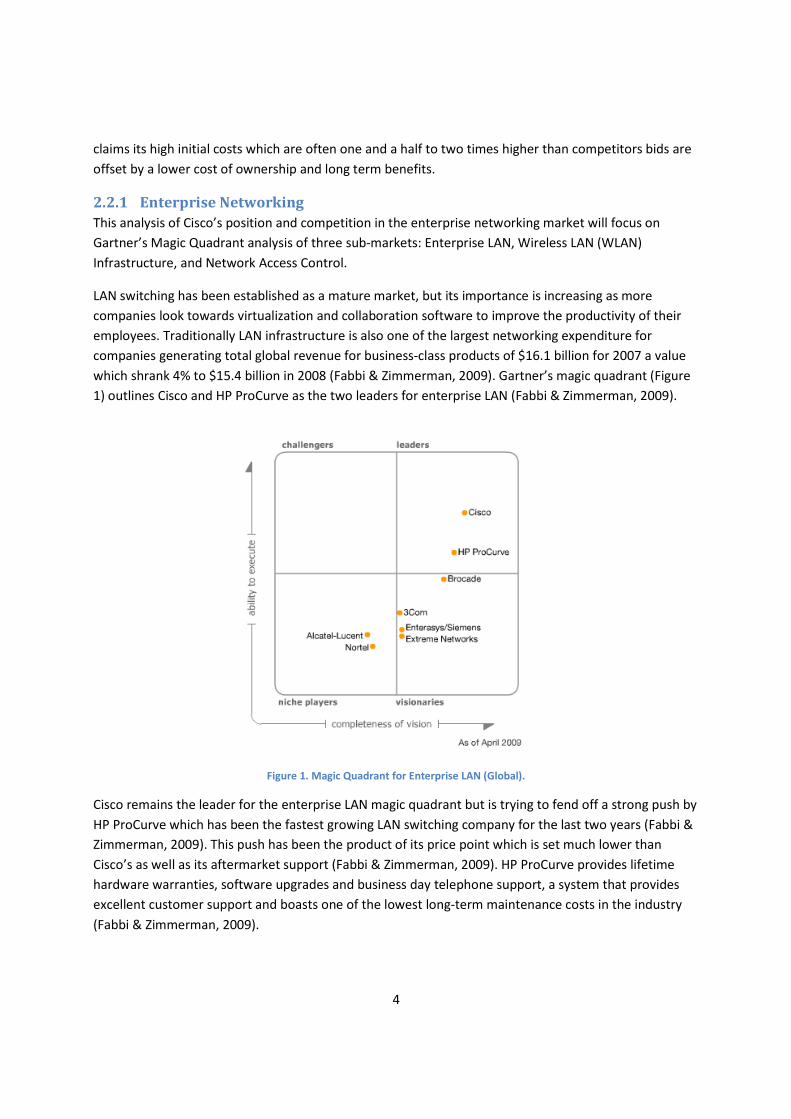
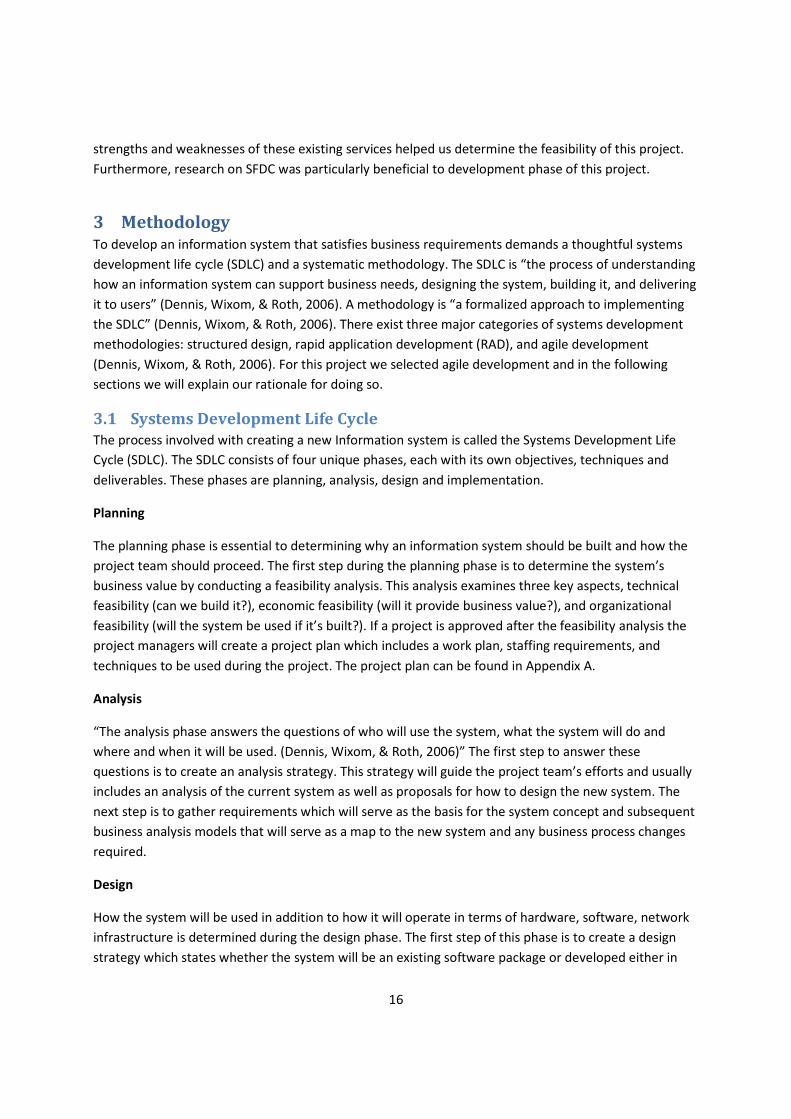
which shrank 4% to $15.4 billion in 2008 (Fabbi & Zimmerman, 2009). Gartner’s magic quadrant (Figure
1) outlines Cisco and HP ProCurve as the two leaders for enterprise LAN (Fabbi & Zimmerman, 2009).
Figure 1. Magic Quadrant for Enterprise LAN (Global).
Cisco remains the leader for the enterprise LAN magic quadrant but is trying to fend off a strong push by
HP ProCurve which has been the fastest growing LAN switching company for the last two years (Fabbi &
Zimmerman, 2009). This push has been the product of its price point which is set much lower than
Cisco’s as well as its aftermarket support (Fabbi & Zimmerman, 2009). HP ProCurve provides lifetime
hardware warranties, software upgrades and business day telephone support, a system that provides
excellent customer support and boasts one of the lowest long-term maintenance costs in the industry
(Fabbi & Zimmerman, 2009).
Page 18
5
As mobile workers become an ever increasing segment of the workforce the focus on WLAN technology
has increased immensely. These users expect to be connected quickly and securely from any point on
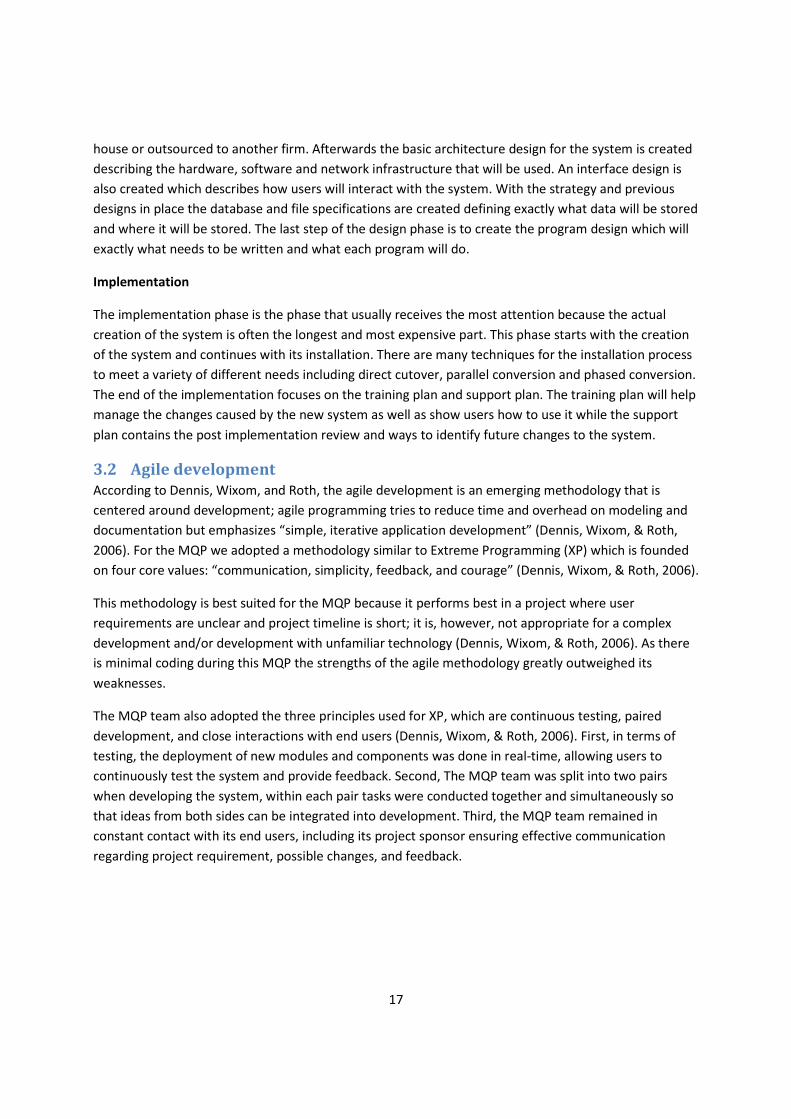
campus and have created the recent push for WLAN and LAN integration. The magic quadrant in Figure
2 shows Cisco as a leader of the market segment but is facing strong competition from both Aruba
Networks and Motorola.
Figure 2. Magic Quadrant for Wireless LAN Infrastructure (Global).
Cisco’s biggest concern in WLAN should be Aruba’s recent success winning vertical market opportunities
that have historically been Cisco’s customers. Aruba’s focus on access control and application security is
one of its strongest selling points and is frequently one of the biggest concerns for companies looking to
expand their WLAN infrastructure. Although facing stiff competition from Aruba Cisco remains the
market share leader and should see continued growth in the WLAN sector due to its innovative vision of
end-to-end networking through its MOTION and Borderless Network initiatives.
NAC is an increasingly important concern for companies that are expanding their W/LAN infrastructure.
The proliferation of WLAN and an increased dependence on the internet has increased the vulnerability
of the enterprise network greatly. This increase in vulnerability is the driver for $221 million generated
in the NAC market, a 51% increase over the 2007 values. The four main usages for NAC are guest
network services, endpoint base lining, identity-aware networking and monitoring/containment. Guest
networking is increasingly important and is the driver for approximately 80% of all NAC deployments.
The magic quadrant in Figure 3 represents the strength of Cisco’s various competitors in the NAC field.
Page 19
6
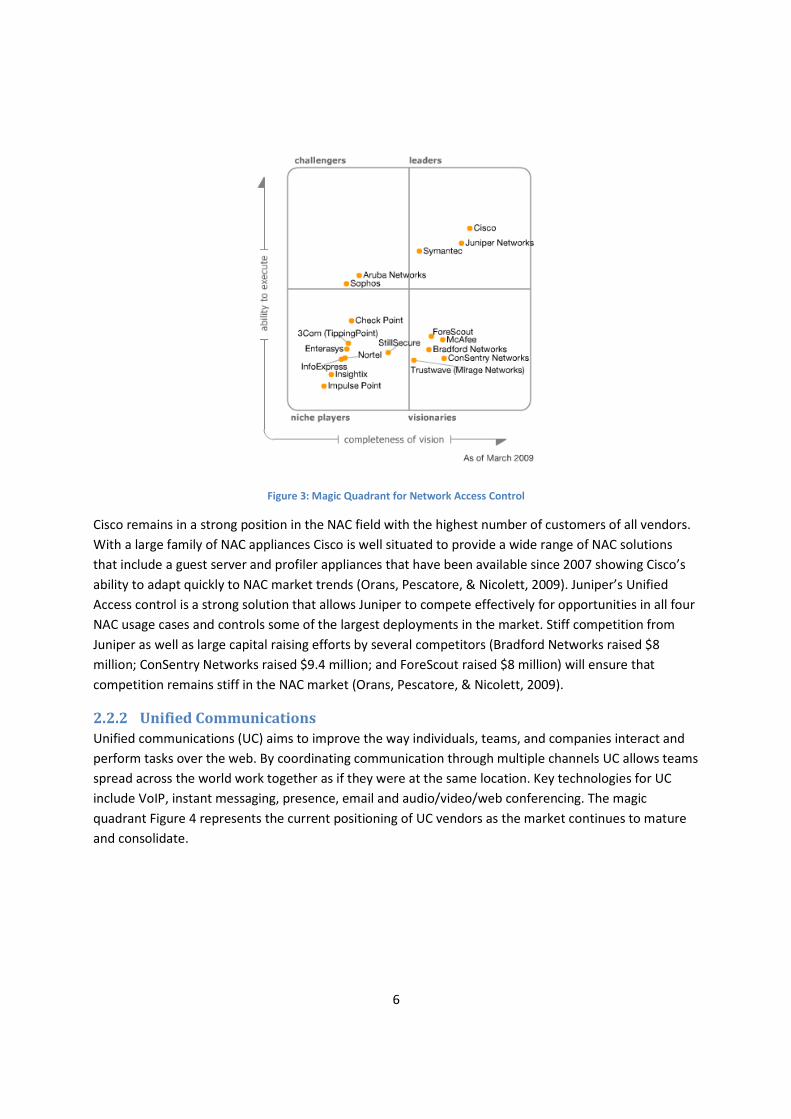
Figure 3: Magic Quadrant for Network Access Control
Cisco remains in a strong position in the NAC field with the highest number of customers of all vendors.
With a large family of NAC appliances Cisco is well situated to provide a wide range of NAC solutions
that include a guest server and profiler appliances that have been available since 2007 showing Cisco’s
ability to adapt quickly to NAC market trends (Orans, Pescatore, & Nicolett, 2009). Juniper’s Unified
Access control is a strong solution that allows Juniper to compete effectively for opportunities in all four
NAC usage cases and controls some of the largest deployments in the market. Stiff competition from
Juniper as well as large capital raising efforts by several competitors (Bradford Networks raised $8
million; ConSentry Networks raised $9.4 million; and ForeScout raised $8 million) will ensure that
competition remains stiff in the NAC market (Orans, Pescatore, & Nicolett, 2009).
2.2.2 Unified Communications
Unified communications (UC) aims to improve the way individuals, teams, and companies interact and
perform tasks over the web. By coordinating communication through multiple channels UC allows teams
spread across the world work together as if they were at the same location. Key technologies for UC
include VoIP, instant messaging, presence, email and audio/video/web conferencing. The magic
quadrant Figure 4 represents the current positioning of UC vendors as the market continues to mature
and consolidate.
Page 20
7
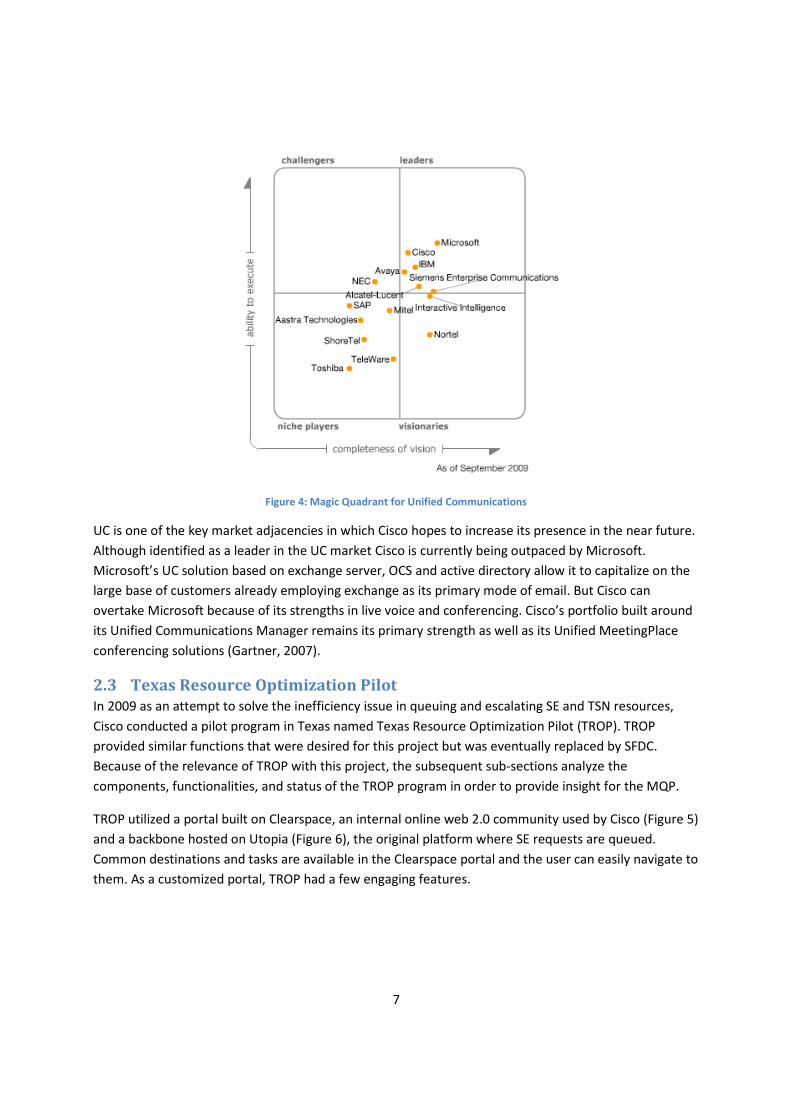
Figure 4: Magic Quadrant for Unified Communications
UC is one of the key market adjacencies in which Cisco hopes to increase its presence in the near future.
Although identified as a leader in the UC market Cisco is currently being outpaced by Microsoft.
Microsoft’s UC solution based on exchange server, OCS and active directory allow it to capitalize on the
large base of customers already employing exchange as its primary mode of email. But Cisco can
overtake Microsoft because of its strengths in live voice and conferencing. Cisco’s portfolio built around
its Unified Communications Manager remains its primary strength as well as its Unified MeetingPlace
conferencing solutions (Gartner, 2007).
2.3 Texas Resource Optimization Pilot
In 2009 as an attempt to solve the inefficiency issue in queuing and escalating SE and TSN resources,
Cisco conducted a pilot program in Texas named Texas Resource Optimization Pilot (TROP). TROP
provided similar functions that were desired for this project but was eventually replaced by SFDC.
Because of the relevance of TROP with this project, the subsequent sub-sections analyze the
components, functionalities, and status of the TROP program in order to provide insight for the MQP.
TROP utilized a portal built on Clearspace, an internal online web 2.0 community used by Cisco (Figure 5)
and a backbone hosted on Utopia (Figure 6), the original platform where SE requests are queued.
Common destinations and tasks are available in the Clearspace portal and the user can easily navigate to
them. As a customized portal, TROP had a few engaging features.
Page 21
8
Figure 5. TX Expert Optimization Pilot.
Figure 6. TROP requests in Utopia.
Knowledge Base:
A link in the dashboard directs the user to the TSN collaboration knowledge base (Figure 7). Discussions,
documents, and PowerPoints are listed in a “Recent Content” section. The applications and documents
can also be reached through a directory. Discussions in the knowledge base can be question and answer,
allowing people to take advantage of information that is available on the internal network.
Page 22
9
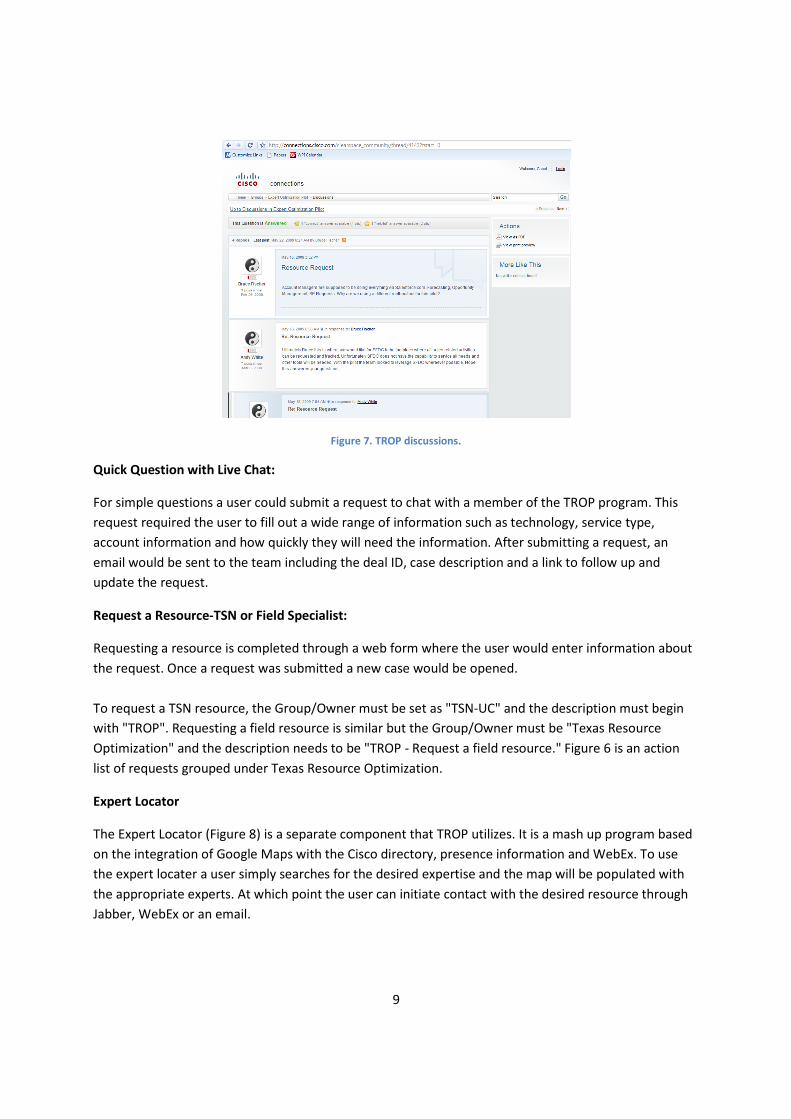
Figure 7. TROP discussions.
Quick Question with Live Chat:
For simple questions a user could submit a request to chat with a member of the TROP program. This
request required the user to fill out a wide range of information such as technology, service type,
account information and how quickly they will need the information. After submitting a request, an
email would be sent to the team including the deal ID, case description and a link to follow up and
update the request.
Request a Resource-TSN or Field Specialist:
Requesting a resource is completed through a web form where the user would enter information about
the request. Once a request was submitted a new case would be opened.
To request a TSN resource, the Group/Owner must be set as "TSN-UC" and the description must begin
with "TROP". Requesting a field resource is similar but the Group/Owner must be "Texas Resource
Optimization" and the description needs to be "TROP - Request a field resource." Figure 6 is an action
list of requests grouped under Texas Resource Optimization.
Expert Locator
The Expert Locator (Figure 8) is a separate component that TROP utilizes. It is a mash up program based
on the integration of Google Maps with the Cisco directory, presence information and WebEx. To use
the expert locater a user simply searches for the desired expertise and the map will be populated with
the appropriate experts. At which point the user can initiate contact with the desired resource through
Jabber, WebEx or an email.
Page 23
10
Figure 8. Expert Locator.
As mentioned above, TROP lead the way of providing integrated source of sales and support activities.
Studying and understanding TROP gave us better understanding of the system we were to design. We
were able to learn the various information that the SDDC reports needed to supply. It also gave us
insight on how the opportunities and support tasks were handled in the team. On the other hand, as a
self-built tool and platform, TROP owned a number of features that served the business needs very
closely. Studying TROP, therefore, gave light to what Salesforce.com did well and what it could not do.
As described in the recommendation section, some of the features in TROP, such as the integration of
presence information in the system and the ability to place a VoIP call, were indeed desired by the end
users of SFDC.
2.4 Salesforce.com (SFDC)
A major component of this project is to develop the business intelligence portal on Cisco’s
Salesforce.com platform. In this section we present the background information on the history and
characteristics of this platform.
SFDC is an enterprise cloud computing company that provides customer relationship management
(CRM) services to businesses of various sizes and industries across the globe (salesforce.com, 2008).
SFDC product offering includes a variety of applications that manage customer information for the
different business units in a company such as sales, marketing, support, and IT. SFDC is headquartered in
San Francisco, CA with other major offices in Dublin, Singapore, Tokyo, Toronto, New York, London,
Sydney and San Mateo, CA (salesforce.com, 2008). SFDC's customizable business applications and speed
Page 24
11
deployment process have helped it to become the number one sales application on the market
(salesforce.com, 2008).
SFDC was founded in San Francisco by former Oracle executive Mark Benioff in 1999. In 2004, SFDC
went public on the New York Stock Exchange (NYSE) with an initial public offering that generated $110
million. SFDC's innovative business solutions and rapid growth has received a great deal of praise and
awards from respected sources such as BusinessWeek, Forbes, InfoWorld and eWeek. Recognizing room
for improvement in their customer service and support department SFDC acquired InStanet, a call
center software provider, in August 2008. As of October of the same year SFDC was servicing
approximately 51,800 customers and employed a full-time staff of 3,300. (salesforce.com, 2008)
2.4.1 Current Product and Services
SFDC services focus on multiple functional areas: sales force automation, partner relationship
management, customer service and support automation and marketing automation. All SFDC products
are delivered over the Internet and hosted on SFDC servers.
Customer Relationship Management (CRM) is a web-based set of business tools and applications that
manage current and prospective customer information, activities, and conversations. CRM allows
maximum customization at both the dashboard and platform level. At the dashboard level, users can
customize every aspect of their interface from the layout to the specific fields to display on a page. At
the platform level, users can develop applications using the Force.com Platform. The Force.com
Platform is SFDC’s Platform-as-a-Service product that allows customers to develop their own add-on
applications that can be integrated with SFDC.
The AppExchange is an online marketplace for SaaS applications. With AppExchange users can test drive,
buy and install hundreds of applications written by other users and third party developers. These
applications perform various functions including but not limited to the import and export of data
between SFDC and local databases; search for duplicates in a database; authorize, charge, and void,
credit card transactions; track open jobs and candidate information. Additionally SFDC provides a few
starter applications that are free but most applications are for sales.
In April 2009, SFDC released CRM Mobile that captures similar functionalities as the web-based version
but is simpler and support popular mobile devices like the iPhone, BlackBerry and Windows Mobile
devices.
2.4.2 Cisco’s use on SFDC
During the time of our study, SFDC had already been in use by account managers globally to manage
sales activities.
After being initially introduced to the SEs and SEMs, SFDC received a relatively high adoption. In early
February there were 15 managers and 80-85 engineers using the system. 30-40 people have attended
help sessions established to answer questions and foster adoption. The initial adoption rate was
estimated to be above the 50% level, partially due to given bonus incentives known as Management by
Objective (MBO) (Lapp Jr., 2009).
Page 25
12
2.5 Business Intelligence
The core of this project was to employ business intelligence components such as dashboards and
reports to bring more visibility into Cisco’s pre-sales activities. In this section, we present a review on the
background and importance of business intelligence.
Business intelligence (BI) often refers to the types of activities undertaken by a company in order to
gather information about its performance, market or competitors (McGuigan, 2009). Specifically,
business intelligence systems are data-driven decision support systems (Power, 2007). These systems
utilize advanced technology to “mine for data” and helping companies produce better business
initiatives, customer understanding, and competitive advantages that are based on hard data
(McGuigan, 2009).
The definition of the term “business intelligence” was given by an IBM researcher Hans Peter Luhn in
1958, who defined Intelligence as “the ability to apprehend the interrelationships of presented facts in
such a way as to guide action towards a desired goal” (Luhn, 1958). In the same paper, he also hoped
that “together with proper communication facilities and input-output equipment a comprehensive
system may be assembled to accommodate all information problems of an organization” (Luhn, 1958). It
has been over 50 years since the definition of BI given by Luhn, but it was maintained that, while
“collecting, analyzing and distributing data can be automated”, “information overload and the
complexity of collecting data are still major challenges” faced today (Raaij, 2008).
2.5.1 Importance and Future
The core value of business intelligence is its ability to provide data-driven insight in terms of businesses,
markets, and customers. It was argued that 90% of companies fail to execute on their strategic plans
because of improper use of data and lack of visibility, thus “[a] strategic Business Intelligence platform
puts the right information in the right hands at the right time” (Capgemini, 2006).
The future of business intelligence is best revealed by a Gartner report published in January, 2009. In the
report, Gartner makes predictions for 2009 and beyond, stating that, “[t]hrough 2012, more than 35 per
cent of the top 5,000 global companies will regularly fail to make insightful decisions about significant
changes in their business and markets (Gartner, 2009)”. The reason behind this is that “most
organizations do not have the information, processes and tools needed to make informed, responsive
decisions due to underinvestment in information infrastructure and business tools” (Gartner, 2009).
2.5.2 Related Technologies
Business intelligence is usually related with and discussed in conjunction with ideas such as On-line
Analytical Processing (OLAP) and data warehouses. Knowing these technologies and concepts will help
the understanding of business intelligence.
OLAP is a tool that “uses a multidimensional view of aggregate data to provide quick access to strategic
information for further analysis” and allows analysts and managers to easily, quickly and interactively
access various views of information (OLAP Council, 1997). Users will not need to understand the table
Page 26
13
layouts and joins behind (OLAP Council, 1997). Functionalities of OLAP range from “basic navigation and
browsing, to calculations, to more serious analyses such as time series and complex modeling” (OLAP
Council, 1997). OLAP is a type of business intelligence tool.
A data warehouse is a repository that stores standardized and consistent data from various systems
used in one organization for reporting and analytic purposes (Chaudhuri & Dayal, 1997). The information
stored in a data warehouse is separated from the operational systems, so that retrieval does not slow
down the operational system but at the same time does not allow access to real time data since it must
be extracted and transformed.
2.6 CRM Literature Review
The SFDC at Cisco is the core for managing sales activities. Since SFDC is a type of customer relationship
management (CRM) software, we are reviewing the current CRM literature in this section.
2.6.1 CRM Interfaces for Effective Decision Making
It was stated that the effectiveness of a CRM system can be determined by the users’ satisfaction level
reached by performing activities on such a system (Kim, Suh, & Hwang, 2003). Business intelligence, a
tool that is often also a critical component in the CRM system, is responsible for informing managers
and providing guidance for their decision making and will have its utilization and effectiveness
dependent on the user experience as well.
Pointed out by a forward looking research, the trend for user interface in the context of business
intelligence will be mainly reports and dashboards, due to the fact that operational decision makers will
not have the time and skills to query through OLAP (Golfarelli, Rizzi, & Cella, 2004).
It was estimated that “75% users of historical data principally use routine reports that describe what
happened” (Negash & Gray, 2008). Reports can be viewed either as-is or filtered by customized criteria
(Negash & Gray, 2008). Reports should also provide a drill-down functionality which allows the user to
navigate through data in order to obtain more details (Negash & Gray, 2008).
On the other hand, a dashboard typically “uses simple visuals (gauges, charts, and tables) through a web
browser interface to speed communication of BI results”; and like reports, a dashboard can be drilled
down (Negash & Gray, 2008). Dashboards are appealing because they:
• Present many different metrics in a single consolidated view on-screen
• Roll up details into high-level summaries
• Present intuitive indicators which are quickly understandable (Negash & Gray, 2008).
Therefore, this project implemented two dashboards with visuals and drill-down features for two
different types of users as well as reports that revealed more details. The layout of these components as
well as the presentation of information was aimed to promote ease of use as well as decision making
effectiveness for the end users. The design and content of our dashboards and reports are explained in
more details in later sections.
Page 27
14
2.6.2 CRM in the Cloud
SFDC is a cloud software that is not hosted on the client’s site. The SFDC customized for Cisco’s use is no
exception. Hosting a CRM in the cloud can have many good and bad impacts on a company. The
advantages are easy to deploy, constantly updated, and lower costs (Whitney, 2010). The disadvantages
include requiring a high speed connection, no control over data, and customization issues. Due to these
cons, the move to hosted CRMs has been fairly slow until recently when hosted CRMs started to really
take off (Whitney, 2010).
When talking about the advantages you can see why a company would be very quick to try this solution.
The easiness to deploy and the little to no maintenance make it a hard offer to turn down. Due to these
advantages this solution especially entice to smaller businesses.
As a big company the disadvantages quickly even out the playing field. The high speed internet is not as
big of an issue to a large company, but when you are unable to control your data or customize to make
your employees happy it starts to become problematic. The no control over your data comes up when a
company uses a smaller CRM host provider and they go out of business, or when a company decides it
wants to move to a different provider. The data is usually not easy to move at this point due to
proprietary software running on the CRM site.
CRM in the cloud is important for us because it is what our project is based on. SFDC is the best example
of CRM in the cloud and that is what we are doing our project in. It also shows the benefits of basing our
project on the best CRM in the cloud solution.
2.6.3 CRM and Web 2.0
The term Web 2.0 is new term that refers to web applications that facilitate interactive information
sharing, interoperability, user-centered design and collaboration on the internet (Enrico, 2008). To
accomplish these goals, the technology draws on the capabilities of both the client and server side
software through the use of JavaScript, XML, Flash as well as a host of JavaScript/Ajax frameworks. With
these technologies in place a user is able to receive data (such as a website), at which point the
interaction begins to work like a desktop application where the user is able to dynamically change and
update the data without continually communicating with the server where the data is located. The most
commonly used web 2.0 components include blogs, wikis, RSS feeds, widgets, and most video and audio
content (Enrico, 2008).
Incorporating Web 2.0 technologies with the marketing and CRM process is one of the hottest new
trends in today’s business landscape (Miller, 2009). The purpose of these technologies is to facilitate a
level of interaction where the customer feels that they are an essential element of the entire business
relationship. This is accomplished through the use of Web 2.0 applications and services that promote
ongoing and meaningful dialogue both on and offline. Consistent and meaning communication will
improve the relationship between the business and customer, creating an environment where sales and
marketing personnel have a better understanding of and a stronger personal connection with their
customers. The result of successfully implementing Web 2.0 strategies will create a sales team that is
Page 28
15
able to proactively respond to the needs of current customers as well as share the experience and
insight gained from each interaction throughout the team (Miller, 2009).
Web 2.0 is important because it allows SFDC to improve its use as a collaboration tool and provide an
effective way to manage unstructured data on the web. These two components will allow quicker and
simpler collaboration among Cisco employees (MacManus, 2007).
2.6.4 Impact of CRM in the Organization
Communication has always played an important role in many organizations, especially large ones
(Ghavami & Olyaei, 2006). Effective communication inspires and drives successful businesses. Cisco,
being a worldwide networking company needs such effective communication means to maintain and
grow its business in order to stay competitive. According to research, implementing CRM systems lower
the costs of interaction with customers, thus allowing more time to sell and retain customers (Maoz,
2009). Since customers are one of Cisco’s most critical assets, deploying CRM applications has significant
impacts on the organization.
CRM systems can help Cisco reduce the overhead costs associated with sales activities, increase
customer satisfaction and customer retention, and evaluate customer profitability (Ghavami & Olyaei,
2006). CRM applications work by storing customer information in its centralized database system, which
is ubiquitously accessible. In the case of a sales department, information is shared all across associated
salespersons, providing them the latest customer updates in order for them to take appropriate actions.
As a result, customers are more satisfied with the timely response from the salesperson and more likely
to remain loyal to the brand (Bygstad, 2003). Additionally, because information is shared ubiquitously, it
eliminates the salesmen’s needs to travel, thus decreasing operating costs for the organization. With
this real-time access to data, employees will become more productive and be able to service more
customers.
Information stored in the database can also be utilized in market analysis and product concept
development in order to predict buying trends and identify new customer segments (Bygstad, 2003).
Consequently the organization’s focus will shift from the product to the customer itself and will be able
to streamline their products and offerings to what the customer really wants (Gifford, 2010). In short,
CRM systems can help create a long-standing relationship between the organization and the customer,
resulting in increased long-term profitability.
In the world of constant technology innovations, leaders need to be aware about these emerging
technologies. Especially during the recent economic downturn where many IT budgets have decreased,
leaders are even more conscious and selective about the technologies they are employing in order to
maximize a project success (Phelan, 2009). By evaluating the strengths and weaknesses of existing
technologies, we can exploit the benefits and improve on the weaknesses. In addition, assessing what
has already been done will save time and money simply by preventing reiteration of these researches.
Evaluating TROP, CRM, and Cisco in general was necessary because we are now more knowledgeable of
the available software and services that can be utilized to achieve the project goals. Knowing the
Page 29
16
strengths and weaknesses of these existing services helped us determine the feasibility of this project.
Furthermore, research on SFDC was particularly beneficial to development phase of this project.
3 Methodology To develop an information system that satisfies business requirements demands a thoughtful systems
development life cycle (SDLC) and a systematic methodology. The SDLC is “the process of understanding
how an information system can support business needs, designing the system, building it, and delivering
it to users” (Dennis, Wixom, & Roth, 2006). A methodology is “a formalized approach to implementing
the SDLC” (Dennis, Wixom, & Roth, 2006). There exist three major categories of systems development
methodologies: structured design, rapid application development (RAD), and agile development
(Dennis, Wixom, & Roth, 2006). For this project we selected agile development and in the following
sections we will explain our rationale for doing so.
3.1 Systems Development Life Cycle
The process involved with creating a new Information system is called the Systems Development Life
Cycle (SDLC). The SDLC consists of four unique phases, each with its own objectives, techniques and
deliverables. These phases are planning, analysis, design and implementation.
Planning
The planning phase is essential to determining why an information system should be built and how the
project team should proceed. The first step during the planning phase is to determine the system’s
business value by conducting a feasibility analysis. This analysis examines three key aspects, technical
feasibility (can we build it?), economic feasibility (will it provide business value?), and organizational
feasibility (will the system be used if it’s built?). If a project is approved after the feasibility analysis the
project managers will create a project plan which includes a work plan, staffing requirements, and
techniques to be used during the project. The project plan can be found in Appendix A.
Analysis
“The analysis phase answers the questions of who will use the system, what the system will do and
where and when it will be used. (Dennis, Wixom, & Roth, 2006)” The first step to answer these
questions is to create an analysis strategy. This strategy will guide the project team’s efforts and usually
includes an analysis of the current system as well as proposals for how to design the new system. The
next step is to gather requirements which will serve as the basis for the system concept and subsequent
business analysis models that will serve as a map to the new system and any business process changes
required.
Design
How the system will be used in addition to how it will operate in terms of hardware, software, network
infrastructure is determined during the design phase. The first step of this phase is to create a design
strategy which states whether the system will be an existing software package or developed either in
Page 30
17
house or outsourced to another firm. Afterwards the basic architecture design for the system is created
describing the hardware, software and network infrastructure that will be used. An interface design is
also created which describes how users will interact with the system. With the strategy and previous
designs in place the database and file specifications are created defining exactly what data will be stored
and where it will be stored. The last step of the design phase is to create the program design which will
exactly what needs to be written and what each program will do.
Implementation
The implementation phase is the phase that usually receives the most attention because the actual
creation of the system is often the longest and most expensive part. This phase starts with the creation
of the system and continues with its installation. There are many techniques for the installation process
to meet a variety of different needs including direct cutover, parallel conversion and phased conversion.
The end of the implementation focuses on the training plan and support plan. The training plan will help
manage the changes caused by the new system as well as show users how to use it while the support
plan contains the post implementation review and ways to identify future changes to the system.
3.2 Agile development
According to Dennis, Wixom, and Roth, the agile development is an emerging methodology that is
centered around development; agile programming tries to reduce time and overhead on modeling and
documentation but emphasizes “simple, iterative application development” (Dennis, Wixom, & Roth,
2006). For the MQP we adopted a methodology similar to Extreme Programming (XP) which is founded
on four core values: “communication, simplicity, feedback, and courage” (Dennis, Wixom, & Roth, 2006).
This methodology is best suited for the MQP because it performs best in a project where user
requirements are unclear and project timeline is short; it is, however, not appropriate for a complex
development and/or development with unfamiliar technology (Dennis, Wixom, & Roth, 2006). As there
is minimal coding during this MQP the strengths of the agile methodology greatly outweighed its
weaknesses.
The MQP team also adopted the three principles used for XP, which are continuous testing, paired
development, and close interactions with end users (Dennis, Wixom, & Roth, 2006). First, in terms of
testing, the deployment of new modules and components was done in real-time, allowing users to
continuously test the system and provide feedback. Second, The MQP team was split into two pairs
when developing the system, within each pair tasks were conducted together and simultaneously so
that ideas from both sides can be integrated into development. Third, the MQP team remained in
constant contact with its end users, including its project sponsor ensuring effective communication
regarding project requirement, possible changes, and feedback.
Page 31
18
4 Results
4.1 Planning Phase
The aim of this MQP project was to improve the management of the sales support processes through
the development of a business intelligence dashboard, utilizing Cisco’s customized SFDC website. This
MQP was completed with close support from Cisco's management. The following two responsibilities
that have been identified defined the project scope and led to its success:
• Technology development completed by the MQP team
• Management actions taken by Cisco management
A major part of the project involved the configuration and metrics report setup based on Cisco’s
customized Salesforce.com (SFDC) platform. The account managers (AM) and system engineers (SE) will
be able to conduct their general transactions for sales support over SFDC.
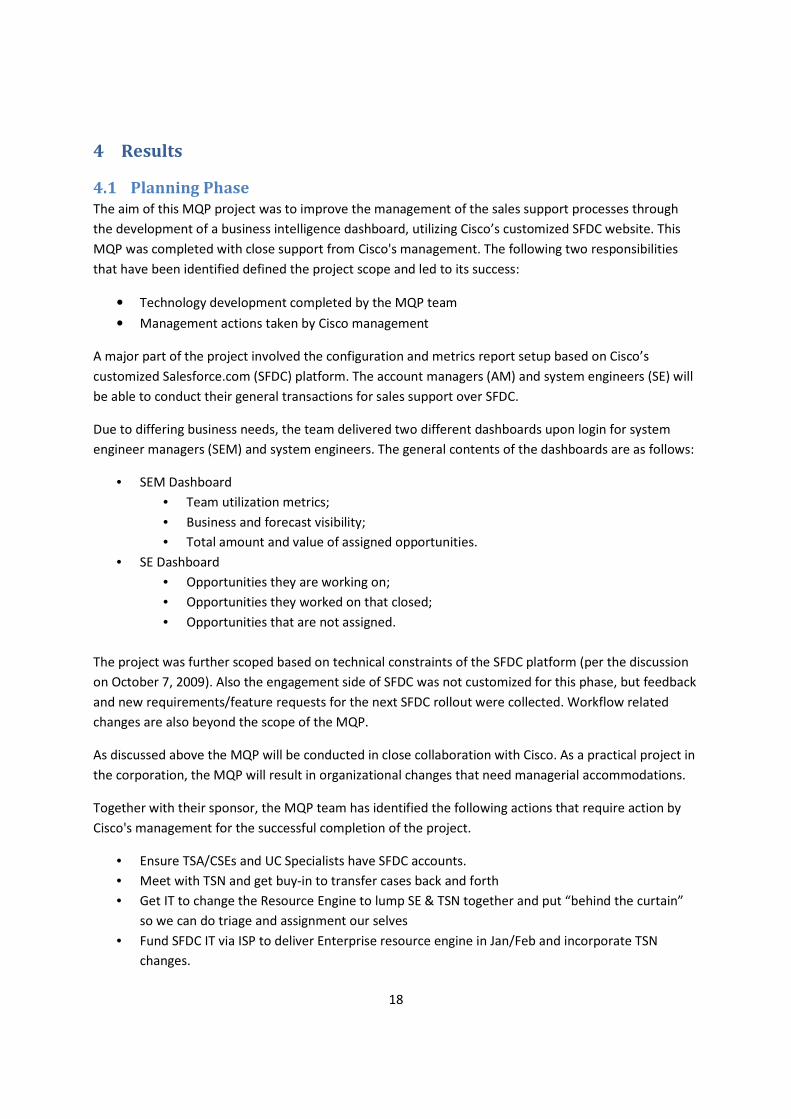
Due to differing business needs, the team delivered two different dashboards upon login for system
engineer managers (SEM) and system engineers. The general contents of the dashboards are as follows:
• SEM Dashboard
• Team utilization metrics;
• Business and forecast visibility;
• Total amount and value of assigned opportunities.
• SE Dashboard
• Opportunities they are working on;
• Opportunities they worked on that closed;
• Opportunities that are not assigned.
The project was further scoped based on technical constraints of the SFDC platform (per the discussion
on October 7, 2009). Also the engagement side of SFDC was not customized for this phase, but feedback
and new requirements/feature requests for the next SFDC rollout were collected. Workflow related
changes are also beyond the scope of the MQP.
As discussed above the MQP will be conducted in close collaboration with Cisco. As a practical project in
the corporation, the MQP will result in organizational changes that need managerial accommodations.
Together with their sponsor, the MQP team has identified the following actions that require action by
Cisco's management for the successful completion of the project.
• Ensure TSA/CSEs and UC Specialists have SFDC accounts.
• Meet with TSN and get buy-in to transfer cases back and forth
• Get IT to change the Resource Engine to lump SE & TSN together and put “behind the curtain”
so we can do triage and assignment our selves
• Fund SFDC IT via ISP to deliver Enterprise resource engine in Jan/Feb and incorporate TSN
changes.
Page 32
19
The rollout occurred right after Christmas break for Cisco. Immediately all SEs and SEMs were forced
through their bonuses to start using the system. The SEs and SEMs were asked to put in some time
weekly to update the opportunities they are currently working on as well as to assign themselves to
opportunities they started working on. The success of the project will be determined by two factors as
specified by the project sponsors: the adoption of the system and the completion of the tasks.
The deployment of this project is a highly-valued, long-term start to Cisco's use of the Salesforce.com
system.
4.2 Analysis Phase
4.2.1 Requirements Gathering
To collect requirements from our client, we interviewed our project sponsor, conducted document
analysis, and interviewed employees. Our sponsor hosted regular WebEx meetings online in order to
communicate the requirements to the team. These meetings took place every Monday at 4pm and
every Thursday at 4:30pm. The team also met regularly with the sponsor in person at Cisco’s campus.
The in-person meetings take place in Cisco’s Boxborough campus every Wednesday since the beginning
of this project (August, 2009). Dashboard and report specifications were communicated and
documented in these meetings.
During these meetings, no real questions were asked in an interview style format, instead we had an
open discussion with our sponsor. This discussion was both about what requirements were needed by
our sponsor, as well as what reports would be needed to cover those requirements. We then used these
discussions as well as time with our sponsor to make the first mockup and then used the first mockup to
create the second mockup.
We also reviewed the process used to manage sales assistance requests as well as the pilot system that
was put in place in Texas (TROP), which was introduced in the background section. The team also tested
the SFDC platform that is set up for the commercial sector in order to learn comparable processes used
in the commercial sales. The training materials provided for the commercial sector were studied as well.
The analysis showed us what the best format was for the setup of the dashboard. It showed us what
layouts were best to do for our final dashboard, which was the format that was discussed with our
sponsor. It also gave us ideas for what things to discuss with our sponsor for his ideas for the dashboard.
The only other interview we had was with another SEM manager who was a very active member of
TROP. He was extremely helpful in helping us find out what worked with TROP and what was not so
successful. Due to his experience we took all of his advice very seriously.
4.2.2 Requirements
We came up with the following requirements for this project:
1. The system will be built within Salesforce.com.
1.1. The system should be able to report using production data.
Page 33
20
2. The system should be able to provide dashboards.
2.1. There should be two dashboards, one for the SEMs and one for the SEs;
2.2. The dashboards should be customizable;
2.2.1. An SEM should be able to customize the dashboard for his or her team;
2.2.2. An SE should be able to customize the dashboard for him or herself;
2.3. When applicable, graphics such as bar, line, and pie charts should be included in the
dashboards instead of displaying plain data;
3. The system should be able to provide reports.
3.1. Each report should represent and expand a dashboard component;
3.1.1. The data in a report should be consistent with the dashboard component’s;
3.2. The reports should be customizable by the user;
3.2.1. The reporting criteria should be customizable;
3.2.2. The reported columns should be customizable;
3.2.3. The team coverage from reports, if applicable, should be customizable;
3.2.4. The territory coverage of a report should be customizable;
4.3 Design Phase
Using all the requirements that we gathered, we mapped out the layout of our dashboards. In our initial
design, each component of the dashboards was drawn on a whiteboard as we discussed about its
requirements. Also during our discussion, we determined the information each component should
contain, how each component should be displayed and its location on the dashboard it belonged to. We
placed similar components together based on the status of each report. We also determined which
summary reports should appear in pie chart form and which to appear in bar graph form. The design of
both dashboards on the whiteboard was later replicated in Microsoft Excel for better visual
representation (Figure 9 and Figure 10).
Figure 9. SEM Dashboard Mockup
Figure 10. SE Dashboard Mockup
Page 34
21
4.4 Implementation Phase
We used the agile development method as our implementation approach where we deployed the final
product in real-time and in production. The benefit of doing so was the ability to integrate opinions and
comments from the power users of our product while we were implementing the system, so that the
final deliverable will be more usable to the end users and more tailored toward their needs. It was also
the nature of SFDC. The way SFDC was implemented in the organization allowed any changes to be
deployed in real-time for end users’ use.
The initial system was completed and introduced to end users by December 18, 2009, to ensure that the
users would have access and familiarity with the system before the team sought feedback from them.
The two dashboards created were made accessible corporate wide and the project sponsor introduced
them to identified end users. We will first discuss the SEM dashboard, which is designed for the System
Engineer Managers, and then the SE dashboard, which is designed for System Engineers. The overall
designs of the two dashboards are presented in Figure 11 and Figure 12.
Page 35
Figure 11. SEM Dashboard Overview.
22
Dashboard Overview.
Figure 12. SE Dashboard
. SE Dashboard Overview.
Page 36
23
4.4.1 SEM Dashboard
The SEM dashboard is first of the two dashboards that were created for this project. The dashboard
consists of nineteen different reports pulled from Cisco databases. These reports show all the sales
opportunities that Cisco has in the current and the next three fiscal quarters. Since one report could
contain hundreds of records, this dashboard’s intention is to show an overview or summary of each
report. It helps managers to oversee and manage opportunity progress. In addition, it helps to recognize
abnormalities in opportunities and thus take appropriate actions to resolve such problems.
In Figure 11, we present the completed and design of the SEM Dashboard. It begins with a 3*3 matrix on
opportunities by stages followed by various tabular and graphic reports. The left column contains
reports created by AM. The center column contains reports created by PSS. The right column contains
report of opportunities that SEs are not assigned to. Now we discuss the detailed description of each
report of the SEM dashboard with screenshots included.
Figure 13 - Figure 15 present the AM opportunities separated by the three statuses: Not Forecasted,
Upside, and Commit. These figures are in the left column of the SEM dashboard. The Not Forecasted
status means that the time is relatively early in the process of closing the deals. The Upside status shows
promising conditions, and the Commit status shows that the opportunities are successful and are close
to be booked.
Figure 13. Top 10 AM Not Forecasted
Figure 14. Top 10 AM Upside
Figure 15. Top 10 AM Commit
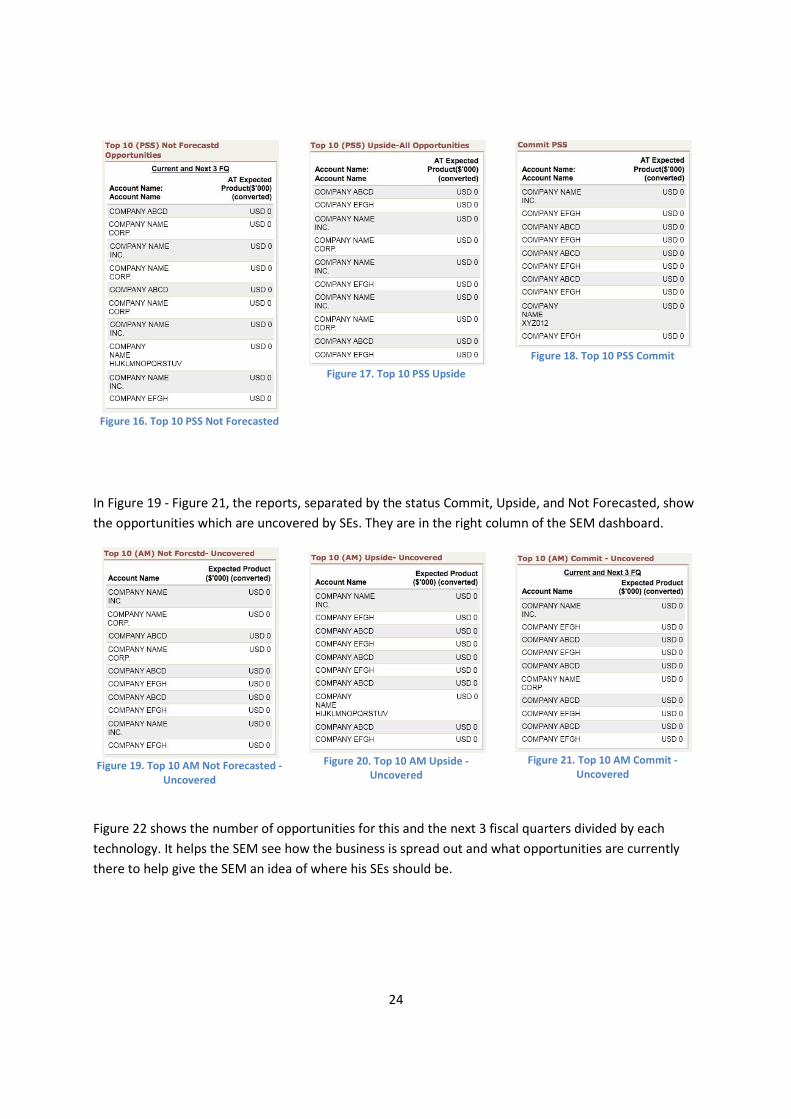
Figure 16 - Figure 18 present the PSS opportunities separated by the same three statuses. These figures
are in the center column of the SEM dashboard. PSS stands for Product Sales Specialist. The PSS will pair
up with Consulting Systems Engineer (CSE), in the way similar to the SE and AM collaboration, and
support multiple AM and SE pairs.
Page 37
24
Figure 16. Top 10 PSS Not Forecasted
Figure 17. Top 10 PSS Upside
Figure 18. Top 10 PSS Commit
In Figure 19 - Figure 21, the reports, separated by the status Commit, Upside, and Not Forecasted, show
the opportunities which are uncovered by SEs. They are in the right column of the SEM dashboard.
Figure 19. Top 10 AM Not Forecasted -
Uncovered
Figure 20. Top 10 AM Upside -
Uncovered
Figure 21. Top 10 AM Commit -
Uncovered
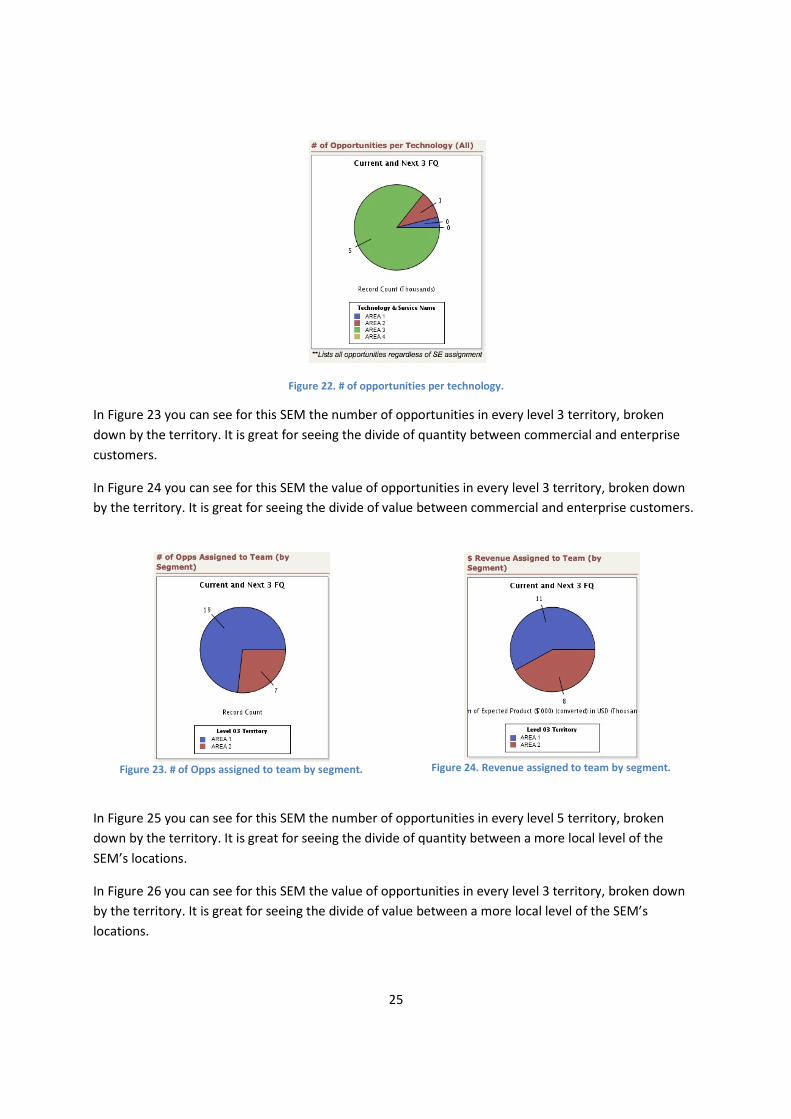
Figure 22 shows the number of opportunities for this and the next 3 fiscal quarters divided by each
technology. It helps the SEM see how the business is spread out and what opportunities are currently
there to help give the SEM an idea of where his SEs should be.
Page 38
25
Figure 22. # of opportunities per technology.
In Figure 23 you can see for this SEM the number of opportunities in every level 3 territory, broken
down by the territory. It is great for seeing the divide of quantity between commercial and enterprise
customers.
In Figure 24 you can see for this SEM the value of opportunities in every level 3 territory, broken down
by the territory. It is great for seeing the divide of value between commercial and enterprise customers.
Figure 23. # of Opps assigned to team by segment.
Figure 24. Revenue assigned to team by segment.
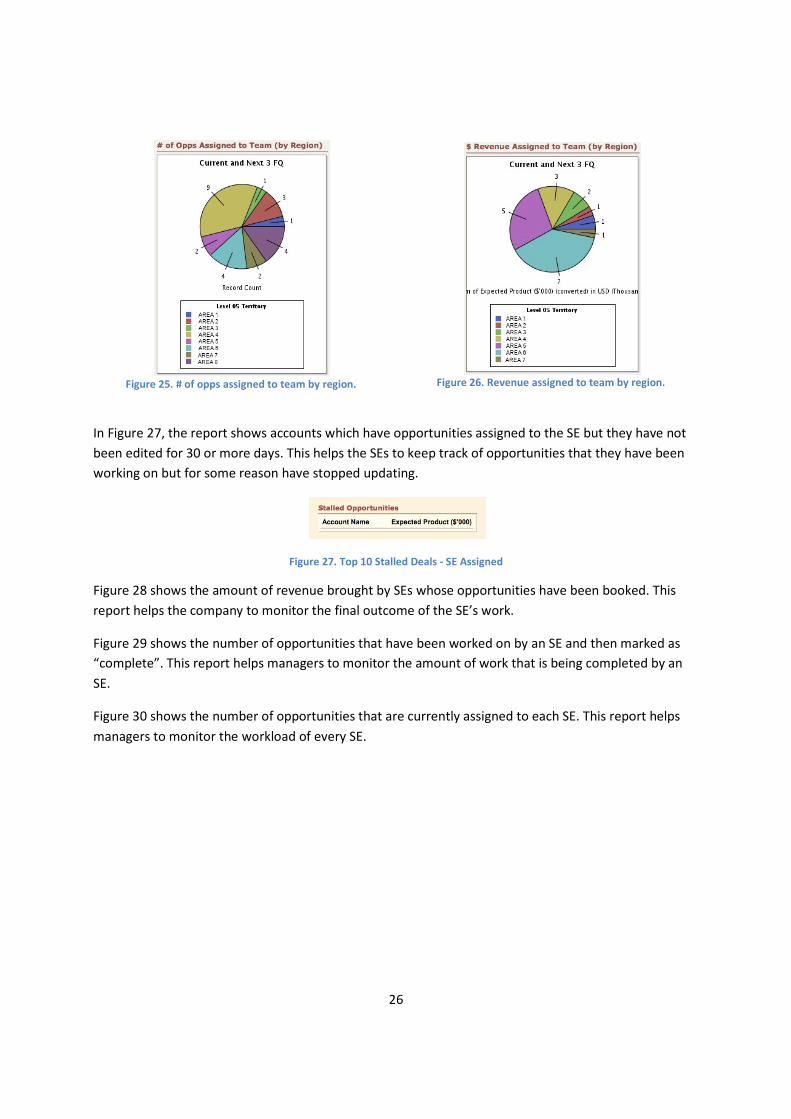
In Figure 25 you can see for this SEM the number of opportunities in every level 5 territory, broken
down by the territory. It is great for seeing the divide of quantity between a more local level of the
SEM’s locations.
In Figure 26 you can see for this SEM the value of opportunities in every level 3 territory, broken down
by the territory. It is great for seeing the divide of value between a more local level of the SEM’s
locations.
Page 39
26
Figure 25. # of opps assigned to team by region.
Figure 26. Revenue assigned to team by region.
In Figure 27, the report shows accounts which have opportunities assigned to the SE but they have not
been edited for 30 or more days. This helps the SEs to keep track of opportunities that they have been
working on but for some reason have stopped updating.
Figure 27. Top 10 Stalled Deals - SE Assigned
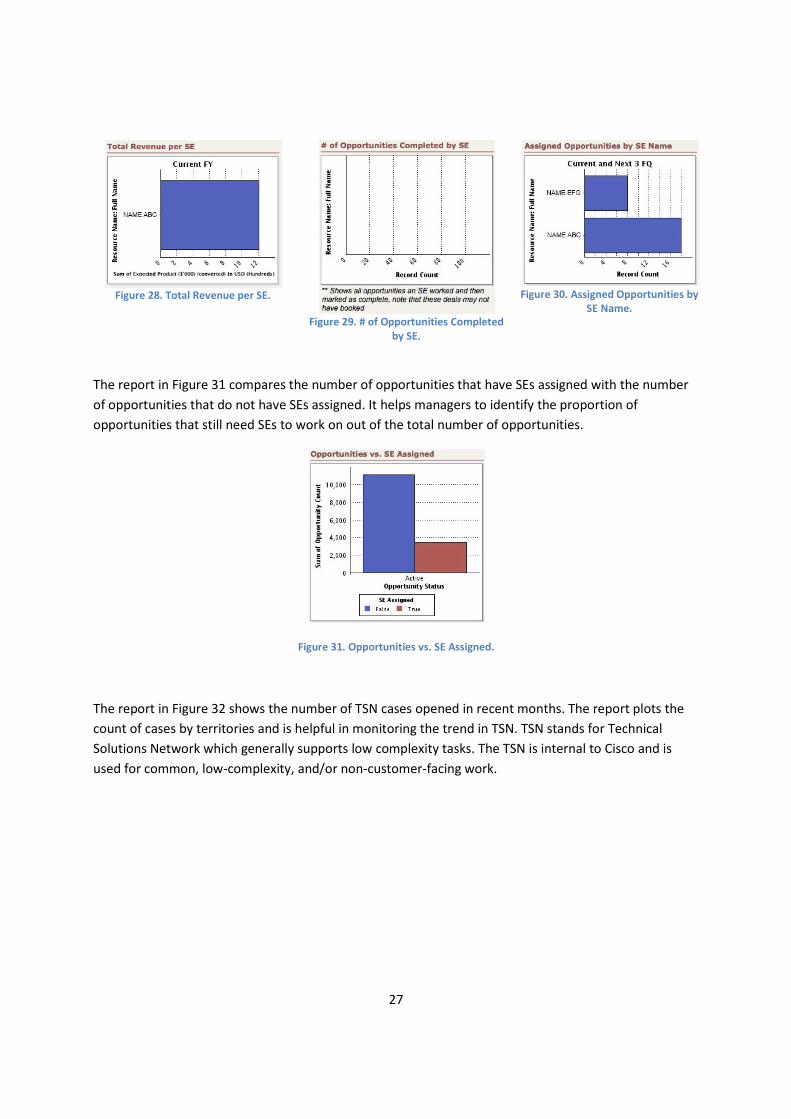
Figure 28 shows the amount of revenue brought by SEs whose opportunities have been booked. This
report helps the company to monitor the final outcome of the SE’s work.
Figure 29 shows the number of opportunities that have been worked on by an SE and then marked as
“complete”. This report helps managers to monitor the amount of work that is being completed by an
SE.
Figure 30 shows the number of opportunities that are currently assigned to each SE. This report helps
managers to monitor the workload of every SE.
Page 40
27
Figure 28. Total Revenue per SE.
Figure 29. # of Opportunities Completed
by SE.
Figure 30. Assigned Opportunities by
SE Name.
The report in Figure 31 compares the number of opportunities that have SEs assigned with the number
of opportunities that do not have SEs assigned. It helps managers to identify the proportion of
opportunities that still need SEs to work on out of the total number of opportunities.
Figure 31. Opportunities vs. SE Assigned.
The report in Figure 32 shows the number of TSN cases opened in recent months. The report plots the
count of cases by territories and is helpful in monitoring the trend in TSN. TSN stands for Technical
Solutions Network which generally supports low complexity tasks. The TSN is internal to Cisco and is
used for common, low-complexity, and/or non-customer-facing work.
Page 41
28
Figure 32. TSN Cases Opened.
4.4.2 SE Dashboard
The SE dashboard is similar to the SEM dashboard but it has a few differences. This dashboard is
intended to be used by Cisco system engineers. It consists of thirteen different reports. Some of these
reports are to be customized by each owner of the report so only opportunities that belong to the
owner would appear. This was done so that system engineers can better manage and focus on
opportunities that they are currently working on and not have to be confused by opportunities of
others. Furthermore, reports that include statistics of the owner’s opportunities can help the owner
monitor his performance.
Similar to the SEM dashboard, the SE dashboard (see Figure 12) is also organized in three columns. The
left column contains reports created by AM. The center column contains reports created by PSS. Finally,
the right column contains reports that include all types of opportunities within the owner’s visibility.
Below is the detail description of each report of the SE dashboard with screenshots included.
Figure 33 shows the top 30 AM opportunities assigned to the SE ranked by the value of the expected
product. Having this information helps the SE prioritize his or her work according to the size of the
opportunities that are assigned.
Figure 33. Top 30 AM assigned to me.
Page 42
29
Figure 34 shows the top ten non-forecastable opportunities indicated by PSS’s. These opportunities are
relatively early in the process of closing the deal.
Figure 35 shows the top upside opportunities indicated by PSS’s. These opportunities are between the
stage of non-forecastable and committed.
Figure 36 shows the top ten committed opportunities indicated by PSS. These opportunities are close to
being closed as the result of successful sales.
Figure 34. Top 10 PSS Not
Forecasted.
Figure 35. Top 10 PSS upside all.
Figure 36. Top 10 PSS commit all.
Figure 37 shows the top ten opportunities within visibility of the owner regardless of the status.
Figure 38 shows the top ten booked opportunities of the owner with SE assigned to them.
Page 43
30
Figure 37. Opportunities in my visibility.
Figure 38. Your booked opportunities.
Figure 39 shows a bar graph of booked opportunities with SE assigned.
Figure 40 shows the top ten stalled opportunities with SE assigned. These opportunities have been
inactive for a period of 30 days or more.
Figure 39. Your booked opps.
Figure 40. Top 10 stalled deals - SE assigned.
Figure 41 shows the opportunities lost by the owner in the current fiscal year. These opportunities are
grouped quarterly.
Figure 42 shows opportunities lost by the owner in the current fiscal year. These opportunities are
grouped by competitors.
Page 44
31
Figure 41. Your opportunities Lost.
Figure 42. Opportunities lost by competitor.
Figure 43 shows the number of TSN cases by territory over time, which helps the SEs to monitor the
TSN’s side of business.
Figure 43. TSN Cases for ops w/ Deal ID.
4.4.3 Rollout Timeline
The initial rollout of the dashboards was in late December 2009. An email was sent to approximately 150
users including both SEMs and SEs notifying them about the new dashboards. After the initial rollout,
the team was available to respond to issues arose regarding functionality of the system. In addition, to
ensure that important reports were brought to the attention of the team as early as possible, we
recommended end users to submit report requests by February 1, 2010. Simpler requests were
accommodated later in the schedule.
Page 45
32
4.4.4 User Training
Base on the high technical skill level of our end users and time constraints, we’ve determined computer
based training materials including paper document and Cisco WebEx video were the best approach to
training. The materials were made available on Cisco network which can be accessed 24/7 by any Cisco
employees. With these materials, not only users are more prone to adopt the system, they can also
learn at their own pace. These materials aimed to be easy to understand and facilitate all necessary
information for our end users to complete their tasks..
Specifically, these materials showed the purpose of each element on the dashboards and of each report.
In addition, specific example scenarios were included for common tasks including: how to modify
dashboards and reports and how to tailor them to individual needs.
The project sponsor recorded videos on WebEx when walking through the system with SEs and
managers. These videos have then become accessible within Cisco.
The videos are good for a broad introduction into Salesforce.com, as it provides a complete walkthrough
of the initial setup for a person. In addition to the videos, the team also prepared paper documentation
for training. The paper documentation is based on the recorded videos but is more beneficial for
individual questions. The paper documentation can be seen in section Appendix B.
4.4.5 Acceptance and Usability
Usability testing is an important step to ensure user acceptance of the product. As the majority of the
MQP is a process of configuration, the team did not have absolute control over the platforms,
technologies, and code being utilized, and therefore conducting usability testing gave our team the
opportunity to ensure quality of the configured system. Usability testing also helped us identify future
directions or minor technical issues that can be addressed outside the scope of the project.
Focus Groups were chosen to test out the dashboards for usability as well as acceptance. We then want
to take this data and pass it on to Cisco so that they can take this data and make necessary changes to
the system to make it so that it is better accepted as well as to make it more usable for the users of the
system.
Focus groups are valuable tools that with a variety of reasons that make them ideal for gathering
acceptance and usability information. The first reason is that you are able to get information from
multiple people all at the same time (Morgan, 1998). This is beneficial to save you time as well as to hear
multiple views on the questions you are asking.
Focus groups are also beneficial because the groups spark conversations between the participants
(Morgan, 1998). This means that you are able to get more information out of each participant as they all
cause each other to go more in depth. This is also something that makes focus groups different from
interviews. Because of the conversations that are sparked when you have multiple people in the room
you can find out information you otherwise may have not learned.
Page 46
33
Focus groups were chosen by our group to get information in the quickest and most reliable manner
(Morgan, 1998). Interviews would take too long as we would have to set up a time for everyone to
interview individually. Surveys might have worked but because of the low response rate we discounted
this option. Therefore we went with focus groups instead as the best option for our group.
Some issues or limitations that may come up from running a focus group are the discussion going off
course, or the respondents feeling pressured to answer one way or another because of either the
moderator or other people in the focus group (Morgan, 1998). Dealing with these issues is our group’s
number one concern. We made sure to be an effective but not overpowering moderator in order to
keep the discussion on topic, but not too much to scare people from talking. We made sure to split up
the SEs and the SEMs in order to remove the pressure to give one answer or another. While this did not
entirely solve the problem it was a great way to lessen it.
4.4.5.1 Focus Group
In order to run a successful focus group we followed the following set of steps. The first overarching step
needed is the planning step (Morgan, 1998). These start with defining the purpose for our focus group
(Morgan, 1998). Once we have defined a purpose, we then have to make sure to set a timeline for the
focus group (Morgan, 1998).
The next overarching step is recruiting (Morgan, 1998). This is where we have to identify who will be
involved in this focus group (Morgan, 1998). We also have to make sure they are a good cross section
and will give a very broad idea of the business.
Then we need to find about 4-7 questions to ask the participants to successfully use about 1-2 hours of
time (Morgan, 1998). We need a set of open-ended questions in order to get the most value out of the
focus group. We want all the participants to have an open discussion, but we will need our facilitator to
make sure to still keep the conversation on topic.
With these questions we will need a script planned out (Morgan, 1998). This script will be important to
keeping the conversation on topic and making sure that we get all the information that we need out of
this focus group. We need to develop three sections that are very basic going first to opening, then to
the questions section and then to the closing.
As previously mentioned we need a facilitator in order to keep the conversation on topic. We also need
a location (Morgan, 1998). The moderator need to make sure that the facilities are set up correctly in
order to run a successful meeting (Morgan, 1998).
Throughout this focus group session we need to make sure to either take notes, or to record the whole
session (Morgan, 1998). This is important in order to make sure that we can use the data. We also need
to begin preparing for the last step, which is analyzing and reporting (Morgan, 1998).
The purpose for our focus group is to do some acceptance testing on the dashboards as well as the new
Salesforce system for the SEs and SEMs. We conducted this focus group from February 8th through the
24th by recruiting participants through email. The emailed invitation letter can be seen in Appendix C.
Page 47
34
Questions to our focus group participants were carefully designed and adapted from the Unified Theory
of Acceptance and Use of Technology (UTAUT) model. The UTAUT is a widely used research model for IT
acceptance; it has unified eight peer-reviewed models and has been well-tested (Venkatesh, Morris,
Davis, & Davis, 2003). UTAUT has four determinants of intention and usage and up to four moderators
of key relationships, as shown in Figure 44 (Venkatesh, Morris, Davis, & Davis, 2003).
Figure 44. UTAUT Overview.
4.4.5.2 Questions
The questions that we asked are listed below. The agree or disagree questions were asked while
transitioning between qualitative questions.
1. Demographic questions:
1.1. Gender: M/F
1.2. How long have you used SFDC (previous experience with SFDC)?
2. Agree or disagree (on a scale of 1 to 7)
2.1. I would find it easy to get SFDC to do what I want it to do;
2.2. In general, the organization has supported the use of the system;
2.3. Guidance was available to me in the selection of the system.
2.4. Using SFDC would improve my job performance;
2.5. How satisfied are you with the system?
3. Qualitative
3.1. In general, what do you think of SFDC?
3.2. What features do you find most useful/like the most/least?
3.3. Have you used any of the training materials and/or the office hours?
3.3.1. Liked them?
Page 48
35
3.3.2. Are they helpful?
3.3.3. Is there anything we could have done better?
3.4. Time management
3.4.1. How long did it take to set up SFDC? How much time do you spend on SFDC on a daily
basis?
3.5. Have you considered using an alternative to SFDC? Anything better than SFDC?
4.4.5.3 Procedures
The facilitators or moderators for this focus group were John Russo and Brian Ketterer. John was the
main moderator that spoke to the participants. Brian was the shadow moderator to ensure everything
goes smoothly and on schedule. The note takers were Nhi Dao and Rui Dai. The focus group took place
via Webex.
John started with the following script as an icebreaker:
Welcome everyone to our focus group. I am John and I will be the moderator of this session. I
have Brian here who will make sure that we are on schedule. He may also jump in once in a
while to follow-up on some of your comments. Rui and Mannhi are also in this meeting and they
will be taking notes as we go along. At the end of the focus group, we will give them an
opportunity to summarize what they have heard from you in this one hour session. You will
have a chance to confirm our understanding at this point.
As you all know, we are conducting this focus group to get feedback from you guys on your use
of salesforce.com as well as how much you like it so far in the next hour. Remember that this is
also a chance for you to win yourself a nice new Flip camera. Has anyone had a chance to use a
Flip camera?
This first question was asked as an ice breaker in order to get the people involved to feel comfortable
and in hopes to get them talking throughout the rest of the meeting. After this we spent about 8
minutes on every topic for the qualitative questions, going in the order they are listed. And then after
the qualitative question we asked a poll question.
At the end of all these questions we had the note takers summarize everything that was discussed and
said it back to them then asking if the participants had anything they wanted to add. This was used to
show what we felt was important and giving the participants a chance to add anything they may feel has
been left out. Refer to Table 1.
Page 49
36
Table 1. Focus Group Protocol.
Time
(min)
Main Subject Poll Questions
0 Icebreaker (see above)
5 Poll the audience on demographics
Questions 1.1, 1.2, and 1.3
8 Question 3.1: General
“Thanks for your answers. Ok, since you have
been using SFDC for a while now, what do you
think about it?”
16 Question 3.2: Features
Question 2.1
24 Question 3.3: Training
Question 2.2 & 2.3
32 Question 3.4: Time management
Question 2.4
40 Question 3.5: Alternative
48 Final poll: how satisfied are you with the system? Question 2.5
50 Reiteration of notes.
“Is there anything you would like to add?”
60 End of session
4.4.5.4 Participation problem
For our study we intended to conduct two focus groups for SEs and SEMs separately to gather
qualitative user feedback on the usability and effectiveness of the dashboards. However, because of
unavailability, we could not obtain enough participants for our focus groups. Therefore, we conducted
individual interviews with three employees: one SEM and two SEs. These interviews yielded meaningful
user feedback for the improvement of the system. Transitioning to interviews lost the conversations and
discussions that would have been available in focus group sessions. However, we were able to collect
some valuable insights. We used the same questions and techniques identified for our focus group
plans.
In addition, the quantitative questions lost their value. For example, for those questions we only had
one opinion from the SEM and two from the SEs. Also, because of the lack of people, the honesty of the
poll responses was diminished as their responses were easily tied to the individuals.
4.4.5.5 Interview Results
In this section, feedback from the SEMs and SEs is presented together with conclusion and
recommendations from the MQP team. The full transcripts can be found in Appendix D.
Page 50
37
Both the SEM and SE viewed the training provided very positively. They agreed that the organization had
good support and incentive for the adoption of the system. They agreed that there was no obvious
alternative to SFDC which was currently their best tool.
They both expressed an ambiguous view toward the easiness of using SFDC. Some were frustrated at
the initial setup with the system, especially with the territory settings, but the training material helped
to some extent.
SEM:
We unfortunately obtained only one response from the SEM group, and all the analysis below is based
on that one response.
The SEM viewed Salesforce.com much more positively than the SEs did. Since Salesforce.com was
designed to be a CRM tool in the first place, it was used by the managers for a longer period of time. The
SEM really benefited from the reporting that SFDC provided.
The SEM recommended that there should be a way to track time allocation for SEs. She also
recommended a way to view notes in the reports be looked into. Currently she has to click into each of
the individual opportunities to get this information.
SE:
One view shared by the SEs was that they were using SFDC because they were told to. It was an
additional task to engage themselves to the opportunities and they were doing it in SFDC mainly
because their supervisors wanted them to. However one SE did show interest in a report in which he
was able to see the opportunities in his team so that he could arrange his work better.
An important fact about the SEs’ work was that their use of the system largely depended on the
information inputted by the AMs and other SEs. Without the right data, they still had to inquire and
follow up with the AMs in the traditional way (e.g. over the telephone). “The SFDC contains nothing
more than the accounts, opportunities, their phase and location – rarely do you even see an SE on a
particular account,” said one SE, who thought the AMs were not driven to use this tool as much as the
SEs were. One SE claimed that probably only half of the opportunities that he worked on exited in SFDC.
One SE reported that his AM was still using the old engagement model, using either email or phone calls
to assign opportunities to the SE. Without the full and true adoption of the system in the organization,
SEs cannot fully utilize the benefits of the system.
In addition, the SEs did not think SFDC was productive enough. One SE really wanted a better search
functionality to find the right opportunity easier.
5 Conclusions
In this project we provided a solution based in Salesforce.com aiming to alleviate issues such as
collaboration road blocks and inability to track key metrics in Cisco. Using agile development
Page 51
38
methodology, we implemented dashboards and reports which provided necessary visibility for sales and
engineering activities. This project was concluded with end-user interviews to offer practical and
valuable insights for a better adoption of the system. Based on our experience in this project over 21
weeks and based on the feedback we received from users and our sponsor, we came up with the
following recommendations for Cisco. We believe that these recommendations will improve the
adoption of dashboards and SFDC in the company.
Recommendation 1: We recommend Cisco continues to drive adoption and ensure quality data and
usage of the system. Cisco can continue to use the Management By Objective methodology to provide a
strong incentive for Cisco employees to use SFDC. Cisco can also educate employees on the benefits of
using SFDC.
Recommendation 2: We recommend Cisco continues to work with SFDC to customize and provide
enhancements for the system. As starting points, we recommend increasing the visibility of the notes
section for SEMs and improving search functionality for opportunities for SEs.
Recommendation 3: Cisco employees need to access multiple sources of information simultaneously. To
accommodate this, we recommend Cisco includes domain integration with SFDC. This allows SEs to see
each other’s presence and calendar information while they are using SFDC. An iGoogle style interface
would be desirable where the user can see his/her emails, calendar, and SFDC information in one
location.
Recommendation 4: We recommend Cisco to develop SFDC training materials and applications for smart
phones like iPhone and Blackberry. We believe that it will be beneficial to make these applications
available together with other training materials for the SFDC apps on other handheld platforms.
Recommendation 5: Due to the increased use of SFDC in the organization, we recommend Cisco
establishes a team of SFDC specialists to help with critical issues and requests for the system.
This project was a necessary and critical step for Cisco to improve the visibility of sales and support
activities. The investigation of the user feedback was able to provide Cisco with valuable
recommendations and perspectives regarding the system. By working with a business unit and a
management objective, the team was better able to understand the impact of IT on the business and
operations of Cisco. Throughout the project, the team communicated with Cisco employees
professionally and effectively. The constant and frequent changes that took place in the project
represent the reality of the fast-paced business world, and the ability to handle changes was a valuable
asset for the team.
Page 52
39
6 Bibliography
Bygstad, B. (2003). The Implementation Puzzle of CRM systems in knowledge based organizations. 11.
Capgemini. (2006). The Importance of Business Intelligence. Retrieved September 20, 2009, from
capgemini.com:
http://www.dk.capgemini.com/resources/thought_leadership/the_importance_of_business_intelligenc
e/?d=1
Chaudhuri, S., & Dayal, U. (1997, March). An overview of data warehousing and OLAP technology. ACM
SIGMOD Record , 65 - 74.
Cisco Systems. (2009, September 17). Fact Sheet. Retrieved September 20, 2009, from News@Cisco:
http://newsroom.cisco.com/dlls/corpinfo/factsheet.html
Cisco Systems, Inc. (2009). Cisco Systems, Inc. 2009 Annual Report. Retrieved 1 31, 2010, from
https://materials.proxyvote.com/Approved/17275R/20090914/AR_46080/HTML2/default.htm
Dennis, A., Wixom, B., & Roth, R. (2006). Systems Analysis and Design (3rd Edition ed.). John Wiley &
Sons, Inc.
Enrico, R. (2008). CRM 2.0 - Where Web 2.0 meets CRM. Retrieved December 2, 2009, from CRM Today:
http://www.crm2day.com/highlights/50455.php
Fabbi, M., & Zimmerman, T. (2009). Magic Quadrant for Enterprise LAN (Global). Gartner Research.
Gartner. (2009, January 15). Gartner Reveals Five Business Intelligence Predictions for 2009 and Beyond.
Retrieved September 20, 2009, from Gartner: http://www.gartner.com/it/page.jsp?id=856714
Gartner. (2007, August 20). Magic Quadrant for Unified Communications. Retrieved February 14, 2010,
from Gartner's:
http://my.gartner.com/portal/server.pt?open=512&objID=260&mode=2&PageID=3460702&resId=1158
812&ref=QuickSearch&content=html
Ghavami, A., & Olyaei, A. (2006, 02). The Impact of CRM on Customer Retention.
Gifford, E. (2010, January 27). customer relationship management. Retrieved January 27, 2010, from
http://www.businessballs.com/crmcustomerrelationshipmanagement.htm
Golfarelli, M., Rizzi, S., & Cella, I. (2004). intelligence?, Beyond data warehousing: what's next in
business. Proceedings of the 7th ACM international workshop on Data warehousing and OLAP, (pp. 1-6).
Hoover's. (2010). Cisco Systems, Inc. information and related industry information. Retrieved January 29,
2010, from Hoover's: http://premium.hoovers.com/subscribe/co/factsheet.xhtml?ID=rycscrhyxfchkf
Kim, J., Suh, E., & Hwang, H. (2003). A Model for Evaluation the Effectiveness of CRM Using the Balanced
Scorecard. JOURNAL OF INTERACTIVE MARKETING , 17 (2), 5-19.
Page 53
40
Lapp Jr., R. (2009, October 7). Cisco's Use of SFDC. (W. M. Team, Interviewer)
Luhn, H. (1958, October). A Business Intelligence System. IBM Journal , 314-319.
MacManus, R. (2007, April 9). Salesforce.com Brings Web 2.0 To The Enterprise With ContentExchange.
Retrieved March 20, 2010, from Read Write Web:
http://www.readwriteweb.com/archives/salesforce_contentexchange.php
Maoz, M. (2009, 3 3). Gartner. Retrieved 12 6, 2009, from Gartner:
http://my.gartner.com/portal/server.pt?open=512&objID=260&mode=2&PageID=3460702&resId=9057
15&ref=QuickSearch&content=html&highlight=toggle
McGuigan, B. (2009, September 17). What is Business Intelligence? Retrieved September 20, 2009, from
wiseGEEK: http://www.wisegeek.com/what-is-business-intelligence.htm
Miller, R. (2009, April 30). Web 2.0 for CRM Users. Retrieved December 5, 2010, from Focus:
http://www.focus.com/articles/crm/web-20-crm-users/
Morgan, D. L. (1998). The Focus Group Guide Book. Thousand Oaks, CA: Sage Publications, INC.
Negash, S., & Gray, P. (2008). Business Intelligence. In Handbook on Decision Support Systems 2.
Springer Berlin Heidelberg.
OLAP Council. (1997). OLAP Council White Paper. Retrieved September 20, 2009, from
http://www.symcorp.com/downloads/OLAP_CouncilWhitePaper.pdf
Orans, L., Pescatore, J., & Nicolett, M. (2009, March 27). Magic Quadrant for Network Access Control.
Retrieved February 14, 2010, from Gartner's: http://www.gartner.com/technology/media-
products/reprints/juniper/vol4/article3/article3.html
Phelan, P. (2009, March 19). To Upgrade or Not to Upgrade: The Big ERP, SCM, CRM Question.
Power, D. J. (2007, March 10). A Brief History of Decision Support Systems. Retrieved September 20,
2009, from DSSResources.COM: http://dssresources.com/history/dsshistory.html
Raaij, B. v. (2008, August 21). Fifty years of Business Intelligence. Retrieved September 20, 2009, from
Intelligent Business: http://www.intelligent-business.nl/science/fifty-years-of-bi/
salesforce.com. (2008, 10 31). Milestones. Retrieved 10 03, 2009, from
www.salesforce.com/company/milestones/
Venkatesh, V., Morris, M. G., Davis, G. B., & Davis, F. D. (2003, September). User Acceptance of
Information Technology: Toward a Unified View. MIS Quarterly , 425-478.
Whitney, L. (2010, 1 21). The Pros and Cons of Cloud Computing. Retrieved from TMCnet: http://hosted-
voip.tmcnet.com/feature/articles/73194-pros-cons-cloud-computing.htm
Page 54
41
Appendix A Project plan
Page 55
42
Appendix B Training Material
Page 66
53
Appendix C Focus Group Interview Now that the Salesforce.com Resource Assignment Engine and Dashboards have been successfully
launched we would love to hear from you about how it is going. We have a project team from WPI who
are working with us to ensure the Salesforce.com success. How do you like it so far? Is it helpful? What
do you think of the technology or the process? You are invited to participate in a focus group about the
use of salesforce.com for opportunity/account management. Participants will be entered into a raffle to
win 1 of 5 available flip video cameras.
If you would like to participate please send a short email, answering the following questions, to
[email protected] :
• Are you an SE or SEM?
• How often are you using salesforce.com opportunity management dashboard?
1. Not at all
2. Occasionally
3. Sometimes
4. Frequently
5. Always
• Within which of the following categories do you think you are?
1. Using Salesforce.com because it’s critical to my success and day to day operations
2. Using Salesforce.com because I am told I have to and wish I didn’t
3. Not using it and I hope no one finds out
About the study
We will be hosting focus groups during February 8-19 to understand how the system is used currently
and how it can be improved. The interviews are likely to be conducted via WebEx meetings. We will try
our best to accommodate your availability once you respond to this email.
Participation in this study is completely voluntary and all the responses provided during the focus groups
will be kept confidential. In our project report we will only report aggregate de-identified information.
About us
We are a group of students from Worcester Polytechnic Institute working on our senior project.
Beginning September 2009, we have worked with Bill Lapp to design and customize SFDC dashboards
and reports for SEs and SEMs.
We believe your input will enable us to provide helpful information regarding the adoption and
organizational impact of SFDC at Cisco. We appreciate your time and assistance.
Sincerely,
Mannhi Dao [email protected]
Rui Dai [email protected]
Brian Ketterer [email protected]
John Russo [email protected]
Page 67
54
Appendix D Focus Group Transcripts 1. SEM
• Are you an SE or SEM?
SEM
• How often are you using salesforce.com opportunity management dashboard?
ALWAYS
• Within which of the following categories do you think you are?
Using SFDC because it’s Critical to my success and day to day operations
How long have you used SFDC (previous experience with SFDC)?
2 years, probably 3 years. Originally I used SFDC as a forecasting tool but recently more functionality was
put in.
1. In general, what do you think of SFDC?
I hope SFDC provides more visibility so that the SEs don’t have to update spreadsheets to record
their time allocation.
2. What features do you find most useful/like the most/least?
Most useful: the dashboard, which gives SEs a quick snapshot and it is a perfect thing.
Least useful: SE workspace; it is confusing and cumbersome. SEs would rather create their own
dashboards than use that.
3. Have you used any of the training materials and/or the office hours?
I didn’t use them, but I reviewed them and think they’re very well done. I met one-on-one with my
engineers so that there was no problem setting up the dashboard. SE’s also walked through the
video step by step. Some SEs joined the office hours to the best of my knowledge.
4. Time management
I don’t use SFDC daily; probably three times a week. When more status updates are put in, I will use
it more frequently.
5. Have you considered using an alternative to SFDC? Anything better than SFDC?
SFDC doesn’t tell the percentage of time allocated to Enterprise vs. commercial. There is a gap on
where the time is being spent.
Page 68
55
Quantitative:
Question Answer
1. I would find it easy to get SFDC to do what
I want it to do;
3; sometimes it is difficult but SFDC is certainly
capable of doing a lot of things;
2. In general, the organization has supported
the use of the system;
2;
3. Guidance was available to me in the
selection of the system.
1; it was well done.
4. Using SFDC would improve my job
performance;
N/A
5. How satisfied are you with the system? 3; I will really need a report for notes.
Comment:
There is no report that retrieves the notes and I can’t figure out how to pull them out. There will be no
real benefit unless the notes can be pulled out easily.
There was some struggling on setting up the right territory views.
Page 69
56
2. SE No. 1
• Are you an SE or SEM? SE
• How often are you using salesforce.com opportunity management dashboard? Sometimes
• Within which of the following categories do you think you are? Using SFDC because I am told I
have to and wish I didn’t.
How long have you used SFDC (previous experience with SFDC)?
I don’t have any experience with SFDC before.
1. In general, what do you think of SFDC?
Overall it’s good, but a lot of account opportunities are missing in the system. Probably only half of
the opportunities that I have worked on are loaded.
2. What features do you find most useful/like the most/least?
Most useful: N/A.
Least useful: The tabs. Not everything was laid out in front of me. Search functionality was poor.
There was probably only one way to search, which was to search through accounts.
3. Have you used any of the training materials and/or the office hours?
I used the training video that was offered to the team.
4. Time management
I don't use it daily. Probably weekly and 20-30 minutes throughout a whole week.
5. Have you considered using an alternative to SFDC? Anything better than SFDC?
No.
Page 70
57
Quantitative:
Question Answer
1. I would find it easy to get SFDC to do what
I want it to do;
3;
2. In general, the organization has supported
the use of the system;
3;
3. Guidance was available to me in the
selection of the system.
1;
4. Using SFDC would improve my job
performance;
5;
5. How satisfied are you with the system? 4;
Comment:
I wish the search functionality could be improved.
Page 71
58
3. SE No. 2
• Are you an SE or SEM? SE
• How often are you using salesforce.com opportunity management dashboard? Occasionally
• Within which of the following categories do you think you are? Using SFDC because I am told I
have to and wish I didn’t.
How long have you used SFDC (previous experience with SFDC)?
6 months.
1. In general, what do you think of SFDC?
SFDC is not used enough in the team that I support. Our AMs are using it because they are told to,
but it is not a tool to truly manage accounts yet. There are not as many details recorded into SFDC as
I would need. As a result, I have to ask the AM to get the information I need. AMs are not using SFDC
to make requests, but use the old engagement method such as phone calls. Most of my requests
came from AMs calling me. The SFDC contains nothing more than the accounts, opportunities, their
phase and location – rarely do you even see an SE on a particular account. I don’t think the AMs are
driven to use the tool as we SEs are. Also, some AMs are driving people to use SFDC, but some are
not.
- Do you use SE workspace?
Occasionally… I mainly look at the top opportunities.
2. What features do you find most useful/like the most/least?
Most useful: Dashboards and reports. I can see what is ahead in this quarter, get as much
information about it as possible, and see what I can help with. Dashboards handle this just fine, and
I can run some reports in the same way.
Least useful: N/A.
3. Have you used any of the training materials and/or the office hours?
I have done some of the recorded and live trainings, but I did not use the training on VOD. In
addition, my AM did some training for us.
The nature of our work is very fast paced. I would like to have a quick reference to some shortcuts
or tricks that people know and think may be helpful for others.
I understand that there is an iPhone tool available but I would like to know how to use that. It would
be nice if there is a training material on that.
Page 72
59
4. Time management
Setup SFDC
I requested an account that was built and my profile let me see what I should see. I did not have
much trouble setting up SFDC.
Building reports
My manager and I are working together to tune the reports for my own need.
Weekly usage of SFDC
2 hours at most.
5. Have you considered using an alternative to SFDC? Anything better than SFDC?
No.
Quantitative:
Question Answer
1. I would find it easy to get SFDC to do what
I want it to do;
3;
2. In general, the organization has supported
the use of the system;
6;
3. Guidance was available to me in the
selection of the system.
2;
4. Using SFDC would improve my job
performance;
3;
5. How satisfied are you with the system? Personally 3;
5 or 6 for the use of others because not
everybody is using it appropriately.
Comment:
Can we integrate my Outlook calendar with the one in SFDC? Would there be plans to integrate Cisco
products with SFDC? For example, it would be great if I can see someone’s presence in SFDC and be able
to call him/her.
Page 73
60
4. SE No. 3
• Are you an SE or SEM? CSE.
• How often are you using salesforce.com opportunity management dashboard?
Frequently – at least weekly
• Within which of the following categories do you think you are?
Using Salesforce.com because it’s critical to my success and day to day operations –
absolutely, it’s a measuring tool.
We were unable to follow up with this SE.
5. SE No. 4
• Are you an SE or SEM? CSE.
• How often are you using salesforce.com opportunity management dashboard?
Occasionally
• Within which of the following categories do you think you are?
Using Salesforce.com because I am told I have to and wish I didn’t.
We were unable to follow up with this SE.
6. SE No. 5
• Are you an SE or SEM? SE.
• How often are you using salesforce.com opportunity management dashboard?
Occasionally
• Within which of the following categories do you think you are?
Using Salesforce.com because I am told I have to and wish I didn’t.
We were unable to follow up with this SE.