2015 2015 ANNUAL REPORT INDUSTRIAL BANK CO.,LTD. Green Finance , Better Tomorrow Add: No. 154 Hudong Road, Fuzhou, Fujian, P.R.C T e l : (86)591-87839338 F a x : (86)591-87842633 P. C : 350003 www.cib.com.cn THE FIRST EQUATOR BANK IN CHINA
Transcript
2015
2015ANNUAL REPORT
IND
USTR
IAL BANK C
O.,LTD
.
Green Finance , Better Tomorrow
Add: No. 154 Hudong Road, Fuzhou, Fujian, P.R.CT e l : (86)591-87839338F a x : (86)591-87842633P. C : 350003www.cib.com.cn
Overthepastfiveyears, the industrypositionfurther improvedwiththekeyperformanceindicatorsdoubled.Asat theendof2015,theCompany’s totalassets,balanceofdeposits ,balanceof loans,equity interestattributable to theordinaryshareholdersof theparentcompanyamounted toRMB5.30trillion,RMB2.48trillion,RMB1.78trillion,andRMB287.743billionrespectively,being2.86times,2.19times,2.08times,and3.13timesofthoseoftheendof2010respectively,enablingittorankthetop10DomesticBanks,Top50GlobalBanks,Top500WorldEnterprises,andtakethe6thplaceinallAsianbankswithregardtocompetitivenessofAsianbanks.TheBankactivelyandfullydisclosedrisks.ThebalanceofNPLswrittenoffandtransferredduringthepastfiveyearsaccumulatedtoapproximatelyRMB80billion,andtheNPLratioattheendof2015was1.46%.Theassetsqualitywasoverallcontrollable.Onthatbasis,netprofitattributabletotheshareholdersoftheparentcompanyaccumulatedtoapproximatelyRMB200billion,cashdividendsdistributedwereoverRMB40billion,averagerateofreturnontotalassetswas1.17%,andaveragerateofreturnonnetassetswas22.72%duringthepastfiveyears.TheBankmaintainedastableandsoundfinancialpositionandwontheawardofthe“Asian Bank Offering the GreatestReturntoShareholders”.
Over thepast fiveyears, thepositionasamainbankinggroupwasestablishedwith thesmoothprogressofcomprehensiveoperating layout.FollowingtheestablishmentofIndustrialBankFinancialLeasingCo.,Ltd.in2010,theCompanymergedUnionTrustLimitedandrenameditasChinaIndustrialInternationalTrustLimitedin2011,establishedCIBFundManagementCo.,Ltd.in2013,andIndustrialConsumerFinanceCo.,Ltd.in2014,andpurchasedNingboShanliFuturesBrokerCo.,Ltd.andrenameditasCIBFuturesCo.,Ltd.in2014,establishedChinaIndustryDigitalFinancialService(Shanghai)Co.,Ltd.andIndustrialEconomicResearchandConsultingCo.,Ltd. in2015.Meanwhile, theCompanyconstantlyexpandeditsbusinessscopeviareinvestmentofsubsidiaries,andtheCompanyhasbecomeoneofthefewdomesticbankholdinggroupsthatpossessfullfinanciallicenses.TheBankinsistedongivingfullplaytotheadvantageofmulti-licenseoperation,andcontinuedtoexpandthescopeofthecollaborationandlinkagebetweenparentcompanyandsubsidiariesandbetweensubsidiaries,whileenablingthetheGrouptoimproveitsoverallcompetitioncapability,customerserviceabilityandbusinesscomprehensiverevenue.Meanwhile,theGroupwonthe“AnnualFinancialHoldingGroupAward2015”.
Over thepastfiveyears, theeffectivenessofoperational transformationgradually revealedwith theconsensusreachedoncapitalsavingconcept.Adheringtothecapitalsupplementationprincipleof“givingprioritytointernalaccumulationwithexternalsourcesasthesupplement”,theCompanysupplementedcoretieronecapitalofoverRMB150billionbyprofitretentionduringthepastfiveyears.TheCompanyfurtheroptimizedshareholderstructureandraisedcoretieronecapitalofRMB23.532billionthroughprivateplacementtoshareholdersincludingPICCandChinaNationalTobaccoCorporation.TheCompanyactivelycarriedoutcapital instrument innovation,became thefirstbatchofpreferredsharepilotbanks, raised tieronecapitalofRMB25.905billion,andcompletedtwosupplementationoftiertwocapitalofRMB30billionintotal, therebypromotingthesustainableandhealthydevelopmentof itsvariousbusinesses.Attheendof2015,theCompany’snetcapitalreachedRMB383.504billion,being3.43timesofthatof theendof2010,withcapitaladequacy ratioof11.19%andadequacy ratioofcore tieronecapitalof8.43%.TheCompanyestablished theall-roundandactivecapitalmanagementconcept,promoted transformationofoperationmodeandcultivationofstrategickeybusiness throughcapitalmanagement,builtcharacterizedoperationanddifferentiatedcompetitionadvantages.Currently,theCompanyhasbecomeamainstreamcompetitorin thedomesticurbanizationfinance,apioneer in thegreenfinance,a forerunner in the interbankbusinessfinanceandanadvocatorofpensionfinance.Moreover,theCompanytooktheleadinpositioningitselfformultiplemarkets,suchasmoneymarket,capitalmarket,preciousmetalsmarket,foreignexchangemarket,andderivativesmarket,etc.,therebyenjoyingfirst-moveradvantages.
Over thepastfiveyears, the reformofbusinessgovernancesystemconstantlydeepenedwith thestableoperationofcorporategovernance.TheCompanysmoothlycompleted theworkhandoverof thepresidentand two termsofchairmenof theboardofsupervisors,appointed fournewvicepresidents, thereby realizingastable transitionof theseniormanagement teamwhile following itsoperationstrategies.TheCompanysuccessfullycompleted thechangesof the8thsessionof theboardofdirectorsand resignandadditionofpartofdirectorsduringsuchsession,continued tostrengthen theconstructionofprofessionalabilityanddecision transmissionmechanismof theboardofdirectors, therebyenhancing thestrategymanagementandcontrolabilityaswellasstrategy implementationability.TheCompanywasconsecutivelygranted the“Award of the Board of Directors”byShanghaiStockExchange in2011and2012.Basedon thedevelopment trendofbanking industryandactualconditionsof theCompany, theCompanysuccessfully implemented theprofessional reformsoncorporatefinanceandfinancialmarket, furtherdeepened thereformof retailfinanceandsupporting reforms including the reformon riskmanagementsystem,enabling theBankatall levels toexperiencesignificantchangesintheorganizationsystemandpromotionmodeoftheoperationalmanagementandfurtherimprovetheprofessionaloperationability,internalgrowth impetusandrefinedmanagement level.TheCompanyadapted to thereformrequirementsbyestablishingHongKongBranch,which isoneessentialsteptointernationaldevelopment.Meanwhile,theCompanyadvancedstocknetworktransformationandcommunitybankconstructionafterbasicallycompletingthedeploymentofnationwidenetwork,accelerated integrated innovationof traditionalphysicalchannelsandInternetchannels,therebyfurtherenhancingitsspecializedservicescapability.
Lookingaheadintothe“13thFive-Year”,thedevelopmentenvironmentathomeandabroadwillremaincomplicated,theworldeconomyrecoverywillbeatortuousprocessinprofoundadjustment,thedomesticeconomywilldeepenreformtorealizeashift fromolddevelopmentmomentumintothenewoneand the industry transformationandupgrading.TheCompanywillproactivelyservenationalstrategies, insiston theoveralldirectionofmarketization, integrationand internationalization,adapt to thenewnormaleconomy, integrate itself intonewfinancialpattern, furtheremphasizesoundness, innovation,coordination, refinementandreformsofsystemsandmechanisms,consolidateandexpand thepositionandadvantagesoftraditionalbusinesses,andcultivateandexpandemergingstrategicbusinessboundaryandspace,aimingtofurtherenhancetheoverallstrengthoftheGroup,andcreategreatervalueforrelevantstakeholdersincludingcustomers,employeesandshareholders.
Chairman:
Chairman’s Statement
3
2 0 1 5 ANNUAL REPORT
Chairman:Gao Jianping
4
In2015,domesticmacroeconomycontinuedtoslide,financialmarketfluctuatedintensively,commercialbanksfacedgreatchallengesinitsoperationandmanagement.Facingthecomplexandseverebusinessenvironment,andcenteringonoperationtargetsdeterminedbytheboardofdirectorsatthebeginningoftheyear,theCompanyflexiblyadjusteditsoperatingstrategy,profoundlypromotedreformandtransformation,vigorouslyconsolidatedthedevelopment foundation,successfullywithstoodvarious internalandexternal tests,achievingoperating resultswhicharegenerallybetter thanexpectedandsuccessfullyconcluding this roundofFive-yearPlan.Asat theendof the reportingperiod, the totalassetsof theCompanyreachedRMB5,298.880billion,up20.25%fromthebeginningof the reportingperiod.Netprofitattributable toshareholdersof theparentcompany for theyearreachedRMB50.207billion,representingayear-on-yearincreaseof6.51%.Stickingtobroadensourcesofincomeandreduceexpenditurewhilestrengtheningcostcontrolandmanagement, theCompanymaintainedacost-to-incomeratioat21.59%,remainingata relatively lower levelwithintheindustry.Influencedbythedownturnofmacroeconomyandriskdisclosureofcertainindustriesandareas,theassetsqualitydecreasedslightly,withtheratioofNPLsattheendofthereportingperiodstandingat1.46%,representinganincreaseof0.36percentagepointascomparedwiththebeginningofthereportingperiod.However,theoverallassetsqualityremainedreasonableandcontrollable.TheCompanyincreasedprovision,withprovisionimpairmentlossesofassetsmadeduringthereportingperiodofRMB45.260billion,representingayear-on-yearincreaseof74.72%,whileprovisioncoveragewasadequateoverall,withprovisioncoverageratioat210.08%,andprovision-to-loanratioat3.07%.
In2015,theCompanyprofoundlypromotedgroupoperationsandfurtherstrengthenedmulti-marketoperationandcomprehensiveservicecapability.IndustrialEconomicResearchandConsultingCo.,Ltd.openedsmoothly,CIBDigitalFinancialServiceCo.,Ltd.officiallyestablished,and thesubsidiaries furtherdiversified.TheCompanyhasbecomeoneof thedomesticbankgroupswithmostabundantfinancial license resources.Eachsubsidiarymaintainedarapidbusinessdevelopment,andtheindustrialpositionandprofitcontributiontotheGroupcontinuedtoincrease.Supportingmechanismssuchasexaminationandassessment further improved,and intra-groupcooperationand linkagebecamesmoother.Trans-department,trans-line,trans-institution,andtrans-businesssegmentcooperationandlinkagehavebeenmoreintimateandefficient,andcooperationandlinkagebetweenparent-subsidiarycorporationsandamongsubsidiariescontinued toexpand.Theconstructionofcorebusinessclusterof theGroupmadesignificantachievement,and thebusiness formatof“sizeable investment,sizeableassetmanagementandsizeablewealthmanagement” further shaped.
In2015, theCompanysteadilypromotedvariousreforms,and furtherconsolidated the foundation fordevelopment.TheCompanycomprehensivelydeployedanddeepenedthereformofriskmanagementsystemsandmechanisms,andorderlypromotedthereformofthecreditcardoperationandmanagementsystemsandmechanisms,comprehensivelyoptimized the labororganizationmodeofbusinesshalls,and further improved thereformof the franchisedmechanismof the inter-bankbusiness, therebyobviouslyenhancing theeffectivenessofmanagement.TheCompanysparednoeffortstopreventandcontrolnon-performingassets,soastoachieveoverallstableassetqualityatalllevelsoftheBank.TheCompanycontinuouslyenhanced innovations in riskmanagementmodeandoperation,andvigorouslysupported innovationbusinessdevelopment.TheCompanysolidlycarried out the “two enhancements, two containment” and “lookingback”special inspections,andprofoundlycarriedoutcheckingofemployeebehaviorrisk,therebyfurtherimprovingtheeffectivenessofcomplianceinternalcontrolmanagement.TheCompanycontinuedtoincreaseinvestmentin informationtechnologyconstruction,exploredtheleadingrolesofapplyingscienceandtechnologiesinthebusinessdevelopment,andconstantlyimprovedtheelectronic,informationandintelligentlevelsofthebusinessoperation.
Chairman of the Board of Supervisors :JiangYunming
7
2 0 1 5 ANNUAL REPORT
TheCompany’s board of directors, board of supervisors, directors, supervisors and senior management membersherebywarrant that the informationcontained in this report is free fromfalserepresentation,misleadingstatementormaterialomission,andassumejointandseveralliabilities.
TheCompany’sannual report2015and itsabstractwerereviewedandapprovedat the18thmeetingof the8thsessionof theboardofdirectorsonApril27,2016.Therewerenodirectors,supervisorsorseniormanagementmemberswhocouldnotwarrantordisagreedwith the truthfulness,accuracyandcompletenessofthecontentsofthisannualreport.
The financialdataand indicatorscontained in thisannual reportwereprepared incompliancewiththePRCGenerallyAcceptedAccountingPrinciples.Unlessotherwisespecified, they represented theconsolidateddata.ThemonetarysumsexpressedinRMBinthisannualreport.
DeloitteToucheTohmatsuCertifiedPublicAccountantsLLPhasaudited theCompany’s financialstatements2015 inaccordancewith theChineseAuditingStandards (“CAS”) and has issued a standard auditor’sreportwithunqualifiedopinions.
TheCompany’schairmanGaoJianping,presidentTaoYipingandgeneralmanagerof the financialdepartmentLi Jianherebywarrant that the financial statements in theannual report2015are true,accurateandcomplete.
Theplanofdividendsdistributionforordinaryshareforthereportingperiodconsideredbytheboardofdirectors:basedon the totalcapitalof19,052,336,751shares,cashdividendofRMB6.10(inclusiveoftax)shouldbedistributedforevery10ordinaryshares.
Theplanofdividendsdistribution forpreferredshares isas follows:proposeddividends forpreferredsharesareRMB1.147billion in total.Ofwhich, the total nominal valueof thepreferredsharesof“IndustrialBankP1”isRMB13billion,theinterestperiodwasfromJanuary1toDecember31,2015,proposeddividendsareRMB780millionwithanannualdividendyieldof6%;thetotalnominalvalueofthe preferred shares of “IndustrialBankP2”isRMB13billion,theinterestperiodwasfromJune24toDecember31,2015,proposeddividendsareRMB367millionwithanannualdividendyieldof5.40%.
Investorsareadvised to read the fullcontentof thisannual reportcarefully.Perspectiveand forward-lookingstatements regarding futurefinancialconditions,operatingperformance,businessdevelopmentandbusinessplancontainedinthisreportdonotconstituteanysubstantivecommitmentoftheCompanytoinvestors.Investorsshouldpayattentiontoinvestmentrisks.
Theboardofdirectorsspecially reminds investors that therisk factors theCompany issubject tohavebeen listed indetail in this report.Please refer to“ManagementDiscussionandAnalysis” for risk factortheCompanyissubjecttoandtheriskmanagementanalysis.
Note:1.BasicEPSandweightedaverageROEwerecalculatedbasedon“PreparationRulesforInformationDisclosurebyCompaniesOfferingSecurities to thePublicNo.9-CalculationandDisclosureofReturnonNetAssetsandEarningsPerShare” (2010Revision).
business areas and opens its own “blueocean”,withdistinctoperationcharacteristics.TheCompanyhasbuilttheentireIndustrialBankbrandbybusinessinnovationandestablishedawell-recognizedproductandservicebrandsystem.Abathofproductsandservicebrandsincluding“NaturalLife”, “EnjoyableLife”, “UniversalLife”, “IB Business Express”, “IBFortuneStar”, “IndustrialBankSesameBlooming”, “GreenFinance”, “theEquatorPrinciples”, “Bank-to-BankPlatform”, “E-banking”, “Hotline IB”, “QianDaMoneyManager” and “Direct Banking”arewidely recognized in thedomesticfinancialmarket.TheCompany followed themarketdevelopmenttrend, made great efforts in creating “onebodyand twowings” specializedservicesystem, centralized theresourceadvantagesof thegroupand focusingonurbanizationfinancialbusiness,environmentfinancebusiness,pension financebusiness,comprehensiveservicesbusiness forsmallandmediumbanking institutionsandnon-bankfinancial institutions,directfinancingbusiness incapitalmarket, investmentandcustodybusinessofassetsmanagementandtransactionbankingbusiness, itcreatedafinancialproductsystemwithclearpositioning,distinctcharacteristics,outstandingadvantagesandcomplete functions, formingadvantageousbrandandproductclusterwiththecharacteristicsofthegroup.
Promotingbusiness transformationbycomprehensiveoperation.TheCompanyhasbeenpersisting in themulti-market,multi-productandcomprehensivedevelopmentpathandactivelycreating itscapabilityoffinancialservicesformulti-market. Ithas formeda relativelycompletebusinesssystemcovering interbankbusiness,capital trading,assetsmanagementandassetscustody,andhas taken the lead inplanning itsbusiness in themonetarymarket,capitalmarket,bondmarket, inter-bankmarket,non-bank financial institutionmarket,preciousmetals, foreignexchangeandderivativeproducts trading.Through thecomprehensive layoutof recentyears, theCompanyhasbeen transformed fromasinglebank to“amoderncomprehensivefinancialservicegroupwithbankingbusinessas thecore,coveringbusinessareas including trust, leasing, funds, futures,assetmanagement, internet financeandresearchandconsultation”.TheHongKongbranchwasofficiallyopened in2014,markingakeystepfor theinternationalizationstrategiesof theCompany.Relyingon linkagebetween investmentand loan, linkagebetweenbusinessinandoutsidethestatements,linkagebetweenparentcompanyandsubsidiaries,theCompanyhasmetthediversifiedfinancialservicedemandofcustomers,andthebusinesscoordinationandlinkagedevelopmentcapabilitybetweenbranchesandsubsidiariesbothathomeandabroadhasbeenconstantlyimproved.
Promotingcontinuous improvementofoperationsupportingcapabilitybyscienceand technology.“Building theBank throughScienceandTechnology” is listedasoneof thekeystrategies for thebankingoperation.TheCompanyvaluedtracingandgraspedthedevelopmenttrendofmodernfinancialtechnology.Itincreasedinvestmentinscienceandtechnology topromote innovation infinancial technologiesandconstantly improvethe technologicalcontentoffinancialservice.TheCompanyisamongthefirstbatchofbanksbuildingmodernmanagementsystemsinaccordancewiththeprocessbankconcept,anditscentralizedbackofficeoperationsystemholdsaleadingpositionin the industry.Thecoreproductionsystemconstructionof theCompany isamongthebest in the industry,makingitoneofthefewbanksinthecountrythathaveindependentcoresystemresearchanddevelopmentcapabilityandproprietaryintellectualpropertyrights,aswellastheonlydomesticbankexportingcoresystemtechnology.Itisthefirst tobuildan integrateddisaster recoverysystem integrating themasterdatacenter,same-citydisaster recoveryanddifferent-citydisasterrecovery,andoneofthefirstbanksinthecountrythatcomplywiththeinternationaldisasterrecoverystandard(level-5)andtherequirementsofthedisasterrecoverystipulationsofPBOC.TheCompany’skeyindicators,suchaskey informationsystemavailabilityandgoldcardsystem transactionsuccess rate,havebeenamongthebestintheindustryovertheyears.
Creatingsoftcompetitivepowerbythepragmaticanddedicatedcorporateculture.Tofulfilltheenterprisemissionof“SincereWin-WinService”,adhering to thecorevalueof“Ration, Innovation,PeopleFirstandSharing” and theoperationpolicyof“operatinginaccordancewithlaw,steadyoperationandcivilizedoperation”,theCompanyimplements thestrategyofstrictbankingoperation,bankingoperationbyexperts,developingbankbyscienceandtechnologyandbankingestablishmentbyservice,upholds thecorporatespiritsof“Pragmatism,ProfessionalDedication, Entrepreneurship and Teamwork”, graduallybuildsasimpleandharmonious“homeculture”, a prudent and sound “riskculture”,ahard-working“diligenceculture”andasincerewin-win“serviceculture”, thereby formingstrongsoftcompetitivepowerand improving internalmanagement level inallaspects,effectivelyimprovingcorecompetitivenessandpromotingthehealthydevelopmentofallundertakings.
During the reportingperiod, facing the complicatedand fiercebusinessenvironment, theCompany rationallycoordinated thegoals in relation to“scale,qualityandefficiency”, flexiblyadjusted thebusinessstrategy,andpromotedbusinessstructureadjustmentand transformationandupgrading, therebymeetingexpectationsof itsoveralloperations.
(2)Profitabilitycapabilitymaintainedrelativelygoodstatus.Duringthereportingperiod,therealizedoperatingincomewasRMB154.348billion,up23.58%year-on-year,ofwhichfeeandcommissionincomereachedRMB33.592billion,up18.23%year-on-year.NetprofitattributabletotheshareholdersoftheparentcompanyforthewholeyearreachedRMB50.207billion,representingayear-on-yearincreaseof6.51%.Duringthereportingperiod,weightedaveragenetassets returns ratiowere18.89%, representingayear-on-yeardecreaseof2.32percentagepoints, total returnonassetsreached1.04%,representingayear-on-yeardecreaseof0.14percentagepoint.
(3)Thequalityofassetswascontrollableoverall.Asattheendofthereportingperiod,thebalanceofnon-performingloansof theCompanywasRMB25.983billion,upRMB8.439billion; the ratioofnon-performing loansstandingat1.46%, representingan increaseof0.36percentagepoint fromthefigureat thebeginningof the reportingperiod.Duringthereportingperiod,theprovision-to-loanratiowas3.07%attheendofthereportingperiod,andtheprovisioncoverageratiowas210.08%.
(4)Marketstatusandbrand imagewerecontinuouslyenhanced.TheCompanycontinued tobeamong the top50worldbanks,global500companies,and top150 listedworldenterpriseswith rankingssteadilyclimbing.Over thepastyear, theCompanywonhonors including the“AnnualFinancialHoldingGroupAward2015”, “The Most InfluentialNationalBank”, “AsianBankOfferingtheGreatestReturn toShareholders”, “The Best Green Bank Award”inaseriesofappraisalactivitiesofauthoritiesbothathomeandabroad.
(1)TheCompanydivided its regionalbranches into tensegmentsby importanceandcomparability,namely,headoffice(includingtheheadquartersanditsaffiliatedoperatingunits),Fujian,Beijing,Shanghai,Guangdong,Zhejiang,Jiangsu,Northeastandother regions inNorthernChina,WesternChinaandCentralChina.Operating incomeandoperatingprofitofvariousregionsaresetoutasfollows:
24
Unit:RMBmillion
Region Operating income Change over previousyear(%) Operatingprofit Change over
previousyear(%)
Headoffice 55,861 95.92 31,871 87.04
Fujian 16,229 1.30 1,988 (72.92)
Beijing 7,465 (2.82) 2,781 (45.52)
Shanghai 8,226 5.66 5,658 24.98
Guangdong 9,184 (4.18) (540) (117.87)
Zhejiang 5,811 9.72 1,259 418.11
Jiangsu 6,930 18.81 3,258 14.96
Northeast and other regions 15,017 3.20 5,672 (20.03)
Note: (1) Included the financialassetsat fairvalue throughprofitor loss,available-for-sale financialassets, receivableaccountinvestments,held-to-maturityinvestmentsandlong-termequityinvestments.
Asat theendof the reportingperiod, theproportionofcorporate loanswas67.30%,down6.74percentagepointsfromthefigureatthebeginningoftheperiod.Theproportionofpersonalloansincreasedby4.54percentagepointsto28.77%,and theproportionofdiscountedbills increasedby2.20percentagepoints to3.93%,comparedwiththatatthebeginningoftheperiod.TheCompanyproactivelydealtwiththenewnormaleconomyandnewfinancialpattern,adheredtothemainprinciplesofstabilizingdevelopment,ensuringsafety,andpromotingtransformation” in itswork,rationallycoordinatedthegoalsinrelationto“scale,qualityandefficiency”,flexiblyadjustedthebusinessstrategy, furtherdeepened reformand transformation,vigorouslydevelopedandconsolidated the foundation fordevelopment,rationallydeterminedthedirectionandtempoforcreditgrant,soastomaintainasteadyandbalanceddevelopmentofvariousbusinesses.
Following theprincipleof“riskcontrollable, resourceconservationandsustainabledevelopment”, theCompanypromoted the reasonablearrangementandbalanceddevelopmentofcredit resources in the industry,customers,products,etc.,continuouslyexecuted the“protected,controlledandstressful”difference loanpolicy,speededup thedevelopmentofsmallandmedium-sized,microandretailbusinessesunder thepremiseofmeetingaccessconditionsandeffectivelycontrolling risks, fullyuncoveredbusinessopportunities in free tradezones, industrialparks,reformtestareasandotherareaswithspecialsupportpoliciesgrantedbythecountry, increasedsupportforenvironmentalprotection,medicalcare,education, tourism,communicationsandotherweakperiodicandgreenfinance,andpeople’slivelihoodconsumptionindustries,effectivelycompressedandwithdrewbackwardproductivityprojects,andcontinuouslyadjustedandoptimizedthecreditassetstructure.
NPLratios for themanufacturing,wholesaleand retail industriesslightly increased from thoseat thebeginningoftheperiod,mainlyattributabletotheimpactsoftheslowdowninmacroeconomicgrowth,theadjustmentofindustrialstructureand thedecrease inmarketdemand.Certainenterprisessuffered fromoperationdifficultyanddecreaseof repaymentability, certain industrieswithexcesscapacityandbulkcommodity tradesuffered from increasedrisks,whilenegative factorsofprivate lendingandguaranteed financing repaymentdidnot show fundamentalimprovements,resultinginincreasedcreditrisks.
Northeast and other regions 237,929 13.37 197,426 12.38
WesternChina 277,343 15.59 235,395 14.78
CentralChina 295,794 16.62 256,751 16.12
total 1,779,408 100 1,593,148 100
TheCompany’s loan distribution by geographical region remained stable.TheCompany encouragedeachbranch combining thenational regional development strategybyexecuting the regional differential policy of“helpandcontrol”,gave fullplay to the regionalcomparativeadvantage, formulatedcreditpolicywith regionalcharacteristics, adjustedandoptimized regional credit structureunder theunifiedcredit policyofheadoffice,according tocomprehensive factors including thecharactersof region, industryecology, industrialstructureandcreditenvironment.
Asat theendof the reportingperiod, the loanbalanceof theCompany’s largestsingleborrowerwasRMB7,600million,accountingfor2.11%oftheCompany’snetcapitalbeforeconsolidation,whichconformedtotherequirementby the regulatorydepartments that theproportionof loanbalanceofasingleborrowercouldnotexceed10%ofabank’snetcapital.
TheCompany further adjustedandoptimized its structureof personal loansand steppedup support for thedevelopmentof personalmortgage loanbusiness. Influencedby the slowdown in thegrowthof thedomesticeconomy,theNPLratioofpersonal loansslightlywentupasat theendof thereportingperiod,but theoverall riskremainedcontrollable.
During the reportingperiod, theCompanyseized themarketopportunities.Firstly, theCompanystressedon theincreaseofholdinggovernmentbondsand localgovernmentbondswith taxdeductionandexemption, riskcapitalsavingandhighliquidity.Secondly,theCompanyincreasedtheinvestmentsthathadrelativelyhigherabsoluteyieldsandcontrollablerisks.
Asat theendof the reportingperiod, theCompany recordedabalanceofRMB48,016million in financialassetssoldunderrepurchaseagreements,representingadecreaseofRMB50,555millionor51.29%fromthefigureatthebeginningof theperiod,mainlydue to thecompanyadjusted liabilitiesallocationand reducedselling repurchaseassets.
Unit:RMBmillion
TypeDecember31,2015 December31,2014
Balance Percentage(%) Balance Percentage(%)
Bonds 39,980 83.26 78,188 79.32
Bills 8,036 16.74 19,864 20.15
Others - - 519 0.53
total 48,016 100 98,571 100
37
2 0 1 5 ANNUAL REPORT
(III)AnalysisoftheincomestatementDuring the reportingperiod, theCompanydeliveredsteadyandhealthygrowth invariousbusinesses,withsteadygrowth in interest-bearingassets.TheCompany flexiblyallocatedassetsbycapturingmarketopportunitiesandincreasedtheyieldsofinterest-bearingassets,withstablenetincreasemargin.Therewasasustainedgrowthinfeeandcommissionincome.Thecost-to-incomeratiowasmaintainedatarelativelylowlevel.ThenetprofitattributabletoshareholdersoftheparentcompanyreachedRMB50,207million,up6.51%year-on-year.
Unit:RMBmillion
Item 2015 2014 Increase/DecreaseYoY(%)
Operating income 154,348 124,898 23.58
Net interest income 119,834 95,560 25.40
Netnon-interestincome 34,514 29,338 17.64
Business tax and surcharges (12,955) (9,105) 42.28
Operating and administrative expense (32,849) (29,451) 11.54
Duringthereportingperiod,thenetinterestincomeoftheCompanywasRMB119,834million,upRMB24,274millionor25.40%year-on-year,mainlybecause interest-bearingassetsgrowth.Ononehand, the interestmarginof theCompanydecreasedslightly,thenetinterestmargindownby0.03percentagepointto2.45%.Ontheotherhand,thebusinessmaintainedasteadyandrapidgrowth,dailyaveragescaleof interest-bearingassetsup26.71%year-on-year.
TheinterestincomeincreasedRMB36,558millionor16.66%year-on-year.TheinvestmentinterestincomeincreasedbyRMB58,205millionor116.84%year-on-year,mainlydue to the investmentdailyaveragescaleup135.90%year-on-yearandholding resale interest incomedecreasedbyRMB28,953millionor51.39%year-on-year,mainlybecausedailyaveragescaleunderrepurchaseagreementsdown43.43%year-on-year.
During the reportingperiod, thenetnon-interest incomeof theCompanywasRMB34,514million,accounting for22.36%oftheoperatingincome,representinganincreaseofRMB5,176millionor17.64%year-on-year.Thespecificcompositionissetoutasfollows:
Unit:RMBmillion
Item 2015 2014
Net fee and commission income 32,190 27,041
Gainandlossfrominvestment 3,482 (96)
Gainandlossfromchangesinfairvalue 1,378 1,631
Gainandlossfromexchange (2,850) 692
Income from other businesses 314 70
total 34,514 29,338
Duringthereportingperiod,theCompanyrealizedfeeandcommissionincomeofRMB32,190million,upRMB5,149millionor19.04%year-on-year. Items likegainand loss from investment,gainand loss fromchanges in fairvalueandgainandlossfromexchangewerehighlyinterrelated.Afterthereclassificationbasedontheirbusinessnature,thegainrecognizedreachedRMB2,010million,downRMB217millionyear-on-year.
During the reportingperiod, theCompanyaccrueda loan impairment lossofRMB37,093million,upRMB17,442millionyear-on-year,mainlybecauseoftheincreaseinscaleofloans.TheCompanymadeprovisionforimpairmentbasedonthepredictedpresentvalueofdiscountedfuturecashflowsdeterminedaspertheoriginaleffectiveinterestratesoftheloans,pursuanttotherelevantrequirementsoftheAccountingStandardsforBusinessEnterpriseswithindustryriskstakenintoaccount.
Adheringtothefive-yearplanningstrategicobjective,theCompanyfurtherstrengthenedthemanagementconceptofconstraintsoncapital,andearnestly implementedvariouscapitalmanagementpoliciesaccordingtotheregulationsof theCapitalRules forCommercialBanks (Provisional)ofCBRC.Started from themanagementstrategy, riskconditionsand regulatory requirements, according to changes in externalmacroeconomicenvironment, andcombined with the “IndustrialBankMedium-termCapitalManagementPlanning (2014-2016)”, theCompanyformulatedcapitalmanagementplanof2015.Onthebasisofbalancingassetsgrowth,capitaldemandandcapitalsupplychannels,theCompanyfullyprovedthenecessityandfeasibilityofcapitalsupplement,ascertainedthecapitaladequacyratiomanagementgoal,soastorealizeahealthy,sustainableandsteadydevelopment.
Ininternalmanagement,theCompanyreinforceditscapitalallocationfunctionbyfocusingonthereturnontargetriskassetsandarrangementsonthescaleofrisk-weightedassetsineachbusinessdepartmentandbusinesssegment,soastooptimizecapitalallocationandstrivetomaximizethereturnonrisk-weightedassets.TheCompanyfurtherunleashedtheadvantageofgroup-orientedandintegratedmanagement,strengthenedthemanagementofcapitalofsubsidiaries,andgraduallyestablishedtheinvestmentallocationpolicyandprocesswhichareinfavoroffund-raisingandallocation,operationmanagement,performanceappraisal,andinvestmentallocation,soastomeetthedemandofcollectivizationand the integratedmanagement forcapitalmanagement.According to relatedguidelinesof theCapitalRulesforCommercialBanks(Provisional)ofCBRCandprovisionsofotherdocuments,theGroupmonitorsitscapitaladequacyandcapitalapplicationinrealtime.
2.Implementationofthenewcapitalaccord
TheCompanyalwaysattachesgreat importance to the implementationof thenewcapitalaccord,andproactivelypromotes theworkunder thenewcapitalaccordbystageandwithemphasisaccording to relevant regulatoryrequirementsofCBRC.TheCompanyconstructedbasicallycompleteworkingsystemof thefirstpillarof thenewcapitalaccord,makinggreatachievementsinconstructionofthenewcapitalaccord.
In respectof systembuildingandworkguarantee, theCompanybasically setupasystem framework for theimplementationof thenewcapitalaccord,coveringcapitaladequacy ratiomanagement, internal ratingprocessand frameworkconstruction,model validation, internal ratingapplicationmanagement, stress testing,anddatamanagementandsoon,carriedoutcompletebank-wide trainingandbanking industry research formany timeseveryyear,andpromoted theapplicationof thenewcapitalaccordsystem idea in thewholebank. In respectofprojectconstruction,non-retailinternalrating,retailinternalrating,creditriskweightedasset(RWA),themarketriskmanagementsystem,theoperationalriskmanagementsystemandthemodellaboratorywereapplied.In2015,theCompanycarriedout theSelf-assessmentonComplianceofAdvancedCapitalMeasurementMethods for theFirstPillar, theAuditProjectofAdvancedCapitalMeasurementMethods, theCreditRisk InternalRatingSystemProjectand theVerificationProjectofMarketRisk InternalModelSystem for the first time. In respectofmeasurementinstrumentapplication, theCompanygraduallyexpandedthebreadthanddepthofapplicationof the internal ratingsystem,whichwasmainlyusedforauthorizationmanagement,industrylimitmanagement,customerlimit,provisionassessment,comprehensiveappraisalandcapitalallocationmanagementandsoon.
TheapplicationofnewcapitalaccordprojectoftheCompanypaidmoreattentiontothefurtherapplicationofprojectresults inbusinessmanagementand riskmanagementbasedon theactualneeds toperfect riskmanagement,effectively improved the standardization and refined levels of riskmanagement, andmeanwhile sped upimplementationofthenewcapitalaccordoftheCompanyrelyingonthefirstpillarcompliance.
Thecalculation range for theconsolidatedcapitaladequacy ratioof theCompany included the IndustrialBankCo.,Ltd.andfinancial institutionscomplyingwith requirementson thecalculationrangeof theconsolidatedcapitaladequacy ratio inSection I,Chapter IIof theCapitalRules forCommercialBanks (Provisional)ofCBRC.Tobespecific, thisapplied to thebankinggroup jointlycomprisedof IndustrialBankCo.,Ltd., IndustrialBankFinancialLeasingCo., Ltd,China Industrial InternationalTrust Limited,CIBFundManagementCo., Ltd. and IndustrialConsumerFinanceCo.,Ltd.
Secondly, layingmoreemphasison innovation.TheCompanywill further increase the innovation intensityofbusinessproductsandbusinessmodes,paymoreattention to the innovationanddevelopmentof theOff-BalanceSheetActivities (OBS),anddevelopnewchannelsofbusinessesandprofit growth.TheCompanywill furtheraccelerateinnovationofthoughts,methods,meansandtoolsforriskmanagement,andeffectivelygraspthematerialrisks,soastopromotetheimplementationofnewbusinesses.
Thirdly,layingmoreemphasisonlinkage.TheCompanywillunswervinglydeepengroup-orientedandcomprehensiveoperations,andcontinuouslyenlargecooperationand linkageamong lines,agencies,andsegments, soas toimprovetheefficiencyandability forobtainingcustomers,andfurtherexplore thecustomers’value.TheCompanywillcontinue to integratebusiness resources includingcommercialbanks, investmentbanks,capitalmanagementandwealthmanagement,improvetheservicechain,andincreasecomprehensiveincome.
Fourthly, layingmoreemphasison refinement.Adhering to theperspectiveof theentireGroup, theCompanywillmakeoverallplanningandpromote theconstructionof refinedmanagement tools including the internal transferpricing,managementaccounting, resourcesandprofit distribution,evaluationmanagement, soas toprovideapowerfulbasicmeanssupport for internalbusiness linkageof theGroup.TheCompanywill enrichdigitalandintelligentbuildingof thebusinessoperationandmanagement,andplay theroleofboostingandevendrivingandleadingofscienceand technology tobusinessdevelopment.TheCompanywillprofoundlypromote theapplicationofmobile internet,bigdata, cloudcomputing,artificial intelligenceandotheradvanced technologies, transformbusinessesandpromoteinnovationwithscienceandtechnology,andcontinuouslyimprovethedigitalandintelligentlevelsofbusinessoperations.
IndustrialLeasingcontinued topromote innovations infinancingbusiness,andsuccessfully issued two tranchesoffinancialbondsofRMB5billion in total.Thecompanycontinued topromotecross-borderfinancingbusiness,andcompletedtwocross-borderRMBloanbusinesses in theQianHaiShenzhen-HongKongCrossBorderCooperationZone.Thecompanyobtainedthequalificationsforcarryingoutleasingassetsecuritizationbusiness,furtherenrichedthefinancingtools,andimprovedassetmanagementcapabilities.
51
2 0 1 5 ANNUAL REPORT
(2)ChinaIndustrialInternationalTrustLimited
China Industrial InternationalTrustLimited isaholdingsubsidiaryof theCompanywith registeredcapitalofRMB5billionandtheCompanyholds73%ofthecapital.Thebusinesscoversfundtrust,movablepropertytrust,immovableproperty trust,negotiablesecurities trust,otherpropertyorproperty right trustandotherbusinessesstipulatedbylawsandregulationsorapprovedbytheChinabankingregulatoryagencies.IndustrialTrust’s own assets, gains and losseswereincludedintheCompany’sconsolidatedfinancialstatements,butitstrustassets,gainsandlosseswerenotincluded.
During the reportingperiod, closelyadopting the strategic target of cultivating itself intoa“comprehensive, diversified,andfeaturedtopnationaltrustcompany”andstickingtothedevelopmentdirectionof“stabilizingscale,adjustingstructure,preventing risks,enhancingefficiencyandemphasizing innovation”, IndustrialTrustactivelypushedforwardbusinesstransformationandstructuraladjustment,comprehensivelystrengthenedriskmanagementand internalcontrol,continuously improvedcomprehensiveoperationalstrategies, realized rapiddevelopmentofallbusinesses,made itsmajoroperation targets rank thefirst tireofnational trust industryandmaintainedsoundassetsquality.Asat theendof thereportingperiod, IndustrialTrust’sownassetsamounted toRMB16.035billion,up29.49%fromthebeginningoftheperiod,owners’equitywasRMB12.426billion,up11.97%fromthebeginningoftheperiod,andtheassetundermanagementincreased49.02%toRMB1,046.027billion,whichwasthefirsttimetoexceedone trillion.During the reportingperiod, the realized revenuewasRMB2.944billion,ofwhich the trustbusiness incomewasRMB1.632billion, fixedbusiness incomeandotherbusinesses income totaledRMB1.312billion, therealized totalprofitwasRMB2.122billion, thenetprofitwasRMB1.611billion,up14.62%year-on-year.ROEwas13.74%,andcost-to-incomeratiowas22.75%.Asattheendofthereportingperiod,thebusinesssizeofsubsistingtrustofIndustrialTrustwasRMB908.482billion,up40.92%fromthefigureatthebeginningoftheperiod.
IndustrialTrust continuouslypromoted thebusiness transformationandstructuraladjustment, soas to furtherimprove theproactivemanagementandbusiness innovationcapabilities.Asat theendof the reportingperiod,collection trust business scale of IndustrialTrust reachedRMB229,663million, representing an increaseofRMB81,347millioncomparedtothefigureatthebeginningoftheperiod;propertyrighttrustbusinessscalereachedRMB107,072million, representingan increaseofRMB78,970million.The trustbusinessstructurecontinued tobe improved. Internationalbusinessmadebreakthroughs,assetsecuritizationbusinesswas rapidlypromoted, thefirstactivemanagement industrial fundwasestablished,and thefirstaccumulation fundandpersonal loanassetsecuritizationproductwas issued. IndustrialTrustsmoothlyobtained thequalification for foreignexchange trustbusiness,registeredbytheprivateequityfundmanagersoftheAssetManagementAssociationofChina,andsteadilypromotedbusinessesincludingfamilytrust,pensiontrust,publictrust,consumertrust,mixedownershipreformandsoon.
IndustrialTruststrictlyimplementednationalmacropoliciesandfinancialregulatoryrequirements,adheredtosoundcompliancemanagement idea, andst rengthened comprehensive r isk management and internal control, soas tomaintaingoodassetqualityandmakeall themain indexesconform toregulatory requirements.Asat theendof the reportingperiod, IndustrialTrusthadnosurvivalornewnon-performingassets, all trust planswith liquidationweretimelypaid inasafemanner,andsurvival trust property operationwasinnormal condition. It also increasedinvestment in foreignfinancialequities,and made new b reak th roughs in
52
comprehensiveoperation.
Comprehensivemanagement layouthasbeen involved inassetmanagement, futuresservices,securitiesservices,financial researches,enterprisegroup financialmanagement,andother fields.Comprehensive financial servicecapabilityhasbeenfurtherimproved.IndustrialTrustwhollyownsCIBGuoxinAssetManagementCo.,Ltd.It isthecontrollingshareholderofCIBFuturesCo.,Ltd. It invests IndustrialEconomicResearchandConsultingCo.,Ltd.,ZijinMiningGroupFinanceCo.,Ltd.,HuafuSecuritiesCo.,Ltd.,andChongqingMachineryandElectronicsHoldingGroupFinanceCo.,Ltd., realizedprofitsduring the reportingperiodofeachequity investmentproject,andgainedgoodequityinvestmentincome.
(3)CIBFundManagementCo.,Ltd.
The registered capital of CIB FundManagementCo., Ltd. wasRMB500millionand theCompanyheld90%of its total capital.Asof yet,CIBFundManagementhas set up tenbranches inChina,includingShanghai,BeijingandShenzhenandwhollyownedthefundsubsidiarycompany-CIBWealthManagementCo.,Ltd.During thereportingperiod,CIBWealthManagementCo.,Ltd. investedequityandestablishedChina IndustryDigitalFinancialService (Shanghai)Co.,Ltd.andheld51%ofitstotalcapital.TheregisteredaddresswasatChina (Shanghai)PilotFreeTradeZoneand the registrationwithIndustrialandCommercialAuthoritywascompetedinNovember2015.
CIBFund has followed the business philosophy of“Within theLaw, Innovation,PlateLinkageandBrandBuilding”, persisted in developingpublic offeringandnon-public offering simultaneouslyandactivelyadopted thebusinessstrategyofmaintainingabalancebetweenmanagerial businessand investment consultation. It hasadhered to the mission of “Establishing characteristics throughbuilding thebrandwithpublicofferingproducts, improving thescalewith constant returns with active management”, realizing rapidand steady development in all businesses.As at the end of thereportingperiod,CIBFundhad totalassetsofRMB1.783billion,up46.65% from thebeginningof theperiod.Owners’ equity reachedRMB1.039billion,up63.58%fromthebeginningoftheperiod.Duringthe reportingperiod, the realizedoperating income totaledRMB728millionandthenetprofittotaledRMB244million,increasedby103.34%year-on-year.Asattheendofthereportingperiod,thetotalassetsmanagementsizereachedRMB412.653billion,increasedby111.86%fromthebeginningoftheperiod,ofwhichpublicofferingof fundaccounted forRMB73.481billion,specialaccountof the fundcompanywasRMB36.865billion, thespecialaccountof thesubsidiary fundcompanyaccounted forRMB302.308billion. InNovember2015,CIBFundwasofficiallyapproved tobe theQualifiedDomestic Institutional Investors (QDII)byCSRC.
IndustrialConsumerFinanceconstantlypromoted innovationofsystemsandmechanisms,established three linesofdepartments inaccordancewith theprincipleofdelayeringand intensification,andclarified theoperationalmechanism of “reporting line+delegation”;setupbusinessdepartment fornetworkbusiness,specialbusiness,E-businessandsecurities trader in the incubatormodetopromote thedevelopmentofonlinebusiness;proactivelyoptimizedtheITsupportingplatformbasedonmobileinternettechnology,independentlyresearchedanddevelopedPADmobilemarketingsystem,and realizedpaperlessoperations from loanmaterial submission toexaminationandapproval; successfully launchedonlineexhibition channels includingempty-handaccess to thewebsite,WeChatclient-sideandmobileAPP,and launchedFamousCompanyTrainandPOSflow loanandother Internetproductsofmanyscenarios;successfully researchedanddevelopedself-service loanmachineswith independentintellectualpropertyrights,plannedtobearrangedin2016inlargequantities.Madeeffortstoimproveandintegratethe traditional riskcontroland the riskmanagementmechanismbasedon thenewriskcontrolby the lawof largenumbers,establishedandimprovedtheriskcontrolmechanismsincludingthethree-personloanreviewmechanism,the five-persongroupsecuritymechanism, the risk fundmechanism, themultidimensionalcollectionsystemandaccountabilitysystem,paidattention tocombining the thirdpartycredit informationandbigdatamanagementwayto identify thecustomer risk,andcontinued to improve the risk identificationcapabilityandpost-loanmanagementcapability.
IndustrialEconomicResearchandConsultingCo.,Ltd.was founded inJune2015and is the firstprofessionalresearchinstitutionoperatedincorporateforminthedomesticbankingindustry.IndustrialResearchhaspreliminarilyestablished researchsystemsofsuch fourfieldsasmacro (incl. interest rates,exchangeratesandcommodities),industryandcredit,financialengineeringandproducts,anddatamining.Sinceitsestablishment,IndustrialResearchreleasedover560regularreports(daily,weekly,andmonthly),fastassessment,andspecialreportsandsoon;heldlectures, forums,business training,specialconference, research,and thecustomerpromotionconferenceandsoon,over90intotal;theservicescopecoveredheadofficedepartments,branchesandsubsidiariesintheGroupandagenciesofthesametradeandregulators,etc.outsidetheGroup.
IndustrialResearch’sresearchresultscloselyfollowedthetrendofdomesticandforeignfinancialmarkets,accuratelyforecasted the inflectionpointof interest rates in thecurrencymarket inmiddle2015,andaccuratelypredicted thetrendofRMBexchangerates; industrialspecial researcheswerehighlyeffective,credit researches tightlygraspedthechanges incredit risk,andbonddefaultexceeded70%. IndustrialResearchdevelopedandstarted financialengineeringquantitativeproductsandstrategies,and implemented investmentadvisoryservices.Each researchresultwasfit formarketdevelopment, followed theGroup’s business needs, made important contributions to the operation of the Group’sbusinesses,enablingitsresearchservicestopromotebusinessgrowth.
Adheringtotheoperationalstrategyof“stabilizingdevelopment,ensuringsecurityandpromotingtransformation”, theCompany responded to thechangesofsituation,activelyandproperlyhandled risksand realizedsteadyandhealthydevelopmentof thecorporate financebusiness throughstrengtheningstructuraladjustment,speedinguptransformationandupgradingandenhancingbasismanagement.
Firstly, theasset-liability structuremaintainedbalanceddevelopmentandcustomer foundationcontinued tobestrengthened.Asat theendof the reportingperiod, thebalanceofcorporatefinancedeposits in localand foreigncurrenciesamountedtoRMB2,109.799billion,upRMB212.508billionfromthebeginningoftheperiod,dailybalance
54
ofcorporatefinancedeposits in localandforeigncurrencieswasRMB2,090.1billion,upRMB359.6billionfromthebeginningoftheperiod,andthebalanceofcorporatefinanceloansinlocalandforeigncurrencieswasRMB1,267.502billion,upRMB60.304billion from thebeginningof theperiod,and the total corporate financecustomerswere469,520,ofwhich137,751werebasiccustomers.Secondly, theCompanyadapted to the typeofoperations toaccelerateinnovation,withoutstandingfeaturesandobviousadvantages.Complyingwiththenationaldevelopmentstrategy,basedonthecustomerservicerequirementchangesandthevigorousdevelopmentoftheInternetfinance,theCompanystrivedtopromoteinnovationandupgradingofproducts,servicesandprocess,andmadeinnovationsandbreakthroughsinthecapitalmarket,greenfinance,Internetfinanceandotherfields.UnderwritingscaleofdebtfinancingtoolsrankedNo.1forfourconsecutiveyearsamongjoint-stockbanks;totalscaleofreleaseofcreditassetsecuritizationproductsrankedNo.1amongjoint-stockbanks,andcreatedsuchinnovativecasesasthefirstshort-termsecuritizationproductinthemarket,thefirstdomesticCLOproductinvestedbyQFIIandthesuccessfulmarketof thefirstassetsecuritizationproduct in the inter-bankbondmarket;financingbalanceofenvironmentalfinancialbusiness increased40%,breaking throughRMB300,000million;dealsumof the“three Internet through trains” of receiptandpayment, financing,and treasury reachedRMB150,000million.Thirdly, theCompanyhighlightedcomprehensiveoperationadvantagesby linkagewithin theGroup. Incooperationwith IndustrialTrust, IndustrialLeasing,IndustrialFundandothersubsidiaries,theCompanyobtainedmaterialoperationalresultsinindustryfunds,assetsecuritization,bondunderwritingandinvestmentlinkage,operationandleaseintegration,moneymanagement,futures,proprietary investment,warehousewarranthedgingfinancing in theoperationalperiodandotheraspects,promoted formationof thecooperationmodeofdivisionof laborandorderly linkagewithin thegroup,andmet therequirementsfordiversifiedfinancialservicesofenterpriseswhilemaximizingtheinterestsoftheGroup.
(2) Investment banking business
Investmentbankingwasbasedon themain lineofnationaleconomicdevelopment,grasped thedevelopmentopportunitiesofdirectfinancingtoproactivelypromotetheenterprisemergingandreorganization,privateplacement,mixedownership reform,enterpriseassetsecuritization, localgovernmentbondunderwriting,andPPPandotherinnovationbusinesseswhileacceleratingthedevelopmentofnon-financialcorporatedebtfinancingtools,corporatebonds,directfinancing tools formoneymanagementandotherbusinesses.Firstly, theCompanyaccelerated thedevelopmentofcapitalfinancingbusiness.Itgraspedthetrendofthecoordinateddevelopmentofthedebtinvestmentandcapital investmentbyapplicationofcombinationsofanumberof investmentbankingproducts,andfocusedonsolving the“pain points” and “difficultpoints”of improving thedebtstructureandreducing thefinancingcostbycustomers,soas toattractnumerous largehigh-qualitycustomers.Secondly, theCompanyspedup innovationandupgradingofinvestmentbankingservices,andlaunchedaseriesofinnovativeproductsofinvestmentbanksinthecreditassetsecuritizationbusiness,corporateassetsecuritizationbusinessand innovativebondbusinessandotheraspects,obtaininggoodmarketresponse.Itprovidedperpetualcapitalsecuritiesandotherfinancialproductsfor the high rating corporate customers to meet customers’ requirementsforoptimizingthestructureofassetsandliabilitiesand transforming to the light-assetoperation.Thirdly, theCompanybuiltacompleted investmentbankingsystem,andcontinuouslyexpandedthesaleschannelsofinvestmentbanks.Asofyet,theCompanyhasestablishedfavourablebusinesscooperation relationswithmostdomesticbanks,and reachedcooperation intentionswithanumberofnon-bankingfinancial institutionsrankinginfront inthemarket,realizingfullcoverageofmaininter-bankmarketinstitutionalinvestors.
During the reportingperiod, theCompanyservedas theunderwriter fordebt financing instrumentsamounting toRMB384.245billion,accumulativelyunderwrotefourissuesofcredit-and-assetbackedsecurities,whoseunderwritingamounttotalingRMB23.2billion,andwonthetenderoflocalgovernmentbondstotalingRMB192.3billion.
(3)Tradefinancingbusiness
Tradefinancialbusinessfollowedthenationaldevelopmentstrategiesincluding“OneBeltOneRoad”and free trade zoneconstruction.Firstly, theCompany reconstructed theproductsystemwith thevisionof“big tradefinance” to form four categoriesof businesses includingcorporatemulti-level financing, supply chain financing, cross-borderfinanceandcapitalhedgingappreciation,enriched the functionsofcustomerservices,and formedunique
Cashmanagementbusinesswasfit for the trendof interest rateliberalizationand Internet finance,enrichedcashmanagementproduct line,andbuiltnew Internet financestate tostrengthenthe ability of precisemarketing and differentiated services,thereby realizing thegreat increaseofcustomers,andenlargingof customers’ fundmanagementscale ina leap type.Asat theend of the reporting period, cash management customers reached 17,597,representinganincreaseof5,616comparedtothefigureatthebeginningofthereportingperiod.AveragedailyoutstandingofdepositsofthecashmanagementcustomersreachedRMB835billion, accounting for 40.3% in the average daily depositsof corporate finance, and total assets of average daily cashmanagementreachedRMB603.1billion.
Firstly, theCompanystrived tobuild thepyramid-typeproductsystemsurrounding thecash flowprocessof thecorporateandcash management customers, based on the idea of combining services and technologies, and promote the“three Internet through trains”ofreceiptandpayment,financing,andtreasury.Itcontinuouslydevelopedandupgradedtargetedproductsfromtheperspectiveof featuredsettlementbusiness tomeetcustomers’ practicalneeds,captured thepotentialneedsof thecustomers,and promoted product construction from customers’ needs.Secondly, theCompanyprepared correspondingstandardizedcashmanagementserviceschemebasedon thescaleofall kindsofcustomers, launchedserviceschemesofmedicine,educationandenergy industries,andpersonalize theschemescombinedwith theneedsofcustomers.Smartmedicalproductshavecovered49regionsin27branches,andservicedmorethan300hospitals.Thirdly,theCompanybuiltacompletebusinesschaincenteringoncapitalcollection,allocation,settlement,storageandapplicationofcorporatecustomers,andexplored toprovidecashmanagementservicesofdifferentcategoriesandlevelsfordifferentcustomers,applyingcashmanagementservicesineachprofessionalfield.
(5)Environmentfinancebusiness
Regarding the construction of “Green China”as itsownresponsibility,environmentalfinancialbusinesscoverednumerousprojects including improvingenergyefficiency,newenergyand renewableenergydevelopmentandutilization,carbonemission reduction,wastewater treatmentandwaterareamanagement,sulfurdioxideemissionreduction,andsolidwasterecycling,becomingthemostdistinctivebusinessareaunderdifferentiatedoperations.As
56
attheendofthereportingperiod,theCompanyaccumulatively providedRMB804.6billion offinancing to no less than 6,000 enterprisesand thebalanceof financing ingreen financereachedRMB394.2billion.
Firstly, theCompany listed theenvironmentalfinancial business as the core business andoneof theannual businesseswithemphasison development, and established the groupl inkage and coord inat ion mechanism forenvironmental finance to transfer the“green bank” to the “green f inancia l group” .Secondly, environmental protection benefitswere more obvious.As at the end of thereportingperiod,annualsavedstandardcoalofprojectssupportedbytheenvironmentfinancialbusiness reachedabout25,538.6 thousand tonnes,annualcarbondioxideemission reductions reached71,619.9thousandtonnes,annualemissionreductionsofchemicaloxygendemand(COD)reached1,387.4thousandtonnes,annualcomprehensivelyusedsolidwaste reached17,290.4 thousand tonnes,andannualwater-savingamountreached285,650.6 thousand tonnes.Thirdly, theCompanycontinued topromoteenvironment finance innovationandexploration.Withrespecttothecarbonfinance,itestablishedrelationshipwithsevendomesticcarbonemissiontradingpilotprovincesandcities,signedacooperationagreementwithsixof them,andbecamethemainclearingandservicebank inmost regions.With respect toemission rightfinance, itsignedacooperationagreementwith10of the11domesticemission right tradingpilotprovincesandcities,andconductedbusinesscooperationsuchasemission rightmortgage loans, trading fundstorageandsettlement,and financialchargingaccountopening.Fourthly,theCompanycontinuouslypromotedmarketinfluenceandpublicrecognition.Itwonthefifth“AnnualBestGreenFinanceAward”appraisedbytheChinaBankingAssociation,receivedtheinvitationtoparticipatein“EnergyEfficiencyCreditGuideTrainingSeminar” of the CBRC, “EnergyEfficiencyFinancing InnovationMechanismResearch Topic” of theWorldBank,andproject researchongreen financial reformandgreen transformationpromotionoftheChinaCouncilforInternationalCo-operationonEnvironmentandDevelopment.
(6)Smallenterprisebusiness
Businesses of small enterprises kept providing better service to the general public of traditional business,continuouslypromoted theconstructionof“sixspecialmechanisms”ofsmallandmicrobusinesses focusingonexclusiveorganizationsystem,exclusive risk technology,exclusivebusinessprocess,exclusiveproductseries,exclusive incentiveandconstraint,andexclusive resourceallocationbasedon theprofessionaloperations,andcontinuously improvedtheprofessionalandrefinedmanagement levelsofsmallandmicrofinancialservices.Asattheendofthereportingperiod,thenumberofcustomizedsmallandmicroenterpriseoftheCompanytotaled372.2thousand,andthebalanceofloansforsmallandmicrobusinessesamountedtoRMB104.212billion.
TheCompanystrivedtostrengthentheconstructionofsmallandmicroenterprises’exclusiveproductsandfeaturecluster,createdfinancialservicesanddifferentiatedcompetitiveadvantagescoveringthewholelifecycleofsmallandmicroenterprises,withmoredistinctbusinesscharacteristics.Firstly,basedonregionalcharacteristics,theCompanyachievedprominentclusterconstructioneffects.Asattheendofthereportingperiod,729smallbusinessindustrialclustersof theCompanywereconstructed,up45.51%fromthebeginningof thereportingperiod,and thebalanceof loansof theclustersreachedRMB35.3billion,up79.37%fromthebeginningof thereportingperiod.Secondly,“TheThreeLoanServices”brandandscaleeffectforsmallandmicroenterprisesgivenpriorityto“Easy&FastLoan”,followedby“TransactionLoan” and cooperated with “ConsecutiveLoan”wasfurtherhighlighted.Asattheendofthereportingperiod,loansamountedtoRMB24.88billion,providingfinancingservicesforapproximately
57
2 0 1 5 ANNUAL REPORT
7,000small andmicroenterprisecustomers.Thirdly, smallandmicro Internetfinanceof“Internet+Bank+Platform” madebreakthrough in development.As at the end of thereportingperiod, online financing customers reached208,and thebalanceof loans reachedRMB474million.Fourthly,the “EntrepreneurialFinance” servicesystem integrating“debt financing, equity financing, settlement andmoneymanagement,andadvisoryserviceswasofficially launchedin the market, and “EntrepreneurialLoan”,“Three-BoardSeries Products” and “VCreation” small andmicroenterprises’specialactionplanswereinnovativelylaunched.
(7)Institutionalbusiness
In termsof institutionalbusiness,adhering to taking root infinance,social insurance,publicutilities,healthcare,cultureandeducationandother fields, theCompany implemented“big infrastructure, health, and culture”developmentstrategy, and strengthened industry service ability.As atthe end of the reporting period, theCompany obtained423central, provincial,municipal, anddistrict-levelagencyqualifications, increasing by 83 from thebeginning of thereportingperiod.Technologicalcapabilitiesprovidedastrongsupport for institutionalcustomers,“Thecentralgovernmentnon-tax revenuecollectionsystemof theMinistryofFinance”waspassedby theentireacceptancegroupof theMinistryofFinance;after thecross-provincial trafficviolationfinepaymentsystemof theMinistryofPublicSecuritywas launched, itwasacceptedandapprovedby the threeministriesof theMinistryofPublicSecurity, theMinistryofFinanceand theCentralBank.With respect to theconstructionof theprovincial treasuryconcentratedpaymentelectronicbusinesssystem,itwasdevelopedandintegratedinFujian,HebeiandLiaoning,anditwasconnectedtonearly400budgetunitsinFujian.
Asat theendof the reportingperiod, thenumberof institutionalcustomers reached21,627,up1,481 from thebeginningof theperiod; thebalanceofcustomerdepositswasRMB552.989billion,upRMB37.063billion fromthebeginningoftheperiod,andthedailybalanceofinstitutionaldepositswasRMB529.465billion,upRMB63.504billionyear-on-year.
2.Retailfinancebusinesssegment
(1)Overview
Under thecircumstanceofeconomicdownturn,especiallywhenChinawaspromoting“de-capacity,de-stocking,de-leveraging”andthepressureofbankassetsqualityconstantly increased,theCompanyimplementedthe“one bodyand twowings”specializedservicesystemand thedevelopmentconceptofsizeable investment,sizeableassetmanagement,andsizeablewealthmanagementdevelopment layout toseekprogressamidstability,activelyplanned transformationdevelopment in itsoperationaldirection,marketingpromotion,businesscapability,productinnovationandcoordination,continuedtostrengthenthereformoftheworkmodeofbusinesshallsandcreditcardsystemmechanism,speededup the transformationof traditionalbranchnetwork,enhanced thebrandbuildingof“FourLife”, thereby realizing the improvementofspecializedbusinesscapability.Asat theendof the reportingperiod,therewere36.505millionretailbankingcustomers(includingcreditcardcustomers),increased4.977millioncustomersfromthebeginningoftheperiod.ThebalanceofcomprehensivefinancialassetsofretailcustomerswasRMB1,209.4billion,upRMB198.9billion fromthebeginningof theperiod.Duringthereportingperiod, therealized
58
reta i l in termediary business income wasRMB14.111 billion, up 21.14%year-on-year.Thenet incomeof retailbankingbusinesswasRMB27.733billion,up15.32%year-on-year.
With respect to management, f i rs t ly, theCompanyadhered to focusingon“customer, comprehensivefinancialassetandrevenue”as i ts primary business direction to optimizebusiness resources allocationmanagement,strengthenbusiness inputandoutputaswellas riskmanagement.Secondly, theCompanystrengthened the transformation of branch networkandchannel integrationcoordination,to speedup the constructionof a communitybank for it togohand inhandwith traditionalbranch network reconstruct ion, so as to promotethesmaller,smarter,andmorecommunity-orienteddevelopmentmodel.Thirdly,theCompanyimplementedthedevelopmentstrategyofbusinessbrands,promoted thebrandcultivationandconstructionof“FourLife”, continuing todevelop the“EnjoyableLife”servicebrand in thepensionfinancefield,promoted themarketingof“DynamicLife”CIBDynamiccreditcardandbracelets;centeredoncustomers,“WealthyLife”cultivated thetrust of customers toward “WealthyLifeBrand”;TheCompany launched theoverseas financialservicebrand“UniversalLife”withbusinessessuchasvisacourierserviceandoverseasstudy loansasentry to fosterandaccumulatequalityretailcustomers.Fourthly,theCompanylaunchedthereformofoperatinghalllabororganizationmodel,vigorouslyreinforcedthereformandimplementationofcreditcardsystemmechanism,promotedtheplanof“onepositionwithvariouscapabilities”ofoperatinghallstaff,perfectedandcarriedoutseparationmodelofhigh-lowcounter,soas toenhancecapability increaseandpersonnel transformation.Fifthly, theCompanycontinued toenhance the implementationofbasicwork,promoted theconstructionof retailcustomersseparationmanagementsystem, perfected themechanismof developing customer system, continuously optimizedVIP value-addedservicesolutions,strengthened thebuildingofservicestandardizationsystem,activelypromoted thestandardizedmanagementofbranchnetworkstaff,improvedthestaffefficiencyofretaillinesacrosstheBank,strengthenedcostcontroloverall,activelyorganized thepromotedconstructionof technologyplatform relating tomobilepayment,promotedbranchnetwork transformationandcapability lifting,andstrengthened the internaldevelopmentabilityofretailbusinesses.
(2)Retailbankingbusiness
With respect to retail liabilities, theCompanykeptupwith the trendof interest rate liberalization,andcontinuouslystrengthened themanagementof interest rates,guidedandencouragedbranches toenhanceexpansion intensityofcurrentdepositsandshort-termfixeddepositsthroughinterestrateauthorizationmanagement,windowguidance,etc.,achievinggoodresultswith thebalanceof individualdeposits reachingRMB374,124millionat theendof thereportingperiod.TheCompanygraduallydividedtheoriginalstructuraldeposits,andproactivelyreducedthecostofdebt;innovatedthelargeamountdepositcertificates,withthebalanceoflargeamountindividualdepositcertificatesatoverRMB8billionattheendofthereportingperiod,whichmadeupfortheshortcomingsoftheshort-termfixeddepositproductstructure.
With respect to the retail credit business, theCompanyproactively responded to the call of thegovernment,increasedsupportforloanstoowner-occupiedproperties,andpromotedthedevelopmentofhousingmortgageloanbusiness.Meanwhile, inorder toadapt to thechangesof themarketconditions, theCompanyconstantly improvedandupgraded the retail credit product system,enrichedand innovated retail credit products, accelerated thepromotion of the “flourishing”characteristicindustrialloans,strengthenedthelinkagemarketingofretailproducts,
Withrespecttotheretailwealthbusiness,theCompanycontinuedtopromotethetransformationoftheretailwealthbusiness,andvigorouslydeveloped theagencybusiness, thus forming themulti-categoryandmulti-channel retailwealthproductsupplyandsalessystem;carriedout the retailwealthbusinessmainlycenteringon theproductstructurechange:firstly, thewealthmanagementbusinessemphasiswas transferred toagencybusiness,and theagencyproduct salesgrew17%compared to thepreviousyear; secondly, financingproductswere transferredto theopennetvalueproducts, theclosed-endproductsales fell30% from thepreviousyear,and theopen-endproductsalesgrew113%.Thecontributionoftheagencybusinessintermediarybusinessincomeintheretailwealthintermediatebusiness incomebroke through20% for the first time,and the incomestructure tended tobemorereasonable.Agencybusinessofpreciousmetals,insurance,etc.madebreakthroughindevelopment,andsalesscalejumpedtothefrontamongsimilarjoint-stockcommercialbanks.Withrespecttotheretailwealthbusiness,thesalesvolume(excludingprivatebanking)offinancialproducts in localand foreigncurrencieswasRMB3,654.390billion,increasedbyRMB1,418.705billionyear-on-year,ofwhichthevolumeofopen-endproductsstoodatRMB3,110.976billion and volumeof closed-end productswasRMB543.414 billion.Sales volumeof agency productswasRMB146.247billion,upRMB21.203billionyear-on-year,ofwhichsalesvolumeoffundproducts(includingsecuritiescompanies), insuranceproductsand trustproductswereRMB122.926billion,RMB12.883billionandRMB10.438billion respectively.Accumulative transactionvolumeof tradingbusinesswasRMB142.789billion,ofwhich thetransactionvolumeofpreciousmetalsamounted toRMB136.190billionandaccumulated transactionvolumeofforeigncurrencywasRMB6,599million.
With respect to the retailchannels,communitybanksweresteadilydeveloped,and theoutlet transformationwasfully implemented.Asoneof thebankswhichstarted tobuildcommunitybanksearlier, theCompanyproactivelypromoted the “intelligentandstandardized”projectsofcommunitybranches facedwith the impactof interestrateliberalizationandInternetfinance,adheredtobecustomer-orientedtotakethecharacteristicanddifferentiatedoperationalpath,established theoveralldevelopmentstrategyof“promotingdevelopmentwith thesystem,andbuildingbrandwithservices”,andpromoted thehealthyandstabledevelopmentofcommunitybanks from theperspectivesofperfectingmanagementmechanism,settingupthemarketingplatform,optimizingproductallocation,and innovatingservicepatternandsoon.Asat theendof the reportingperiod, the licensedcommunitybranchesamountedto772,smallandmicrobranchesamountedtofive,andmorethantwothirdscommunitybranchesmadeprofits.
TheCompany fully implementedoutlet transformation,andgraduallyachieved the transformationof traditionaloutlets from the“transactionprocessing type” to the “efficiency-oriented servicemarketing type” in the “intelligent,small,community-based,andstandardized” direction and centered on the three nodes of “burden reduction,highreductionand lowreduction”with theaim toenhanceoperation,serviceandmarketingefficiency,
The credit card business focusedon the frontier of industry development, grasped the opportunity of rapiddevelopmentof internet financeandmobilepayment,endeavored topush forwardbusiness transformationandupgrading,continuouslyprovidedsafe,convenientandpersonalizedconsumptionandfinanceservicetocreditcardcustomers.Asat theendof the reportingperiod, theCompany issuedcreditcardsamounting to15.4952million,ofwhich2.1831millionwerenewly issuedcardsduring theperiod.During the reportingperiod, theaccumulatedtransactionamountofcredit cardbusiness totaledRMB451.975billion, representingayear-on-year increaseof22.73%.
Grasping thedevelopment trendof the“movement” and “health” industries, theCompanycomprehensivelypromoted the construction of the core brand of “DynamicLife”credit card to form differentiated competitive capabilities.TheCompanyissued“CIBDynamic”creditcard, integratingthephilosophyof“vitality,healthyandgreen” into theproductdesign,combinedfinancialpaymentproductswith thehealthy life ideaby the innovativemethodofexchangingcreditcardpointwithcalorieburningbyexercise.Thesynchronouslylaunchedmobilepaymentsportsbraceletoptionalaccessorieswere thefirstdomesticwearablemobilepaymentequipmentandwereon thedomesticleadingposition.Centeringonthesportsandhealthidea,theCompanysteadilypromotedtheexpansionofpreferencemerchantsandconstructionofmobilepaymentacceptanceenvironment,creatinggoodenvironment forthecardholdertousethecard.
(4) Private banking business
Centering on “consultation-driven”work in termsof theprivatebankingbusiness, theCompanyvigorouslypromotedbusinessinnovationandriskmanagementandcontrol,continuouslyenhancedcapabilitiesofresearchandanalysisandprofessionalinvestmentconsultingservices,improvedthehigh-endservicesystem,setuptheoverseasplatform,andeffectivelyenhancedmarketinfluenceandscalemerit.Asattheendofthereportingperiod,theprivatebankingcustomerstotaled18,381,up24%fromthebeginningoftheperiod,andtheconsolidatedfinanceassetsofprivatebankingcustomersamountedtoRMB263.9billion,up20%fromthebeginningoftheperiod.Theaccumulatedfinancialproducts issuedby theCompanyover thewholeyear totaledRMB167billion, representinga13%year-on-year increase.During the reportingperiod, theCompanyheld fourquarterlystrategicconferencesonfinancialmarketanalysisandallocationofgeneralcategories,andinvitedleadingexpertsandcustomerstosharetheirlatest
TheCompanyhasconstructedsoundprofessionalbusinessmanagement systemandunified financialmarketserviceplatformat theheadquarters level.Under theheadquartersmarketdepartment,sixfirst-classdepartmentsweresetup, including the inter-bankbusinessdepartment, fundoperationcenter,assetmanagementdepartment,assetcustodydepartment,bankcooperationcenterandfinancialmarketriskmanagementdepartment,allofwhichwerewith clearpositionsandduties,mutual cooperation,alongwith furtherenhancementof theconstructionofaprofessional talent team,soas toprovidecustomerswithmoreprofessional, comprehensiveandefficientcomprehensivefinancialproductsandservices.
Activelypushing forward thedevelopment strategyof“sizeable investment, sizeableassetmanagementandsizeablewealthmanagement” , theCompany took full advantageof its specialized talent teamwith financialmarketandcomparativelyfull licensestofurtherstrengthenitssharpmarketandinnovationawareness,strengthenthe linkagesof thebusinessesamong lineswithin theGroup,actively respond to thechangesandchallengesfrommarketization, facilitate the steadydevelopmentof various financialmarketbusinessesandenhance itsmarket influence.The fundoperationcenteraccuratelypredicted the trendofmarket interest rate,adoptedflexibletransactionstrategyof foreignexchangeandderivativeproducts,achieved remarkableself-operatingeconomicresults,andcontinuedtomaintainthemarketpositionofthemostactivemarketmaker.Promotingthetransformationand innovationof financialproducts, theCompany’sscaleof financialproductscontinuouslyexpended,makingthedailyaveragestockbalanceof financialproductsamount toRMB1,347.641billion,up60.27%year-on-year,accumulatedfinancing fund totalledRMB11,690.862billion, representingayear-on-year increaseof88.46%.Whiletheindustrycompetitionwasincreasinglyfierce,thescaleofassetcustodybusinessrealizedsubstantialgrowth,withtheclosingbalanceofRMB7,213.948billion,up52.64%fromthebeginningoftheperiod,therebyenablingthescaleofcustodybusiness to rise toNo.2 in themarket.Characteristic inter-bankbusinesses including theBank-to-BankPlatform, technological inputcontinued todevelop, functionalsystemof“QianDaMoneyManager”continuouslyimproved,andfinancialcloudserviceplatformbegantoconstruct.
(2)Inter-bankbusiness
During the reportingperiod, the totalnumberofonlinesecuritiesfirmsnetworked for thirdpartydepositoryservicewas98,with the industrycoverageratioof99%and the totalnumberofonlinesecuritiesfirms formargin trading,securitieslendinganddepositoryserviceswas52.Theend-usercustomersofthird-partydepositoryreached3,644.2thousand.TheCompany innovatively launched the transferserviceofstock, futuresandderivativebankproducts,with22security companieswith transfer serviceof stock, futuresandderivativebankproducts inoperation. Itcollaboratedwith67trustcompanieswithmarketcoverageratioof98.5%.Theaccumulatednumberofdirectonlinebankingwealthmanagementcustomerswithfinancecompanieswas121,with the industrycoverageratioof56%.TheCompanyestablishedagentrelationshipswith1,509institutions,coveringover100countriesandregions.Duringthereportingperiod, theCompanybecameanaffiliatememberof the InsuranceAssetManagementAssociationofChina;obtainedthequalificationforoptionfundsettlementbanksfromtheChinaSecuritiesDepositoryandClearingCo.,Ltd.;obtainedcomprehensivelyqualifiedbusinessauthorityoftheparticipantsoftheinter-agencyprivatemarketand theofferbusinesssystem,qualification for fundsettlementsystemof theoffersystem,andqualification forplatformfundsettlementbusinessoftheChinaSecuritiesJintong;becameamemberforcomprehensiveclearingofnetbondsoftheShanghaiClearingHouse.
62
(3)Bank-to-bankcooperation
As the Company’s f i rs t brand in China’s bank- to-bankcooperation, theBank-to-BankPlatform isan integratedservicesystemof the Internet finance and offline finance, providingvariouscollaborativebankswithcomprehensivefinancialservicesolutionscoveringwealthmanagement,paymentandsettlement,technological output, training services, financing services,optimizationofcapital,asset-liabilitystructure,etc.Asat theendof the reportingperiod, thenumberof collaborated customersofBank-to-BankPlatformwas653, ofwhich254werewealthmanagementgatewaycooperationcustomers,withsoldproductstotalingRMB2,163.370 billion, up 51.24% year-on-year.Theaccumulatedtotalnumberofnetworkedoutletsforcounteragencysettlementexceeded36.2 thousand.During theperiod,a totalof41,630.8 thousandaccumulatedsettlement transactionswerecompletedon theBank-to-BankPlatform, representingayear-on-year increaseof 56.77%.TheaccumulatedsettlementwasRMB2,904.144billion,up42.22%year-on-year.TheBank-to-BankPlatform’s single-year settlement transactionsand settlementamount both hit a record high.TheCompany accumulativelycooperatedwith270commercialbanks in termsofestablishmentof information systems, amongwhich 146banksmanaged tooperatewithonline informationsystems.TheCompanyhasbecomeoneof the largestprovidersof informationsystemsforcommercialbanksinChina.
Wealthmanagementbusinessrefers to theCompany’s investmentandassetmanagement in thewayagreedwiththe customer in advance upon the customer’sentrustmentandauthorization,and thecustomer’s undertaking correspondingrisksandenjoyingcorrespondingearningsasagreed,coveringsuchproductsaswealthmanagementproducts forretail,wealthmanagementproducts forcorporatecustomers, inter-bankwealthmanagementproducts,andetc.Thewealthmanagementbusiness involvesmultiple links like investmentmanagement,productR&D,issuanceandsalesandbackgroundoperation,withspecificworkflowsmainly includingproductcreation,productapproval,marketabilityapprovalandschedulearrangement,supervisionreportandinformationregistration,productsales,productinvestmentmanagementanddurationmanagement,andetc.
Wealthmanagementbusinesscontinuedtomaintainarapidgrowth,withthescaleandincomehittingtherecordhighandgrowingspeedexceedingthatoflastyear.Asattheendofthereportingperiod,thebalanceoftheCompany’s wealthmanagementproductswasRMB1,438.558billion,up72.26%year-on-year,ofwhichthebalanceofopen-endproductsandclosed-endproductswasRMB668.286billionandRMB770.272billionrespectively, takingup46.46%and53.54% respectively.Thebalanceofprinciple-guaranteedproduct includedandcalculated in the formwasRMB395.045billion,takingup27.46%,balanceofremainingnon-principle-guaranteedwealthmanagementproductsissuedandmanagedbytheCompanywasRMB1,043.513billion,takingup72.54%.Duringtheperiod,averagedailybalanceofwealthmanagementproductswasRMB1,347.641billion,up60.27%year-on-year,accumulated raisedwealthmanagement fundwasRMB11,690.862billion,up88.46%year-on-year,and the intermediary incomeofwealthmanagementbusinesswasRMB9.528billion,up22.37%year-on-year.
TheCompanycarriedout itsassetcustodybusinessbyeffectively responding to thechangesofcapitalmarket,furtherreinforcedinnovation,spedupoptimizationofproductstructureandrealizedsustainabledevelopmentoftheassetcustodybusiness.Allbusiness targetssteadily rose,and themarketpositionwas furtherconsolidated.Asattheendof thereportingperiod, thenumberofonlinecustodyproductsof theCompanywas18,799,with thescaleofassetcustodybusinesstotalingRMB7,213.948billion,upRMB2,487.907billionor52.64%fromthebeginningoftheperiod.Whileduring theperiod, therealized total incomeof intermediarybusinessesofassetcustodyreachedRMB4.316billion,upRMB105millionor2.49%year-on-year.
TheCompanyproceeded tostrengthen traditional custodybusiness toensure itsdominantpositionwithin theindustry.At thesame time, in thewakeofcapitalmarkethotspots, theCompany focusedon threemajorcustodybusinesses including thebank financialproducts, securities investment fundandcustomerassetmanagementproductsof fundcompanies,and it alsocultivatednewoperationgrowthpoint.Asat theendof the reportingperiod, thecustodybusinessofbank financialproductswasRMB1,463.563billion,upRMB701.628billion fromthebeginningof theperiod, thecustodybusinessofassetmanagementproductsof fundfirmswasRMB769.099billion,upRMB388.403billion fromthebeginningof theperiod, thecustodybusinessofsecurities investment fundwasRMB288.318billion,upRMB159.025billion from thebeginningof theperiod, thecustodybusinessof trustassetmanagementproductswasRMB1,804.582billion,upRMB496.595billion from thebeginningof theperiod,
64
thecustodybusinessofassetmanagementproductsofsecuritiesfirms’customerswasRMB1,566.627billion,upRMB395.917billionfromthebeginningoftheperiod,thecustodybusinessofinsuranceassetmanagementproductswasRMB638.298billion,upRMB117.058billionfromthebeginningoftheperiodandthecustodybusinessofprivateassetmanagementproductwasRMB213.698billion, increasedbyRMB109.169billion from thebeginningof theperiod.
(7)Futuresfinancialbusiness
During the reportingperiod, theCompanywasdesignatedby the Shanghai Futures Exchange as the depositorybank for futuresmargin.Meanwhile, it served as thedepository bankdesignatedbyChinaFinancial FuturesExchange,DalianCommodityExchangeandZhengzhouCommodityExchange.TheCompanyconstantly improvedfuturesmargin custodybusinessand technical systemsmanagement mechanism to ensure the compl ianceandstableoperationof thebusiness.On thisbasis, theCompanyactivelycarriedout thecooperationwith futuresexchangeandfuturescompaniesbusinessandrealizedthestablegrowthofthebusiness.Asattheendofthereportingperiod, theCompany’s balance of deposits of futuresfirmsand futuresexchangeswasRMB56.328billion, upRMB3.984billionor7.61%fromthebeginningoftheperiod.Amongthem,thebalanceofdepositsoffuturesmarginswasRMB49.607billion,upRMB4.243billionfromthebeginningof the period.During the period, theCompany’s dailybalanceofdepositsof futures fundswasRMB55.6billion,up119.85%year-on-year.Asat theendof the reportingperiod, therewere84 Internet futuresfirmsofbank-futurestransferoftheCompany,126futuresfirmscooperatingwiththeCompany,up14firmsfromthebeginningoftheperiod.228futuresguaranteeaccountswereopenedforfuturesfirms,ofwhich125wereearmarkedfundaccounts.Duringtheperiod,therewere10,784completedtransactionswithfuturesexchangesettlement,withatotalsettlementamountofRMB1,912.499billion.Therewere232,903completedbank-futures transfer transactions,witha totalamountofRMB292.335billion.Thecompanycontinued topromotebusinesscooperationwithfuturesfirmsinvariousareasincludingpledgeandcreditofstandardwarehousereceipts,subordinateddebtcredit,assetmanagementandassetcustody.Asat theendof the reportingperiod, therewere111assetmanagementproductsoffuturesfirmsunderonlinecustodyoftheCompany,withtotalassetofRMB2.078billion.
4.E-banking
Following the trendof“marketization,disintermediation,networkingandcustomization”of finance,E-bankingbusiness focused on“opening, focusing, execution and customer experience” tospeedup thepaceofe-financeinnovation.TheCompanystrivedtoperformwellinoperation,service,innovationanddevelopmentofonlinechannelsincludingdirectbanking, Internetbanking (onlinebanking,mobilebanking,SMSbankandWeChatbank), remotebank(telephonebanking95561;VIPspecialline4008895561).Besides,theCompanyintegratedintothewholelifecycleofcustomersofvariousecologicalscenarios,formedafullyinteractedbusinessserviceclosed-loopwithofflineoutletsandcommunitybanksand fullyexcavatedandpromoted the innovationservicevalueofnetworkfinancialchannelsandimprovedtheproductivityandcompetitivenessalongwiththeformationofnewmarketbreakthrough.
65
2 0 1 5 ANNUAL REPORT
TheCompanydevelopedmobilepaymentby launchingApplePayandHCEcloudquickpassandpromoting theconstructionofmultipleNearFieldCommunicationmodessuchasUnionPaybusinessPOS,braceletsmodeand soon. It alsodevelopedO2O interactiveserviceplatform“reservations desk of service, providingmobile phonenumber reserving of bank business,andpre-filled sheet serviceofwebsite (PCandPad),mobilephone andWeChat bank.TheCompany developed remotebank,whichsupportedmultipleservice interactivemodessuchasmobilephone, fax,SMS,WeChat,E-mail,weibo,videoandonlinecustomerservice,etc.VirtualTellerMachine (VTM)wasalsodevelopment,ofwhichfrontendsweredistributedinoutletsand community bankswhile back endswere connected intocustomerservicecenter. It realized theall-around tellerservicesof “fullentrust, fullbusinessandallday”, which reduced the pressureof retail tellersandprovided technicalandoperationsupport forcommunitybanks.TheCompanyestablishedacallcenter cross sales based on IBM’sWatson systemand anoutboundmarketingservicesplatform,givingplaytoprofessionaladvantagesof customer service center andactively carryingout theoutboundmarketingofgroupproductsandcross-sellingconcerningincomingcalls.
TheCompanyenriched thedirect sellingbankproduct linebyadding “XianJinBao” exclusivechannel,Xingyebao-HuafuMonetaryFundandXingyehong-HuafuHealthFlexibleAllocationFundandpromoting the innovationof“XingYeTou” investment incomeproductmarkedbycity investmentbonds. Itdevelopedand implemented theexpansionprojectofpaymentchannel,andbroadened the inter-bank fundingchannelsand limitationofdirectsellingbanks.Grasping thedevelopment trendof social platform, it developedWeChat bank, offered transactionhandling,consulting,notificationandotherservices forvariousbusinessproducts,accessedtomobilebanking,directsellingbankandintelligentcustomerservice,andbuiltanew“self-help, intelligence,artificial”servicemode.TheremoteaccountestablishmentofWeChatbankenablednewcustomers to submitmaterials toapply fornewaccountthroughWeChatbank,wherecustomerservicepersonnelcould identify thecustomer throughWeChatvideocallandimmediatelyopenaccountforhimorher.Combinedwithbankadvantages,e-businesswaswelldevelopedwithpopularcategoriessuchaslifeservices,enjoyablelife,overseasonlineshopping,vehiclelife,processcharacteristics,drinksandgoldcoinscompletedwithfineness.
Asat theendof the reportingperiod, theCompanyhad217.7 thousandactivecorporateand inter-bankonlinebankingcustomers,up8.74% from thebeginningof theperiod;9.1161millionactivepersonalonlinebankingcustomers,up12.20%from thefigureat thebeginningof theperiod;8.3224millionactivemobilephonebankingcustomers,up57.58%fromthefigureat thebeginningof theperiod;and11.9567millionactivemessengerusers,up37.53%fromthefigureat thebeginningof theperiod.Duringthereportingperiod, thenumberofcorporateandinter-bankonlinebanking transactionswas98.7899million (transactionsofcapitalmovement,samehereinafter),up38.14%year-on-year,while the transactionamountwasRMB69,327.503billion,up40.02%year-on-year.Thenumberofpersonalonlinebankingtransactionswas525.7154million,up112.04%year-on-year,whilethetransactionamountwasRMB10,757.783billion,up44.85%year-on-year.Thenumberofmobilephonebanking transactionswas104.762million,up173.20%year-on-year,whilethetransactionamountwasRMB1,929.652billion,up157.63%year-on-year.Thereplacementratioofe-bankingtransactionsacrosstheBankwas92.71%,up7.15%year-on-year.Theworkofcountertransactionwaseffectivelylessenedandcounterchannelproductivitywasreleased.
December31,2015 December31,2014 Increase/decreaseinbalanceat the end of the reporting period
compared with that at the end of lastyear(%)
Balance Percentage(%) Balance Percentage(%)
Pass 1,711,649 96.19 1,546,660 97.08 10.67
Specialmention 41,776 2.35 28,944 1.82 44.33
Substandard 11,331 0.64 9,312 0.58 21.68
Doubtful 9,560 0.54 6,082 0.38 57.19
Loss 5,092 0.28 2,150 0.14 136.84
total 1,779,408 100 1,593,148 100 11.69
Asattheendofthereportingperiod,thebalanceoftheCompany’sNPLsstoodatRMB25.983billion,upRMB8.439billion from thefigureat thebeginningof theperiodwithNPLratioof1.46%,up0.36%from thebeginningof theperiod.ThebalanceofspecialmentionloanswasRMB41.776billion,upRMB12.832billionfromthebeginningoftheperiod.Theproportionofthespecialmentionloansinthetotalloanswas2.35%,up0.53%fromthebeginningoftheperiod.MainreasonsfortheincreaseinNPLsandspecialmentionloanswerethatononehand,China’seconomywasstillexperiencingtheoverlappingofdomesticgrowthpatterntransformationperiod,structuraladjustmentperiodandpolicysystemizationperiod,coupledwithcontinuingslowdownofeconomicgrowth,profoundadjustmentofeconomicstructure,resolvingofexcesscapacity,cultivationofnewindustry,whichwouldbealongprocess,sothatthechanceforcorporaterisksdisclosurebecamehigher.Ontheotherhand,theCompanypersistedinactivelyandtruthfullydisclosing risks,and furtherspedupsolvingand treating riskyprojects,whichalso took time.Therefore,variousfactorsledtotheincreaseoftheCompany’sNPLsandspecialmentionloans.
TheCompanycontinuouslystrengthenedthecontroloverassetqualitybyadheringtoequalstresson“controllingthe new ones” and “lowering theoldones”,effectivelyconducting“controlling thenewones” and speeding up the “lowering theoldones”.Theassetqualitycontinued tomaintain theoverallbasicstability. In respectof“controlling thenewones”, firstly, theCompanystrengthened theauthenticityauditandenhanced the“three check”tocarryoutthespecificrequirementsofauthenticity;anditsbranchessetupduediligencecentersforfurtherstrengtheningofauthenticityverificationbeforecrediting;secondly,theCompanystrengthenedthefulfillmentofduediligenceresponsibilities,continuedtoincreasetheevaluationweightsandfrequenciesoftherisksandcomplianceof internal control of branchesand, through regular assessment, timely report, supervisionand rectification,etc., comprehensivelyenhanced theeffectivenessof riskmanagementat thebasic level; thirdly, theCompanystrengthenedriskscreeningandearlywarning,accelerated theconstructionof riskearlywarningsystemand fullyimprovedtheinitiative,comprehensivenessandtimelinessofearlywarningofrisks.Inrespectof“loweringtheoldones”,firstly, theCompanystrengthened thecustomerexitmechanismandflexiblyadoptedmeasuresaimingatriskycustomerstoorderlyexit;secondly,theCompanyenhancedtherecoveryofnon-performingassetstoimprovetheefficiencyandbenefitofnon-performingassets; thirdly, theCompanycarriedoutcomprehensiveassessmentofassetqualitywithnon-performing,attention,overdueandother indexes included into theassessmentofoperatinginstitutionsatalllevelsandtheriskmanagementdepartment.
Descriptionofmethod for impairment losson loans: if loansare impaired, thecarryingamountof loans is reducedto thepresentvalueofestimated futurecash flows (excluding futurecredit losses thathavenotbeen incurred)discountedattheoriginaleffectiveinterestrate.Theamountofreductionisrecognizedasanimpairmentlossinprofitorloss.Foraloanthatisindividuallysignificant,theCompanyassessestheassetindividuallyforimpairment.Foraloan that isnot individuallysignificant, theCompanyassesses theasset individually for impairmentor includes theassetinagroupofloanswithsimilarcreditriskcharacteristicsandcollectivelyassessesthemforimpairment.IftheCompanydeterminesthatnoobjectiveevidenceofimpairmentexistsforanindividuallyassessedloan,itincludestheloaninagroupofloanswithsimilarcreditriskcharacteristicsandcollectivelyreassessesthemforimpairment.Loansforwhichanimpairmentlossisindividuallyrecognizedarenotincludedinacollectiveassessmentofimpairment.If,subsequent to therecognitionofan impairment losson loans, there isobjectiveevidenceofarecovery invalueofthe loanswhichcanberelatedobjectively toaneventoccurringafter the impairment is recognized, thepreviouslyrecognizedimpairmentlossisreversed.However,thereversalismadetotheextentthatthecarryingamountofloanatthedatetheimpairmentisreverseddoesnotexceedwhattheamortizedcostwouldhavebeenhadtheimpairmentnotbeenrecognized.
Asat theendof the reportingperiod, thebalanceof theCompany’soverdue loanswasRMB48.797billion,upRMB12.966billion fromthebeginningof theperiod,ofwhichoverduecorporate loansandoverduepersonal loansincreasedbyRMB10.604billionandRMB2.072billionrespectively,andcreditcardsoverdueincreasedbyRMB290million.Theprimarycauses for the increasewere that thepressure foreconomicdownturn further increased,andthenumberofcustomerswhorepaidoverdueduetocapitalturnoverdifficultiesincreased.Inaddition,ittooktimetosettlethestockofoverdueloans,whichalsoconstitutedanothermajorcausefortheincreaseofoverdueloans.
Asattheendofthereportingperiod,thebalanceoftheCompany’srestructuredloansstoodatRMB17.808billion,upRMB10.148billion from thebeginningof the reportingperiod.Themain reason for thegreat increaseof thebalanceof restructured loanswas that theCompany furtheroptimized the resolution for riskprojectsanddisposalstrategies.Under thepremiseof reinforced riskguaranteeandcontrolledmaterial risks, theCompanyhelpedsustainable-operatingenterpriseswith temporary turnoverdifficulty tomaintainnormaloperationandovercomealldifficulties.
Item December31,2015 Increase in thereporting period
Recoveryinthereporting period December31,2014
Interestreceivable 21,743 255,972 258,989 24,760
Asat theendof the reportingperiod, the interest receivabledecreasedbyRMB3.017billionor12.19% from thefigureat thebeginningof theperiod,mainlybecauseof the increase in interest-bearingassets. Interest receivablefrominterest-bearingassetsnotrecoveredwithin90daysaftertheduedaywouldbewrittendownfromtheinterestreceivable in thecurrentperiodandaccountedforasoff-balance-sheet item.Therefore,nobaddebtprovisionwasmade.
Facingtheremarkableandprofoundchangesofeconomyandfinanceenvironment,theCompanytooktheinitiativetograspandadapt to thenewnormalstate, firmly implemented thedecisionandarrangementof“Stabilizingdevelopment,ensuringsafetyandpromotingtransformation”,adheredtostableandhealthyoperation,paidspecialattention toassetqualityand futuresustainabledevelopment,continued to further improvecredit riskmanagementsystemand tomaintainbasicallystableassetquality.Firstly, theCompanyadjusted theauthorizationandgrantingpolicyof credit business, timelyadjustingandoptimizingauthorization, promotingdelicacymanagementandcontinuing to implement thedifferentiatedgrantingpolicyof“assuringsupply,controlandstockcompression”, activelysupportingrealeconomydevelopment,optimizingcreditresourcesallocation,carriedoutareadifferentiatedpolicyof“supportingcertainareasandcontrollingothers”andbrancheswereallowed to formulate riskpolicywithareacharacteristicsalongwith reality, enhancedpost investigationandapproval assessment, reinforcedindustry researchandbusinessanalysis, further increased the relevanceandperspectiveness.Secondly, the
Theobjectives for theCompany’s compliance riskmanagementwere: to realize effective identificationandmanagementofcompliance risks throughestablishingandperfectingcompliance riskmanagement framework,soastomakeallbusinessescomplywithrequirementsofvariousregulationsandstandards,totimelytakerectificationmeasures for irregularities, toprevent itself fromsuffering from legalsanctions, regulatorypenalties, financialorreputationlossduetoviolations,torealizethecontinueddevelopmentoftheCompanytothemaximumextent,andtorealizetheCompany’smaximumbenefits.TheCompanycontinuedtodeepencomplianceoperationphilosophy,enhancecultivationof compliancecultureand furtherpush forward theeffective implementationof compliancemanagement.
Firstly, theCompanymade full useof theevaluationmanagement tools toenhance thecultureof complianceoperations.TheCompany furtheroptimizedand improvedcomplianceoperationsand internalcontrolevaluationprogrambysettingupamulti-levelevaluationsystemcoveringthebusinesslinesofdomesticbranches,HongKongbranch,subsidiariesand theHeadOffice;continuing to facilitate themutual integrationandpromotionof internalcontrolandcomplianceoperationswithbusinessdevelopment;increasingthelevelofdelicacymanagement;steppingupevaluationand theuseofevaluation findings; strengthening theguiding ideology for lawfulandcomplianceoperations;andcultivatingagoodcomplianceoperationculture.
Secondly, theCompany established a sound internal oversightmechanism to strengthen the awareness ofcomplianceoperation.TheCompany further regulated the internalcontrol investigationprocess,strengthened thelong-actingmechanism for internalcontrol inspectionandmanagement, the internalcontrol supervisorysystemand thecompliance troubleshooting,establishedadailymanagementsystem for the inspectionofdata,compiledentriesofirregularity,andreinforcedtheapplicationofachievements.Itpushedforwardtheemployeecompliancefileandaccumulativepointsmanagement,constructed the“account page” foremployeecompliance.Thecompanyimprovedthecompliancemanagementmechanismandframeworkofbranches,improvedthelong-actingmechanismforregulatingtheextraordinarytransactionactivitiesofemployeesbymeansofcomplianceriskalert,complianceandinternalcontrolevaluation,specialtroubleshootingandstrengthenedaccountabilityofemployeesforirregularities.
Thirdly, theCompanygrasped theregulatory focusandmade innovativemanagement tools toenhance theoverallqualityandefficiencyofanti-moneylaundering.Withitsongoingcommitmenttothe“risk-based” and “corporate
78
governance”principle, theCompanyvigorouslysetupananti-money laundering“wholeprocess” management mechanismforpushingtheorganic integrationofanti-money launderingwithcompliancemanagementand internalcontrol;intervenedinsystemreviewatsourcebystrengtheningtheanti-moneylaunderingcompliancemanagementreviewofnewproductsandbusinessestoensuretheeffectivenessofthetop-leveldesignofanti-moneylaundering;madea correct judgmentof the regulatory situationof international anti-money laundering; strengthened theriskmanagementofmoney laundering forcross-borderbusinessand terrorist financing;earnestlycarriedoutaself-assessmentof the riskofmoney laundering forguiding theallocationof resources towardshigh-riskareas;independentlydesignedindicatorsformonitoringunusualtransactionstolookatthesetupofafundmonitoringmodelappropriatefortheCompany’sactualsituations;optimizedandimprovedtheanti-moneylaunderingmonitoringandmanagementsystem;andstrengthenedtrainingaswellasassessmentandsupervisionofanti-moneylaunderingforcontinuous enhancing the Group’santi-moneylaunderingmanagementstandard.
TheCompanyvigorouslyperfectedtheITriskinstitutionalframe,formedthreelinesofdefenceofITriskmanagementcomprisedof ITdepartment, lawandcompliancedepartment,auditdepartmentandother relevantdepartmentandmadefulluseofITriskmanagementinstruments,reinforcedITriskmanagementthroughadoptingvariousmeasuressimultaneously.Firstly,thecompanyopenedtheITriskmanagementsystemplatform,makingmanagementfunctionselectronic including IT risk, control, identificationandassessment, ITkey indicatorsmonitoring,collectingof ITrisk incidents, reviewingandmanagementofall kindsof IT risks.Secondly, theCompanyperfectedassessmentsystemof IT risks.At the levelofHeadOffice, thecompanyexpanded thecoveragescopeof IT riskassessmentandexpanded thescopeof IT riskassessment to IT relatingdepartment.At the levelofbranches, theCompanyimplementedrisk,control,identificationandassessmentofITriskkeyprocedureinallbranches,andcarriedouttheworkona regularbasisasanormalizedworkofbranches,andestablished IT riskassessmentsystemacross theBank.Thirdly, theCompanyattached importance tooutsourcingriskmanagement,enhanceduniformmanagementofoutsourcedprojects,carriedoutprojectriskassessmentandproviderassessmentoftheoutsourcedprojects,paidspecialattention tosituation includingself-controlcapabilityof IT technologyduringoutsourcingandoutsourcing
Theboardof directorsand its riskmanagement committeeare responsible for approvingstrategicplansandbasicpolicies for theCompany’s reputation riskmanagementaswellas the responsibilities,authority limitsandreportinglinesoftheseniormanagementrelatingtoreputationriskmanagement;overseeingtheimplementationofvarious regulationsby themanagement for reputation riskmanagement;andperiodically reviewing reputation riskmanagement reports.Theseniormanagementand theHeadOffice’sriskmanagementcommitteeare responsiblefor implementing the reputation riskmanagementstrategicplansandpoliciesapprovedby theboardofdirectors,assessing theCompany’s reputation riskmanagement situationona regularbasisaswell asmonitoringandevaluatingwhetherthereputationriskmanagementofvariousdepartmentsiseffectiveornot.TheHeadOffice’s risk managementdepartment is responsible for leading thedraftingof thebasicpolicy for reputationriskmanagement,improving thereputation riskmanagementsystem, incorporating thestatusof reputation riskmanagement into theoverallriskmanagementreportingsystemandregularlyreportingtotheseniormanagement,theHeadOffice’s risk management committee and the board’sriskmanagementcommittee.
TheCompany’sreputationriskmanagementfollowstheprincipleof“divisionof labour,hierarchicalmanagement,handlingby type, swift responseandongoingmaintenance” for continuously increasing theeffectivenessofreputation riskmanagement.During the reportingperiod,basedon the formulatedSub-strategiesofReputationRiskManagementand theReputationRiskManagementSystem, theCompany incorporated the reputation riskmanagement into theCompany’sgovernanceandcomprehensive riskmanagementsystem,clarified functionsofdifferent levelsanddivisions,adoptedhierarchicalclassificationmanagement,and thus reinforced theeffectivepreventionand control of reputation risks.TheCompany continuously perfected theoperational proceduresin termsofnewspublicopinion, informationdisclosureandcustomercomplaintmanagement, raised the levelof comprehensivemanagementof copingwithadversepublicopinionandcapacityof contingency treatment,enhancedpublicopinion troubleshootingandestablished the regulationofdaily reportingof risk information, toeffectivelyprevent, immediatelycontrolandproperlycopewithadversepublicopinionandpreventandcontrolreputation risks.TheCompany fulfilled its responsibilityofdisclosing informationof listedcompany,ensuring thetruthfulness,accuracy,completeness,timelinessandfairness,soastoobjectivelyshowthebusinesscharacteristicsandperformancedynamicsof theCompany.TheCompanyalso incorporated reputation riskmanagement into thecomprehensiveappraisalofbranches,effectivelyfacilitatingandreinforcingthereputationriskmanagementatbasicoperatingunits.
(2)Managementofcountryrisks
TheCompany’smanagementof country riskswas for thepurposeof:establishingandcontinuously improvingtheCompany’scountry riskmanagementsystembasedon its internationalizationprocessandbusinessgrowth,adoptingpropermeasurement,assessmentandratingsystemforsuchriskwithaviewtoaccuratelyidentifyingandassessingcountry risks relating tobusinessactivitiesandpromotingsustainableandhealthydevelopmentof itsbusiness.
Theboardofdirectorsand its riskmanagementcommitteeare responsible forapproving theCompany’s strategic plansandbasicpolices forcountry riskmanagement;approving the responsibilities,authority limitsand reportinglines of the seniormanagement relating to country riskmanagement; supervising the seniormanagementto implement variouspolicies for country riskmanagement.The seniormanagement and theHeadOffice’s riskmanagement committeeare responsible for implementing thestrategicplansandpolicies for country risk
Country risksexist inbusinesses includinggrantingofcredit limit, internationalcapitalmarketbusiness,settingupoverseas institutions, transactionwithcorrespondentbanksandoutsourcingserviceprovidedbyoverseasserviceprovider.Basedon thedegreeof risks,country risksareclassified intofivegrades– low, relatively low,moderate,relatively highandhigh.Appropriatemanagement is carriedout for eachgrade.Moreover, country risksareusedasmajorcriteria forweighing themanagementofgrantingcredit tocustomers.Basedon itsprogress in theinternationalizationprocessand thegrowthof itsbusinesssize, theCompanywillcontinue to improvecountry riskmanagement.
81
2 0 1 5 ANNUAL REPORT
SIgnIfICant ISSueS
I.Proposalofprofitdistributionofordinarysharesor transferofcapitalreserve(I)Formulation,implementationoradjustmentofthecashdividendpolicyTheCompanyconsideredandpassedtheamendmentstotheArticlesofAssociationatthefirstextraordinarygeneralmeeting in2012,whichstated that theprofitdistributionpolicyshould include:first, theprocedures for formulationandadjustmentoftheprofitdistributionpolicy,whichspecificallyrequiredthatsuchpolicyshouldnotbesubmittedtothegeneralshareholders’meetingunlessconsentsofmorethantwothirdsofdirectorswereobtainedandshouldnotbepassedunlessmorethantwothirdsofvoteswereobtainedfrompresentshareholderswithvotingrights;second,theprinciplesofcontinuityandstabilityofprofitdistribution,which required that theprofitdistributionplanshouldbedraftedevery threeyears; third,profitdistributionform(incashorequityorbothof them)and interval (annuallyorsemi-annually ifaffordable); fourth, theprofit fordistribution incashyearlynot less than10%of the realizedattributableprofitoftheyear,providedthattherequirementsoncapitaladequacyratioweremet;distributingdividendinequityat thesame time ifnecessary;fifth,explanations for thenon-distributionofdividendsand thepurposeofreservesnot fordividenddistribution ifcashdividendsarenotdistributed for theyear;andsixth,deductionof thecashdividendsdistributable toanyshareholder to repay the fundsheused,where theshareholderused funds inviolationofregulations.
For thepurposeofestablishingasustainable,stableandscientific investment returnmechanismfor investorsandkeepingcontinuityandstabilityof theprofitdistributionpolicy,by taking intoconsiderationof itsactualoperationand futuredevelopmentneed, theannualgeneralmeeting2013of theCompanyconsideredandapproved theProposalon theMid-termShareholders’ReturnPlan (2014-2016) (fordetails,please refer to theannouncementontheresolutionsofthegeneralmeetingdatedJuly1,2014),whichplannedthat inthecomingthreeyears(2014-2016),should therebedistributableprofit,cashdividendscouldbedistributed toshareholdersofordinaryshares,andtheprofitusedfordistribution incashwouldnotbe lessthan20%(inclusive)of therealizeddistributableprofitoftheyearaftermakingupfordeficits,appropriatingstatutoryreservesandgeneralprovisionsandpayingdividendstoshareholdersofpreferredshares,provided that itcouldbeensured that the regulatory requirementsoncapitaladequacy ratioof theCompanycouldbemet.When theCompanydistributesdividends incashor inspecieorbyacombinationofboth, theproportionofcashdividendsshouldnotbe lower than40%(inclusive)of theprofitdistributionfortheyear.
TheCompanyfulfilled theaboveprofitdistributionpolicyandcashbonusonschedule.TheCompany implementedtheannualprofitdistributionplan2014inMay2015,basedonthetotalsharecapitalof19,052,336,751shares,theCompanydistributedcashdividendofRMB5.7forevery10shares(taxincluded), issuedRMB10,859,831,948cashdividendsasawhole,whereasbalanceoftheundistributedprofitwouldbeusedforsupplementingcapitalandcarriedforwardtothenextyear.TheformulationandimplementationprocedureoftheCompany’scashdividendpolicywascompliantand transparentwithclearandexplicitdividendcriteriaandproportion,conforming tostipulations in theArticlesofAssociationandrequirementsintheresolutionofthegeneralmeeting.Theboardofdirectorsdidspecialresearchanddemonstrationon the returnsofshareholders,and fullyheardopinionsofshareholders (especiallymediumandsmallshareholders)andindependentdirectors.Relevantdecision-makingprocessandmechanismwerecomplete,and independentdirectors fulfilled theirdutieswithduediligence, thusmaintaining the lawful rightsandinterestsofmediumandsmallshareholders.
(II)Profitdistributionplan2015In lightof relevantprovisions in theCompanyLawof thePeople’sRepublicofChina, theArticlesofAssociationof theCompanyaswellas theMid-termShareholders’ReturnPlan (2014-2016),by taking intoconsiderationofthe requirementsoncapitaladequacy ratioby the regulatorydepartmentsandother factors includingsustainable
82
businessdevelopment, thestatutorysurplus reserveexceeded50%of the registeredcapital, therefore itwasnotnecessary to transferstatutorysurplus reserveaccording to theCompanyLaw.TheCompanyplanned to transferRMB17,172,892,671.91togeneralreserve.ThedividendofpreferredsharesisRMB1,147,347,945.21.TheCompanyalsoplanned todistributecashdividendofRMB6.10 forevery10ordinaryshares (tax included),amounting toRMB11.622billion,basedonthetotalsharecapitalof19,052,336,751shares.Theremainingundistributedearningswillbecarriedforwardtothenextyear.
II.Performanceofundertakings(I)Thefirstextraordinarygeneralmeeting2012oftheCompanyconsideredandapprovedtheProfitDistributionPlan2012-2014 (fordetails,please refer to theannouncementof the resolutionsof thegeneralmeetingdatedAugust29,2012),whichplannedthat in thecomingthreeyears(2012-2014),should therebedistributableprofit, theprofitused fordistribution incashwouldnotbe less than20%(inclusive)of the realizeddistributableprofitof theyearaftermakingup fordeficitsandappropriatingstatutory reservesandgeneralprovisions fromtherealizedearnings,providedthat theregulatoryrequirementsoncapitaladequacyratiocouldbemet.TheCompanyfulfilledtheaboveprofitdistributionundertakingonschedule.
(II)The2013annualgeneralmeetingoftheCompanyconsideredandapprovedtheMid-termShareholders’ Return Plan(2014-2016)(fordetails,pleaserefertotheannouncementontheresolutionsofthegeneralmeetingdatedJuly1,2014),whichplannedthatinthecomingthreeyears(2014-2016),shouldtherebedistributableprofit,cashdividendscouldbedistributedtoshareholdersofordinaryshares,andtheprofitusedfordistributionincashwouldnotbelessthan20%(inclusive)oftherealizeddistributableprofitoftheyearaftermakingupfordeficits,appropriatingstatutoryreservesandgeneralprovisionsandpayingdividendstoshareholdersofpreferredsharesfromtherealizedearnings,providedthatitcouldbeensuredthattheregulatoryrequirementsoncapitaladequacyratiooftheCompanycouldbemet.WhentheCompanydistributesdividendsincashorinspecieorbyacombinationofboth,theproportionofcashdividendsshouldnotbe lower than40%(inclusive)of theprofitdistribution for theyear.TheCompany fulfilled theaboveprofitdistributionundertakingonschedule.
(III)TheCompany’sshareholders,namelyThePeople’s InsuranceCompany (Group)ofChinaLimited,PICCPropertyandCasualtyCompanyLimitedandPICCLife InsuranceCompanyLimited (collectivelyholding10.87%of the total sharecapitalof theCompany)undertook that thenon-publiclyofferedsharesof theCompany they
83
2 0 1 5 ANNUAL REPORT
subscribedforin2012weresubjecttorestrictedtradefor36months,whichcouldnotbetransferredwithin36monthsfromthedaywhentheofferingwascompleted,exceptotherwiserequiredbythecompetentregulatorsonthe lock-upperiod.Theabove-mentionedcompaniesperformed theirobligations, the tradingmoratoriumof relevantshareshasbeenexpiredonJanuary6,2016,andtheseshareshavebeenlistedandtradableonthemarketsinceJanuary7,2016.
(IV)TheCompany’s shareholders, namelyChinaNationalTobaccoCorporation andShanghai ZhengYangInternationalBusinessCo.,Ltd.,holding3.22%and0.99%of the totalsharecapitalof theCompany respectively,undertook that thenon-publiclyofferedsharesof theCompany theysubscribed in2012weresubject to restrictedtradefor36months,whichcouldnotbetransferredwithin36monthsfromthedaywhentheofferingwascompleted.Theabove-mentionedcompaniesperformed theirobligations, the tradingmoratoriumof relevantshareshasbeenexpiredonJanuary6,2016,andsuchshareshasbeenlistedandtradableonthemarketsinceJanuary7,2016.
(V)TheCompany receivedanotice fromFinanceBureauofFujianProvince, the largestshareholderonJuly9,2015,whichread,consideringtheabnormalfluctuationinChina’ssecuritiesmarketrecently,inordertosupportthesustainable,steadyandsounddevelopmentof thecapitalmarketandprotect the lawful rightsofvarious investorsof theCompany,FinanceBureauofFujianProvincewouldactivelyperform its responsibilitiesasashareholderandcommittednottosellthesharesoftheCompanythatitholdsduringtheperiodofabnormalfluctuationinstockmarket.FinanceBureauofFujianProvinceperformed itsdutiesstrictlyanddidn’tsell theshares fromthedateofundertakingtothedisclosureofthereport.
TheCompanyanditsshareholdersholding5%ormoreoftheCompany’s shares made no other undertakings during thereportingperiodorundertakingsthatlastedintothereportingperiod.
III.SituationofcapitalbeingoccupiedandusedduringthereportingperiodDuring the reportingperiod,nocontrollingshareholderorother relatedpartiesused thecapital fornon-operatingpurpose.DeloitteToucheTohmatsuCertifiedPublicAccountantsLLPhad issued“Specification for theFundsOccupiedbyControllingShareholderandOtherRelatedPartiesofIndustrialBankCo.,Ltd”.
litigation:Mr.ChenWen-Te,aTaiwanese,filedaclaiminFujianProvincialHighPeople’s Court and insisted that he hadpurchased550,000ordinarysharesissuedbytheCompanyin1988,thenlostcontactwiththeCompanyandlostthesubscriptionpaymentcertificate.Afteranumberofchangesincludingbonusissueandcapitalization,thenumberofsuchshareshasincreasedto3.0888million,whicharenowheldbyXingyinPropertyundertheentrustmentoftheCompany,andthedividendsoverthoseyearsaremanagedbytheCompany.Itisrequestedtoconfirmthatthe3.0888millionsharesheldbyXingyinPropertyand thedividendsmanagedby theCompanyareownedby theplaintiff,andtorulethatsuchsharesanddividendsshouldbereturnedtotheplaintiff.PleaserefertotheAnnouncementonSettlementofOutstanding IssueRegarding theEquityofMr.ChenWen-Te,ATaiwaneseShareholderbyWayofLitigationpublishedbytheCompanydatedAugust27,2015.
TheCompanyreceivedthefirstinstanceciviljudgmentservedbyFujianProvincialHighPeople’s Court in December 2015, inwhich the judgmentconfirmed that the3.0888millionsharesof IndustrialBankCo.,Ltd.under thenameof “ChenWen-Te”heldbyXingyinPropertybelong to theplaintiffChenWen-Te, fordetailsplease refer to theannouncementpublishedbytheCompanydatedDecember26,2015.Thisjudgmenthascomeintoeffectandeachpartyof the litigation isnowperforming the judgment.This litigation ishelpful tosettle relevantoutstandingequityissue inapropermanner,andwillhaveno impacton theprofitsand lossesof theCompany inorafter thecurrentperiod.
(II)During the reportingperiod, therewasnoothermaterial lawsuitorarbitrationagainst theCompany thatwasrequiredtobedisclosed.
VI.PunitiveactionsagainsttheCompany,anditsdirectors,supervisors,seniormanagementpersonnelandthelargestshareholderDuringthereportingperiod,noinstancesofinspections,administrativepenalties,banningofentryintothesecuritiesmarket,noticeofcriticism, identificationasan inappropriatecandidateorpubliccensurewas takenbysecuritiesregulatoryauthoritiesagainst theCompany,and itsdirectors, supervisors, seniormanagementpersonnelandlargestshareholder,andnootherpenaltiesthatmateriallyaffectedtheCompany’s operations were imposed on the Companybyotherregulatoryauthorities.
(II)The6thmeetingof the8thsessionof theboardofdirectorsof theCompanyconsideredandapproved theProposalconcerningExtendingofaRelatedPartyTransactionLinetoChinaNationalTobaccoCorporation(“CNTC”), agreeingtoextendaninternalbasiccreditlineofRMB8.5billiontoCNTCrelatedlegalpersonsforvarioustypesofshort-term,medium-termandlong-termbusiness.Itwasalsoagreedtoextendanon-creditrelatedpartytransactionline toCNTCrelated legalpersonswithanannual transactionamountofnotexceedingRMB457million,and thetypesof transactions includedasset transferbusinessandserviceprovisionbusinesssuchasproperty leasing,acquisitionofself-occupiedrealestateandcomprehensiveservices fora termof3years.Theaboverelatedpartytransactions arose from the needs of the due course of business activities and were conducted on conditions not morefavourablethanthosefortransactionsofthesametypewithnon-relatedparties.Thepricingofthetransactionswasfair, the transactionscompliedwith therelatedrequirementsof relevant laws,regulations, rulesandregulatorysystems,and themethodand timingofpayment for the transactionsweredeterminedby reference tocommercialpractice.Fordetails,pleaserefertotheCompany’sannouncementdatedJune7,2014.
(III)The9thmeetingofthe8thsessionoftheboardofdirectorsoftheCompanyconsideredandapprovedthroughteleconferenceduringOctober 22 toOctober 27, 2014 theProposal concerningExtensionofRelatedPartyTransactionLine toThePeople’s InsuranceCompany (Group)ofChinaLimited,agreeing toextenda relatedtransaction line toPICCrelated legalpersonsofRMB9.945billion fora termof2years,comprising:an internalbasiccredit lineofRMB5billion forfinancialbond,subordinateddebt investment,RMB inter-bankborrowing,bondrepurchase,guaranteeandcreditenhancement,andRMBinterestrateswap,forwhichtheapplicantwastheissuingentity,andanon-credit relatedtransaction linewithanannual transactionamountnotexceedingRMB4.945billion,with the typesof transaction including treasurybusiness,assetmanagement,assetcustody,creditasset transferandprovisionofinsuranceservices.Theaboverelatedpartytransactionsarosefromtheneedsoftheduecourseofbusinessactivitiesandwereconductedonconditionsnotmore favourable than those for transactionsof thesametypewithnon-relatedparties.Thepricingof the transactionswas fair, the transactionscompliedwith the relatedrequirementsofrelevantlaws,regulations,rulesandregulatorysystems,andthemethodandtimingofpaymentforthe transactionsweredeterminedby reference tocommercialpractice.Fordetails,pleaserefer to theCompany’s announcementdatedOctober29,2014.
(II) Guarantees issuesInaccordancewiththerelevantprovisionsofCSRC,theCompanycarefullyverifieditsguaranteetoexternalpartiesin2015.TheCompany’sexternalguaranteebusinesswasapprovedbyPBOCandCBRCand itwaspartof theCompany’sregularbusinessoperations.Asattheendofthereportingperiod,thebalanceoftheCompany’sletterof
X.Descriptionofothermajorissues(I) Issuanceofpreferredshares:TheCompany issued thesecond tranche130millionpreferredshareswithaparvalueofRMB100pershareand5.4%coupon in the first interestcycle throughnon-publicoffering inJune2015.Afterdeducting theofferingexpenses, thenetproceeds reachedRMB12,947million,allofwhichwereused forsupplementingTier1capital.Uponthecompletionofissuanceofthesecondtrancheofpreferredshares,thepreferredshareshavebeenlistedontheintegratedbusinessplatformoftheShanghaiStockExchangesinceJuly17,2015.
(III) Establishment of Industrial EconomicResearch andConsultingCo., Ltd. and changes in scope of theconsolidatedstatements: IndustrialEconomicResearchandConsultingCo.,Ltd.wasestablished inShanghai inJune2015,theregisteredcapitalisRMB60million,inwhichCIBGuoxinAssetManagementCo.,Ltd.,thesubsidiaryofIndustrialTrustandCIBWealthManagementCo.,Ltd.,thesubsidiaryofIndustrialFundcontributedRMB20millionrespectively,andwasincorporatedintotheconsolidatedscope.
(IV)EstablishmentofChinaIndustryDigitalFinancialService(Shanghai)Co.,Ltd.:Under theapprovalof theBoardof theCompany, theCompany invested inandestablishedChina IndustryDigitalFinancialService(Shanghai)Co.,Ltd.,51%sharesofwhichisheldbyCIBWealthManagementCo.,Ltd.,awholly-ownedsubsidiaryoftheCompany’s holdingsubsidiary IndustrialFund. Its registeredcapital isRMB500million, its registeredplace isChina(Shanghai)PilotFreeTradeZoneand ithadcompleted theprocedures forchanges in industrialandcommercial registration inNovember2015. Itsbusinessscopemainly includesdealingwith financialdata,economic informationconsultantservice,developmentandoperationofApp,systemintegrationservice,equityinvestment,venturecapitalinvestment,assetsmanagement,investmentmanagementandinvestmentconsultant,etc.ChinaIndustryDigitalFinancialService(Shanghai)Co.,Ltd.isincorporatedintotheconsolidatedscopeoftheCompany’sholdingsubsidiaryIndustrialFund.
XI.PerformanceofsocialresponsibilitiesTheCompanyhasdisclosed theSustainableDevelopmentReport2015, fordetailsplease refer to thewebsiteofShanghaiStockExchange.
87
2 0 1 5 ANNUAL REPORT
ShaRe CaPItal ChangeS anD ShaReholDeRS of oRDInaRy ShaReS
I.Changesinsharesduringthereportingperiod(I)Changes in sharesAs at the end of the reporting period, the total number of ordinary shares of theCompany amounted to19,052,336,751sharesandtherewerenochangesduringtheperiod.
(II) Changes in restricted sharesUnit:share
Nameofshareholders
Number of restricted
shares at the
beginning of the
period
Number of shares released
from restrictions
Number of restricted
shares increased
in the period
Number of restricted shares at
the end of the period
Reasons of restrictions
Date of release
from restrictions
ThePeople’s InsuranceCompany(Group)ofChinaLimited
174,651,600 - - 174,651,600
Undertakings on thelock-up
period of non-public
offering
January7,2016
PICCPropertyandCasualtyCompanyLimited-traditional common insurance product
II.Issuanceandlistingofsecurities(I) Issuance of securities during the reporting periodExcept for the issuanceof thesecond trancheRMB13billionpreferredshares, theCompanydidn’t issueanyadditionalordinarysharesandothersecuritiesduringthereportingperiod.
88
(II)TheCompanyhadnoemployeestocks
III.Shareholders(I)TotalnumberofshareholdersAsat theendof the reportingperiod, theCompanyhada totalof258,931shareholderaccounts,and247,147shareholdersaccountsattheendofthemonthpriortothereleaseofthisannualreport.
Not transferablewithin 36months from thedaywhenthenon-publicofferingwasfinished (except otherwise required by the competent regulatorsonthelock-upperiod)
PICCPropertyandCasualtyCompanyLimited-traditional common insurance product
(V)TheCompanyhasnocontrollingshareholderoractualcontrolleranditslargestshareholderistheFinanceBureauofFujianProvince.Asattheendofthereportingperiod,shareholdersholdingover10%oftheCompany’sshareswereasfollows:1.TheFinanceBureauofFujianProvince isa legalpersonofgovernmentunit. Its legal representative isChenXiaopingand theaddress is5ZhongshanRoad,Fuzhou. It is the largestshareholderof theCompany,holding17.86%oftheCompany’sshares.
PICCPropertyandCasualtyCompanyLimitedwasestablishedin2003andlistedontheHongKongStockExchangein thesameyear. Ithasa registeredcapitalofRMB14.829billion, its registeredplacewasBeijingand its legalrepresentative isWuYan. Itsbusinesscoversall typesofproperty insurance, includingmotorvehicle,property,marine,credit,accident,energy,aerospaceandagricultural insurances.Now, it is the largestproperty insurancecompanyinChina.
PICCLifeInsuranceCompanyLimitedisanationallifeinsurancecompany.Establishedin2005,ithasaregisteredcapitalofRMB25.761billion, its registeredoffice is inBeijingand its legal representative isWuYan. Itsbusinessincludes:lifeinsurance,healthinsurance,accidentinsurance,personalreinsuranceandinvestment.
V.AccountingpoliciesadoptedbytheCompanyforthepreferredsharesand reasonsThepreferredsharesof theCompanyare categorizedasa financial liability or anequity instrumentat initialrecognitioninaccordancewiththefollowingaccountingpoliciesregardingfinancialliabilitiesandequityinstruments.
Financial liabilityreferstoaliabilitythatfulfillsoneofthefollowingconditions:(1)acontractualobligationtodelivercashorotherfinancialassetstoanotherentity.(2)acontractualobligationtoexchangefinancialassetsorfinancialliabilitieswithanotherentityunderpotentiallyunfavourablecircumstances. (3)anon-derivative instrumentcontractthatshallbeormaybesettledintheCompany’sownequityinstrumentsinfuture,pursuanttowhichtheCompanywilldeliveravariablenumberofitsownequityinstruments.(4)aderivativeinstrumentcontractthatshallbeormaybesettled in theCompany’sownequity instruments in the future,excludinganyderivative instrumentcontract forwhichtheCompanywilldeliverafixednumberofitsownequityinstrumentstoexchangeafixedamountofcashor
94
otherfinancialassets.
Equity instrument isanycontract thatcanprovea residual interest in theassetsof theCompanyafterdeductingallof its liabilities.TheCompanywill categorize its financial instrumentasequity instrumentwhen itsatisfiesallof the followingconditions: (1) the financial instrumentshall includenocontractualobligation todelivercashorotherfinancialassets toanotherentity,orexchangefinancialassetsorfinancial liabilitieswithanotherentityunderpotentiallyunfavourablecircumstances; (2) the financial instrumentshallbeormaybesettled in theCompany’s ownequityinstrumentsinthefuture.Ifitisanon-derivativeinstrument,itshallincludenocontractobligationfortheCompanytodeliveravariablenumberofitsownequityinstrumentforsettlement.Ifitisaderivativeinstrument,theCompanycanonlysettleitbyusingafixednumberofitsownequityinstrumentstoexchangeforafixedamountofcashorotherfinancialassets.Issuance(includingrefinancing),redemption,disposalorwrite-offofequityinstrumentsbytheCompanyisaccountedforasmovementsinequity.TheCompanydoesnotrecognizechangesinfairvalueofequityinstruments.Transactionfeesrelatedtoequitytransactionsaredeductedfromequity
InDecember2014, theCompany issuednon-cumulativepreferredsharesamounted toRMB13billion todomesticinvestors,and theCompanyhad,afterdeducting the issuance fee,bookedanamountofRMB12.958billionunderthecategoryofotherequity instruments. In thedurationperiodof thepreferredsharesunder this issuance, theCompany isentitled to,bysatisfying the related requirementsandwith theapprovalof theCBRC, fullyorpartlyexerciseitsredemptionrightsforitspreferredsharesoneachyear’sdividendpaymentdate(i.e.December8,2014)after5yearsoftheissuancedateofthepreferredshares,buttheshareholdersofthepreferredshareshavenorighttorequesttheCompanytomakeredemption.Thecouponofthepreferredshareswillbeadjustedbyphases,i.e.inafive-yearcouponadjustmentperiod,thedividendpaymentshallbepaidincashatafixeddividendrateonceayear.TheCompanyreserves the right to fullyorpartlycancel thedeclarationandpaymentofdividend for thepreferredshares.
InJune2015,theCompanyissuedthesecondtranchenon-cumulativepreferredsharesamountedtoRMB13billiontodomestic investors,and theCompanyhad,afterdeducting the issuance fee,bookedanamountofRMB12.947billionunder thecategoryofotherequity instruments. In thedurationperiodof thepreferredsharesunder thisissuance,theCompanyisentitledto,bysatisfyingtherelatedrequirementsandwiththeapprovaloftheCBRC,fullyorpartlyexerciseitsredemptionrightsforitspreferredsharesoneachyear’sdividendpaymentdate(i.e.June24,2014)after5yearsoftheissuancedateofthepreferredshares,buttheshareholdersofthepreferredshareshavenorighttorequesttheCompanytomakeredemption.Thecouponofthepreferredshareswillbeadjustedbyphases,i.e.inafive-yearcouponadjustmentperiod,thedividendpaymentshallbepaidincashatafixeddividendrateonceayear.TheCompany reserves the right to fullyorpartlycancel thedeclarationandpaymentofdividend for thepreferredshares.
TheCompanyshall,subjecttotheapprovalofCBRC,fullyconvertitsexistingpreferredsharesunderthisissuanceinto itsordinaryshares, in theeventof the following triggerconditionsof themandatoryconversion: (1)when thecoreTier1capitaladequacyratiofallsto5.125%(orbelow),thepreferredsharesunderthisissuance,subjecttothedecisionof theCBRC,shallbe fullyconverted into theordinaryAsharesof theCompanybasedonthemandatoryconversionprice.Aftertheconversion,thoseordinaryAshareswillnotbeconvertedbackintopreferredsharesunderanycircumstances; (2)When triggeredeventof thesecondarycapital instruments issuedby theCompanyoccurs,thepreferredsharesof this issuewillbeexaminedanddecidedby theCBRC,andshallbe fullyconverted intoordinaryAsharesoftheCompanyinaccordancewiththefullmandatoryconversionprice.Aftertheconversion,thoseordinaryAshareswillno longerbe restored topreferredstockunderanyconditions.Among them, thesecondarycapital instruments triggeringevent is theearlierof the following twosituations: ①CBRC identifies if itwasnotconversionorwrittendown, theCompanywillbeunable tosurvive; ②Relevantdepartments identify if thepublicsectors don’tinjectorofferthesameeffectsupport,theCompanywillnotsurvive.
The initialconversionpriceof thepreferredsharesunder the issuanceshallbe theaverage tradingprice (that isRMB9.86/share)oftheordinaryAsharesoftheCompanyinthe20tradingdaysprecedingthedateoftheresolutionof themeetingof theBoardatwhich the issuanceproposalof thepreferredshareswasconsideredandapproved.
95
2 0 1 5 ANNUAL REPORT
Following thedateof theBoard resolution, in theeventof the issuanceofbonusshares, conversionof sharecapital,issuanceofnewshares(excludingadditionalsharecapitalasaresultofconversionintosharesoffinancinginstrumentsattachedwith terms for conversion intoordinaryshares, suchaspreferredsharesandconvertiblecorporatebonds,ofwhich theirsharecapital is increasedby theconversion),shareplacement,etc., theCompanyshall,basedon thesequenceof theoccurrencesof theaboveevents,undertakecumulativeadjustments to theconversionprices inaccordancewith thespecifiedformula. Inaccordancewith theapplicable lawsandregulationsand the CBRC’sOfficialReplyoftheIndustrialBank’sNon-publicOfferingofPreferredSharesandAmendmentstotheArticlesofAssociation(YJF[2014]No.581)andtheCSRC’sOfficialReplyofApprovalontheNon-publicOfferingofPreferredSharesbyIndustrialBankCo.,Ltd(ZJXK[2014]No.1231), theproceedsfromtheofferingofpreferredsharesshallbeusedtoreplenishtheotherTier1capitaloftheCompany.Intheeventofliquidation,shareholdersofpreferredsharesshallhavepriorityovershareholdersofordinarysharesinreceivingtheparvalueasthesettlementamount. If the residualpropertyof theCompany is insufficient, thepaymentshallbesettledonapro ratabasisbasedontheshareholdingsofshareholdersofpreferredshares.Thepreferredsharesunderthis issuanceshallberecognizedasotherequityinstrumentsbasedonthecontractualtermsandtheeconomicenvironment.
96
DIReCtoRS, SuPeRvISoRS, SenIoR management memBeRS anD emPloyeeS
5.OnFebruary29,2016,Mr.LiRenjietenderedhisresignationinwritingtotheboardofdirectorsduetoofficialageandresignedfromthepositionofdirectorandpresidentof theCompany, theresignation takeeffectwhen it is tendered to theboardofdirectors.Onthesameday,theCompany’s11thmeetingofthe8thsessionoftheboardofdirectorsconsideredandapprovedtoappointMr.TaoYipingaspresidentoftheCompany.
(III)Anoutlineofworkingexperienceofdirectors,supervisorsandseniormanagement members, and their appointments or concurrent appointments inorganizationsotherthantheCompanyorshareholdercompanies
Name Workingexperienceoutline
A p p o i n t m e n t s o r c o n c u r r e n t appointments inorganizationsotherthan theCompanyor shareholdercompanies
Membe r o f t he 12 th Na t i ona lCommitteeof theChinesePeople’s PoliticalConsultativeConference
ChenYichao
Masterdegree, senioreconomist.HepreviouslyservedasdeputyleaderofscientificresearchinstitutionofFinanceBureauofFujianProvince,deputycountymayorofChangtingCounty(temporarypost),directorof the informationcenter,directoroftheintegratedservicedepartment,executivedeputydirectoroftheoffice(ministerlevel)ofFinanceBureauofFujianProvince.Currently,hehasretired.
Director and generalmanager ofHangSengInvestmentManagementL t d . , d i r e c t o r o f H a n g S e n gManagementPteLtd.,HangSengBullion,HangSengInsurance,HangSeng Investment,HangSengLifeandHangSengSecurities
LiLiangwen
Bachelor degree, senior economist.Hepreviously servedas deputy generalmanager, generalmanager of PICCQinhuangdaoCompany,deputygeneralmanagerofChinaInsurance (UK)Company,deputygeneralmanagerofPICCHebeiCompany,deputygeneralmanagerofDepartmentofActuarialofChinaLife Insurance,andvicepresidentofChinaLife InsuranceCo.,Ltd.;vicepresident,executivedirectorofThePeople’s InsuranceCompany(Group)ofChinaLimited,deputy chairman and president of PICC Life InsuranceCompanyLimited.Currently,hehasretired.
None
101
2 0 1 5 ANNUAL REPORT
Name Workingexperienceoutline
A p p o i n t m e n t s o r c o n c u r r e n t appointments inorganizationsotherthan theCompanyor shareholdercompanies
ZhangYuxia
Bachelordegree,senioraccountant.Shepreviouslyservedassectionchief,deputydirectoranddirectorof industrysectionII,Department of Industry,TransportationandFinanceofMinistryofFinance,deputydirectorofInstitutionServiceCenterofMinistryofFinance,andchiefofDepartmentofFinancialManagement and Supervision (Department of Audit) of State TobaccoMonopolyBureau;andcurrentlyaschiefaccountantofStateTobaccoMonopolyBureau/ChinaNationalTobaccoCorporation.
PhD,senioreconomist.Hepreviouslyservedasdeputysectionchief of business section of securities business department, managerof insurancedepartmentof IndustrialBank,generalmanager assistant and manager of investment banking of IndustrialSecurities,deputygeneralmanagerofgeneraloffice,generalmanagerof board secretariat anddeputygeneralmanagerofgeneraloffice,generalmanagerofgeneralofficeof IndustrialBank,presidentof IndustrialBankBeijingBranch,directorandvicepresidentof IndustrialBank;asat thedateof thedisclosureof the report,hecurrentlyservesaspartycommittee member and chairman of the board of supervisors, heholdsactivitiesoftheboardofsupervisors,andisinchargeof theauditdepartment,monitoring&securitydepartmentandparty&populacepidgindepartmentoftheCompany,etc.
None
LiRuoshan
PhD, professor, non-practicing certified accountant. Hepreviouslyservedasdeputydeanoftheaccountingdepartmentand vice president of the school of economics, XiamenUniversity,deanof theaccountingdepartmentandthefinancedepartment,andvicepresidentoftheschoolofmanagementofFudanUniversity;he iscurrentlyservingasMPACCacademicdean,professor,PhD tutorat theschoolofmanagementofFudanUniversity.
MPACC academic dean, professor and PhD tutor of the school ofmanagement at FudanUniversity,independent director of China Eastern Airlines,Xi’anShanguPowerCo.,Ltd.andZhangjiangHigh-technologyCompany
PaulM.Theil
PhD.He servedpreviously as first secretary, commercialcounsellorof theU.S.Embassy inChinaand theexecutivedirectorofMorganStanley;heiscurrentlyservingaschairmanofShenzhenZhongAnCreditVentureCapitalCo.,Ltd.
Cha i rman o f Shenzhen ZhongAn Credi t Venture Capi ta l Co.,Ltd., director of GuoAn Countybank , independent d i rec to r o f Morgan S tan ley Huax in FundManagementCompanyLimited,legalrepresentative ofMohs IndustrialDevelopment (Shenzhen)Co.,Ltd., andpresidentofSmallLoansIndustryAssociationofShenzhen
102
Name Workingexperienceoutline
A p p o i n t m e n t s o r c o n c u r r e n t appointments inorganizationsotherthan theCompanyor shareholdercompanies
Director of academic committee of theschoolof finance,professorandPhDtutoratRenminUniversityof China, executive member of the societyofpublic financeofChina,execut ive member and deputychairman of the academic committee of China Internat ional Taxat ionResearch Institute, executive member of the Chinese tax institute, executive directorofChinaSocial InsuranceAssociat ion, execut ive member ofBeijingPublic-financeSociety, d i s t i n g u i s h e d p r o f e s s o r a t YangzhouTax Instituteof theStateAdministrationofTaxation,adjunctp ro fesso r a t Be i j i ng Na t i ona lAccounting Institute andXiamenNationalAccountingInstitute
LiuShiping
PhD.He previously served as leader of the dataminingconsultingteam(globalfinancialindustry)oftheservicedivisionof IBMandchiefadviserofBusiness Intelligence,providingbusiness intelligentconsultingservices toover100 financialinstitutions includingcentralbanks,ShanghaiStockExchangeandChinaDevelopmentBank.He is currently servingaspresidentoftheGlobalBusinessIntelligenceConsulting(Beijing)Co.,Ltd.
P res iden t o f G loba l Bus inessIntelligenceConsulting(Beijing)Co.,Ltd.,memberof the InformatizationCommittee of the China Association forPublicCompanies,professorandPhDtutorattheUniversityofChineseAcademy o f Sc iences(UCAS) ,Associate of the Research Center of FinanceSciencesandTechnologyofUCAS, torch entrepreneurshiptutor inMinistry of Science andTechnology, committeememberofChinaAssociation of TechnologyEntrepreneurs, committee member ofChinaAccounting InformatizationCommittee, vice chairman of the executivecommitteeofXBRLChina,technicalconsultantof theSouthernMed ic ine Economic Research Institute ofCFDA, advisor of theChengduTechnologyConsultingTeam
LinHua
Masterdegree.Hepreviously servedasgeneralmanagerofJinyuanCapitalManagement (Xiamen)Co.,Ltd.,generalmanagerofXiamenVentureCapitalCo.,Ltd.(XiamenMunicipalGovernmentParent Fund ), director of operations of theInvestmentDepartmentof ChinaGuangdongNuclearPowerGroup (CGNPC),structural department high-levelmodelengineerandprojectmanagerofKPMGintheUnitedStates.Hecurrentlyservesasthepart-timeprofessorofNankaiUniversityandSouthwesternUniversityofFinanceandEconomics,andtheguestprofessorofXiamenNationalAccountingInstitute.
Par t - t ime pro fessor o f Nanka iUn i ve r s i t y and Sou thwes t e r nUniversityofFinanceandEconomics,and theguestprofessorofXiamenNationalAccountingInstitute
103
2 0 1 5 ANNUAL REPORT
Name Workingexperienceoutline
A p p o i n t m e n t s o r c o n c u r r e n t appointments inorganizationsotherthan theCompanyor shareholdercompanies
XuChiyun
University graduate, senior accountant. She previouslyservedasdeputysectionchief,principalsectionmemberofLongyanMunicipalBureauofFinanceanddeputypresidentofAccountantsSocietyofLongyan.She iscurrentlyservingas sectionchief of LongyanMunicipalBureauofFinance,FujianProvince,anddeputysecretarygeneralofFinance,Accountants&AbacusSocietyofLongyan.
Depu t y s e c r e t a r y g ene r a l o fF inance, Accountants&AbacusSocietyofLongyananddirectorofLongyanHuijinAssetsManagementDevelopmentCo.,Ltd.
Managing director of Shanghai GuoheModern Service IndustryEquity InvestmentManagementCo.,Ltd., independentdirectorofSangonBiotech (Shanghai)Co., Ltd. andsupervisorofALL INPAYNetworkServicesCo.,Ltd.
Lijian
Masterdegree,senioraccountant.Hepreviouslyservedasplanning team leader,directorassistant,deputydirectorofbudgetoffice, concurrentlydirectorof budgetoffice, fiscalrevenue inspection office and infrastructure construction office,directorofenterpriseofficeofFinanceBureauofFujianProvince.He is currently serving as generalmanager ofplanning&financedepartmentofIndustrialBank.
None
LaiFurong
Bachelordegree, senioraccountant.Hepreviously servedas vice head and head of Jin’ansub-branch,Fuzhoubranchof IndustrialBank,deputygeneralmanagerof financeandaccountingdepartmentof IndustrialBank,vicepresidentofGuangzhoubranchofIndustrialBank,vicegeneralmanagerofplanning&financedepartmentofIndustrialBank.Heiscurrentlyservingasgeneralmanagerofauditdepartmentof IndustrialBank.
Professor and PhD Tutor of the Schoo l o f Economics , X iamenUniversity
Chen Jinguang
Collegegraduate,economist.HepreviouslyservedasheadofPudongsub-branchofShanghaibranch,vicepresidentofShanghai branch, president of Ningbo branch, president of ChengdubranchandpresidentofBeijingbranchof IndustrialBank.Heiscurrentlyservingaspartycommitteememberandvicepresidentof IndustrialBank,managesheadquartersofretailbank,e-bankingdepartmentand information technologydepartmentetc.
None
104
Name Workingexperienceoutline
A p p o i n t m e n t s o r c o n c u r r e n t appointments inorganizationsotherthan theCompanyor shareholdercompanies
XueHefeng
Bachelordegree.HepreviouslyservedasdeputymanagerofoperationdepartmentofFuzhoubranch,deputyheadofMajiangofficeofFuzhoubranch,generalmanagerofcreditmanagementdepartment ofBeijing branch and head ofChaowai sub-branch,generalmanagerof riskmanagementdepartmentofBeijingbranch,presidentassistantandgeneralmanagerofriskmanagementdepartmentofBeijingbranch,vicepresidentofShenzhenbranchofIndustrialBank.HeiscurrentlyservingaspartycommitteememberandvicepresidentofIndustrialBank,heismainlyinchargeoftheheadquarterofcorporatefinance.
None
LiWeimin
Universitygraduate,masterdegree, senioreconomist.Hepreviouslyservedasdeputymanagerand thenmanagerofoperationdepartmentofFuzhoubranch,presidentassistantandmanager of general office of Fuzhou branch, vicepresidentofFuzhoubranch,vicepresidentofNanjingbranch,president of Zhangzhou branch, president of Zhengzhoubranch,andpresidentofFuzhoubranchof IndustrialBank.He iscurrentlyservingaspartycommitteememberandvicepresidentof IndustrialBank,he ismainly inchargeof theriskmanagementdepartment, lawandcompliancedepartmentandpayment&settlementdepartmentetc.
(IV)Changesofdirectors,supervisorsandseniormanagementmembersduring the reporting period1.OnMarch1,2015,Mr.ChenDekang,havingreachedhisretirementage,tenderedhisresignationinwritingtotheboardofdirectorsandresignedfromthepositionofvicepresidentoftheCompany.
(II)EmployeeremunerationpoliciesIn respectof the remunerationmanagement, theCompanyadheres to the requirementsofcorporategovernance,maintaining thecompetitivenessandsustainabledevelopmentof thebank,matchingupwith theoperating results,integratingwith the long-andshort-term incentives,balancing the internal fairnessandexternalcompetitiveness,facilitating the implementation of strategic objectives of theCompany, supporting the demandsof businessdevelopmentatdifferentstagesaswellastheattractingandretainingofemployees,especiallyforkeypersonnel.
1.Remunerationstructure
In accordancewith the internal controlmechanismof theCompany, thegrowth in the total remuneration ofemployeesshouldnotexceedthegrowthinthenumberofemployeesandthegrowthinmajorindicatorsofbusinessperformance ingeneral.Employeesholdingdifferentpositionscarrydifferent responsibilitiesandbeardifferentrisk levels, resulting indifferences in their remunerationstructure.Thehigher thecorrelationbetween theworkperformanceofemployeesandtheoverallbusinessperformanceoftheCompany,thehigherwillbetheproportionofthefloatingbonus.
2.Remunerationpolicies
Performancebonusofemployees is linkedwith thecomprehensiveperformanceof theCompany, the institutions(departments)and individuals. In termsof thescopeofassessment indicators,severalkey indicatorsareselectedforperformanceassessment, including the rateof returnoncapital, rateof returnon riskassets,non-performingloans ratio,complianceoperationsandevaluationon internalcontrol.The indicatorsareapplied to the institutionsandemployees,and theoverallappraisal resultswillbe linked to thebonusofemployees to reflect thecorrelationbetweentheremunerationandvarioustypesofrisks.Inordertoimprovetheincentiveandrestraintmechanism,andensuretheremunerationpoliciesareinlinewiththepresentandfuturerisks,thepaymentofacertainproportionoftheperformancebonustotheseniormanagementmembers,seniormanagementcadres,andkeybusinessstaffandemployeesholdingkeypositionsintheoperationalinstitutionsshallbedeferredandretainedasriskfund.Ifthereisabreachofregulationsordisciplineorextraordinaryriskexposureincarryingoutdutiesduringtheappraisalperiod,acorrespondingamountshallbedeductedfromtheriskfundofthestaffheldliable,soastoensuretheremunerationlevelofemployeesisconsistentwiththeirrisk-adjustedperformance.
3.Detailedinformationaboutremunerationofemployeesinpositionshavingsignificantimpactsontherisksof the bank
Theallocationofremunerationisbasedonthefundamentalideaof“allocationbasedonthevalueofjobpositionsand contributions”,amongwhich thevalueof jobpositions includes technologicalandmanagerialdifficulties, risklevelsandcontributions to thebankingsystem.The remunerationofemployeesmatcheswith thevalueof theirjobpositionsand their job responsibilities.For thoseengaged in the riskmanagementandcompliancefields, theirremunerationdependson individualcapability,performanceofduties,andappraisalson the teamand individualbasis,buthasnodirect relationshipwith theperformanceofotherbusinessareas,whichcanensure that theremunerationofstaff in the riskmanagementandcompliance fields is independent from theperformanceof thebusiness linesunder theirsupervision,andsuchsegregationcanpromote thesteadyoperationsandsustainabledevelopmentoftheCompany.
I.CorporategovernanceoverviewOver the last fewyears, theCompanycontinued to strengthencorporategovernance,while constructingandclarifyingtheobjectivesanddirectionoftheboardofdirectorsandtheboardofsupervisors.TheCompanycontinuedtosolidify thegoverningconceptofsustainabledevelopment toshapescientificanddemocraticdecision-making,establisheda researchand training learningsystem fordirectorsandsupervisors,andcreatedasoundcorporategovernancetransmissionmechanism.
During the reportingperiod, theboardofdirectorsand theboardofsupervisors implemented thedecision-makingdecisionsandsupervisorypoliciesbyfullyperformingtheir functions inmakingstrategicdecisionsandsupervision.Theyalsoset the2015operationalplans inascientificway, completed the issuanceof thesecond trancheofpreferredsharesofRMB13billion,continued todeepen thegroup-orientedoperations,pragmaticallypromoted thereformstowardsprofessionalismandcommittedtofulfillsocialresponsibilities.Meanwhile, theyorganizeddirectorsandsupervisors toconduct researchandspecial inspectionsoncorporate finance+Internet finance,environmentfinance,assetmanagement,fiveyeardevelopmentplanning,assetqualitycontrol,internalcontroloftheBankatalllevels,therebygaininganall-roundunderstandingofthebusinessoperationandmanagementoftheCompany,andfurther improving the directors’ and supervisors’capabilityandprofessionalisminfulfillingtheirdutiesincompliancewith the law.TheCompanyeffectively implemented the transmissionmechanism formajordecisionsof theboardof directors and the feedback mechanism for supervision recommendations of the board of supervisors, which accuratelyconveyed thespiritsof themeetingsof theboardofdirectorsand theboardofsupervisors,promotedthesteadyandsustainabledevelopmentof theCompany,andsafeguarded the interestsofall shareholdersandstakeholders.
(I)ShareholdersandgeneralmeetingsDuring the reportingperiod, theCompanystandardized theconvening,holding,discussingandvotingproceduresof generalmeetings in accordancewith the relevant lawsand regulations, theArticles ofAssociationof theCompany,andtheprovisionsontherulesofproceduresforgeneralmeetings,andsafeguardedthelawfulrightsofshareholders.Meanwhile, theCompany improved itscommunicationchannelswithshareholdersbyheeding theiropinionsandsuggestionsactively,soas toensure that theshareholders’ right to know, the participation right and votingrightforthemajoreventsintheCompanycouldbeexercisedinaccordancewiththelawsandregulations.
TheFinanceBureauofFujianProvince,whichholds17.86%sharesof theCompany, is the largestshareholderof theCompany.TheCompany is totally independent from its largestshareholder inallaspects, includingassets,personnel, finance, institutionsandbusinesses.Majordecisionsof theCompanyaremadeandexecutedby theCompanyatitsabsolutediscretion.TheCompany’smajorshareholdershaveneitherappropriatedanycapitaloftheCompanynorrequestedtheCompanytoactasaguarantorforathirdpartyinanywaywhatsoever.
(II) Directors and the board of directorsAsattheendofreportingperiod,theboardofdirectorsoftheCompanyconsistedof12directors.Bycategories, itincludes9non-executivedirectors (including5 independentnon-executivedirectors)and3executivedirectors.Bygeographicalsegments,thereare9domesticdirectorsand3overseasdirectors.Thereare5committeesundertheboardofdirectors,namely,thestrategycommittee,theriskmanagementcommittee,theauditandtherelatedpartytransactioncontrolcommittee,thenominationcommitteeandtheremunerationandevaluationcommittee.Withtheexceptionof thestrategycommittee, theother fourcommitteesarechairedby the independentdirectors.Bygivingfullplayof theirprofessionalstrengths, thosecommitteescarefully reviewedanddiscussedanarrayof important
108
items,andsubmitted them to theboardof directors for considerationandapproval,whereby theCompany’s corporategovernanceandoperatingefficiencywere improvedeffectively.During the reportingperiod,6meetingsof theboardofdirectorswereconvenedand18meetingswereconvenedbyvariouscommitteesof theboardofdirectors,ofwhich162proposalswereconsideredor received.Theboardofdirectorseffectivelyplayed its roleofdecision-makingindevelopmentofcorporatestrategies,determinationofbusinessplansandenhancementofcapitalmanagement and the group oriented operation, and the committees’supporting functions indecision-makingwerealsostrengthened.
(III) Supervisors and the board of supervisorsAsattheendofreportingperiod,theboardofsupervisorshad6supervisors,including3shareholderrepresentatives,2employee representativesand1externalsupervisor.Under theboardofsupervisors, twospecial committeeswereestablished,namely thesupervisioncommitteeand thenomination, remunerationandevaluationcommittee.Bothof thecommitteesareheadedbyexternalsupervisors.Theboardofsupervisors,whichplaced the interestsofshareholdersandtheCompanyasthetoppriority,fulfilleditssupervisiondutiesandwasactivelyengagedintheproject-based researchandstudiesand theauditing investigation,overseeing theCompany’sfinancialactivities,riskmanagementandinternalcontrolandtheduty-fulfillmentof theboardofdirectorsandtheseniormanagement.Duringthereportingperiod,theCompanyheld5meetingsoftheboardofsupervisors(including2teleconferences),inwhich27proposalswereconsideredandreceived.Thecommitteesunder theboardofsupervisorsconvened2meetingsandconsideredandapproved5proposals.
(IV)SeniormanagementAsattheendofthereportingperiod,the6seniormanagementmembersoftheCompanyconsistedof1presidentand5vicepresidents.With theauthorizationby lawsandregulations, theArticlesofAssociationand theboardofdirectors, thepresident tookresponsibilitiesofguiding theoveralloperationandmanagementactivities,organizingand implementing the resolutionsapprovedby thegeneralmeetingsand theboardofdirectors,and formulatingtheannualbusinessplansand investmentplans,annual financialbudgetsand final financial statements,profitdistributionplans,basicmanagementrulesandspecificregulations.
Severalcommitteeswereestablishedundertheseniormanagement,namelythebusinessmanagementcommittee,theassetsand liabilitiesmanagementcommittee, the riskmanagementcommittee, thecreditapprovalcommittee,the internalcontrolcommittee, thecreditaccountabilitycommittee, themajorpurchasescommittee, thebusinesscontinuitymanagementcommittee,theinternalaccountabilitycommitteeandthecommunitybankcommittee.
(V)RelatedpartytransactionsTheCompanyenhancedthemanagementofrelatedpartytransactions.InlightofregulatoryprovisionsoftheMinistryofFinance,CBRC,CSRCandShanghaiStockExchange,incouplewiththeArticlesofAssociation,theAdministrativeMeasuresofIndustrialBankCo.,Ltd.forRelatedPartyTransactionsandtheImplementationRulesofIndustrialBankCo.,Ltd. forManagementofRelatedPartyTransactions, thedifferent levels in theCompany including thegeneralmeetings,theboardofdirectors,theseniormanagementandtherelevantdepartmentsoftheheadofficeandvariousbranchesstrictlyconductedreviews,examinations,approvalsandmanagementofrelatedpartytransactionsaswellas thesupervisionandmanagementofapprovedquotasbasedon their respective functions, togetherwith timelydisclosureof informationconcerning therelatedparty transactions,and theboardofsupervisorsmadesupervisionincompliancewiththelaw.AllrelatedpartytransactionsbetweentheCompanyandrelatedpartiesstrictlyabodebytheprinciplesof“fairness,opennessandvaluableconsideration”,withfairandreasonabletransactiontermsandconditionswhichshouldnotbemorefavourablethanthoseofsimilartransactionsconductedwithnon-relatedparties,
109
2 0 1 5 ANNUAL REPORT
andsuch fair transactionpricingcouldsafeguard the interestsof theCompanyandshareholdersasawholeandencouragethedevelopmentoftherelatedbusinessesoftheCompanyinaregulatedandsustainablemanner.
(VI) Implementationof themanagementsystemto thepersonswith insideinformation TheCompanyformulatedtheAdministrativeMeasuresforPersonswithInsideInformation,whichaimedatregulatingthe internalcirculationandexternalsubmissionofmaterial information,enhancing theconfidentialitymanagementof inside information,strengthening themanagementoffilingsandarchivesconcerning the insiders,urgingmajorshareholderstocomplywiththesupervisoryregulationsofinsideinformation,sothattheillegalactssuchasinsidertradingwouldbepreventedandeliminated,and the fairnessof informationdisclosurewouldalsobepreserved.AspecialsectiononpreventionandcontrolofinsidertradingwassetuponthewebsiteoftheCompanyandareportinghotlinewaspublishedforacceptingexternalsupervisiononinsidertrading.Duringthereportingperiod,theCompanystrictlyenforcedand implemented the relevant informationdisclosuresystem,made timely registrationand filedinformationonthestatusofinsiderstothesecuritiesregulatoryauthorities.Therewerenocasesofinsideinformationbeingusedbyinsidersforstocktradingpriortothedisclosureofmaterialinformation.
In the “2015AppraisalofExcellentBoardofDirectors inChineseListedCompanies” organizedby the21stCenturynewsgroups, theCompanywon the“2015ExcellentBoardofDirectors inChineseListedCompanies(Main Board)”award. In the“Appraisalof Investors’MostlyRespectedListingCompanies”organized togetherbyAssociationofChineseListedCompanies,ChinaSecurities InvestorProtectionFundLtd.andvarious industrialinstitutions, theCompanywon the“2014OneHundred Investor’sMostlyRespectedListingCompanies” award consecutively. In theAppraisalofGoldenBullAwardsheldbyChinaSecuritiesJournal, theCompanywon“2014GoldenBullBestProfitableCompany” and the “2014GoldenBull ListedCompanyTop100List” awards consecutively;Ontheconferenceofreleasingthe2015AsianBankCompetitivenessRankingReport,theCompanywon the “ Asia’sBankOfferingBestReturnstoShareholders”awardconsecutively.
II.Briefintroductionofgeneralmeetings
Session of the meeting Date of convening Reference of appointed websites fordisclosureofresolutions
IV. Importantopinionsandsuggestionsby thecommitteesunder theboard of directors in performing their duties during the reporting period(I)ThestrategycommitteeoftheboardofdirectorsUnderthecircumstancesthatthemacrosituationiscomplexandtherearealotofdifficulties,thestrategycommitteeaccuratelyunderstoodandactivelygrasped thenewnormal,activelyhelped theboardofdirectors to researchonand formulatestrategicplan,adjustoperationstrategyandachieveabalanceddevelopmentof theCompany’s overallscale,qualityandefficiency.Thestrategycommitteefullyunderstoodthekeyfunctionofcapitalmanagementandcontinuedtocompletetheassessmentsystemwiththeeconomicvalueaddedandrateofcapitalreturnafterriskadjustmentatcore.ThestrategycommitteecompletedtheissuanceofthesecondtrancheofRMB13billionpreferredshares,activelypromotedtheissuanceofwritedownsqualifiedsecondarycapitalbondsandacquiredthereplyfromCBRCandPBOC.Thecommitteecontinued toexplorecomprehensiveoperation,establishedandopenedChinaIndustryDigitalFinancialService(Shanghai)Co.,Ltd.andIndustrialEconomicResearchandConsultingCo.,Ltd,thus thecooperativecapacityamonggroupmemberswas further improved.Thecommitteealso regardedcurrenteconomicsituationandchangeincapitalqualityofbankingindustrypracticallyandrealisticallyandkeptafirmgriponthemanagementofassetquality.Thecommitteeexploredmorechannelsotherthanverificationandassignmenttoclearandneutralizenon-performingassets, thusmaintainedoverallstableassetsquality.Thecommitteehighlyfocusedon the investigationof credit accountability, tookmeasures to increase thecostsof insiderandclientdefaultsandconstructedsoundcomplianceculture.Thecommitteecoordinated the institutionalmanagementfunction, furthercompleted theservicenet,continued tostrengthen theoptimization,update, transformofcurrentnetand theconstructionofcommunitybanks,enforced theshareof internalchannelsof theGroup,promoted theintegratedconstructionofonlineandofflinechannels.Thecommitteeenhanced themanagementoffinancialandbusinessmandate, insistedcompliantoperation,andactively intensified internalverificationandpunishment,andrequiredtosystematicallyteaserelevantlawsandsupervisoryregulationsatthesametime,enforcedthetrainingofbusinessskillsandcomplianceconceptofstaff,therebyprotectinglawfulrightsandinterestsofclientsandfinancialconsumers.
(II) The risk management committeeOnthebasisoftheresearchandjudgementandthegripofthefinancialtrendsinthemacro-economicenvironment,thecommitteepaidspecialattention toandanalyzed theCompany’smajor risks in itsoperationalmanagement,anddrewconclusiononandevaluated its riskmanagementmeasures.Thecommitteeprovidedopinionsandsuggestions for further improvement, effectively raised the riskmanagement standardsof theCompanyandensured the Bank’ssteadymanagementandcompliantoperations.Forcapitalqualitymanagement,thecommitteeanalyzedandcompareddifferencesofassetsqualitybetweenstate-ownedlargebanksandjoint-equitycommercialbanksand reasons for it,submitted toandsuggested themanagement layer toslightlyadjust the riskpreferenceinaccordancewithmacroeconomicsituation;suggested toanalyzecausefornon-performingassetscarefully, treatcausesdifferentlyandcarryoutaccountability, intensify the levelofaccountability foradverse incidentscausedbysubjective factors, sumupexperienceand lessonsand improvesystemofassessment,marketingand riskmanagementsimultaneously,andfurtherstrengthenpropagationandimplementationofriskmanagementsenseandtrainingon riskmanagementskills.For liquidity riskmanagement, thecommitteesuggested to furtherenforce risk
112
managementonmaturitymismatchofwealthmanagementbusiness.Forassetspricing, thecommitteesuggestedtogivereasonableriskpremiumtohigh-riskbusinesstothegreatestextentwithinthepermissionofnationalpolicy,thus toensure the riskcanbecoveredby incomeasawhole.For riskmanagement in thecorebusinessareas,thecommitteesuggestedtopayattention tocreditsituationofcounterparty in time,enforcequalification inspectionof counterpartyandmanagementof businessconcentratedegreewhencarryingout relevantbusiness;makespecifiedstatisticsonnon-performingassetsbydistinguishingpurposesof retailcredit,madeclear the truecauseofincreaseofnon-performingratioandenforcebusinessadmittancecontrolandriskmanagementfromthesource.Forcompliance riskmanagement, thecommitteesuggested topayattention tosupervisorydepartment’spolicyorientationonemergingbusiness,andmakesuretheCompany’scompliantoperation.
(III)TheauditandrelatedpartytransactioncontrolcommitteeTheauditandrelatedpartytransactioncontrolcommitteeperformeddutiesundertheArticlesofAssociationcarefully,promoted theCompany tocontinuously improve financialmanagement, riskmanagementand improve internalcontrol, andplayedaproper role inhelping theboardofdirectors inefficientdecision-making.Thecommitteeenhanced the communicationswithexternal auditors, andasked theauditors toexplain true reasonsbehindtheproblemsdiscovered in financial auditing,andengagedexternalauditors tomakespecificassessmentondevelopmentsituationofenvironmentalfinancialbusiness,and laidgood foundation for the long-termsustainabledevelopmentof thebusiness.Thecommitteeasked theauditor tocomprehensively tease therepeatedemergenceofsomeproblemsdiscovered inauditingand required themtocooperatewith internalauditingdepartment tofindoutthesourceoftheproblemsandimplementrectificationmeasures.Theauditorseriouslyauditedthe2014annualreport,2015 firstquarterly report, interim report,2015 thirdquarterly reportand the financialbudgetplan,highlyappreciatedthebusinessperformanceachievedbytheCompany,andrequiredtheCompanytocontinuetocomplywith thesteadyandcarefulaccountingstandards,enhancebalancesheet,and furthercomplete theaccountinginformation transmissionmechanism,andmakesure theunifystatementof the financialstatementof thewholeBank.Thecommitteeinstructedtocompleteinternalcontrol,maintainthestabilityofassetsquality,andrequiredtofurtherenforcemanagementofITriskandreputationriskarisingthereof,theinformationsafetyshouldberaisedtothestrategylayeroftheBank,especiallyinthetimeofbigdata,cloudcomputing,platformizationandmobileInternet;promotedtheforesightofriskprevention,furthercompletetheriskpre-warningmechanism,analyzedandidentifiedriskbymakingefficientuseofvariouskindof information,anddecidedbusinessorientationandoperationstrategyaccordingly;strictlycontrollednon-performingassetsand regulated theverificationandassignment,optimized theapprovalprocessofcreditreviews,enforcedaccountabilitymanagementandimplementationofrectification; furthercompletednormalauditopinionconductionandrectificationfeedbackmechanism,andmadegooduseofthird-partyauditingstrengthtoregulateoperationmanagementpractically.
(IV)ThenominationcommitteeThenominationcommitteeof theboardofdirectorsearnestlyperformed thedutiesconferredby theArticlesofAssociation,andactively identifiedsuitablecandidates for independentdirectors following theresignation tenderedbysomedirectors,and recommendedMr.ChenYichaoandMr.LinHuaasdirectors to theboardofdirectors forfilling thevacancies,whowerenominatedby theboardofdirectors.Theywereelectedatand theirappointmentswereapprovedby thegeneralmeeting.Theappointments furtheroptimized theprofessionalstructureofmembersoftheboardofdirectors.Throughin-depthreviewsoftheappointmentqualificationsofvicepresidentChenXinjian,thecommitteeconsideredthathisfamiliaritywiththeoverallbusinessoftheBank,experienceondifferentpositions,strongcommunicationskillsandhighoverallbusinessqualitycouldenablehimtofulfillthedutiesofthesecretaryoftheboard,andthereforerecommendedhimtotheboardofdirectorsforappointment.
113
2 0 1 5 ANNUAL REPORT
(V)TheremunerationandevaluationcommitteeThe remunerationandevaluationcommitteeof theboardofdirectors focusedon theCompany’sdevelopmentstrategiesandannualbusiness targets inorder toconductappraisalon thebusinessperformanceof theseniormanagementmembers in 2014 by strictly following the performance appraisal criteria and the assessmentprocedures,andformulatedthe2014PerformanceSalaryDistributionPlanforSeniorManagementMembersandthe2011ProposalonEvaluationandDisbursementRegardingRiskFundforSeniorManagementMembers.Meanwhile,thecommitteemadeconclusiontotheduty-fulfillmentofeachdirector,andcompletedtheduty-fulfillmentevaluationreportofthedirectors.
V.ThedescriptionofrisksdiscoveredbytheboardofsupervisorsDuringthereportingperiod, theboardofsupervisorsmadenoobjectionto the issuesundersupervisionduringthereportingperiod.
VI.Thedescriptionof independenceof theCompany from its largestshareholderTheFinanceBureauofFujianProvince,whichholds17.86%ofthesharesoftheCompany,isthelargestshareholderof theCompany.TheCompany is fully independent from its largestshareholder inallaspects includingassets,personnel,finance,institutionsandbusinesses.ThemajordecisionsoftheCompanyaremadeandexecutedbytheCompanyatitsabsolutediscretion.TheCompany’smajorshareholdershaveneitherappropriatedanycapitaloftheCompanynorrequestedthattheCompanyactasaguarantorforathirdparty.
VII.Theexaminationandevaluationmechanismandtheestablishmentand implementationof the incentivesystem forseniormanagementmembers during the reporting periodTheseniormanagementmembersof theCompanyweresubject to theexaminationandassessmentby theboardofdirectors.Theboardofdirectorsof theCompanyhas formulated theMeasures forPerformanceEvaluationofSeniorManagementMembersandtheAdministrativeMeasuresforRemunerationofSeniorManagementMembers.Byoptimizing the remunerationstructures for theseniormanagementmembers,settingscientificand reasonableevaluationindicatorsandcreatinganevaluationmechanismlinkingtheirremunerationwithresponsibilities,risksandoperatingresults, theseniormanagementmemberswereprovidedwith incentivesandconstraints,soastoensureconsistencybetweenthedirectionoftheireffortsandtheinterestsoftheCompany.
114
VIII.AssessmentreportoninternalcontrolTheCompany’sboardofdirectorshas issuedaself-assessment reporton internal control.Please refer to thewebsiteofShanghaiStockExchangefordetails.Duringthereportingperiod,nomaterialdeficiencieswereidentifiedintheinternalcontrolmechanismsorsystemsoftheCompanyintermsofcompletenessandreasonableness.
IX.DescriptionoftheinternalcontrolauditreportTheCompanyhasdisclosed the internalcontrolaudit report.TheCompanyengagedDeloitteToucheTohmatsuCertifiedPublicAccountantsLLP inauditing theeffectivenessof its internalcontrolwith regard to theCompany’s financial reporting,whichconsideredthat theCompanyhadmaintainedeffective internalcontrol regardingfinancialreporting inallmaterialaspects inaccordancewith theBasic InternalControlNormsforEnterprisesaswellas therelevantprovisionsasatDecember31,2015.
To the Shareholders of Industrial Bank Co., Ltd.We have audited the accompanying financial statements of Industrial Bank Co., Ltd. (the “Bank”), which comprise the Bank’s and consolidated balance sheets as at 31 December 2015, and the Bank’s and consolidated income statements, the Bank’s and consolidated statements of changes in shareholders’ equity and the Bank’s and consolidated cash flow statements for the year ended, and the notes to the financial statements.
1. Management’s responsibility for the financial statementsManagement is responsible for the preparation and fair presentation of these financial statements. The responsibilities include: (1) preparing the financial statements in accordance with Accounting Standards for Business Enterprises to achieve fair presentation of the financial statements; (2) designing, implementing and maintaining internal control which is necessary so enable that the financial statements are free from material misstatements, whether the material misstatements are due to fraud or error.
2. Auditors’ responsibilityOur responsibility is to express an audit opinion on these financial statements based on our auditing work. We conducted our audit in accordance with China Standards on Auditing. China Standards on Auditing requires that we comply with the Code of Ethics for Chinese Certified Public Accountants, planning and performing the audit to obtain reasonable assurance about the fact of whether the financial statements are free from material misstatement.
An audit includes performing audit procedures to obtain audit evidence about the amounts and disclosures in financial statements. The procedures selected are depended on the auditors’ judgment, including the assessment of the risks of material misstatement of the financial statements, whether due to fraud or error. While making those risk assessments, Certified Public Accountants consider the internal controls relevant to the preparation and fair presentation of the financial statements in order to design audit procedures that are appropriate in the circumstances. An audit also includes evaluating the appropriateness of accounting policies used and the reasonableness of accounting estimates made by management, as well as evaluating the overall presentation of the financial statements.
We believe that the audit evidence we have obtained is sufficient and appropriate to provide a basis for our audit opinion.
3. OpinionIn our opinion, the financial statements of the Bank present fairly, in all material respects, the Bank’s and consolidated financial position as of 31 December 2015, and the Bank’s and consolidated results of operations and cash flows for the year then ended in accordance with Accounting Standards for Business Enterprises.
Deloitte Touche Tohmatsu CPA LLP
Shanghai, China
Chinese Certified Public Accountant Shen Xiaohong
Zhang Hua27 April 2016
The auditors’ report and the accompanying financial statements are English translations of the Chinese auditors’ report and statutory financial
statements prepared under accounting principles and practices generally accepted in the People’s Republic of China. These financial statements are
not intended to present the financial position and results of operations in accordance with accounting principles and practices generally accepted in
other countries and jurisdictions. In case the English version does not conform to the Chinese version, the Chinese version prevails.
118
THE BANK’S AND CONSOLIDATED BALANCE SHEETS
UNIT: RMB MILLION
The Group The Bank
Note VIII 12/31/2015 12/31/2014 12/31/2015 12/31/2014
Assets
Cash and balances with Central Bank 1 417,911 491,169 417,854 491,047
Amount due from banks and other financial institutions 2 42,347 100,816 40,032 99,267
Precious metals 42,010 7,543 42,010 7,543
Placements with banks and other financial institutions 3 56,336 51,149 60,552 50,999
Financial assets at fair value through profit or loss 4 128,685 44,435 126,324 43,064
7.Other comprehensive income 47 3,466 6,859 3,466 6,760 Other comprehensive income attributable to equity holders of the Bank 3,471 6,833 3,466 6,760
(1) Items that will be reclassified subsequently to profit or loss: Gains arising from changes in fair value of available-for-sale financial assets 3,750 6,611 3,745 6,538
(2) Items that will not be reclassified subsequently to profit or loss: The movement of net asset or liability arising from remeasurement of defined benefit plan (279) 222 (279) 222
Other comprehensive income attributable to minority interests (5) 26 - -
8.Total comprehensive income 54,116 54,389 51,346 51,926
Total amount attributable to:
Equity holders of the Bank 53,678 53,971 51,346 51,926
Minority interests 438 418 - -
121
2 0 1 5 ANNUAL REPORT
UNIT: RMB MILLIONFOR THE YEAR ENDED 31 DECEMBER 2015
THE BANK’S AND CONSOLIDATED CASH FLOW STATEMENTS
The Group The BankNote VIII 2015 2014 2015 2014
Cash flows from operating activities: Net increase in amount due to customers and due to banks and other financial institutions 713,708 358,039 714,625 358,124
Net decrease in balances with Central Bank and amount due from banks and other financial institutions
65,698 - 65,622 -
Net increase in placements from banks and other financial institutions and financial assets sold under repurchase agreements
- 19,598 - 3,577
Net decrease in placements with banks and other financial institutions and financial assets held under resale agreements
407,618 411,796 403,552 411,734
Net increase in loan from Central Bank 37,700 30,000 37,700 30,000 Cash receipts from interest, fee and commission 184,314 198,976 176,884 193,378 Other cash receipts relating to operating activities 8,623 130,396 2,073 128,683Sub-total of cash inflows from operating activities 1,417,661 1,148,805 1,400,456 1,125,496 Net increase in loans and advances to customers 212,181 247,807 209,952 247,907 Net increase in finance leases 32,367 16,652 - - Net increase in balances with Central Bank and amount due from banks and other financial institutions - 45,552 - 45,614
Net decrease in placements from banks and other financial institutions and financial assets sold under repurchase agreements
27,963 - 54,576 -
Cash payments to interest, fee and commission 120,179 106,620 116,432 103,982 Cash payments to and on behalf of employees 18,602 16,588 17,715 16,162 Cash payments of various types of taxes 29,764 27,074 29,000 25,921 Other cash payments relating to operating activities 157,912 6,452 152,002 6,043Sub-total of cash outflows from operating activities 598,968 466,745 579,677 445,629 Net cash flow from operating activities 48 818,693 682,060 820,779 679,867 Cash flows from investing activities: Cash receipts from recovery of investments 2,280,944 1,284,725 2,015,037 1,105,078 Cash receipts from investment income 106,434 46,039 104,988 45,274 Cash receipts from disposals of fixed assets, intangible assets and other long-term assets
195 115 195 115
Cash receipts from subsidiaries and other operation companies 785 - - - Other cash receipts relating to investing activities - 457 - 457Sub-total of cash inflows from investing activities 2,388,358 1,331,336 2,120,220 1,150,924 Net cash payments to acquire investments 3,459,278 1,892,308 3,189,014 1,705,973 Cash payments for acquisitions of subsidiaries and other business units - - - 3,737 Net cash payments to acquire fixed assets, intangible assets and other long-term assets 5,902 5,263 5,845 5,010
Other cash payments relating to investing activities 1,685 - 1,685 -Sub-total of cash outflows from investing activities 3,466,865 1,897,571 3,196,544 1,714,720Net cash flow from investing activities (1,078,507) (566,235) (1,076,324) (563,796)Cash flows from financing activities: Cash receipts from capital contributions 13,170 14,611 13,000 13,000 Including: cash receipts from capital contributions from minority owners of subsidiary 170 1,411 - - Cash receipts from issue of bonds 586,454 178,979 581,475 178,979Sub-total of cash inflows from financing activities 599,624 193,590 594,475 191,979 Cash repayments of borrowings 363,300 65,919 363,300 65,919 Cash payments for distribution of dividends or profits or settlement of interest expenses 22,203 13,147 22,076 13,254
Including: payments for distribution of dividends to minority owners of subsidiary 81 69 - - Other cash payments relating to financing activities 330 202 53 42 Sub-total of cash outflows from financing activities 385,833 79,268 385,429 79,215Net cash flow from financing activities 213,791 114,322 209,046 112,764Effect of foreign exchange rate changes on cash and cash equivalents 1,247 (140) 1,247 (142)Net increase (decrease) in cash and cash equivalents 48 (44,776) 230,007 (45,252) 228,693Add: Opening balance of cash and cash equivalents 357,128 127,121 355,278 126,585Closing balance of cash and cash equivalents 48 312,352 357,128 310,026 355,278
122
THE
CONS
OLI
DATE
D ST
ATEM
ENT
OF
CHAN
GES
IN S
HARE
HOLD
ERS’
EQ
UITY
UN
IT: R
MB
MIL
LIO
NFO
R T
HE
YE
AR
EN
DE
D 3
1 D
EC
EM
BE
R 2
015
2015
Attr
ibut
able
to s
hare
hold
ers
of th
e B
ank
Not
e V
IIIS
hare
ca
pita
l
Oth
er e
quity
in
stru
men
tsC
apita
l re
serv
e
Oth
er
com
preh
ensi
ve
inco
me
Sur
plus
re
serv
e
Gen
eral
ris
k re
serv
e
Ret
aine
d ea
rnin
gsM
inor
ity
inte
rest
sTo
tal
I. A
s at
1 J
anua
ry 2
015
19,0
5212
,958
50,8
612,
214
9,82
443
,418
119,
607
3,16
226
1,09
6
II. C
hang
es fo
r the
yea
r
(I
) Net
pro
fit-
--
--
-50
,207
443
50,6
50
(I
I) O
ther
com
preh
ensi
ve in
com
e
47-
--
3,47
1-
--
(5)
3,46
6
(I
II) P
urch
ase
incr
ease
--
--
--
-40
40
S
ubto
tal o
f (I)
(II) (
III)
--
-3,
471
--
50,2
0747
854
,156
(I
V) C
apita
l con
tribu
tion
from
sha
reho
lder
s-
12,9
47-
--
--
170
13,1
17
1. C
omm
on s
tock
from
sha
reho
lder
s -
--
--
--
170
170
2. C
apita
l con
tribu
tion
from
oth
er e
quity
in
stru
men
ts h
olde
rs
-12
,947
--
--
--
12,9
47
(V
) Pro
fit d
istri
butio
n-
--
--
17,2
47(2
8,15
8)(8
1)(1
0,99
2)
1. T
rans
fer t
o ge
nera
l ris
k re
serv
e -
--
--
17,2
47(1
7,24
7)-
-
2. D
istri
butio
n of
com
mon
sto
ck d
ivid
ends
-
--
--
-(1
0,86
0)(8
1)(1
0,94
1)
3. D
istri
butio
n of
div
iden
ds o
f pre
ferre
d st
ock
--
--
--
(51)
-(5
1)
III. A
s at
31
Dec
embe
r 201
519
,052
25,9
0550
,861
5,68
59,
824
60,6
6514
1,65
63,
729
317,
377
123
2 0 1 5 ANNUAL REPORT
THE
CONS
OLI
DATE
D ST
ATEM
ENT
OF
CHAN
GES
IN S
HARE
HOLD
ERS’
EQ
UITY
UN
IT: R
MB
MIL
LIO
NFO
R T
HE
YE
AR
EN
DE
D 3
1 D
EC
EM
BE
R 2
015
2014
Attr
ibut
able
to s
hare
hold
ers
of th
e B
ank
Not
e V
IIIS
hare
ca
pita
l
Oth
er e
quity
inst
rum
ents
Cap
ital
rese
rve
Oth
er
com
preh
ensi
vein
com
e
Sur
plus
re
serv
e
G
ener
al
risk
rese
rve
Ret
aine
d ea
rnin
gsM
inor
ityin
tere
sts
Tota
l
I. A
s at
1 J
anua
ry 2
014
19,0
52-
50,8
61(4
,619
)9,
824
32,2
8392
,368
1,40
220
1,17
1
II.C
hang
es fo
r the
yea
r
(I)
Net
pro
fit-
--
--
-47
,138
392
47,5
30
(II
) Oth
er c
ompr
ehen
sive
inco
me
47
--
-6,
833
--
-26
6,
859
S
ubto
tal o
f (I)
(II)
--
-6,
833
--
47,1
3841
854
,389
(II
I) C
apita
l con
tribu
tion
from
sha
reho
lder
s-
12,9
58-
--
--
1,41
114
,369
1. C
omm
on s
tock
from
sha
reho
lder
s-
--
--
- -
1,41
1 1
,411
2. C
apita
l con
tribu
tion
from
oth
er e
quity
in
stru
men
ts h
olde
rs-
12,9
58-
--
- -
-12
,958
(IV
) Pro
fit d
istri
butio
n-
--
--
11,1
35(1
9,89
9)(6
9)(8
,833
)
1. T
rans
fer t
o ge
nera
l ris
k re
serv
e -
--
--
11,1
35(1
1,13
5)-
-
2. D
istri
butio
n of
com
mon
sto
ck d
ivid
ends
--
--
--
(8,7
64)
(69)
(8,8
33)
III. A
s at
31
Dec
embe
r 201
419
,052
12,9
5850
,861
2,21
49,
824
43,4
1811
9,60
73,
162
261,
096
124
THE
BA
NK
’S S
TATE
MEN
T O
F C
HA
NG
ES IN
SH
AR
EHO
LDER
S’ E
QU
ITY U
NIT
: RM
B M
ILLI
ON
FOR
TH
E Y
EA
R E
ND
ED
31
DE
CE
MB
ER
201
5
2015
Not
e V
IIIS
hare
ca
pita
l
O
ther
eq
uity
in
stru
men
ts
Cap
ital
rese
rve
Oth
er
com
preh
ensi
vein
com
e
Sur
plus
re
serv
e
G
ener
al
risk
rese
rve
Ret
aine
d ea
rnin
gs
Tota
l ow
ners
’ eq
uity
I. A
s at
1 J
anua
ry 2
015
19,0
5212
,958
51,0
812,
157
9,82
442
,043
115,
683
252,
798
II. C
hang
es fo
r the
yea
r
(I
) Net
pro
fit-
--
--
-47
,880
47,8
80
(I
I) O
ther
com
preh
ensi
ve in
com
e47
--
-3,
466
--
-3,
466
S
ubto
tal o
f (I)
(II)
--
-3,
466
--
47,8
8051
,346
(I
II) C
apita
l con
tribu
tion
from
ow
ners
-
12,9
47-
--
--
12,9
47
1. C
apita
l con
tribu
tion
from
oth
er e
quity
tool
hol
ders
-
12,9
47-
--
--
12,9
47
(I
V) P
rofit
dis
tribu
tion
--
--
-17
,174
(28,
085)
(10,
911)
1. T
rans
fer t
o ge
nera
l ris
k re
serv
e -
--
--
17,1
74(1
7,17
4)-
2. D
istri
butio
n of
com
mon
sto
ck d
ivid
ends
-
--
--
-(1
0,86
0)(1
0,86
0)
3. D
istri
butio
n of
pre
ferr
ed s
tock
div
iden
ds-
--
--
-(5
1)(5
1)
III. A
s at
31
Dec
embe
r 201
519
,052
25,9
0551
,081
5,62
39,
824
59,2
1713
5,47
830
6,18
0
125
2 0 1 5 ANNUAL REPORT
THE
BA
NK
’S S
TATE
MEN
T O
F C
HA
NG
ES IN
SH
AR
EHO
LDER
S’ E
QU
ITY U
NIT
: RM
B M
ILLI
ON
FOR
TH
E Y
EA
R E
ND
ED
31
DE
CE
MB
ER
201
5
2014
Not
e V
IIIS
hare
ca
pita
l
Oth
er e
quity
inst
rum
ents
Cap
ital
rese
rve
Oth
erco
mpr
ehen
sive
inco
me
Sur
plus
rese
rve
Gen
eral
ris
kre
serv
e
Ret
aine
d ea
rnin
gs
Tota
l ow
ners
’ eq
uity
I. A
s at
1 J
anua
ry 2
014
19,0
52-
51,0
81(4
,603
)9,
824
31,3
2589
,999
196,
678
II. C
hang
es fo
r the
yea
r
(I)
Net
pro
fit-
--
--
-45
,166
45,1
66
(II
) Oth
er c
ompr
ehen
sive
inco
me
47
--
-6,
760
--
-6,
760
Su
btot
al o
f (I)
(II)
--
-6,
760
--
45,1
6651
,926
(II
I) C
apita
l con
tribu
tion
from
sha
reho
lder
s-
12,9
58-
--
--
12,9
58
1. C
apita
l con
tribu
tion
from
oth
er e
quity
tool
hol
ders
-12
,958
--
--
-12
,958
(IV
) Pro
fit d
istri
butio
n-
--
--
10,7
18(1
9,48
2)(8
,764
)
1. T
rans
fer t
o ge
nera
l ris
k re
serv
e-
--
--
10,7
18(1
0,71
8)-
2. D
istri
butio
n of
com
mon
sto
ck d
ivid
ends
--
--
--
(8,7
64)
(8,7
64)
III. A
s at
31
Dec
embe
r 201
419
,052
12,9
5851
,081
2,15
79,
824
42,0
4311
5,68
325
2,79
8
126
NOTES TO THE FINANCIAL STATEMENTS
FOR THE YEAR ENDED 31 DECEMBER 2015
I. GENERAL INFORMATIONIndustrial Bank Co., Ltd. (hereinafter referred to as “the Bank”) which was referred to as Fujian Industrial Bank Co., Ltd. previously, is a stock commercial bank approved by the People’s Bank of China (the “PBOC”), with the document YF [1988] No.347 issued on 20 July, 1988, in accordance with the Application by Fujian Province for Deepening Reform and Opening and Accelerating the Development of Export-oriented Economy (GH [1988] No.58) approved by the State Council. The Bank started trading on Shanghai Stock Exchange on 5 February 2007 with the stock code 601166.
The Bank has obtained its license for carrying out financial activities from China Banking Regulatory Commission (the “CBRC”) with the license number of No. B0013H135010001. The Bank’s business license was approved by Fujian Provincial Administration of Industry and Commerce with the registration number of 350000100009440, the registered address is No.154 Hudong Road, Fuzhou, Fujian Province. The legal representative of the Bank is Mr. Gao Jianping.
The principal activities of the Bank comprise the provision of banking service, which includes accepting deposits from the public; granting short-term, medium-term and long-term loans; domestic and overseas settlement services; issuance of discount and acceptance bills and notes; issuing financial bonds; agency issue and encashment, underwriting and trading of government bonds; trading of government and financial bonds and debentures; agency trading and trading of marketable securities except stock; asset custody business; inter-bank lending and borrowings; sale and purchase of foreign exchange; bank card business; letters of credit and letters of guarantee; remittance and insurance agent services; safety deposit box services; financial advisory services; credit investigation, advisory and attestation services and other banking activities approved by the CBRC.
The principal activities of the Bank’s subsidiaries comprise finance leasing, trust services, fund raising and marketing, asset management for specific clients, asset management, consumer finance, equity investment, industrial investment, investment management and consulting(excluding brokerage); financial consulting, business consulting, enterprise management consulting, financial data processing, commodity futures brokerage, financial futures brokerage, futures investment consulting, economic information consulting service, application software development and operational services, system integration services; other banking activities approved by the CBRC as well as other businesses permitted by China Securities Regulatory Commission.
II. BASIS OF PREPARATION OF FINANCIAL STATEMENTSThe Bank and its subsidiaries (hereinafter referred to as “the Group”) has adopted the Accounting Standards for Business Enterprises (including the standards issued and revised in 2014) (the “ASBE”) issued by the Ministry of Finance of People’s Republic of China (the “MOF”) .
In addition, the Group has disclosed relevant financial information in accordance with Information Disclosure and Presentation Rules for Companies Offering Securities to the Public No.15 - General Provisions on Financial Reporting (Revised in 2014) and the relevant regulations released by the China Securities Regulatory Commission.
The report is prepared on a going concern basis.
III. STATEMENT OF COMPLIANCE WITH THE ASBEThe financial statements of the Bank have been prepared in accordance with ASBE, and present truly and completely, the Bank’s and consolidated financial position as of 31 December,2015, and the Bank’s and consolidated results of operations and cash flows for the year then ended.
127
2 0 1 5 ANNUAL REPORT
IV. SIGNIFICANT ACCOUNTING POLICIES AND ACCOUNTING ESTIMATES1.Accounting periodThe Group has adopted the calendar year as its accounting year, i.e. from 1 January to 31 December.
2.Basic of accounting and principle of measurement The Group has adopted the accrual basis of accounting. Except for certain financial instruments which are measured at fair value, the Group adopts the historical cost as the principle of measurement in the financial statements. Where assets are impaired, provisions for asset impairment are made in accordance with relevant requirements.
Under historical cost, assets are recorded at the amount of cash or cash equivalents paid or the fair value of the consideration given to acquire them at the time of their acquisition. Liabilities are recorded at the amount of proceeds or assets received in exchange for the present obligation, or the amount payable under contract for assuming the present obligation, or at the amount of cash or cash equivalents expected to be paid to satisfy the liability in the normal course of business.
Fair value is the price that would be received to sell an asset or paid to transfer a liability in an orderly transaction between market participants at the measurement date. The measurement and disclosure of fair value in the financial statements are based on the fair value regardless of whether it is directly observable or estimated using valuation technique.
The fair value measurement is categorized into 3 levels subject to the observability of input and the significance of the input to the entire measurement:
- Level 1 inputs are quoted prices (unadjusted) in active markets for identical assets or liabilities that the entity can access at the measurement date.
- Level 2 inputs are inputs other than quoted prices included within Level 1 that are observable for the asset or liability, either directly or indirectly.
-Level 3 inputs are unobservable inputs for the asset or liability.
3.Functional currencyThe Bank and its domestic subsidiaries choose Renminbi (“RMB”) as their functional currency, while its subsidiaries overseas choose their functional currency depends on the primary economic environment in which the subsidiaries operate. The Group adopts RMB to prepare its financial statements.
4. The accounting treatment of business combinations involving enterprises under common control and business combinations not involving enterprises under common control Business combinations are classified into business combinations involving enterprises under common control and business combinations not involving enterprises under common control.
128
4.1 Business combinations involving enterprises under common control
A business combination involving enterprises under common control is a business combination in which all of the combining enterprises are ultimately controlled by the same party or parties both before and after the combination, and that control is not transitory. The Group has no business combination involving enterprises under common control in the reporting period.
4.2 Business combinations not involving enterprises under common control and goodwill
A business combination not involving enterprises under common control is a business combination in which all of the combining enterprises are not ultimately controlled by the same party or parties before and after the combination.
The cost of combination is the aggregation of the fair values, at the acquisition date, of the assets given, liabilities incurred or assumed, and the equity securities issued by the acquirer in exchange for control of the acquire. Where a business combination not involving enterprises under common control is achieved in stages that involve multiple transactions, the cost of combination is the sum of the consideration paid at the acquisition date and the fair value at the acquisition date of the acquirer’s previously held interest in the acquiree. The intermediary expenses incurred by the acquirer in respect of auditing, legal services, valuation and consultancy services, etc. and other associated administrative expenses attributable to the business combination are recognised in profit or loss when they are incurred.
The acquiree’s identifiable assets, liabilities and contingent liabilities acquired by the acquirer in a business combination that meet the recognition criteria shall be measured at fair value at the acquisition date.
Where the cost of combination exceeds the acquirer’s interest in the fair value of the acquiree’s identifiable net assets, the difference is treated as an asset and recognised as goodwill, which is measured at cost on initial recognition. Where the cost of combination is less than the acquirer’s interest in the fair value of the acquiree’s identifiable net assets, the acquirer firstly reassesses the measurement of the fair values of the acquiree’s identifiable assets, liabilities and contingent liabilities and measurement of the cost of combination. If after that reassessment, the cost of combination is still less than the acquirer’s interest in the fair value of the acquiree’s identifiable net assets, the acquirer recognises the remaining difference immediately in profit or loss for the current period.
Goodwill arising on a business combination is measured at cost less accumulated impairment losses, and is presented separately in the consolidated financial statements. It is tested for impairment at least at the end of each year.
5. Preparation of consolidated financial statementsThe scope of consolidated financial statements is determined on the basis of control. Control refers to the power an investor has over an investee, by virtue of which the investor enjoys variable returns by participating in related activities of the investee, and has the ability to use its power over the investee to influence the amount of its returns. Once the change in relevant facts and circumstances leads to a change in relevant elements involved in the definition of control, the Group will conduct reassessment.
Consolidation of a subsidiary begins when the Group obtains control over the subsidiary and ceases when the Group loses control of subsidiary.
For subsidiaries acquired through a business combination not involving enterprises under common control, their results of operation and cash flows from the acquisition date(the date when control is obtained) are included in the consolidated income statement and consolidated statement of cash flows, as appropriate.
The significant accounting policies and accounting periods adopted by the subsidiaries are determined based on the uniform accounting policies and accounting periods set out by the Bank.
129
2 0 1 5 ANNUAL REPORT
All significant intergroup accounts and transactions between the Bank and its subsidiaries or between subsidiaries are eliminated in full amount on consolidation.
The portion of subsidiaries’ equity that is not attributable to the Bank is treated as minority interests and presented as “minority interests” in the consolidated balance sheet within shareholders’ equity. The portion of net profits or losses of subsidiaries for the period attributable to minority interests is presented as “minority interests” in the consolidated income statement below the “net profit” line item.
When the amount of loss for the period attributable to the minority shareholders of a subsidiary exceeds the minority shareholders’ portion of the opening balance of owners’ equity of the subsidiary, the excess amount are still allocated against minority interests.
Acquisition of minority interests or disposal of interest in a subsidiary that does not result in the loss of control over the subsidiary is accounted for as equity transactions. The carrying amounts of the Bank’s interests and minority interests are adjusted to reflect the changes in their relative interests in the subsidiary. The difference between the amount by which the minority interests are adjusted and the fair value of the consideration paid or received is adjusted to capital reserve. If the capital reserve is not sufficient to absorb the difference, the excess are adjusted against retained earnings.
When the Group loses control over a subsidiary due to disposal of certain equity interest or other reasons, any retained interest is re-measured at its fair value at the date when control is lost. The difference between (i) the aggregate of the consideration received on disposal and the fair value of any retained interest and (ii) the share of the former subsidiary’s net assets cumulatively calculated from the acquisition date according to the original proportion of ownership interest is recognised as investment income in the period in which control is lost. Other comprehensive income associated with investment in the former subsidiary is reclassified to investment income in the period in which control is lost.
Structured entities refers to the entities that voting rights or similar rights do not constitute decisive factors when recognise the controlling party, such as when voting rights are associated with the administration, or related activities are led by the contractual arrangements. Wealth management products, fund, trust fund plans and fund management plans could be used as examples of the structured entities.
6. Recognition criteria of cash and cash equivalentsCash comprises cash on hand and deposits that can be readily withdrawn on demand. Cash equivalents are the Group’s short-term, highly liquid investments that are readily convertible to known amounts of cash and which are subject to an insignificant risk of changes in value.
7. Transactions denominated in foreign currencies and transacting for foreign currency financial statements7.1 Transactions denominated in foreign currencies
A foreign currency transaction is recorded, on initial recognition, by applying the spot exchange rate on the date of the transaction.
At the balance sheet date, foreign currency monetary items are translated into functional currency using the spot exchange rates at the balance sheet date. Exchange differences arising from the differences between the spot exchange rates prevailing at the balance sheet date and those on initial recognition or at the previous balance sheet date are recognised in profit or loss for the period, except that exchange differences arising from changes in the carrying amounts (other than the amortised cost) of available-for-sale monetary items are recognised as other comprehensive income.
130
Involving in business overseas when preparing consolidated financial statements, such as foreign currency monetary items which essentially constitute net investment in a foreign operation, exchange differences arising from changes in exchange rate interests is presented as “foreign currency report translation differences” item in shareholders’ equity and recognized in profit or loss disposal when disposing business overseas.
Foreign currency non-monetary items measured at historical cost are translated to the amounts in functional currency at the spot exchange rates on the dates of the transactions and the amounts in functional currency remain unchanged. Foreign currency non-monetary items measured at fair value are re-translated at the spot exchange rate on the date the fair value is determined. Difference between the re-translated functional currency amount and the original functional currency amount is treated as changes in fair value (including changes of exchange rate) and is recognised in profit and loss or as other comprehensive income.
7.2 Transactions for foreign currency financial statements
When preparing consolidated financial statements, financial statements of overseas operations in foreign currency are translated into financial statements in RMB in the following methods: All assets and liabilities in balance sheet are translated by applying the spot exchange rates at the balance sheet date; shareholders equities except retained earnings are translated by applying the spot exchange rate on the date of the transaction; income statements and items reflecting profit distribution occurred are translated by exchange rates similar with the spot exchange rate on the date of the transaction; remained earnings in the beginning of this yeas equal to the remained earnings after translated in the end of previous year; remained earnings in the end of period are presented as profit distributions after translating; differences between assets and liabilities& shareholders’ equity after translating are presented as “other comprehensive income” in shareholders’ equity.
Cash flow in foreign currency and cash flow of overseas institutions are translated by applying the spot exchange rates at the cash flow occurred date. Affected amount of cash and cash equivalents by exchange rate changes is presented separately as “effect of exchange rate changes on cash and cash equivalents” in the cash flow statement, as an adjustment item.
8.Financial instrumentsFinancial assets and financial liabilities are recognised when the Group becomes a party to the contractual provisions of the instrument. Financial assets and financial liabilities are initially measured at fair value. For financial assets and financial liabilities at fair value through profit or loss, transaction costs are immediately recognised in profit or loss. For other financial assets and financial liabilities, transaction costs are included in their initial recognised amounts.
8.1 Effective interest method
The effective interest method is a method of calculating the amortised cost of a financial asset or a financial liability (or a group of financial assets or financial liabilities) and of allocating the interest income or interest expense over the relevant period, using the effective interest rate. The effective interest rate is the rate that exactly discounts estimated future cash flows through the expected life of the financial asset or financial liability or, where appropriate, a shorter period to the net carrying amount of the financial asset or financial liability.
When calculating the effective interest rate, the Group estimates future cash flows considering all contractual terms of the financial asset or financial liability (without considering future credit losses), and also considers all fees paid or received between the parties to the contract giving rise to the financial asset and financial liability that are an integral part of the effective interest rate, transaction costs, and premiums or discounts, etc.
131
2 0 1 5 ANNUAL REPORT
8.2 Classification, recognition and measurement of financial assets
On initial recognition, the Group’s financial assets are classified into one of the four categories, including financial assets at fair value through profit or loss, held-to-maturity investments, loans and receivables, and available-for-sale financial assets. All regular way purchases or sales of financial assets are recognised and derecognised on a trade date basis.
8.2.1 Financial Assets at Fair Value through Profit or Loss (“FVTPL”)
Financial assets at FVTPL include financial assets held for trading and those assigned as at fair value through profit or loss.
A financial asset is classified as held for trading if one of the following conditions is satisfied: (1) It has been acquired principally for the purpose of selling in the near term or repurchasing; or (2) On initial recognition it is part of a portfolio of identified financial instruments that the Group manages together and there is objective evidence that the Group has a recent actual pattern of short-term profit-taking; or (3) it is a derivative that is not designated and effective hedging instrument, or a financial guarantee contract, or a derivative that is linked to and must be settled by delivery of an unquoted equity instrument (without a quoted price in an active market) whose fair value cannot be reliably measured.
A financial asset is assigned as financial assets at fair value through profit or loss, on initial recognition, if one of the following conditions is satisfied: (1) the recognition could eliminate or significantly reduce profit or loss differences in recognition or measurement due to the difference in measurement basis of financial assets; or (2) It has been stated in formal written document of the Group’s risk management or investment strategy, that managing and evaluating the group of financial assets or financial assets & financial liabilities on the basic of fair value, and reporting it to key management personnel; or (3) The hybrid financial instrument combines financial asset with embedded derivatives.
Financial assets at fair value through profit or loss are subsequently measured at fair value. Any gains or losses arising from changes in the fair value and any dividend or interest income earned on the financial assets are recognised in profit or loss.
8.2.2 Held-to-maturity investments
Held-to-maturity investments are non-derivative financial assets with fixed or determinable payments and fixed maturity dates that the Group’s management has the positive intention and ability to hold to maturity.
Held-to-maturity investments are subsequently measured at amortised cost using the effective interest method. Gain or loss arising from derecognition, impairment or amortisation is recognised in profit or loss.
8.2.3 Loans and receivables
Loans and receivables are non-derivative financial assets with fixed or determinable payments that are not quoted in an active market. Financial assets classified as loans and receivables by the Group include balances with Central Bank, amount due from banks and other financial institutions, placements with banks and other financial institutions, financial assets held under resale agreements, interest receivables, loans and advances to customers, debt securities classified as receivables, finance lease receivables and other receivables etc.
Loans and receivables are subsequently measured at amortised cost using the effective interest method. Gain or loss arising from derecognition, impairment or amortisation is recognised in profit or loss.
132
8.2.4 Available-for-sale financial assets
Available-for-sale financial assets include non-derivative financial assets that are designated on initial recognition as available for sale, and financial assets that are not assigned as financial assets at fair value through profit or loss, loans and receivables or held-to-maturity investments.
Available-for-sale financial assets are subsequently measured at fair value, and gains or losses arising from changes in the fair value are recognised as other comprehensive income and included in the capital reserve, except that impairment losses and exchange differences related to amortised cost of monetary financial assets denominated in foreign currencies are recognised in profit or loss, until the financial assets are derecognised, at which time the gains or losses are released and recognised in profit or loss.
Interests obtained and the dividends declared by the investee during the period in which the available-for-sale financial assets are held, are recognised in interest income and investment gains, respectively.
For investments in equity instruments that do not have a quoted market price in an active market and whose fair value cannot be reliably measured, and derivative financial assets that are linked to and must be settled by delivery of such unquoted equity instruments, they are measured at cost.
8.3 Impairment of financial assets
The Group assesses at each balance sheet date the carrying amounts of financial assets other than those at fair value through profit or loss. If there is objective evidence that a financial asset is impaired, the Group determines the amount of any impairment provision. Objective evidence that a financial asset is impaired is evidence that, arising from one or more events that occurred after the initial recognition of the asset, the estimated future cash flows of the financial asset, which can be reliably measured, have been affected.
Objective evidence that a financial asset is impaired includes the following observable events:
(1) Significant financial difficulty of the issuer or obligor;
(2) A breach of contract by the borrower, such as a default or delinquency in interest or principal payments;
(3) The Group, for economic or legal reasons relating to the borrower’s financial difficulty, granting a concession to the borrower;
(4) It becoming probable that the borrower will enter bankruptcy or other financial reorganisations;
(5) The disappearance of an active market for that financial asset because of financial difficulties of the issuer;
(6) Upon an overall assessment of a group of financial assets, observable data indicates that there is a measurable decrease in the estimated future cash flows from the group of financial assets since the initial recognition of those assets, although the decrease cannot yet be identified with the individual financial assets in the group. Such observable data includes:
- Adverse changes in the payment status of borrower in the group of assets;
- Economic conditions in the country or region of the borrower which may lead to a failure to pay the group of assets;
(7) Significant adverse changes in the technological, market, economic or legal environment in which the issuer operates, indicating that the cost of the investment in the equity instrument may not be recovered by the investor;
(8) A significant or prolonged decline in the fair value of an investment in an equity instrument below its cost. The Group recognize 50% decline or above in the fair value below its cost as significant, and 12-month or above decline below its cost as prolonged;
(9) Other objective evidence indicating there is an impairment of a financial asset.
133
2 0 1 5 ANNUAL REPORT
8.3.1 Impairment of financial assets measured at amortised cost
If financial assets carried at amortised cost are impaired, the carrying amounts of the financial assets are reduced to the present value of estimated future cash flows (excluding future credit losses that have not been incurred) discounted at the financial asset’s original effective interest rate. The amount of reduction is recognised as an impairment loss in profit or loss. If, subsequent to the recognition of an impairment loss on financial assets carried at amortised cost, there is objective evidence of a recovery in value of the financial assets which can be related objectively to an event occurring after the impairment is recognised, the previously recognised impairment loss is reversed. However, the reversal is made to the extent that the carrying amount of the financial asset at the date the impairment is reversed does not exceed what the amortised cost would have been had the impairment not been recognised.
For a financial asset that is individually significant, the Group assesses the asset individually for impairment. For a financial asset that is not individually significant, the Group assesses the asset individually for impairment or includes the asset in a group of financial assets with similar credit risk characteristics and collectively assesses them for impairment. If the Group determines that no objective evidence of impairment exists for an individually assessed financial asset (whether significant or not), it includes the asset in a group of financial assets with similar credit risk characteristics and collectively reassesses them for impairment. Assets for which an impairment loss is individually recognised are not included in a collective assessment of impairment.
8.3.2 Impairment of available-for-sale financial assets
Objective evidence that an available-for-sale financial asset is impaired includes significant or prolonged decline in the fair value of an investment in an equity instrument below its cost. The Group assesses each available-for-sale equity instrument investment individually on balance sheet date. Impairment is indicated when the fair value of an equity instrument is lower than its initial investment cost over 50% (including 50%) or the fair value has been lower than its initial investment cost for over 12 months (including 12 months).
When an available-for-sale financial asset is impaired, the cumulative loss arising from decline in fair value previously recognised directly in other comprehensive income is reclassified from the other comprehensive income to profit or loss. The amount of the cumulative loss that is reclassified from other comprehensive income to profit or loss is the difference between the acquisition cost (net of any principal repayment and amortisation) and the current fair value, less any impairment loss on that financial asset previously recognised in profit or loss.
If, subsequent to the recognition of an impairment loss on available-for-sale financial assets, there is objective evidence of a recovery in value of the financial assets which can be related objectively to an event occurring after the impairment is recognised, the previously recognised impairment loss is reversed. The amount of reversal of impairment loss on available-for-sale equity instruments is recognised as other comprehensive income, while the amount of reversal of impairment loss on available-for-sale debt instruments is recognised in profit or loss.
8.3.3 Impairment of financial assets measured at cost
If an impairment loss has been incurred on an investment in unquoted equity instrument (without a quoted price in an active market) whose fair value cannot be reliably measured, or on a derivative financial asset that is linked to and must be settled by delivery of such an unquoted equity instrument, the carrying amount of the financial asset is reduced to the present value of estimated future cash flows discounted at the current market rate of return for a similar financial asset. The amount of reduction is recognised as an impairment loss in profit or loss. The impairment loss on such financial asset is not reversed once it is recognised.
134
8.4 Transfer of financial assets and derecognition of financial assets
The Group’s financial assets transfer if both of the following conditions are satisfied:
(1) Contractual rights to receive cash flow of the financial asset has been transferred; or
(2) Although the financial asset has been transferred, the Group keeps the contractual rights to receive cash flow of the financial asset and undertake the obligation to pay the received cash flow to the final transferee, and if the following conditions are satisfied simultaneously:
• The Group has the obligation to pay to the final recipient when receiving peer cash flow from the financial asset. It’s deemed to satisfy this condition when the Group pays short-term advances, but it is entitled to recover the full amount of the advances and receive interest accrued in accordance with the market interest rate of bank loan.
• According to the contract, the financial asset could not be sold or as collateral, but it could be offered as guarantee for paying cash flow to the final recipient.
• The Group has the obligation to pay the received cash flow to the final recipient. The Group is not entitled to reinvest with the cash flow, except for the investment in cash or cash equivalent in accordance with the contract during the interval between two consecutive payments. If the Group reinvests according to the contract, it should pay the investment income to the final recipient in accordance with the provisions of the contract.
The Group derecognises a financial asset if one of the following conditions is satisfied:
(1) The contractual rights to the cash flows from the financial asset expire; or
(2) The financial asset has been transferred, and if one of the following conditions is satisfied:
• All the risks and rewards of ownership of the financial asset is transferred to the transferee; or
• Although the financial asset has been transferred, the Group neither transfers nor retains substantially all the risks and rewards of ownership of the financial asset but has not retained control of the financial asset.
If the Group neither transfers nor retains substantially all the risks and rewards of ownership of a financial asset, and it retains control of the financial asset, it recognises the financial asset to the extent of its continuing involvement in the transferred financial asset.
For a transfer of a financial asset that satisfies the derecognition criteria, the difference between (1) the carrying amount of the financial asset transferred; and (2) the sum of the consideration received from the transfer and any cumulative gain or loss that has been recognised in other comprehensive income, is recognised in profit or loss.
8.5 Asset-backed securities business
The Group securitises a portion of assets by selling these assets to structured entities, and then issue securities to its investors. Conditions of derecognising the relevant financial assets refer to Note IV 8.4. When applying the derecognising conditions of financial assets, the Group has already taken into account the extent of transfer of the risks and rewards of those assets transferred to the other structured entity, as well as the extent of control over such entity by the Group. If the derecognising conditions of securities are not satisfied, the related financial assets are not derecognised, but the funds raising from third party investors will be treated as financial liabilities.
8.6 Classification, recognition and measurement of financial liabilities
The Group recognises a financial liability if one of the following conditions is satisfied: (1) Contractual obligations to deliver cash or other financial assets to other parties. Or (2) Contractual obligations to exchange financial assets
135
2 0 1 5 ANNUAL REPORT
or financial liabilities with other parties under potential adverse conditions. Or (3) Non-derivative contracts provide the Group shall or may measure business with its own equity instruments in the future, and will deliver a variable number of its own equity instruments. Or (4) Derivative contracts provide the Group shall or may settle business with its own equity instruments in the future, except for the derivative contracts deliver a fixed number of its own equity instruments to exchange a fixed amount of cash or other financial assets.
At initial recognition, the Group classified financial instrument as financial liabilities or equity instruments according to the contractual terms of issued financial instruments and the reflected economic substance rather than its legal form only, combining with the definition of financial liabilities and equity instruments.
On initial recognition, financial liabilities are classified into financial liabilities at fair value through profit or loss and other financial liabilities.
8.6.1 Financial liabilities at fair value through profit or loss
Financial liabilities at FVTPL consist of financial liabilities held for trading and those assigned as at FVTPL on initial recognition.
A financial liability is classified as held for trading if one of the following conditions is satisfied: (1) It has been acquired principally for the purpose of repurchasing in the near term; or (2) On initial recognition it is part of a portfolio of identified financial instruments that the Group manages together and there is objective evidence that the Group has a recent actual pattern of short-term profit-taking; or (3) It is a derivative, except for a derivative that is a designated as effective hedging instrument, or a financial guarantee contract, or a derivative that is linked to and must be settled by delivery of an unquoted equity instrument (without a quoted price in an active market) whose fair value cannot be reliably measured.
A financial liability is assigned as financial assets at fair value through profit or loss, on initial recognition, if one of the following conditions is satisfied: (1) the recognition could eliminate or significantly reduce profit or loss differences in recognition or measurement due to the difference in measurement basis of financial liability; or (2) It has been stated in formal written document of the Group’s risk management or investment strategy, that managing and evaluating the group of financial liabilities or financial assets & financial liabilities on the basic of fair value, and reporting it to key management personnel; or (3) The hybrid financial instrument combines financial asset with embedded derivatives.
Financial liabilities at FVTPL are subsequently measured at fair value. Any gains or losses arising from changes in the fair value or any dividend or interest expenses related to the financial liabilities are recognised in profit or loss.
8.6.2 Other financial liabilities
For a derivative liability that is linked to and must be settled by delivery of an unquoted equity instrument (without a quoted price in an active market) whose fair value cannot be reliably measured, it is subsequently measured at cost. Other financial liabilities except those arising from financial guarantee contracts or loan commitments are subsequently measured at amortised cost using the effective interest method, with gain or loss arising from derecognition or amortisation recognised in profit or loss.
8.6.3 Financial guarantee contracts and loan commitments
A financial guarantee contract is a contract by which the guarantor and the lender agree that the guarantor would settle the debts or bear obligations in accordance with terms of the contract in case the borrower fails to settle the debts. Financial guarantee contracts that are not assigned as financial liabilities at fair value through profit or loss, or loan commitments to provide a loan at a below-market interest rate, which are not designated at fair value through profit or loss, are initially measured at their fair values less the directly attributable transaction costs. Subsequent
136
to initial recognition, they are measured at the higher of: (i) the amount determined in accordance with Accounting Standard for Business Enterprises No. 13 – Contingencies; and (ii) the amount initially recognised less cumulative amortisation recognised in accordance with the principles set out in Accounting Standard for Business Enterprises No. 14 – Revenue.
8.7 Derecognition of financial liabilities
The Group derecognises a financial liability (or part of it) only when the underlying present obligation (or part of it) is discharged. An agreement between the Group (an existing borrower) and an existing lender to replace the original financial liability with a new financial liability with substantially different terms is accounted for as an extinguishment of the original financial liability and the recognition of a new financial liability.
When the Group derecognises a financial liability or a part of it, it recognises the difference between the carrying amount of the financial liability (or part of the financial liability) derecognised and the consideration paid (including any non-cash assets transferred or new financial liabilities assumed) in profit or loss.
8.8 Derivatives and embedded derivatives
Derivative financial instruments include forward exchange contracts, currency swaps, debenture income swaps, interest rate swaps and foreign exchange options, etc. Derivatives are initially measured at fair value at the date when the derivative contracts are entered into and are subsequently re-measured at fair value. The resulting gain or loss is recognized in profit or loss.
An embedded derivative is separated from the hybrid instrument, where the hybrid instrument is not assigned as a financial asset or financial liability at fair value through profit or loss, and treated as a standalone derivative if 1) the economic characteristics and risks of the embedded derivative are not closely related to the economic characteristics and risks of the host contract; and 2) a separate instrument with the same terms as the embedded derivative would meet the definition of a derivative. If the Group is unable to measure the embedded derivative separately either at acquisition or at a subsequent balance sheet date, it assigns the entire hybrid instrument as a financial asset or financial liability at fair value through profit or loss.
8.9 Offsetting financial assets and financial liabilities
Where the Group has a legal right that is currently enforceable to set off the recognised financial assets and financial liabilities, and intends either to settle on a net basis, or to realise the financial asset and settle the financial liability simultaneously, a financial asset and a financial liability shall be offset and the net amount is presented in the balance sheet. Except for the above circumstances, financial assets and financial liabilities shall be presented separately in the balance sheet and shall not be offset.
8.10 Equity instruments
An equity instrument is any contract that evidences a residual interest in the assets of the Group after deducting all of its liabilities. The Group classified financial instruments as equity instruments when all of the following conditions is satisfied: (1) the financial instruments should not include contractual obligations to deliver cash or other financial assets to other parties or to exchange financial assets or financial liabilities with other parties under potential adverse conditions; and (2) the Group shall or may measure business with its own equity instruments in the future. If it is a non-derivative instrument, contractual obligations settled by delivering its own variable equity instruments shall not be included; if it is a derivative instrument, the Group can settle the financial instrument only through exchanging fixed amount of cash or other financial assets with fixed amount of its own equity instruments. Equity instruments issued
137
2 0 1 5 ANNUAL REPORT
(including refinanced), repurchased, sold and written off by the Group are recognized as changes of equity. Change of fair value of equity instruments is not recognized by the Group. Transaction costs related to equity transaction are deducted from equity.
The Group recognizes the distribution to holders of the equity instruments as distribution of profits, and dividends paid do not affect total amount of shareholders equity.
9. Precious metalNon-trading precious metal of the Group is initially measured at cost at acquisition, and subsequently re-measured at the lower of cost and realizable value. Trading precious metal of the Group is initially measured and subsequently re-measured at fair value. The change in fair value arising from re-measurement is recognised in profit or loss.
10. Long-term equity investments10.1 Determination of joint control or significant influence over investee
Control refers to the power an investor has over an investee, by virtue of which the investor enjoys variable returns by participating in related activities of the investee, and has the ability to use its power over the investee to influence the amount of its returns. Joint control is the contractually agreed sharing of control of an arrangement, which exists only when decisions about the relevant activities require unanimous consent of the parties sharing control. Significant influence is the power to participate in the financial and operating policy decisions of the investee but is not control or joint control over those policies. When determining whether an investing enterprise is able to exercise control or significant influence over an investee, the effect of potential voting rights of the investee (for example, warrants and convertible debts) held by the investing enterprises or other parties that are currently exercisable or convertible shall be considered.
10.2 Determination of initial investment cost
For the acquisition of long-term equity investments involving enterprises under the common control, the Group measures the initial cost of the long-term equity investment as the share of the carrying amount of the owner’s equity of the acquired enterprise at that date. The difference between the initial costs of the long-term equity investment and cash paid or non-cash assets transferred as well as the carrying amount of the debts borne by the Group shall offset against the capital reserve. If the capital reserve is insufficient to observe the difference, the retained earnings shall be adjusted. The investment cost which adopts the equity securities issued as the consideration should be adopted as the initial investment cost of the long-term equity investment according to the proportion book value of combined party’s shareholder equity in the consolidated financial statement of the final controlling part, and adjust the capital reserves by the difference between the initial investment cost of long-term equity investment and the amount of issued stock’s face value, which is regarded as capital stock. If the capital reserves are insufficient to absorb the difference, retained income should be adjusted. For the acquisition of enterprises under the common control through several steps of trading, it should be confirmed whether it’s a package deal. If it is, these deals should be measured as one acquiring-control deal. If not, the Group measures the initial cost of the long-term equity investment as the share of the book value of the owner’s equity of the acquired enterprise at that date. The difference between the initial costs of the long-term equity investment and the book value of long-term equity investment before acquiring control as well as the carrying amount of the debts for more shares on the acquisition date shall offset against the capital reserve. If the capital reserve is insufficient to absorb the difference, the retained earnings shall be adjusted.
For a long-term equity investment acquired through business combination not involving enterprises under common control, the investment cost of the long-term equity investment is the cost of acquisition on the acquisition date. For
138
the acquisition of enterprises under the common control through several steps of trading, it should be confirmed whether it’s a package deal. If it is, these deals should be measured as one acquiring-control deal. If not, the book value of long-term equity investment before acquiring control and the cost of new investment is the cost of acquisition measured under cost method.
Acquisition-related costs including auditing fees, legal services fees, valuation advice fees and other relevant management fees are generally recognised in profit or loss as incurred.
Long-term equity investments other than those arising from business combination, is initially measured at cost. When the Group increases its ownership interest in the investee to the extent that the Group has joint control or significant influence, but not control, over the investee, the cost of the long-term equity investment is the aggregation of fair value of its prior ownership interest recognized in accordance with the Accounting Standards for Enterprises No. 22 - Recognition and Measurement of Financial Instruments and the additional investment cost at that date.
10.3 Subsequent measurement and recognition of profit or loss
10.3.1 Long-term equity investment accounted for using the cost method
The Bank uses the cost method for the long-term equity investment in subsidiaries in the financial statements. The subsidiary refers to the investee that controlled by the group.
Under the cost method, a long-term equity investment is measured at initial investment cost. Increasing or reducing investment will adjust the cost of long term equity investment accordingly. Investment income is recognised in the period in accordance with the attributable share of cash dividends or profit distributions declared by the investee.
10.3.2 Long-term equity investment accounted for using the equity method
The Group accounts for investment in associates using the equity method. Associates are those that the group is able to exercise significant influence over the investee.
Under the equity method, where the initial investment cost of a long-term equity investment exceeds the Group’s share of the fair value of the investee’s identifiable net assets at the time of acquisition, no adjustment is made to the initial investment cost. Any excess of the Group’s share of the net fair value of the identifiable assets and liabilities over the initial cost of the investment, after reassessment of the long-term equity investment, is recognised immediately in profit or loss in the period in which the investment is acquired.
Under the equity method, the Group recognises investment income and other comprehensive income and simultaneously adjust carrying amount of long-term equity investment based on the Group’s share of net profit or loss and other comprehensive income of the investee; The Group reduces the carrying amount of the investment when being entitled by the attributable share of cash dividends or profit distributions declared by the investee; When the change of its ownership interest in the investee is not caused by the change of the net profits and losses, other comprehensive and profit distribution, the Group adjusted carrying amount of its long-term equity investment and recognized in other comprehensive income. After adjustment being based on the fair value of all identifiable assets of the invested entity when it obtains the investment, the Group recognises the attributable share of the net profits and losses of the investee after adjustment. When the accounting policy and accounting period adopted by the investee is different from that adopted by the Group, the adjustments are made to the financial statements of investees to bring their accounting policies into line with the Group’s accounting policies, then the Group recognizes investment gain and other comprehensive income accordingly. All intragroup transactions, investment or sale of the asset not constituting a business are eliminated by the proportion of shares and recognized investment income accordingly. Unrealized profits or losses resulting from the Group’s transactions with its associates are recognized as investment income or loss to the extent that those attributable to the Group’s equity interest are eliminated. Unrecognized intragroup transaction loss between the Group and investees is not allowed for offset, when it is arising from the
139
2 0 1 5 ANNUAL REPORT
impairment loss of transferred asset.
The Group discontinues recognising its share of net losses of the investee after the carrying amount of the long-term equity investment together with any long-term interests that in substance form part of its net investment in the investee is reduced to zero. If the Group has incurred obligations to assume additional losses of the investee, a provision is recognized according to the expected obligation, and recorded as investment loss for the period. Where net profits are subsequently made by the investee, the Group resumes recognising its share of those profits only after its share of the profits exceeds the share of losses previously not recognised.
10.3.3 Disposal of long-term equity investments
On disposal of a long term equity investment, the difference between the proceeds actually received and the carrying amount is recognised in profit or loss for the period. When the Group reduces its ownership interest in investee but the Group continues to use the equity method, the Group reclassifies to profit or loss the proportion of the gain or loss that had previously been recognised in other comprehensive income relating to that reduction in ownership interest if that gain or loss would be reclassified to profit or loss on the investee’s disposal of the related assets or liabilities. Then the equity recognized by the Group other than the change of the net profits and loss, other comprehensive income and profit distribution of the invested entity is reclassified to profit and losses on proportion. When the Group reduces its ownership interest but the Group continues to use the cost method, for the other comprehensive income recognized by the Group using equity method prior to the control over the investee or under financial instrument recognition and measurement standard, the Group reclassifies to profit or loss the proportion of the gain or loss relating to that reduction in ownership interest if that gain or loss would be reclassified to profit or loss on the investee’s disposal of the related assets or liabilities. Then the other changes in owners’’ equity recognized by the Group using equity method, not arising from the change of the net profits and loss, other comprehensive income or profit distribution of the invested entity is reclassified to profit and loss on proportion.
11.Fixed assets11.1 Recognition criteria for fixed assets
Fixed assets are tangible assets that are held for use in the production or supply of goods or services, for rental to others, or for administrative purposes, and have useful lives of more than one accounting year. A fixed asset is recognised only when it is probable that economic benefits associated with the asset will flow to the Group and the cost of the asset can be measured reliably. Fixed assets are initially measured at cost.
Subsequent expenditures incurred for the fixed asset are included in the cost of the fixed asset if it is probable that economic benefits associated with the asset will flow to the Group and the cost can be measured reliably. Meanwhile the carrying amount of the replaced part is derecognised. Other subsequent expenditures are recognised in profit or loss in the period in which they are incurred.
11.2 Depreciation of each category of fixed assets
A fixed asset is depreciated over its useful life using the straight-line method since the month subsequent to the one in which it is ready for intended use. The depreciation period, estimated net residual value rate and annual depreciation rate of each category of fixed assets are as follows:
140
Category Depreciation period Estimated Residual value rate
Annualdepreciation rate
Buildings 20-30 years 0-3% 3.23-5.00%
Fixed assets improvement the lower of improvement period and remaining useful life 0%
Office equipment 3-10 years 0-3% 10.00-33.33%
Transportation vehicles 5-8 years 0-3% 12.50-20.00%
Estimated net residual value of a fixed asset is the estimated amount that the Group would currently obtain from disposal of the asset, after deducting the estimated costs of disposal, if the asset were already of the age and in the condition expected at the end of its useful life.
11.3 Other explanations
If a fixed asset is upon disposal or no future economic benefits are expected to be generated from its use or disposal, the fixed asset is derecognised. When a fixed asset is sold, transferred, retired or damaged, the amount of any proceeds on disposal of the asset net of the carrying amount and related taxes is recognised in profit or loss for the period.
The Group reviews the useful life and estimated net residual value rate of a fixed asset and the depreciation method applied at least once at each financial year-end, and accounts for any change as a change in an accounting estimate.
12. Construction in progressConstruction in progress is measured at its actual costs. The actual costs include various construction expenditures during the construction period and other relevant costs. Construction in progress is not depreciated. Construction in progress is transferred to a fixed asset or other asset when it is ready for intended use.
13.Intangible assets13.1 Intangible assets
Intangible assets include land use rights, franchising, etc.
An intangible asset is measured initially at cost. Expenses related to the intangible assets are recognised in the cost of intangible assets when (i) it is probable that the associated economic benefits will flow to the Group; and (ii) the associated costs can be measured reliably. Other expenses related to the intangible assets are recognized in profit or loss for the period in which it is incurred.
The acquired land use right is recognized as intangible assets. Expenses related to land use right and construction cost from buildings such as self-built factory, etc. are recognized as intangible assets and fixed assets, respectively. In the case of purchased buildings, it allocates related cost between land use right and buildings. If related cost cannot be allocated reasonably, it is recognized as fixed assets.
When an intangible asset with a finite useful life is available for use, its original cost is amortised over its estimated useful life using the straight-line method. An intangible asset with an indefinite useful life is not amortised.
For an intangible asset with a finite useful life, the Group reviews the useful life and amortisation method at the end of the period, and accounts for any change as a change in an accounting estimate. For an intangible asset with an infinite useful life, the Group reviews the useful life. If there is evidence the duration of associated economic benefits is predictable, then estimate the useful life and amortize the intangible assets according to related amortization method.
141
2 0 1 5 ANNUAL REPORT
14. Impairment of long-term assetsThe Group checks whether long-term equity investment, fixed assets, construction in progress, and intangible assets with a finite useful life will impair in every balance sheet date. If the indication of impairment of these assets exists, the Group estimates their recovery amount. For those intangible assets with infinite useful life or not ready for its intended use, test of impairment should be conducted each year no matter whether indication of impairment exists or not.
Estimation of recovery amount of the assets is based on individual asset. If the recovery amount is difficult to estimate, the amount should be estimated by the asset group which the asset belongs to. Recovery amount is the higher of the two: net fair value of the assets or assets groups after disposal expenses, or present value of the expected cash flow from the assets.
If asset’s recovery amount is lower than its book value, the provision for asset impairment should be recognized by their balance in profit or loss for the period.
The goodwill should be tested of impairment at least in the end of the each year with related assets groups or combination of assets groups. In purchase date, the book value of goodwill should be allocated reasonably to assets groups or combinations which can benefit from the synergy of enterprise merger. If the recovery amount of assets groups or combinations of allocated goodwill is lower than its book value, impairment loss should be recognized. The amount of impairment loss should offset the book value which is allocated to the goodwill of certain assets groups or combinations at first, then it should offset the book value of other assets proportionally according to the proportion of other assets’ book value of assets groups or combination after goodwill.
The impairment losses cannot be reversed once they are recognized.
15. Long-term prepaid expensesLong-term prepaid expenses represent expenses incurred that should be borne and amortised over the current and subsequent periods (together of more than one year). Long-term prepaid expenses are amortised using the straight-line method over the expected periods in which benefits are derived.
16. Employee benefits16.1 Accounting method of short-term employee benefits
In an accounting period in which an employee has rendered service to the Group, the Group recognises the short-term employee benefits for that service as a liability, and expenditure actually incurred is included profit or loss for the period in which they are incurred. The employee’s welfare incurred is recognized in the profit or loss for the period. The employee’s benefit is non-monetary and recorded at fair value.
In the accounting period the related service is rendered by employees, the Group shall calculate the medical insurance, work injury insurance, maternity insurance and other social insurances, as well as housing fund, union funds and staff education fund, which are paid by the enterprise to the employee, on the basis of a certain proportion in the total amount of wages, recognize the liability accordingly and record in the profit and loss of current period.
16.2 Accounting method of post-employment benefits
Termination benefits are classified to defined contribution pension plans and defined benefit plans.
Payments to defined contribution pension plans are recognized as an expense when employees have rendered services entitling them to the contributions.
142
Pension obligation from defined benefit plans are classified and recorded in profit and loss when employees have rendered services entitling them to the contribution. The classifications of the costs are as follows:
• Service costs (including service costs of the period, service costs in the past, and profit and loss).
• Net value of interests from net liabilities or net assets of defined benefit plans (including interest income of planned assets, obligated interest cost of defined benefit plans and interest of influence of assets upper limit).
• The changes of recalculating the net liabilities and net assets of defined benefit plans.
Net interests of service costs and net liabilities and net assets of defined benefit plans are recorded in the profit and loss. The changes of recalculating the net liabilities and net assets of defined benefit plans, including actuarial gains or loss, planned assets yield deducting net value of interests from net liabilities or net assets of defined benefit plans, change rising from upper limit of assets deducting net value of interests from net liabilities or net assets of defined, are recorded in other comprehensive income.
The difference between the present value of defined benefit obligation and the fair value of defined benefit asset is recognized as a net asset or liability of defined benefit plans. If there is surplus, the net assets of defined benefit plans should be measured by the lower of the two: 1. the surplus of defined benefit plans; 2. upper limit of assets.
16.3 Accounting method of termination benefits
In an accounting period in which an employee has rendered service to the Group, a liability for a termination benefit and an expense accordingly are recognized at the earlier of when the Company entity can no longer withdraw the offer of the termination benefit and when the entity recognizes any related restructuring costs.
17. Assets transferred under repurchase agreements17.1 Financial assets purchased under resale agreements
Financial assets that have been purchased under agreements with a commitment to resell at a specific future date and price are not recognised in the balance sheet. The cost of purchasing such assets is presented under “financial assets purchased under resale agreements” in the balance sheet. The difference between the purchasing price and reselling price is recognised as interest income during the term of the agreement using the effective interest method.
17.2 Financial assets sold under repurchase agreements
Financial assets sold subject to agreements with a commitment to repurchase at a specific future date and price are not derecognised in the balance sheet. The proceeds from selling such assets are presented under “financial assets sold under repurchase agreements” in the balance sheet. The difference between the selling price and repurchasing price is recognised as interest expense during the term of the agreement using the effective interest method.
18. ProvisionsProvisions are recognised when the Group has a present obligation related to a contingency, it is probable that an outflow of economic benefits will be required to settle the obligation, and the amount of the obligation can be measured reliably.
The amount recognised as a provision is the best estimate of the consideration required to settle the present obligation at the balance sheet date, taking into account factors pertaining to a contingency such as the risks,
143
2 0 1 5 ANNUAL REPORT
uncertainties and time value of money. Where the effect of the time value of money is material, the amount of the provision is determined by discounting the related future cash outflows.
Where all or some of the expenditure required to settle a provision is expected to be reimbursed by a third party, the reimbursement is recognised as a separate asset only when it is virtually certain that reimbursement will be received, and the amount of reimbursement recognised does not exceed the carrying amount of the provision.
19. Interest income and expenseInterest income and expense is carried at amortized cost of related financial assets and liabilities using the effective interest method, and recognized in profit or loss. If the difference between effective interest and contract interest is an insignificant amount, contract interest also can be applied.
20. Fee and commission incomeFee and commission income is recognized on accrual basis when providing related service.
21. Government grantsGovernment grants are transfer of monetary assets and non-monetary assets from the government to the Group at no consideration, except the capital from the government as the owner. A government grant is recognised only when the Group can comply with the conditions attaching to the grant and the Group will receive the grant.
If a government grant is in the form of a transfer of a monetary asset, it is measured at the amount received or receivable. If a government grant is in the form of a non-monetary asset, it is measured at fair value. If the fair value cannot be reliably determined, it is measured at a nominal amount. A government grant measured at a nominal amount is recognised immediately in profit or loss for the period. Government grants are classified into government grants related to assets and government grants related to income according the subjects required by the Government documents.
A government grant related to an asset is recognised as deferred income, and evenly amortised to profit or loss over the useful life of the related asset. For a government grant related to income, if the grant is a compensation for related expenses or losses to be incurred in subsequent periods, the grant is recognised as deferred income, and recognised in profit or loss over the periods in which the related costs are recognised. If the grant is a compensation for related expenses or losses already incurred, the grant is recognised immediately in profit or loss for the period.
For repayment of a government grant already recognised, if there is related deferred income, the repayment is offset against the carrying amount of the deferred income, and any excess is recognised in profit or loss for the period. If there is no related deferred income, the repayment is recognised immediately in profit or loss for the period.
22. Deferred tax assets/deferred tax liabilitiesThe income tax expenses include current income tax and deferred income tax.
22.1 Current income tax
At the balance sheet date, current income tax liabilities (or assets) for the current and prior periods are measured at the amount expected to be paid (or recovered) according to the requirements of tax laws.
144
22.2 Deferred tax assets and deferred tax liabilities
For temporary differences between the carrying amounts of certain assets or liabilities and their tax base, or between the nil carrying amount of those items that are not recognised as assets or liabilities and their tax base that can be determined according to tax laws, deferred tax assets and liabilities are recognised using the balance sheet liability method.
Deferred tax is generally recognised for all temporary differences. Deferred tax assets for deductible temporary differences are recognised to the extent that it is probable that taxable profits will be available against which the deductible temporary differences can be utilised. However, for temporary differences associated with the initial recognition of goodwill and the initial recognition of an asset or liability arising from a transaction (not a business combination) that affects neither the accounting profit nor taxable profits (or deductible losses) at the time of transaction, no deferred tax asset or liability is recognised.
For deductible losses and tax credits that can be carried forward, deferred tax assets are recognised to the extent that it is probable that future taxable profits will be available against which the deductible losses and tax credits can be utilised.
Deferred tax liabilities are recognised for taxable temporary differences associated with investments in subsidiaries and associates, except where the Group is able to control the timing of the reversal of the temporary difference and it is probable that the temporary difference will not reverse in the foreseeable future. Deferred tax assets arising from deductible temporary differences associated with such investments and interests are only recognised to the extent that it is probable that there will be taxable profits against which to utilise the benefits of the temporary differences and they are expected to reverse in the foreseeable future. At the balance sheet date, deferred tax assets and liabilities are measured at the tax rates, according to tax laws, that are expected to apply in the period in which the asset is realised or the liability is settled.
Current and deferred tax expenses or income are recognised in profit or loss for the period, except when they arise from transactions or events that are directly recognised in other comprehensive income or in shareholders’ equity, in which case they are recognised in other comprehensive income or in shareholders’ equity; and when they arise from business combinations, in which case they adjust the carrying amount of goodwill.
At the balance sheet date, the carrying amount of deferred tax assets is reviewed and reduced if it is no longer probable that sufficient taxable profits will be available in the future to allow the benefit of deferred tax assets to be utilised. Such reduction in amount is reversed when it becomes probable that sufficient taxable profits will be available.
When the Group has a legal right to settle on a net basis and intends either to settle on a net basis or to realise the assets and settle the liabilities simultaneously, current tax assets and current tax liabilities are offset and presented on a net basis.
When the Group has a legal right to settle current tax assets and liabilities on a net basis, and deferred tax assets and deferred tax liabilities relate to income taxes levied by the same taxation authority on either the same taxable entity or different taxable entities which intend either to settle current tax assets and liabilities on a net basis or to realise the assets and liabilities simultaneously, in each future period in which significant amounts of deferred tax assets or liabilities are expected to be reversed, deferred tax assets and deferred tax liabilities are offset and presented on a net basis.
23. Fiduciary activitiesThe Group acts in a fiduciary capacity as a custodian, trustee or an agent for customers. Customers should bear the risk and return generated by such activities. The Group only charges fee and commission. Assets held by the Group and the related undertakings to return such assets to customers are excluded from the financial statements.
145
2 0 1 5 ANNUAL REPORT
24. LeaseLeases are classified as finance leases whenever the terms of the lease transfer substantially all the risks and rewards of ownership to the lessee. All other leases are classified as operating leases.
The Group as lessee under operating leases
Operating lease payments are recognised on a straight-line basis over the term of the relevant lease, and are either included in the cost of related asset or charged to profit or loss for the period. Initial direct costs incurred are charged to profit or loss for the period. Contingent rents are charged to profit or loss in the period in which they are actually incurred.
The Group as lessor under operating leases
Rental income from operating leases is recognized in profit or loss on a straight-line basis over the term of the relevant lease. Initial direct costs with more than an insignificant amount are capitalized when incurred, and are recognized in profit or loss on the same basis as rental income over the lease term. Other initial direct costs with an insignificant amount are charged to profit or loss in the period in which they are incurred. Contingent rents are charged to profit or loss in the period in which they actually arise.
The Group as lessor under finance leases
At the commencement of the lease term, the aggregate of the minimum lease receivable at the inception of the lease and the initial direct costs is recognised as a finance lease receivable, and the unguaranteed residual value is recorded at the same time. The difference between the aggregate of the minimum lease receivable, the initial direct costs and the unguaranteed residual value, and the aggregate of their present values is recognised as unearned finance income. The net amount of financial lease receivables less unearned finance income is listed in “financial lease receivables” for presentation.
Unearned finance income is recognised as finance income for the period using the effective interest method over the lease term. Contingent rents are credited to profit or loss in the period in which they are actually incurred.
25.Other significant accounting policies and accounting estimatesForeclosed asset
Foreclosed asset is initially measured at its fair value. At the balance sheet date, foreclosed asset is measured at the lower of carrying amount and net realizable value. The difference by which the net realizable value is lower than the carrying amount of the assets shall be provided for the current period.
On disposal of a foreclosed asset, the difference between (i) income from disposal and (ii) the carrying amount of the foreclosed asset is charged to non-operating income or expense.
If the foreclosed asset is transferred for self-use, it should be measured at the carrying amount at the transfer date. Provision is to taken into account if applicable.
146
V. CRITICAL ACCOUNTING JUDGEMENTS AND KEY ASSUMPTIONS AND UNCERTAINTYIn the application of the Group’s accounting policies, which are described in Note IV, the management is required to make judgements, estimates and assumptions about the carrying amounts of assets and liabilities that are not readily apparent from other sources. The estimates and associated assumptions are based on historical experience and other factors that are considered to be relevant. Actual results may differ from these estimates.
The estimates and underlying assumptions are reviewed on an ongoing basis. Revisions to accounting estimates are recognized in the period in which the estimate is revised if the revision affects only that period or in the period of the revision and future periods if the revision affects both current and future periods.
The following are the critical judgements and key estimation uncertainty that the Group has made at the balance sheet date.
1. Impairment on loans and advances to customersThe Group reviews its loan portfolio to assess impairment on a periodic basis. In determining whether an impairment loss should be recognized in profit or loss, the Group makes judgments as to whether there is any observable data indicating that there is an objective evidence of impairment which will have a measurable decrease in the estimated future cash flows from a portfolio of loans and advances. When the decrease may not have been identified individually or the individual loan is not significant, management uses estimates based on historical loss experience on a collective basis with similar credit risk characteristics to assess the impairment loss while estimating expected future cash flows. The methodology and assumptions used for estimating both the amount and timing of future cash flows are reviewed regularly to reduce any differences between loss estimates and actual loss experience.
2. Fair value of financial instrumentsThe Group uses various valuation techniques for financial instruments which are not quoted in an active market. Valuation techniques include the use of discounted cash flows analysis, option pricing models or other valuation methods as appropriate. To the extent practical, models use only observable data; however areas such as credit risk of the Group and the counterparty, volatilities and correlations require management to make estimates. Changes in assumptions about these factors could affect the estimated fair value of financial instruments.
3. Impairment of available-for-sale financial assetsThe determination of whether an available-for-sale financial asset is impaired requires significant judgement. In making this judgement, the Group evaluates the duration and extent to which the fair value of an investment of equity instrument is less than its cost; and the financial health of and near-term business outlook for the investee, including factors such as industry and sector performance, technology transformation, credit ratings, delinquency rates and counterparty risk etc.
4.Classification of held-to-maturity investmentsThe Group classifies non-derivative financial assets with fixed or determinable payments and fixed maturity that the Group’s management has the positive intention and ability to hold to maturity as held-to-maturity investments. This classification requires significant judgement. In making this judgement, the Group evaluates its intention and ability to hold such investments to maturity. If the Group fails to hold these investments to maturity other than for specific
147
2 0 1 5 ANNUAL REPORT
circumstances (such as selling an insignificant amount close to maturity), it will be required to reclassify the entire portfolio of held-to-maturity investments as available-for-sale financial assets.
5. Impairment of held-to-maturity investments and debt securities classified as receivables The determination of whether a held-to-maturity financial asset or debt securities classified as receivables is impaired requires significant judgement. Objective evidence that a financial asset or group of assets is impaired includes a breach of contract, such as a default or delinquency in interest or principal payments, etc. In making such judgement, the impact of objective evidence for impairment on expected future cash flows of the investment is taken into account.
6. Income taxesThere are certain transactions and activities for which the ultimate tax determination is uncertain during the ordinary course of business. Whether some items can be charged before tax requires assertion from tax authority. Where the final tax outcome of these matters is different from the amounts that were initially estimated, such differences will impact the current income tax and deferred income tax in the period during which such a determination is made.
7. Assessment of consolidated structured entitiesAs the manager of structured entities, the Group should assess whether the Group is the main charger or an agent in order to assess whether the Group has control over the structured entities. Based on the decision scope of asset manager, power of other trust holders, reward from offering management service and the risk exposure of variable profit, the Group assesses whether the Group is main charger or an agent and whether should consolidate the structured entities.
VI. TAXATION1. Enterprise income taxAccording to the Corporate Income Tax Law of the People’s Republic of China, the income tax of domestic branches of the Bank and subsidiaries is calculated and settled at the tax rate of 25%.
The income tax of overseas branches of the Bank is calculated in accordance with the local tax rate, and the difference between the overseas tax rate and domestic tax rate is settled by the head office.
The deductible items of enterprise income tax are in accordance with the relevant regulations. Enterprise income tax is prepaid by domestic branches of the Bank and conducted annual filing by the head office.
2. Business taxBusiness tax of the Bank’s domestic branches and subsidiaries is calculated according to 5% of taxable revenue. Domestic branches and subsidiaries declare and pay the business tax to local tax bureau as required.
3. Value-added tax
148
According to circular of the Ministry of Finance and the State Administration of Taxation on the Inclusion of the Railway Transport Industry and Postal Service Industry in the Pilot Collection of Value-added Tax in Lieu of Business Tax (Caishui[2013] No.106), VAT is applicable to leasing of tangible movable property offered by subsidiaries (tax rate: 17%). VAT is applicable to modern service industry (tax rate: 6%; leasing of tangible movable property is not included).
4. City maintenance and construction taxThe Group’s city maintenance and construction tax is calculated according to 1% ~ 7% of business tax.
5. Education surchargeThe Group’s education surcharge and local education surcharge is calculated according to 3% ~ 5% of business tax.
VII.CONSOLIDATION SCOPE1. Details of the Bank’s principal subsidiaries included in the scope of consolidation are set out as follows:
(1) The Company is invested by China Industrial International Trusts Limited, China Industrial Fund Management Limited, and Huafu Securities invested by China Industrial International Trusts Limited which has no significant influence. The amount of the investment is RMB20 million from each party. The Company was found in June, 2015, registered capital RMB60 million. The Group owns 66.67% shares of the Company with the right of control. Therefore, it should be consolidated.
(2) The companies are the subsidiaries of the Bank’s controlled subsidiaries.
(3) China Industrial International Trusts Limited increase the capital of CIB Guoxin Asset Management Co., Ltd., its wholly-owned subsidiary with RMB200 million (registered capital:RMB300 million after the capital increase) on 8 June 2015. China Industrial International Trusts Limited still owns 100% of its shares.
(4) China Industrial International Trusts Limited bought a stake in Ningbo Shanli Futures Limited in Mar, 2014, owning 29.7% of its shares. In September 2014, approved by the State Administration for Industry and Commerce, the Company changed its name to CIB Futures Co., Ltd. In March 2015, CIIT bought 40.3% shares from other shareholders at RMB104 million to increase its shareholding ratio to 70.00% and then CIB Futures Co., Ltd. became a holding subsidiary of China Industrial International Trusts Limited. In August 2015, CIIT increases RMB381 million capital to CIB Futures Co., Ltd., the capital of which increased from RMB100 million to RMB500 million. The shareholding ratio increased to 92.20%.
2. Information of consolidated structure entities included in the consolidation scope refers to No. VIII 50.
3.Principal items’ exchange rate in the financial statements of overseas operating entitiesThe operating entities of the Group convert the financial statement from foreign currency to RMB based on method: all assets and liabilities in the balance sheet should be converted by spot rate in balance sheet date; equity of shareholders except for the retained earnings should be converted by spot rate when occurs; all subjects in the income statement and subjects which reflect the accrual distributed profit should be converted by approximate spot rate when occurs.
The exchange rate of USD, JPY, EURO, HKD, and GBP to RMB should be determined by the middle rate published by SAFE. The exchange rate of other currency to RMB should be calculated by the benchmark rate of USD to RMB and rate of USD to other currency offered by SAFE.
150
VIII. NOTES TO ITEMS IN THE FINANCIAL STATEMENTS1. Cash and balances with central bank
(1) The domestic institution of the Bank places general deposit reserves mainly with the PBOC as required, including RMB deposit reserves and foreign deposit reserves. These deposit reserves are not available for the Group’s daily operations and can’t be transferred or used without the PBOC’s approval. General deposit generates from organizations deposit, non-financial-budget deposit, individual deposit, enterprise deposit, net trust funds and other deposit. On 31 December, 2015, the ratio of the Bank’s RMB deposit reserves is 15% (31 December, 2014:17.5%), the ratio of foreign deposit reserves is 5% (31 December, 2014:5%). According to related regulations from the PBOC, foreign deposit reserves are non-interest bearing. The Group’s subsidies’ RMB reserve deposit ratio is in accordance with regulations of PBOC. Deposit ratio of statutory reserve in Hong Kong branch is in accordance with regulations from local regulators.
(2) Surplus deposit reserves in Central Bank are maintained with the PBOC mainly for the purpose of clearing, transferring, etc.
(3) The majority of other deposits are the fiscal deposits placed with the Central Bank. Fiscal deposit at Central Bank refers to the fiscal deposit at PBOC by the Bank according to regulations, including the Bank’s agent central budgetary revenues, local treasury deposits, etc. The fiscal deposits placed with the PBOC of institutions in mainland China are non-interest bearing.
151
2 0 1 5 ANNUAL REPORT
2. Amount due from banks and other financial institutionsUNIT: RMB Million
The Group The Bank
12/31/2015 12/31/2014 12/31/2015 12/31/2014
Banks in mainland China 28,082 89,212 25,770 87,685
Other financial institutions in mainland China 1,187 715 1,184 693
Banks outside mainland China 13,099 10,910 13,099 10,910
Subtotal 42,368 100,837 40,053 99,288
Less: Provisions for impairment (21) (21) (21) (21)
Net value 42,347 100,816 40,032 99,267
3. Placements with banks and other financial institutionsUNIT: RMB Million
The Group The Bank
12/31/2015 12/31/2014 12/31/2015 12/31/2014
Banks in mainland China 1,997 10,080 1,997 10,080
Other financial institutions in mainland China 31,103 41,137 35,319 40,987
Overseas financial institutions 23,304 - 23,304 -
Subtotal 56,404 51,217 60,620 51,067
Less: Provisions for impairment (68) (68) (68) (68)
Net value 56,336 51,149 60,552 50,999
152
4. Financial assets at fair value through profit or lossUNIT: RMB Million
The Group The Bank
12/31/2015 12/31/2014 12/31/2015 12/31/2014
Trading financial assets:
Debt instrument investment:
Government bonds 1,871 1,391 1,871 1,391
The Central Bank bills and policy financial bonds 4,778 12,126 4,778 12,126
Banks and other financial institutions 1,122 242 1,122 242
Corporate bonds 19,179 24,623 19,179 24,623
Interbank certificates of deposit 1,362 343 1,362 343
Subtotal of debt instruments investment 28,312 38,725 28,312 38,725
Equity instrument investment:
Funds 98,583 4,389 98,012 4,339
Trust plan of assembled funds 134 207 - -
Stocks 10 115 - -
Wealth management products 500 - - -
Subtotal of equity instrument investment 99,227 4,711 98,012 4,339
Total of trading financial assets 127,539 43,436 126,324 43,064
Assigned as financial assets at fair value through profit and loss:
Debt instrument investment 1,037 999 - -
Equity instrument investment 109 - - -
Total financial assets assigned as at fair value through profit and loss 1,146 999 - -
Total 128,685 44,435 126,324 43,064
153
2 0 1 5 ANNUAL REPORT
5. Derivative financial instrumentsThe Group enters into foreign currency exchange rate, interest rate and precious metals related derivative financial instruments for purposes of trading, asset and liability management and customer driven business.
The notional amounts of derivative instruments represents the value of the underlying asset or the reference rate as a basis to measure changes in derivative financial instruments, which provide an indication of the volume of business transacted by the Group, but don’t stand for the relevant future cash flow or current fair value, thus, do not indicate the Group’s exposure to credit or market risks. The derivative instruments become favourable (assets) or unfavourable (liabilities) as a result of fluctuations in market interest rates, foreign exchange rates or precious metal prices relative to their terms. The aggregate fair values of derivative financial assets and liabilities can fluctuate significantly from time to time.
The notional amount and fair value of the Group’s derivative financial instruments:
Precious metal derivatives 56,816 2,626 308 30,447 597 134
Credit derivatives 7,970 59 35 776 3 2
Total 13,933 10,563 5,142 4,498
6. Financial assets held under resale agreementsUNIT: RMB Million
The Group and the Bank
12/31/2015 12/31/2014
Bonds 51,550 25,077
Bills 97,839 364,923
Beneficial rights of trust and others (Note 1) 76,535 322,359
Credit assets - 300
Lease receivables - 102
Total 225,924 712,761
Note 1: Beneficial rights of trust and others mainly comprised of the investment to trust plans and asset management plans operated by trust companies, securities companies and asset management companies.
154
7. Interest receivableUNIT: RMB Million
The Group The Bank
12/31/2015 12/31/2014 12/31/2015 12/31/2014
Amount due from Central Bank and financial institutions 607 928 635 930
Placements with banks and other financial institutions 161 438 163 440
Financial assets held under resale agreements 1,456 6,991 1,456 6,991
Loans and advances to customers 4,826 4,547 4,807 4,547
Bonds and other investments 14,290 11,671 14,207 11,578
Other 403 185 162 115
Total 21,743 24,760 21,430 24,601
8. Loans and advances to customers(1) Analysis of loans and advances to customers by personal and corporate:
UNIT: RMB Million
The Group The Bank
12/31/2015 12/31/2014 12/31/2015 12/31/2014
Personal loans and advances
Residential and business mortgage loans 298,309 198,769 298,309 198,769
Credit cards 77,960 66,364 77,960 66,364
Others 135,637 120,817 133,201 120,817
Subtotal 511,906 385,950 509,470 385,950
Corporate loans and advances
Loans and advances 1,197,627 1,179,708 1,197,827 1,179,808
Discounted bills 69,875 27,490 69,875 27,490
Subtotal 1,267,502 1,207,198 1,267,702 1,207,298
Gross loans and advances 1,779,408 1,593,148 1,777,172 1,593,248
Less: Provisions for impairment (54,586) (43,896) (54,505) (43,895)
9. Available-for-sale financial assets(1) Listed by types:
UNIT: RMB Million
The Group The Bank
12/31/2015 12/31/2014 12/31/2015 12/31/2014
Available-for-sale debt instrument:
Government bonds 82,224 96,943 82,224 96,943
The Central Bank bills and policy financial bonds 28,547 32,881 28,547 32,881
Bonds issued by banks and other financial institutions 11,426 6,177 11,426 6,177
Corporate bonds 70,466 111,099 68,615 108,773
Interbank certificates of deposit 4,071 13,742 4,071 13,742
Trust fund plans and other equity instrument (Note 1) 201,689 146,179 201,573 145,959
Subtotal 398,423 407,021 396,456 404,475
Available-for-sale equity instrument:
Measured by fair value 27,881 731 23,045 18
Measured by cost 330 314 81 81
Subtotal 28,211 1,045 23,126 99
Net value of available-for-sale financial assets 426,634 408,066 419,582 404,574
Note 1: Trust fund plans and others are the beneficial rights of trust which are designated as available-for-sale financial assets when initially invested by the Group. These products’ investment directions are mainly the trust loans or fund management plans run by the trust companies, asset management companies or securities companies as entrusted fund administrators. According to the liquidity management or operation management, these beneficial rights of trust or fund management plans will be probably for sale.
161
2 0 1 5 ANNUAL REPORT
(2) Related analysis for available-for-sale financial assets at fair value in the year-end:
UNIT: RMB Million
The Group The Bank
12/31/2015 12/31/2014 12/31/2015 12/31/2014
Available-for-sale debt instrument:
Amortized cost 394,078 405,632 392,158 403,134
Fair value 398,423 407,021 396,456 404,475
Accumulative appropriation to other comprehensive income 6,670 2,617 6,623 2,569
Accumulative appropriation to provisions (2,325) (1,228) (2,325) (1,228)
Available-for-sale equity instrument:
Cost 26,857 649 22,092 4
Fair value 27,881 731 23,045 18
Accumulative appropriation to other comprehensive income 1,029 89 953 14
Accumulative appropriation to provisions (5) (7) - -
Total
Amortized cost of debt instruments / cost of equity instrument 420,935 406,281 414,250 403,138
Fair value 426,304 407,752 419,501 404,493
Accumulative appropriation to other comprehensive income 7,699 2,706 7,576 2,583
Accumulative appropriation to provisions (2,330) (1,235) (2,325) (1,228)
162
(3) Related analysis about available-for-sale financial assets at cost in the year-end
UNIT: RMB Million
Investee
The Group
Book balance Provision for assets
impairment
Proportion of share in
Investee(%)
Cash dividendsfor the yearOpening Increase Closing
China Unionpay 81 - 81 - 2.13 3
Huafu Securities 180 - 180 - 4.35 13
Zijin Mining Group 25 - 25 - 5.00 1
Others 28 16 44 - -
Total 314 16 330 - 17
UNIT: RMB Million
Investee
The Bank
Book balance Provision for assets
impairment
Proportion of share in
Investee(%)
Cash dividendsfor the yearOpening Increase Closing
China Unionpay 81 - 81 - 2.13 3
(4) Related analysis about provisions for impairment on available-for-sale financial assets
Note 1: Wealth management products are fixed-period financial products issued by other financial institutions.
Note 2: Trust fund plans and others are the beneficial rights of the trust and fund management plans, etc. These products’ investment directions are mainly the trust loans or fund management plans operated by the trust companies, securities companies and asset management companies as entrusted fund administrators.
164
12. Finance lease receivablesAnalysis by nature:
UNIT: RMB Million
The Group
12/31/2015 12/31/2014
Finance lease receivables 85,188 68,937
Less: Unrealized financing income (9,032) (9,098)
Subtotal 76,156 59,839
Less: Provision for finance lease (2,010) (1,585)
-Individually assessed (227) (149)
-Collectively assessed (1,783) (1,436)
Net value 74,146 58,254
List as follows:UNIT: RMB Million
The Group
12/31/2015 12/31/2014
1st year subsequent to the balance sheet date 25,437 18,065
2nd year subsequent to the balance sheet date 21,697 17,780
3rd year subsequent to the balance sheet date 16,600 14,014
Subsequent periods 21,454 19,078
Subtotal 85,188 68,937
Unrealized financing income (9,032) (9,098)
Subtotal 76,156 59,839
Less: Provision for finance lease (2,010) (1,585)
-Individually assessed (227) (149)
-Collectively assessed (1,783) (1,436)
Net value 74,146 58,254
-Finance lease receivables due less than 1 year 22,140 15,266
-Finance lease receivables due more than 1 year 52,006 42,988
165
2 0 1 5 ANNUAL REPORT
13. L
ong-
term
equ
ity in
vest
men
tsB
reak
dow
n of
long
-term
equ
ity in
vest
men
ts:
UN
IT: R
MB
Mill
ion
Inve
stee
The
Gro
up
Acc
ount
ing
met
hod
Initi
alin
vest
-m
ent
01/0
1/20
15A
dditi
ons
12/3
1/20
15
Pro
porti
on o
f eq
uity
inte
rest
(%)
Pro
porti
on
of v
otin
g po
wer
in
the
inve
stee (%
)
Exp
lana
tion
on
inco
nsis
tenc
y be
twee
n th
e p
ropo
rtion
of
equi
ty in
tere
st a
nd th
e pr
opor
tion
of v
otin
g po
wer
in th
e in
vest
ee
Pro
visi
ons
Cas
h di
vide
nds
for t
his
year
Ban
k of
Jiu
jiang
Co.
, Ltd
. (1)
Equ
ity
met
hod
561
1,49
122
91,
720
14.7
214
.72
not a
pplic
able
-34
Cho
ngqi
ng M
achi
nery
and
Ele
ctro
nics
Hol
ding
Gro
up F
inan
ce C
ompa
ny L
imite
d (2
) E
quity
m
etho
d11
413
512
147
19.0
019
.00
not a
pplic
able
--
CIB
Fut
ures
(3)
(3)
7778
(78)
- 92
.20
92.2
0no
t app
licab
le-
-
Oth
ers
Equ
ity
met
hod
51-
5151
not a
pplic
able
--
Tota
l1,
704
214
1,91
8-
34
UN
IT: R
MB
Mill
ion
Inve
stee
The
Ban
k
Acc
ount
ing
met
hod
Initi
alin
vest
-m
ent
01/0
1/20
15A
dditi
ons
12/3
1/20
15
Pro
porti
on o
f eq
uity
inte
rest
(%)
Pro
porti
on
of v
otin
g po
wer
in
the
inve
stee (%
)
Exp
lana
tion
on
inco
nsis
tenc
y be
twee
n th
e p
ropo
rtion
of
equi
ty in
tere
st a
nd th
e pr
opor
tion
of v
otin
g po
wer
in th
e in
vest
ee
Pro
visi
ons
Cas
h di
vide
nds
for t
his
year
Ban
k of
Jiu
jiang
Co.
, Ltd
. (1)
Equ
ity
met
hod
561
1,49
122
91,
720
14.7
214
.72
not a
pplic
able
-34
Indu
stria
l Ban
k Fi
nanc
ial L
easi
ng C
o., L
td.
(N
ote
VII)
Cos
t m
etho
d5,
000
5,00
0-
5,00
010
0.00
100.
00no
t app
licab
le-
-
Chi
na In
dust
rial I
nter
natio
nal T
rust
Lim
ited
(N
ote
VII)
Cos
t m
etho
d6,
395
6,39
5-
6,39
573
.00
73.0
0no
t app
licab
le-
219
CIB
Fun
d M
anag
emen
t Co.
, Ltd
. (
Not
e V
II)C
ost
met
hod
450
450
-45
090
.00
90.0
0no
t app
licab
le-
-
Indu
stria
l Con
sum
er F
inan
ce C
o., L
td.
(N
ote
VII)
Cos
t m
etho
d19
819
8-
198
66.0
066
.00
not a
pplic
able
--
Tota
l13
,534
229
13,7
63-
253
166
(1) In accordance with the YJF [2008] No.449, approved by the CBRC on 4 November, 2008, the Bank has acquired 102.2 million shares of Bank of Jiujiang Co., Ltd. (refers to as Bank of Jiujiang hereafter) for the price of RMB2.9 per share. As the result, the Bank holds 20% of the total shares of the Bank of Jiujiang after it expanded its share capital. In 2009, Bank of Jiujiang increases 4 shares for every 10 shares to all recorded shareholders based on the share capital by the end of August 2009 by utilizing capital reserve. The Bank currently holds 143.08 million shares of Bank of Jiujiang. In 2010, Bank of Jiujiang increases its registered capital RMB400.66 million, offered privately and subscribed in cash for the price of RMB3.3 per share. The Bank has acquired 80.12 million shares. After the acquisition, the Bank holds 223.20 million shares and the proportion of equity interest remains 20% of the total shares of the Bank of Jiujiang after it expanded its share capital. On 14 December, 2011, Bank of Jiujiang increased its registered capital by RMB400 million, the Bank didn’t subscribe, and the proportion of equity interest of the Bank was diluted to 14.72% after the increase of share capital. The equity investment is accounted for using the equity method for the Bank sent a director to the Bank of Jiujiang and has significant influence over the Bank of Jiujiang.
(2) Chongqing Machinery and Electronics Holding Group Finance Company Limited (the subsidiary of CIB Futures Co., Ltd.) are the investees of China Industrial International Trust Limited’s long-term investments. As China Industrial International Trust Limited holds 19% of the total shares and sends directors to the investee, China Industrial International Trust Limited has significant influence over Chongqing Machinery and Electronics Holding Group Finance Company Limited, therefore the equity investment is accounted by the equity method.
(3) China Industrial International Trusts Limited (a holding subsidiary of the Bank) bought a stake in Ningbo Shanli Futures Limited in Mar, 2014, owning 29.7% of its shares. In September 2014, approved by the State Administration for Industry and Commerce, the Company changed its name to CIB Futures Co., Ltd. In March 2015, CIIT bought 40.3% shares from other shareholders by RMB104 million to increase its shareholding ratio to 70.00%. In August 2015, CIIT increases RMB381 million capital to CIB Futures Co., Ltd., the capital of which increased from RMB100 million to RMB500 million. The shareholding ratio increased to 92.20%. CIB Futures Co., Ltd. was included in the scope of consolidated financial statements and no longer accounted as long-term equity investment by the Group.
(4) There are no restrictions of the investees’ capital transferring capacities to the Group and the Bank on 31 December, 2015.
Transfers from constructions in progress 1,028 29 14 - 1,071
Sales/disposals (12) (1) (365) (40) (418)
12/31/2015 9,481 891 6,121 1,072 17,565
Accumulated depreciation
1/1/2015 1,713 286 2,988 174 5,161
Depreciation for the year 266 86 817 91 1,260
Increase by acquiring subsidiaries 3 - 2 1 6
Eliminated on sales/disposals (5) (1) (211) (16) (233)
12/31/2015 1,977 371 3,596 250 6,194
Net value
1/1/2015 6,667 570 2,435 247 9,919
12/31/2015 7,504 520 2,525 822 11,371
Provision for impairment
1/1/2015 (3) - - - (3)
Charged for the year - - - - -
Eliminated on sales/disposals - - - - -
12/31/2015 (3) - - - (3)
Net carrying amount
1/1/2015 6,664 570 2,435 247 9,916
12/31/2015 7,501 520 2,525 822 11,368
All the buildings of the Group are located in the PRC. Buildings cost RMB512 million are in use but the legal ownership registrations were still in process as at 31 December, 2015 (31 December, 2014:RMB2,464 million).
Transfers from constructions in progress 1,028 29 14 - 1,071
Sales/disposals (12) (1) (364) (40) (417)
12/31/2015 9,448 891 6,063 416 16,818
Accumulated depreciation
1/1/2015 1,711 286 2,974 169 5,140
Depreciation for the year 265 86 807 49 1,207
Eliminated on sales/disposals (5) (1) (211) (16) (233)
12/31/2015 1,971 371 3,570 202 6,114
Net value
1/1/2015 6,653 570 2,416 230 9,869
12/31/2015 7,477 520 2,493 214 10,704
Provision for impairment
1/1/2015 (3) - - - (3)
Charge for the year - - - - -
Eliminated on sales/disposals - - - - -
12/31/2015 (3) - - - (3)
Net carrying amount
1/1/2015 6,650 570 2,416 230 9,866
12/31/2015 7,474 520 2,493 214 10,701
All the buildings of the Group are located in the PRC. Buildings cost RMB512 million are in use but the legal ownership registrations were still in process as at 31 December, 2015 (31 December, 2014:RMB 2,464 million).
169
2 0 1 5 ANNUAL REPORT
15. Construction in progress(1) Details of construction in progress are as follows:
China Industrial International Trust Limited 446 86 - 532 -
Goodwill arose from acquisition of China Industrial International Trust Limited in February 2011, and the overweight of CIB Futures Co., Ltd. by China Industrial International Trust Limited in March, 2015.
At the end of the year, the Group performed impairment tests on goodwill based on expected future cash flow of the investee for next 5 years, applying appropriate discount rate, reflecting current time value of money and the risk of specific assets. No evidence shows that the recoverable amount of goodwill is less than the carrying amount, therefore no impairment is recognised.
172
17. D
efer
red
tax
asse
t and
def
erre
d ta
x lia
bilit
y(1
) Rec
ogni
zed
defe
rred
tax
asse
ts a
nd li
abili
ties
befo
re o
ffset
UN
IT: R
MB
Mill
ion
T
he G
roup
The
Ban
k
12
/31/
2015
12/
31/2
014
12
/31/
2015
12/
31/2
014
Ded
uctib
le
(taxa
ble)
tem
pora
rydi
ffere
nces
Def
erre
d ta
xas
sets
(liab
ilitie
s)
Ded
uctib
le
(taxa
ble)
tem
pora
rydi
ffere
nces
Def
erre
d ta
xas
sets
(liab
ilitie
s)
Ded
uctib
le
(taxa
ble)
tem
pora
rydi
ffere
nces
Def
erre
d ta
xas
sets
(liab
ilitie
s)
Ded
uctib
le
(taxa
ble)
tem
pora
rydi
ffere
nces
Def
erre
d ta
xas
sets
(liab
ilitie
s)
Def
erre
d ta
x as
sets
Impa
irmen
t los
ses
on a
sset
s57
,420
14,3
5540
,044
10,0
1155
,664
13,9
1638
,955
9,73
9
Fair
valu
e ch
ange
s of
fina
ncia
l ass
ets
at f
air v
alue
thro
ugh
profi
t or l
oss
256
6414
737
240
6014
737
Acc
rued
but
not
pai
d em
ploy
ee b
enefi
ts9,
504
2,37
68,
371
2,09
38,
860
2,21
57,
839
1,96
0
Fair
valu
e ch
ange
s of
pre
ciou
s m
etal
s1,
290
323
--
1,29
032
3-
-
Oth
ers
824
206
547
136
780
195
540
134
Subt
otal
69,2
9417
,324
49,1
0912
,277
66,8
3416
,709
47,4
8111
,870
Def
erre
d ta
x lia
bilit
ies
Fair
valu
e ch
ange
s of
der
ivat
ive
fina
ncia
l ins
trum
ents
(3,4
36)
(859
)(6
55)
(163
)(3
,436
)(8
59)
(655
)(1
63)
Fair
valu
e ch
ange
s of
pre
ciou
s m
etal
s-
-(2
1)(5
)-
-(2
1)(5
)
Diff
eren
ce o
f fixe
d as
set i
mpa
irmen
t tax
(1)
-(2
83)
(71)
(1)
-(2
83)
(71)
Fair
valu
e ch
ange
s of
ava
ilabl
e-fo
r-sa
le fi
nanc
ial a
sset
s(7
,699
)(1
,924
)(2
,706
)(6
76)
(7,5
76)
(1,8
94)
(2,5
83)
(646
)
Fair
valu
e ch
ange
s of
fina
ncia
l ass
ets
at
fair
valu
e th
roug
h pr
ofit o
r los
s(3
7)(9
)(2
0)(5
)(1
7)(4
)-
-
Subt
otal
(11,
173)
(2,7
92)
(3,6
85)
(920
)(1
1,03
0)(2
,757
)(3
,542
)(8
85)
Net
val
ue58
,121
14,5
3245
,424
11,3
5755
,804
13,9
5243
,939
10,9
85
The
tax
paym
ent o
f var
ious
bra
nche
s of
Ban
k ca
n be
agg
rega
ted,
the
defe
rred
tax
asse
ts a
nd d
efer
red
tax
liabi
litie
s ar
e pr
esen
ted
at th
e ne
t am
ount
afte
r offs
et;
the
subs
idia
ries
are
indi
vidu
al ta
xabl
e en
titie
s, th
e de
ferr
ed ta
x as
sets
and
def
erre
d ta
x lia
bilit
ies
of th
e re
spec
tive
entit
y ca
n be
pre
sent
ed a
t the
net
am
ount
afte
r of
fset
. Whe
n th
ere
is n
et d
efer
red
tax/
liabi
litie
s in
ove
rsea
s br
anch
es, t
hey
are
not o
ffset
aga
inst
thos
e in
dom
estic
bra
nche
s. T
he s
ubsi
diar
ies
of th
e B
ank
are
indi
vidu
al ta
xabl
e en
titie
s, th
e de
ferr
ed ta
x as
sets
and
def
erre
d ta
x lia
bilit
ies
of th
e re
spec
tive
entit
y ca
n be
pre
sent
ed a
t the
net
am
ount
afte
r offs
et.
173
2 0 1 5 ANNUAL REPORT
UNIT: RMB Million
The Group The Bank
2015 2015
Opening balance of net value 11,357 10,985
-Deferred tax assets 12,277 11,870
-Deferred tax liabilities (920) (885)
Net changes of deferred tax recognised in income tax expenses 4,423 4,215
Net changes of deferred tax recognised in other comprehensive income (1,248) (1,248)
Closing balance of net value 14,532 13,952
-Deferred tax assets 17,324 16,709
-Deferred tax liabilities (2,792) (2,757)
(2) According to the Group’s future profit forecast, the Group believes that it is probable that sufficient taxable profits will be available in future periods to offset the deductible temporary differences and deductible losses. Therefore, the Group can recognize the deferred tax assets.
Total 9,925 19,784 (18,447) 11,262 9,410 18,789 (17,715) 10,484
The salaries, bonus, retirement benefits and other social insurance of employee benefits payable are granted or paid according to time limit set by relevant laws, regulations and the Group’s policies. See defined contribution pension plans in Note VIII, 49.1.
26. Tax payableUNIT: RMB Million
The Group The Bank
12/31/2015 12/31/2014 12/31/2015 12/31/2014
Income tax 7,116 8,177 6,516 7,839
Business tax 3,071 2,235 2,978 2,170
City maintenance and construction tax 216 154 209 148
Others 399 307 367 282
Total 10,802 10,873 10,070 10,439
180
27. Interest payableUNIT: RMB Million
The Group The Bank
12/31/2015 12/31/2014 12/31/2015 12/31/2014
Interest due to Central Bank 604 210 604 210
Interest due to banks and other financial institutions 7,035 8,750 7,048 8,753
Interest of placements from banks and other financial institutions 637 454 49 116
Interest of debt securities issued 2,775 1,258 2,704 1,258
Interest of financial assets sold under repurchase agreements 63 142 63 133
Interest due to customers 25,207 24,842 25,207 24,842
Others 122 54 121 52
Total 36,443 35,710 35,796 35,364
28. Debt securities issuedUNIT: RMB Million
The Group The Bank
31/12/2015 12/31/2014 31/12/2015 12/31/2014
Long term subordinated bonds 20,952 20,949 20,952 20,949
Financial bonds 72,908 37,974 67,927 37,974
Secondary capital bonds 19,969 19,967 19,969 19,967
Hybrid capital bonds 4,000 4,000 4,000 4,000
Interbank certificates of deposit 293,996 98,831 293,996 98,831
Short term bonds 3,009 4,066 3,009 4,066
Total 414,834 185,787 409,853 185,787
Debt securities issued by the Group include long-term subordinated bonds, financial bonds, secondary capital bonds, hybrid capital bonds and deposit receipt from banks. The hybrid capital bonds are issued to meet the requirement of hybrid capital instrument (debt, equity) according to The Basel Capital Accord, whose liquidation sequence is behind subordinated debts; Secondary capital bonds are issued by commercial banks to supply the secondary capital. The secondary capital bonds and the long term subordinated bonds are in the same liquidation sequence; sequence of hybrid capital bonds is behind them.
181
2 0 1 5 ANNUAL REPORT
Detailed information for debt securities issued as follows:
UNIT: RMB Million
Type Issuing date Interest payment The Group The Bank
Book value of interbank certificate of deposit (11) 297,800 297,800
Less: unamortized issuance cost (3,804) (3,804)
Subtotal 293,996 293,996
Certificate of deposit
Book value of certificate of deposit (12) 3,018 3,018
Accrued interest 2 2
Less: unamortized issuance cost (11) (11)
Subtotal 3,009 3,009
Total 414,834 409,853
182
(1) In September 2009, the Group issued RMB7,995 million subordinated bonds with a 15-year maturity, a fixed interest rate and a redemption option in the end of the tenth year. The annual coupon rate in first ten interest-bearing years is 5.17%, and the rate in late five years is 8.17% if the issuer does not exercise the option of redemption.
(2) In March 2010, the Group issued RMB3,000 million subordinated bond with a 15-year maturity, a fixed interest rate and a redemption right in the end of the tenth year. The annual coupon rate in first ten interest-bearing years is 4.80%, and the rate in late five years is 7.80% if the issuer does not exercise the option of redemption.
(3) In June 2011, the Group issued RMB10,000 million subordinated bond with a 15-year maturity, a fixed interest rate and a redemption right in the end of the tenth year. The annual coupon rate is 5.75% consistently.
(4) In December 2006, the Group issued RMB8,000 million financial bond with a 10-year maturity and a fixed interest rate. The annual coupon rate is 3.75%.
(5) In December 2011, the Group issued RMB30,000 million special financial bond for small enterprises with a 5-year maturity and a fixed interest rate. The annual coupon rate is 4.20%.
(6) The Group issued RMB30 billion of 3-year fixed interest rate RMB financial bonds in January 2015. The annual interest rate is 4.95%.
(7) The subsidiary China Industrial Finance Leasing Limited issued RMB2 billion of 3-year fixed interest rate RMB financial bonds in June 2015 and RMB3 billion in October 2015. The annual interest rate is 4.2% and 3.75% respectively.
(8) In June 2014, the Group issued RMB20,000 million subordinated bond with a 10-year maturity, a fixed interest rate and a redemption right in the end of the fifth year. The annual coupon rate is 6.15% consistently.
(9) In September 2006, the Group issued RMB3,000 million hybrid capital bond with a 15-year maturity and a fixed interest rate. The Bank has an option to redeem all of the bonds at face value from the eleventh year to maturity day. The annual coupon rate of the first ten years is 4.94%. If the Bank does not exercise this option, the annual coupon rate of the bonds will be 7.74% for the next five years.
(10) In September 2006, the Group issued RMB1,000 million hybrid capital bond with a 15-year maturity and a floating interest rate. The Bank has an option to redeem all of the bonds at face value from the eleventh year to maturity day. Annual interest rate is the summation of the benchmark interest rate and the basic margin; the benchmark interest rate refers to the interest rate for fixed amount and period deposit with a term of one year stipulated by the PBOC, which is applicable on the issuance date and reprising date. The basic margin of the first ten years (the original basic margin) is 1.82%. If the Bank does not exercise this option, the basic margin will be the original basic margin plus 1% during the period from the 11th year to the maturity of the bond.
(11) The Group owned 193 unpaid interbank certificates of deposit in 2015, the amount of which was RMB29.78 billion. The amount of the certificates within 1 year was RMB29,46 billion. The period of the rest of them is 1-3 years. The Annual interest rate is 2.92% to 5.00%, except for interest of 12 interest-bearing debts being paid quarterly, interests of the rest is paid upon maturity.
(12) Hong Kong branch owned 13 unpaid certificates of deposit in 2015, the amount of which was RMB3,018 million. The period was 6-12 month. The amount of 7 HKD certificates was HKD1,432 million (RMB1,200 million); the amount of 6 USD certificates was USD280 million (RMB1,818 million). The annual interest rate was between 0.83% and 1.43%. The interests are paid at maturity.
183
2 0 1 5 ANNUAL REPORT
29. Other liabilitesUNIT: RMB Million
The Group The Bank
12/31/2015 12/31/2014 12/31/2015 12/31/2014
Bank promissory notes 3,207 4,691 3,207 4,691
Items in the process of clearance and settlement 2,739 109,882 2,739 109,882
Dividend payables 9 8 9 8
Wealth management and entrusted investment fund 733 20,238 733 20,238
Deferred income 2,973 2,701 806 1,285
Other payables 18,913 13,508 6,496 5,071
Total 28,574 151,028 13,990 141,175
30. Share capitalUNIT: RMB Million
The Group and the Bank
1/1/2015 Change for the year 12/31/2015
Shares without limited sales restrictions
RMB ordinary shares (A shares) 16,179 - 16,179
Shares with limited sales restrictions
RMB ordinary shares (A shares) 2,873 - 2,873
Total shares 19,052 - 19,052
As at 31 December, 2015, the share capital of the Bank is RMB19,052 million (31 December, 2014:RMB19,052 million) with par value of RMB1 Yuan per share.
184
31. Other Equity InstrumentsThe Bank are approved by CSRC to non-publicly issue domestic preferred stock no further than RMB26 billion on 24/11/2014, in which RMB13 billion is initially issued with face value of RMB100 per share and completed in December 2014, which was verified by Deloitte Touche Tohmatsu Certified Public Accountants LLP. In June 2015, the Bank issued the second term of non-publicly domestic preferred stock for 13 billion, with face value of RMB100 per share, which was verified by Deloitte Touche Tohmatsu Certified Public Accountants LLP. The Bank completed the issue of 26 billion domestic preferred stocks, approved in November 2014, successfully in June 2015.
Outstanding preferred stocks in the end of the year are as follows:
The Group and the Bank
Outstanding financial instrument
Time Classification Rate Price Quantity Amount Maturity Date
Transfer requirement Condition
Preferred stock 2014.12 Equity
instrument Note 1 100 130 13,000 N/A Note 3 N/A
Preferred stock 2015.6 Equity
instrument Note 2 100 130 13,000 N/A Note 3 N/A
Note 1: For the first issue of the preferred stock, every five year is an interest-bearing cycle from the payment deadline 8 December, 2014, the dividend rate is the same in every interest-bearing cycle. The dividend rate of first cycle is determined to be 6.00% through inquiring, by the Board of Directors in according with the shareholders’ meeting authorized combining with some factors such as national policy when issued, market conditions, specific circumstances of the Bank and requirements of investors. The dividend rate of preferred stock of this issue is not higher than annual weighted average ROE of ordinary shareholders in the last two fiscal years. The dividend rate of preferred stock of this issue is the sum of benchmark interest rate and basic interest rate, the benchmark interest rate of the first interest-bearing cycle is national debt (which period before payment is for 5 years) YTM’s arithmetic mean (i.e. 3.45%, rounded off to 0.01%), from the fixed-rate national debt yield curve in Bank Debt published by China Bond Information Website (or any other websites approved by Central Securities Depository Trust and Clearing Corporation Limited), 20 days before 8 December, 2014 which’s the date of the deadline for payment of preferred stock issued (excluding the day). The benchmark interest rate adjusts every 5 years from the deadline for payment of preferred stock issued. The basic interest rate is the dividend rate of first cycle deducting the benchmark interest rate, which is 2.55%. The basic interest rate will no longer be adjusted since the issue of determining. The coupon interest rate of follow-up period is current dividend benchmark interest rate plus an interest margin, the benchmark interest rate of current interest-bearing cycle is national debt (which period before payment is for 5 years)YTM’s arithmetic mean (rounded off to 0.01%), from the fixed-rate national debt yield curve in Bank Debt published by China Bond Information Website (or any other websites approved by Central Securities Depository Trust and Clearing Corporation Limited), 20 days before benchmark interest rate adjustment date which’s the date of each 5 years of the deadline for payment of preferred stock issued (which is 8 December). If the YTM of 5-year treasury bonds with 5-year maturity is not available on the benchmark interest adjustment day, the benchmark interest rate or determination principal will be determined under negotiations between the Bank and investors required by regulator.
Note 2: For the second issue of preferred stock, every five year is an interest-bearing cycle from the payment deadline 24 June, 2015, the dividend rate is the same in every interest-bearing cycle. The dividend rate of first cycle is determined to be 5.40% through inquiring, by the Board of Directors in according with the shareholders’ meeting authorized combining with some factors such as national policy when issued, market conditions, specific circumstances of the Bank and requirements of investors. The dividend rate of preferred stock of this issue is not higher than annual weighted average ROE of ordinary shareholders in the last two fiscal years. The dividend rate of preferred stock of this issue is the sum of benchmark interest rate and basic interest rate, the benchmark interest rate of the first interest-bearing cycle is national debt (which period before payment is for 5 years) YTM’s arithmetic mean (i.e. 3.25%, rounded off to 0.01%), from the fixed-rate national debt yield curve in Bank debt published on www.chinabond.com.cn (or any other websites approved by Central Securities Depository Trust and Clearing Corporation Limited), 20 days before 24 June 2015 which’s the date of the deadline for payment of preferred stock issued (excluding the day). The benchmark interest rate adjusts every 5 years from the deadline for payment of preferred stock issued. The basic interest rate is the dividend rate of first cycle deducting the benchmark interest rate, which is 2.15%. The basic interest rate will no longer
185
2 0 1 5 ANNUAL REPORT
be adjusted since the issue of determining. The coupon interest rate of follow-up period is current dividend benchmark interest rate plus an interest margin, the benchmark interest rate of current interest-bearing cycle is national debt (which period before payment is for 5 years)YTM’s arithmetic mean (rounded off to 0.01%), from the fixed-rate national debt yield curve in Bank Debt published on www.chinabond.com.cn (or any other websites approved by Central Securities Depository Trust and Clearing Corporation Limited), 20 days before benchmark interest rate adjustment date which’s the date of each 5 years of the deadline for payment of preferred stock issued (which is 24 June). If the YTM of 5-year national debt with 5-year maturity is not available on the benchmark interest adjustment day, the benchmark interest rate or determination principal will be determined under negotiations between the Bank and investors required by regulator.
Note 3: (1) When the Bank’s core tier one capital adequacy ratio fell to 5.125%, the preferred stocks of this issue will be examined and decided by CBRC in accordance with the relevant requirements of, in accordance with the full mandatory conversion price into common shares of the Bank, when the preferred shares converted into A shares of common stock, under any conditions no longer be restored to preferred stock.
(2) When triggered event of the secondary capital instruments issued by the Bank occurs, the preferred stocks of this issue will be examined and decided by CBRC in accordance with the relevant requirements of, in accordance with the full mandatory conversion price into common shares of the Bank, when the preferred shares converted into A shares of common stock, under any conditions no longer be restored to preferred stock. Among them, the secondary capital instruments triggering event is the earlier of the following two situations: ① CBRC identifies if it was not conversion or written down, the Bank will be unable to survive; ② Relevant departments identify if the public sectors don’t inject or offer the same effect support, the Bank will not survive.
The principal terms of disclosure (applicable to first and second issue of domestic preferred stock):
The Bank will pay preferred dividends in cash. The preferred stock of this issue use a non-cumulative dividend payment, which means dividend that is not paid in full to preferred shareholders do not accrue interest to next year. After the preferred shareholders of this issue obtain distribution in accordance with the agreed dividend rate, they can no longer participate in the distribution of profits remaining.
Under the premise of ensuring the capital adequacy ratio from the regulatory requirements, after the Bank covers losses, extracts statutory reserve and general reserve, under the case of there still is retained earnings in the Bank’s financial statements caliber, the Bank could allocate dividends to preferred shareholders. The priority of preference shareholders’ dividends is higher than common shareholders, payment of preferred stock dividends is neither linked to ratings of banks, nor adjusted with the rating changes. The Bank could cancel payment of dividend in any case, and it does not constitute an event of default. The Bank can freely cancel the dividends distribution without constituting a breach of contract. The Bank is entitled to arrange cancelled income as payment to other debts with maturity. Canceling paying dividend shall not constitute any further restrictions on the Bank except income distribution of ordinary shares. When the Bank exercises these rights, it will take full account into the interests of preference shareholders. If payment of dividend for preference shareholders is all or part canceled, the Bank shall not pay common stock dividend for the fiscal year.
The right of redemption for preferred stocks of this issue belongs to the Bank, the Bank exercised the right of conditional redemption is under the premise of CBRC’s approval, the Bank’s preferred shareholders do not have the right to request redemption of preferred shares and should not form expectations that the preferred shares will be redeemed.
The initial mandatory conversion price of the preferred stock of this issue is the Bank A shares of common stock trading price on the date of 20 days before consideration by the Board of Directors of this preferred stock issued, which means that mandatory initial conversion price of preferred stocks of this issue is RMB9.86/share. Since the day that the issuance of preferred shares program is passed by the Bank’s Board of Directors, when the Bank shares change with the delivery of the stock dividend, share capital, issuance of new shares (not including any increasing share capital from conversion of financing instruments with terms that could be converted to ordinary shares) or the allotment of shares, the preferred stock will be accumulately adjusted in turn the forced conversion price in accordance with the established formula , and disclose relevant information in accordance with the provisions.
186
The Bank’s preference shareholders are entitled with priority to ordinary shareholders of the remaining property dividing, the amount paid off is the sum of the neither canceled nor distributed dividends and the total nominal amount of the held preferred stock; if it could not cover, then assign by the preferred shareholders in proportion to their shareholding.
As of 31 December, 2015, the Bank’s net proceeds of RMB25,905 million dollars have been all used to supplement the first level capital.
Changes of outstanding preferred stocks are as follows:
UNIT: RMB Million
The Group and the Bank
1/1/2015 Addition Less 12/31/2015
Quantity Book value Quantity Book value Quantity Book value Quantity Book value
Pursuant to the relating laws issued by the government, the Bank is required to transfer 10% of its net profit to the statutory surplus reserve under the Accounting Standard for Business Enterprises of China. The statutory surplus reserve is no longer appropriated when the accumulated amount exceeds 50% of the Bank’s share capital. As of 31 December, 2015, the Bank no longer transfer its net profit to statutory surplus reserve since the statutory surplus reserve has reached 50% of its share capital.
188
34. General risk reserveUNIT: RMB Million
The Group and the Bank
The Group The Bank
2015 2014 2015 2014
General and regulatory reserve 60,665 43,418 59,217 42,043
Pursuant to Measures on General Provision for Bad and Doubtful Debts for Financial Institutions (CJ[2012] No. 20) promulgated by the MOF, the Bank is required to transfer certain percentage of its net profit to establish and maintain a general reserve within shareholders’ equity, through the appropriation of profit to address unidentified potential impairment losses. In principle, the general risk reserve, accounted as profit distribution, should not be lower than 1.5% of the closing balance of gross risk-bearing assets since it is a part of shareholders’ equity. Gross risk-bearing assets, include loans and advances to customers, available-for-sale financial assets, held-to-maturity investments, debt securities classified as receivables, long-term equity investments, amount due from banks and other financial institutions, placements with banks and other financial institutions, foreclosed assets and other receivables and so forth. As at 31 December, 2015, the balance of the provision of general risk is 1.5% of the balance of risk-bearing assets at the end of the year. The subsidiaries of the Bank determine the general risk reserve according to the regulation.
35. Retained earningsUNIT: RMB Million
The Group The Bank
2015 2014 2015 2014
Opening balance 119,607 92,368 115,683 89,999
Net profit for the year 50,207 47,138 47,880 45,166
Appropriations to general risk reserve (17,247) (11,135) (17,174) (10,718)
Dividends distribution (10,860) (8,764) (10,860) (8,764)
Dividend distributions of preferred stock (51) - (51) -
Closing balance 141,656 119,607 135,478 115,683
189
2 0 1 5 ANNUAL REPORT
(1) “2015 Profit Distribution Proposal of the Bank” was approved by the Board of Directors on 27 April, 2016 and submitted for approval by the annual general meeting:
(i) Transfer RMB17,174 million to general risk reserve. As at 31 December, 2015, the general and risk reserve recommended to transfer has been included in the general risk reserve.
(ii) Distribute a cash dividend of RMB6.1 per 10 shares (tax inclusive) on the basis of 19,052,336,751 ordinary shares of the Bank at the end of 2015.
(iii) The interest period of preferred stock issued in 2014 is from 1 January, 2015 to 31 December, 2015 (the annual dividend rate is 6%), the interest period of preferred stock issued in 2015 is from 24 June, 2015 to 31 December, 2015 (the annual dividend rate is 5.4%), the preferred dividends payable is 1,147 million in total.
The profit distribution plan above has not been approved by the Annual General Meeting of the Bank. The accounting treatment of dividend distribution scheme before the approval is not carried out.
(2) “2014 Profit Distribution Proposal of the Bank” was approved on 18 May, 2015 on the Annual General Meeting of the Bank and by the Board of directors meeting on 27 April, 2015, the detailed plan was as follows:
(i) Transfer RMB10,718 million to general risk reserve. As at 31 December, 2014, the general risk reserve recommended to transfer has been included in the general risk reserve.
(ii) Distribute a cash dividend of RMB5.7 per 10 shares (tax inclusive) on the basis of 19,052,336,751ordinary shares of the Bank at the end of 2014.
(iii) The interest period of preferred stock issued in 2014 is from 8 December, 2014 to 31 December, 2014, the preferred dividends payable is RMB51 million in total (the annual dividend rate is 6%).
As at 31 December, 2015, the above-mentioned dividend distribution scheme has been done.
(3) Surplus reserves appropriated by subsidiaries
As at 31 December, 2015, the balance of the Group’s retained earnings contained surplus reserves appropriated by subsidiaries: RMB801 million (31 December, 2014:RMB564 million).
190
36. Net interest incomeUNIT: RMB Million
The Group The Bank
2015 2014 2015 2014
Interest income
Balances with Central Bank 6,497 6,205 6,496 6,202
Amount due from banks and other financial institutions 3,894 4,782 3,852 4,778
Placements with banks and other financial institutions 2,095 4,645 2,170 4,648
Financial assets held under resale agreements 27,382 56,335 27,380 56,334
Loans and advances to customers 101,750 93,393 101,568 93,381
Including: Corporate 74,198 68,544 74,192 68,532
Personal 25,599 22,867 25,423 22,867
Bill discount 1,953 1,982 1,953 1,982
Bonds and other investment 108,019 49,814 107,315 49,193
Finance lease 5,367 4,031 - -
Others 968 209 968 209
Subtotal 255,972 219,414 249,749 214,745
Interest expense
Amount due to Central Bank (1,801) (210) (1,801) (210)
Amount due to banks and other financial institutions (57,897) (57,565) (57,978) (57,641)
Placements from banks andother financial institutions (3,785) (3,546) (243) (862)
Financial assets sold under repurchase agreements (2,427) (4,969) (2,420 ) (4,913)
Amount due to customers (57,422) (52,279) (57,422) (52,279)
Gains from disposal of non-current assets 9 85 9 85
Including: Gains from disposal of fixed assets 1 47 1 47
Gains from disposal of foreclosed assets 8 38 8 38
Penalties and fines received 27 11 27 11
Gains from dormant accounts 6 12 6 12
Government grants 334 379 57 101
Others 185 84 179 83
Total 561 571 278 292
194
44. Non-operating expensesUNIT: RMB Million
The Group The Bank
2015 2014 2015 2014
Losses on disposal of non-current assets - 2 - 2
Including: Losses on disposal of fixed assets - 2 - 2
Donation expenses 40 54 39 54
Penalties and fines paid 26 38 26 38
Others 61 69 57 69
Total 127 163 122 163
45. Income tax expensesUNIT: RMB Million
The Group The Bank
2015 2014 2015 2014
Current income tax 16,911 16,357 15,730 15,422
Deferred income tax (4,423) (3,462) (4,215) (3,334)
Adjustment income tax for previous year 106 173 106 173
Total 12,594 13,068 11,621 12,261
The tax charges can be reconciled to the profit as follows:
UNIT: RMB Million
The Group The Bank
2015 2014 2015 2014
Accounting profit 63,244 60,598 59,501 57,427
Tax calculated at applicable statutory tax rate of 25% 15,811 15,149 14,875 14,357
Adjustments on income tax:
Income not taxable for tax purpose (3,549) (2,336) (3,579) (2344)
Expenses not deductible for tax purpose 226 82 219 75
Adjustment on income tax for previous year 106 173 106 173
Total 12,594 13,068 11,621 12,261
195
2 0 1 5 ANNUAL REPORT
46. Earnings per shareUNIT: RMB Million
The Group
2015 2014
Current net profit attributable to ordinary shareholders of the Bank (RMB million) 50,156 47,138
Weighted average ordinary shares issued by the Bank (shares in million) 19,052 19,052
Basic and diluted earnings per share (RMB Yuan) 2.63 2.47
The RMB26,000 million preferred stocks of the Bank approved in November 2014 were successfully issued in June 2015. When calculating the earnings per share, the current net profit attributed to ordinary shareholders did not include preferred stock dividends announced of insurance. In addition, it had no influence on basic earnings per share and diluted earnings per share in 2015 and 2014.
47. Other comprehensive incomeUNIT: RMB Million
The Group
2015
12/31/2014Accrual income
tax
Other compre-hensive income
transferred to profit and loss
Income tax
expense
Belong to parent company
of owners after tax
Belong to minority
shareholder after tax
12/31/2015
Other comprehensive income cannot be subsequently classified to profit and loss
Including: Recalculation of defined benefit changes of net liabilities and net assets
222 (279) - - (279) - (57)
Subtotal 222 (279) - - (279) - (57)
Other comprehensive income should be subsequently classified to profit and loss
Including: Available-for-sale financial assets profit and loss due to changes in fair value
1,996 53,888 (48,895) (1,248) 3,750 (5) 5,746
Shares of investee after reclassifying the other incomprehensive income to profit and loss under equity method
Total 2,214 53,609 (48,895) (1,248) 3,471 (5) 5,685
196
UNIT: RMB Million
The Bank
2015
12/31/2014Accrual income
tax
Other comprehensive
income transferred to
profit and loss
Income taxexpense 12/31/2015
Other comprehensive income cannot be subsequently classified to profit and loss
Including: Recalculation of defined benefit changes of net liabilities and net assets 222 (279) - - (57)
Subtotal 222 (279) - - (57)
Other comprehensive income should be subsequently classified to profit and lossIncluding:
Available-for-sale financial assets profit and loss due to changes in fair value 1,939 53,836 (48,843) (1,248) 5,684
Shares of investee after reclassifying the other incomprehensive income to profit and loss under equity method
(4) - - - (4)
Subtotal 1,935 53,836 (48,843) (1,248) 5,680
Total 2,157 53,557 (48,843) (1,248) 5,623
197
2 0 1 5 ANNUAL REPORT
48. Supplementary information to the cash flow statement(1) Supplementary information to the cash flow statement
UNIT: RMB Million
The Group The Bank
2015 2014 2015 2014
1. Reconciliation of net profit to cash flows from operating activities
Net profit 50,650 47,530 47,880 45,166
Add: Provision for impairment losses of assets 45,260 25,904 44,233 25,397
Depreciation of fixed assets 1,260 1,028 1,207 1,017
Amortization of intangible assets 75 111 71 110
Amortization of long-term prepaid expenses 622 545 612 539
Gains from disposal of fixed assets, intangible assets and other long-term assets (9) (83) (9) (83)
Interest income of bonds and other investments (108,019) (49,814) (107,315) (49,193)
Interest income of impairment financial assets (907) (675) (907) (675)
Gains from changes in fair value (1,378) (1,631) (1,394) (1,622)
Investment income (losses) (3,482) 96 (3,235) 324
Interest expense for debt securities issued 12,673 5,136 12,602 5,136
Increase in deferred tax assets (5,047) (3,706) (4,839) (3,573)
Increase in deferred tax liabilities 624 244 624 239
Decrease in receivables of operating activities 255,601 101,217 256,383 120,951
Increase in payables of operating activities 570,770 556,158 574,866 536,134
Net cash flow from operating activities 818,693 682,060 820,779 679,867
2. Changes in cash and cash equivalents
Closing balance of cash and cash equivalents 312,352 357,128 310,026 355,278
Less: Opening balance of cash and cash equivalents 357,128 127,121 355,278 126,585
Net increase (decrease) of cash and cash equivalents (44,776) 230,007 (45,252) 228,693
198
(2) Composition of cash and cash equivalents
UNIT: RMB Million
The Group The Bank
12/31/2015 12/31/2014 12/31/2015 12/31/2014
Cash on hand 5,622 6,591 5,622 6,591
Balances with Central Bank 57,994 96,263 57,982 96,263
Deposits with banks and other financial institutions with original maturity of less than three months 23,431 50,222 21,117 48,673
Placements with banks and other financial institutions with original maturity of less than three months 22,874 19,901 22,874 19,601
Financial assets held under resale agreements with original maturity of less than three months 97,402 174,407 97,402 174,407
Bonds investment with original maturity of less than three months 105,029 9,744 105,029 9,743
Closing balance of cash and cash equivalents 312,352 357,128 310,026 355,278
49. Post-employment compensation49.1 Defined contribution plans
The Group participates in the endowment insurance, unemployment insurance plans established by the government and the annuity plan established by the Group. According to these plans, the employees’ salaries are paid to the plans proportionally each month. Except the expenses above, the Group shoulders no further payment duties. Certain expenses are charged in profit and loss of the period.
Expense recognised in profit or loss for the period:
UNIT: RMB Million
The Group The Bank
2015 2014 2015 2014
Defined contribution plans 1,774 1,247 1,757 1,226
Amount of payable in the year-end:
UNIT: RMB Million
The Group The Bank
12/31/2015 12/31/2014 12/31/2015 12/31/2014
Defined contribution plans 84 61 82 61
199
2 0 1 5 ANNUAL REPORT
49.2 Defined benefit plans
The Group offers complementary retiring benefit plans to employees who start their service before 31 December, 2007. The Group invited Tower Watson Consulting Group (Shanghai) to estimate the present value. The project estimates the future cash flow based on rate of inflation and rate of death, and recognizes its present value by discount rate. Discount rate is measured by the national debt market income rate in which the period of defined benefit plans and currency in balance sheet date. Past service costs will be charged in profit and loss in the period of revising the plans. The interest net value is recognized by the defined benefit plans net liabilities or assets timing appropriate discount rate.
The profit and loss charged by related influence from defined benefit plans are RMB156 million. Actuary profit and loss charging to other comprehensive income are RMB279 million. Net assets of defined benefit plans are RMB356 million at the end of the year, which is the net value of fair value of defined benefit plans duties and defined benefit plans assets, and should be charged to other assets. (Note VIII, 18).
In 31 December, 2015, the Group benefit plans set was in the period of the average benefit obligation for about 11 years (31 December, 2014:11 years).
Defined benefit plan makes the Group face the actuarial risks that include interest rate risk and longevity risk. Government bond yielding down will lead to a defined benefit plan duty value added. The present value of defined benefit plan duty is calculated based on the best estimate of employees participating in the scheme of the mortality rate, and the increase in life expectancy will lead to an increase in plan liabilities.
In determining the set of major actuarial present value using the benefit plan obligations assumed discount rate, mortality rate. The discount rate is 3.00% as at 31 December, 2015 (2014: 3.75%). Mortality assumptions are released to Chinese Insurance Regulatory Commission (China experience life table of life insurance “2000-2003”) men and women of pension service is on the basis of the pension business. The men and women workers retire at the age of 60 and retired at the age of 55 on average expected residual life for 22, 20 years and 29.52 years respectively.
The sensitivity analysis to the corresponding hypothesis reasonably possible changes occurred at the end of the reporting period (based on all the other assumptions unchanged).
If the discount rate increase (decrease) by 25 basis points, then the present value of defined benefit plan duty will be reduced by RMB68 million (an increase of RMB70 million).
As part of hypothesis may have relevance, a hypothesis cannot be isolated to change, so the sensitivity analysis cannot reflect the actual changes in benefit obligations set value.
In the sensitivity analysis, the end of the reporting period and the confirmation benefit plan of net debt and balance sheet debt related share the same calculation method.
Compared with the previous year, the method for sensitivity analysis and the hypothesis didn’t change.
The consolidated structured entities of the Group are trust products and asset management plans. As the manager of the trusts and asset management plans, the Group should consider whether it has control over the structured entities, and should judge whether the consolidation is needed based on the decision scope of asset manager, power of trust holder, reward from offering management service and the risk exposure of variable profit. In 2015 and 2014, the Group didn’t offer financial support to the consolidated structured entities.
50.2 Unconsolidated structured entities
50.2.1 Structured entities without the scope managed by the Group
The Group initiates and establishes structured entities which offer specific investment opportunities. The Group invests in the structured entities issued by the Group or the independent third party, which offer specific investment opportunities. Such structured entities conduct financing and investing through issuing products. The Group enjoys no control over such structured entities. Therefore, such structured entities are unconsolidated. Up to 31 December, 2015 and 31 December, 2014, the consolidated entities issued by the Group mainly include wealth management products, funds, asset-backed securities, capital trust plans and asset management plans. And the Group earns commission income mainly from offering management service to the investors of these structured entities.
In 2015 and 2014, the Group did not offer financial support to other structured entities excluded from the consolidation scope.
Up to 31 December, 2015 and 31 December, 2014, the information of unconsolidated structured entities initiated by the Group is listed below:
UNIT: RMB Million
The Group
Scale12/31/2015
Scale12/31/2014 Type
Wealth management products 1,045,052 628,007 Commission income
Funds 73,481 14,377 Commission income
Asset-backed securities 29,987 15,049 Commission income
Capital trust plans 908,482 643,494 Commission income
Asset management plans 338,864 179,901 Commission income
Total 2,395,866 1,480,828
In 2015, the commission income earned from offering management service to the investors of these structured entities by the Group is RMB12,066 million (2014:RMB9,577 million).
201
2 0 1 5 ANNUAL REPORT
50.2.2 Equity enjoyed by the Group in structured entities without the scope
To utilize the capital better, the equity enjoyed by the Group in structured entities without the scope in 31 December, 2015 mainly includes wealth management products, funds, asset-backed securities, capital trust plans and asset management plans issued or managed by the Group or individual third parties. The Group earns interest income and investment income mainly through holding these structured entities equities. The Group does not consolidate these structured entities because the Group does not control them.
The Group did not offer financial support to the structured entities above in 2015.
Up to 31 December, 2015 and 31 December, 2014, the information of unconsolidated structured entities initiated by the Group enjoys equity is listed below:
UNIT: RMB Million
The Group
12/31/2015
Financial assets held
under resale
agreement
Financial asset at
fair valuethrough
profit or loss
Available-for-sale
financial assets
Hold-to-maturity
invest-ment
Debt securities
classified asreceivables
Book value
Max risk exposure (Note 1)
Type
Funds - 98,692 23,069 - - 121,761 121,761 Investment income
Total 76,535 100,163 229,548 592 1,646,217 2,053,055 2,053,055
Note 1: Max loss exposure to funds, wealth management products, capital trust plans, asset management plans and asset-backed securities is the amortized cost or fair value recognized in the balance sheet in statement date.
202
UNIT: RMB Million
The Group
12/31/2014
Financial assets held
under resale
agreement
Financial asset at
fair valuethrough
profit or loss
Available-for-sale
financial assets
Hold-to-maturity
invest-ment
Debt securities
classified asreceivables
Book value
Max risk exposure (Note 1)
Type
Funds - 4,389 704 - - 5,093 5,093 Investment income
Total 322,359 5,095 146,930 554 679,279 1,154,217 1,154,217
Note 1: Max loss exposure to funds, wealth management products, capital trust plans, asset management plans and asset-backed securities is the amortized cost or fair value recognized in the balance sheet in statement date.
IX. SEGMENT REPORTINGSenior management of the Group evaluates the operations of the Group in accordance with their economic areas of the respective branches and subsidiaries. Each branch serves its local customers and few customers in other regions. The Group does not deeply depend on one single external customer. Through the review of internal reports, the management of the Group conducts performance evaluation and determines the allocation of resources. Segment reporting is presented in a manner consistent with the Group’s internal management and reports.
Segment accounting policies are consistent with the accounting policies of the consolidated financial statements. Inter-segment transfer transactions are measured at the actual transaction prices.
The Group includes the head office (including the head office and the operating institutions of the head office), Fujian, Beijing, Shanghai, Guangdong, Zhejiang, Jiangsu, northeast and other northern region, western region, central region, a total of ten segments, of which branches within the northeast and other northern region, western region, central region are presented in a consolidated manner.
Among them, the northeast and other northern region includes: Harbin branch, Changchun branch, Shenyang branch, Dalian branch, Tianjin branch, Jinan branch, Qingdao branch Haikou branch, Hong Kong branch and Industrial Bank Financial Leasing Co., Ltd;
Western region includes: Chengdu branch, Chongqing branch, Guiyang branch, Xi’an branch, Kunming branch, Nanning branch, Urumqi branch, Lanzhou branch and Xining branch;
Central region includes: Hohhot branch, Shijiazhuang branch, Zhengzhou branch, Taiyuan branch, Hefei branch, Changsha branch, Wuhan branch and Nanchang branch.
203
2 0 1 5 ANNUAL REPORT
The
Gro
up
2015
Hea
d of
fice
Fujia
nB
eijin
gS
hang
hai
Gua
ngdo
ngZh
ejia
ngJi
angs
u
Nor
thea
st
and
othe
r no
rther
n re
gion
Wes
tern
re
gion
Cen
tral
regi
onE
limin
atio
nsTo
tal
Ope
ratin
g in
com
e55
,861
16,2
297,
465
8,22
69,
184
5,81
16,
930
15,0
1715
,146
14,4
79-
154,
348
Net
inte
rest
inco
me
41,3
9311
,928
5,72
66,
360
7,48
94,
609
5,88
511
,490
12,6
8012
,274
-11
9,83
4
Incl
udin
g: N
et in
ter-
segm
ent
inte
rest
inco
me
(48,
862)
2,77
85,
626
7,12
16,
718
2,08
53,
078
6,70
87,
261
7,48
7-
-
Net
fee
and
com
mis
sion
inco
me
13,5
733,
740
1,38
81,
803
1,63
41,
175
999
3,33
52,
404
2,13
9-
32,1
90
Oth
er in
com
e89
556
135
163
6127
4619
262
66-
2,32
4
Ope
ratin
g ex
pens
es(2
3,99
0)(1
4,24
1)(4
,684
)(2
,568
)(9
,724
)(4
,552
)(3
,672
)(9
,345
)(9
,215
)(9
,547
)-
(91,
538)
Ope
ratin
g pr
ofit
31,8
71 1
,988
2,78
15,
658
(540
) 1
,259
3,2
58 5
,672
5,9
31 4
,932
-62
,810
Add
: Non
-ope
ratin
g in
com
e75
39
12
17
27
13
8 3
06 2
7 3
7 -
561
Less
: Non
-ope
ratin
g ex
pens
es(7
) (4
5)
(3)
(1)
(2)
(18)
(1
1)
(11)
(1
4)
(15)
-
(127
)
Tota
l pro
fit31
,939
1,98
2 2
,790
5,6
74 (5
15)
1,2
54 3
,255
5,9
67 5
,944
4,9
54-
63,
244
Less
: Inc
ome
tax
expe
nses
(12,
594)
Net
pro
fit50
,650
Seg
men
t ass
ets
3,11
2,15
8 4
16,3
86
373
,423
3
97,7
80
506
,037
24
3,90
3 31
9,47
7 77
6,97
6 70
4,48
0 60
3,56
5 (2
,169
,837
)5,
284,
348
Incl
udin
g: In
vest
men
t in
an a
ssoc
iate
1,91
8
Und
istri
bute
d as
sets
14,5
32
Tota
l ass
ets
5,29
8,88
0
Seg
men
t lia
bilit
ies
2,85
9,93
1 4
03,2
02 3
70,4
99 3
91,4
61 5
06,2
40 2
42,6
4931
6,22
2 7
63,9
75 6
98,5
4959
8,61
2 (2
,169
,837
)4,
981,
503
Und
istri
bute
d lia
bilit
ies
-
Tota
l lia
bilit
ies
4,98
1,50
3
Sup
plem
enta
l inf
orm
atio
n
Cre
dit c
omm
itmen
ts92
,358
5
6,23
0 1
4,73
5 2
5,07
0 4
8,35
3 3
2,82
5 7
4,69
1 1
69,6
73
144
,396
17
6,29
2 -
834,
623
Dep
reci
atio
n an
d am
ortiz
atio
n31
7 2
34
98
58
162
8
3 1
29
310
2
19
347
-
1,95
7
Cap
ital e
xpen
ditu
res
614
302
4417
6214
670
244
2072
378
389
-6,
021
UN
IT: R
MB
Mill
ion
204
The
Gro
up
2014
Hea
d of
fice
Fujia
nB
eijin
gS
hang
hai
Gua
ngdo
ngZh
ejia
ngJi
angs
u
Nor
thea
st
and
othe
r no
rther
n re
gion
Wes
tern
re
gion
Cen
tral
regi
onE
limin
atio
nsTo
tal
Ope
ratin
g in
com
e28
,512
1
6,02
1 7
,682
7,7
85
9,5
85
5,2
96 5
,833
1
4,55
2 1
4,60
3 1
5,02
9 -
124,
898
Net
inte
rest
inco
me
16,1
14
12,
516
6,4
85
5,9
62
8,2
03
4,4
82 4
,511
1
1,85
1 1
2,15
4 1
3,28
2 -
95,
560
Incl
udin
g: N
et in
ter-
segm
ent
int
eres
t inc
ome
(26,
770)
(2
41)
5,1
08
6,3
29
1,3
40
(499
) 3
,302
2
,494
3
,150
5
,787
-
-
Net
fee
and
com
miss
ion
inco
me
11,1
70
2,9
70
1,0
20
1,7
64
1,2
87
797
1
,298
2
,615
2
,407
1
,713
-
27,
041
Oth
er in
com
e1,
228
535
1
77
59
95
17
24
86
42
34
- 2
,297
Ope
ratin
g ex
pens
es(1
1,47
2)
(8,6
81)
(2,5
77)
(3,2
58)
(6,5
64)
(5,0
53)
(2,9
99)
(7,4
59)
(6,4
91)
(10,
154)
-
(64,
708)
Ope
ratin
g pr
ofit
17,0
40
7,3
40
5,1
05
4,5
27
3,0
21
243
2
,834
7
,093
8
,112
4
,875
-
60,
190
Add
: Non
-ope
ratin
g in
com
e73
6
1 3
5
7 1
4 1
1 9
2
89
23
31
- 5
71Le
ss: N
on-o
pera
ting
expe
nses
(41)
(2
6)
- (1
6)
(4)
(12)
(5
) (1
1)
(25)
(2
3)
- (1
63)
Tota
l pro
fit17
,072
7
,375
5
,108
4
,568
3
,031
2
42
2,8
38
7,3
71
8,1
10
4,8
83
- 6
0,59
8Le
ss: I
ncom
e ta
x ex
pens
es(1
3,06
8)N
et p
rofit
47,5
30S
egm
ent a
sset
s1,
638,
352
390
,761
3
94,0
06
335
,631
43
9,26
6 2
15,2
85
315,
466
561
,478
5
24,8
99
647,
234
(1,0
67,3
36)
4,39
5,04
2In
clud
ing:
Inve
stm
ent i
n an
ass
ocia
te1,
704
Und
istri
bute
d as
sets
11,3
57To
tal a
sset
s4,
406,
399
Seg
men
t lia
bilit
ies
1,44
8,46
6 3
73,4
12
388
,722
3
30,9
80
436
,236
2
15,0
42
312,
629
547
,922
5
16,7
88
642,
442
(1,0
67,3
36)
4,14
5,30
3U
ndis
tribu
ted
liabi
litie
s-
Tota
l lia
bilit
ies
4,14
5,30
3S
uppl
emen
tal i
nfor
mat
ion
Cre
dit c
omm
itmen
ts60
,712
6
2,80
0 1
6,94
5 2
1,48
3 5
6,67
1 4
3,51
1 6
9,51
4 1
47,6
87
130
,983
17
9,62
2-
789,
928
Dep
reci
atio
n an
d am
ortiz
atio
n28
3 2
00
46
63
191
7
9 1
09
237
1
80
296
-1,
684
Cap
ital e
xpen
ditu
res
665
611
409
1080
272
7350
512
8141
055
1-
5,85
7
UN
IT: R
MB
Mill
ion
205
2 0 1 5 ANNUAL REPORT
X. RELATED PARTY RELATIONSHIP AND TRANSACTIONS1. Related Party RelationshipThe Group
Related parties with no controlling interest
(1) Shareholders holding more than 5% (inclusive) of the Bank’s shares
Name Economic nature
Place ofregistration
Registered capital
Principalactivities
Legalrepresentative
The Finance Bureau of Fujian Province
Legal entity of government
agenciesFuzhou -
Administration ofFujian provincial fiscal
and tax policyChen Xiaoping
Hang Seng Bank Limited(2) LimitedCompany Hong Kong HKD11 billion Financial services Rose Lee
People's Insurance Company of China(1)
IncorporatedCompany Beijing RMB14.829
billion Insurance services Wu Yan
China Life Insurance Company(1)
IncorporatedCompany Beijing RMB25.761
billion Insurance services Wu Yan
China National Tobacco Corporation(1)
Owned by the whole people Beijing RMB57 billion
Production, and sales of tobacco
productsLing Chengxing
Haisheng Investment Management Company of Fujian Tobacco(1)
LimitedCompany Xiamen RMB2.647
billion
Diverse investmentmanagement of Fujian
tobacco commercial system
Huang Xueliang
China Tobacco HunanInvestment ManagementCompany(1)
LimitedCompany Changsha RMB0.2 billion
Diverse investment management of
Hunan tobacco commercial system
Chen Guolian
The People’s Insurance Company (Group) of China Limited(1)
IncorporatedCompany Beijing RMB42.424
billion Insurance services Wu Yan
206
Number of shares held by Shareholders holding more than 5% (inclusive) of the Bank’s shares:
Name of share holders
31/12/2015 12/31/2014
Shares Proportion Shares Proportion
Million Shares (%) Million Shares (%)
The Finance Bureau of Fujian Province 3,402 17.86 3,402 17.86
People's Insurance Company of China(1) 1,229 6.45 948 4.98
China Life Insurance Company(1) 1,276 6.70 948 4.98
China National Tobacco Corporation(1) 614 3.22 614 3.22
Haisheng Investment Management Company of Fujian Tobacco(1) 441 2.32 441 2.32
China Tobacco Hunan Investment Management Company(1) 226 1.19 226 1.19
The People's Insurance Company (Group) of China Limited(1) 174 0.91 174 0.91
Hang Seng Bank Limited(2) 167 0.88 2,070 10.87
Total 7,529 39.53 8,823 46.33
Notes: (1) Relationship between related parties: People’s Insurance Company of China and China Life Insurance Company are both subsidiaries of The People’s Insurance Company (Group) of China Limited. The aggregate proportion is 10.87%. Both Haisheng Investment Management Company of Fujian Tobacco and China Tobacco Hunan Investment Management Company are subsidiaries of China National Tobacco Corporation. The aggregate proportion is 6.73%.
(2) Hang Seng Bank Limited transferred the Bank’s tradable shares held by it through the Shanghai Stock Exchange block trading system in February 2015 and May 2015 for twice, totalled 1,903,316,838 share, representing 9.99% of the total number of ordinary shares of the Bank. After the changes in equity in May 2015, Hang Seng Bank Limited held the Bank’s tradable shares for 167,334,762 shares, representing 0.88% of the total number of ordinary shares of the Bank, which means it is no longer related party for the Group. The related party transactions disclosed are related parties transactions happened before 13 May, 2015, when Hang Seng Bank Limited transferred the Bank’s tradable shares for second time.
(2) Associates
Name of related party Economicnature Domicile
RegisteredCapital
RMB100 million
Principal activities
LegalRepresentative
Bank of Juijiang Co., Ltd. Incorporated Company Jiujiang 15.16 Financial Service Liu Xianting
Chongqing Machinery and Electronics Holding Group Finance Company Limited
LimitedCompany Chongqing 6
Financial andfinancing
consulting serviceWang Yuxiang
CIB Futures Co., Ltd. LLC Ningbo 5
Merchandise, financial futures investment and
consulting Service
Si Bin
Note: In March 2015, China Industrial International Trust Limited invested RMB104 million to buy 40.3% stake of CIB Futures Co., Ltd., representing 70% of the total number of ordinary shares of the Futures company, which made CIB Futures Co., Ltd. become its subsidiary company. The related party transactions disclosed on this report happened before the equity change.
207
2 0 1 5 ANNUAL REPORT
(3) Other related parties
Other related parties includes key management personnel (including directors, supervisors, the senior management personnel of the head office), key management personnel or close family members who have control or joint control of the enterprise and the subsidiary of Hang Seng Bank Limited, Hang Seng Bank (China) Limited.
2. Related party transactionsThe conditions and prices of related party transactions between the Group and the Bank are determined according to the Group’s contract, and are examined and approved in accordance with the transaction type and content of transaction by corresponding decision-making authority.
(1) Interest income
UNIT: RMB Million
Related party 2015 2014
People's Insurance Company of China 30 33
The People's Insurance Company
(Group) of China Limited 79 79
China Life Insurance Company 13 12
Bank of Jiujiang Co., Ltd. 19 76
China National Tobacco Corporation 8 -
Chongqing Machinery and Electronics Holding Group Finance Company Limited 14 526
Total 163 726
(2) Interest expense
UNIT: RMB Million
Related party 2015 2014
The Finance Bureau of Fujian Province 209 400
Hang Seng Bank Limited 9 21
Hang Seng Bank (China) Limited - 29
People's Insurance Company of China 50 34
China Life Insurance Company - 2
China National Tobacco Corporation 994 672
Haisheng Investment Management Company of Fujian Tobacco 35 44
China Tobacco Hunan Industrial Corporation - 1
Bank of Jiujiang Co., Ltd. 7 18
Chongqing Machinery and Electronics Holding Group Finance Company Limited 8 16
CIB Futures Co., Ltd. 1 2
Total 1,313 1,239
208
(3) Net fee and commission income
UNIT: RMB Million
Related party 2015 2014
Bank of Jiujiang Co., Ltd. 5 8
(4) Fee and commission expenses
UNIT: RMB Million
Related party 2015 2014
Chongqing Machinery and Electronics Holding Group Finance Company Limited - 1
(5) General and administrative expenses-insurance
UNIT: RMB Million
Related party 2015 2014
People's Insurance Company of China 143 232
In 2015, the Bank was paid RMB13 million in compensation from People’s Insurance Company of China (2014:RMB205 Million).
(6) Acquire other equity instruments issued by the Bank – preferred stock
UNIT: RMB Million
Related party 2015 2014
The Finance Bureau of Fujian Province - 2,500
3. Unsettled amount of related party transactionsNote: As at 31 December, 2015, Hang Seng Bank Limited only took 0.88% of the ordinary shares of the Bank, lower than 5%. So, Hang Seng Bank Limited will no longer be the related party of the Group. We do not have to disclose the year-end outstanding items of Hang Seng Bank Limited and Hang Seng Bank (China) Limited.
(1) Amount due from banks
UNIT: RMB Million
Related party 12/31/2015 12/31/2014
Hang Seng Bank Limited Note 18
209
2 0 1 5 ANNUAL REPORT
(2) Derivative financial instruments
UNIT: RMB Million
Related party Transaction Type 12/31/2015 12/31/2014
Nominal amount
Assets/Liabilities
Nominal amount
Assets/Liabilities
Hang Seng Bank (China) Limited InterestRate Derivative Note Note 4,070 (4)
Hang Seng Bank (China) Limited ExchangeRate Derivative Note Note 7,747 3
Hang Seng Bank Limited ExchangeRate Derivative Note Note 11,207 (8)
China Life Insurance Company Interest Rate Derivative 730 (5) 1,300 (5)
Total 730 (5) 24,324 (14)
(3) Financial assets held under resale agreements
UNIT: RMB Million
Related party 12/31/2015 12/31/2014
Bank of Jiujiang Co., Ltd. - 1,658
Chongqing Machinery and Electronics Holding Group Finance Company Limited - 3,362
Total - 5,020
(4) Interest receivable
UNIT: RMB Million
Related party 12/31/2015 12/31/2014
People's Insurance Company of China 5 5
The People's Insurance Company (Group) of China Limited 43 43
Bank of Jiujiang Co., Ltd. - 22
Chongqing Machinery and Electronics Holding Group Finance Company Limited - 78
China National Tobacco Corporation 8 -
Total 56 148
210
(5) Investment classified as receivables
UNIT: RMB Million
Related party 12/31/2015 12/31/2014
People's Insurance Company of China 450 450
China Life Insurance Company 200 200
The People's Insurance Company (Group) Of China Limited 1,600 1,600
Total 2,250 2,250
All the investment classified as receivables are the bonds issued by the above-mentioned related parties.
(6) Loans and advances to customers
UNIT: RMB Million
Related party 12/31/2015 12/31/2014
Key management personnel and their close relatives 12 9
China National Tobacco Corporation 7,600 -
Total 7,612 9
(7) Amount due to banks and other financial institution
UNIT: RMB Million
Related party 12/31/2015 12/31/2014
Hang Seng Bank Limited Note 29
Hang Seng Bank (China) Limited Note 330
Bank of Jiujiang Co., Ltd. 22 15
Chongqing Machinery and Electronics Holding Group Finance Company Limited 225 84
CIB Futures Co., Ltd. 645 773
Total 892 1,231
(8) Financial assets held under resale agreements
UNIT: RMB Million
Related party 12/31/2015 12/31/2014
Bank of Jiujiang Co., Ltd. - 1,034
211
2 0 1 5 ANNUAL REPORT
(9) Amount due to customers
UNIT: RMB Million
Related party 31/12/2015 31/12/2014
The Finance Bureau of Fujian Province 9,321 17,433
China Life Insurance Company 3 120
People's Insurance Company of China 874 5,869
China National Tobacco Corporation 34,612 29,126
Haisheng Investment Management Company of Fujian Tobacco 712 739
China Tobacco Hunan Industrial Corporation 128 102
Chongqing Machinery and Electronics Holding Group Finance Company Limited 107 81
Key managers and their close relatives 9 14
Total 45,766 53,484
(10) Interest payable
UNIT: RMB Million
Related party 12/31/2015 12/31/2014
The Finance Bureau of Fujian Province 1 261
Hang Seng Bank (China) Limited Note 15
People's Insurance Company of China 53 23
China Life Insurance Company 1 -
China National Tobacco Corporation 701 402
Haisheng Investment Management Company of Fujian Tobacco 28 35
Total 784 736
(11) Credit facility
UNIT: RMB Million
Related party 12/31/2015 12/31/2014
Hang Seng Bank Limited & Hang Seng Bank (China) Limited Note 3,000
The People's Insurance Company (Group) of China Limited & its subsidiaries 5,000 5,000
China National Tobacco Corporation and its subsidiaries 8,500 8,500
Total 13,500 16,500
4. Key management personnel remunerationUNIT: RMB Million
2015 2014
Salary and welfare 17 40
212
XI. CONTINGENCIES AND COMMITMENTS 1. Pending LitigationsOn balance sheet date, the Group’s management considers that there is no pending litigation which has a significant impact on the financial statements that needs to be disclosed.
2. Off-balance sheet itemsUNIT: RMB Million
The Group and the Bank
Contractual amount
12/31/2015 12/31/2014
Credit card commitments 92,357 60,712
Letters of credit 111,547 160,142
Letters of guarantee 132,130 118,160
Bank acceptances 498,589 450,914
Total 834,623 789,928
In addition, the Group also provides credit facilities to specific customers. According to the management’s opinion, since such credit facilities are conditional and can be canceled, the Group is not committed to these customers for the credit risk of the unused facilities.
3.Capital commitmentsUNIT: RMB Million
Contractual amount of the Group Contractual amount of the Bank
12/31/2015 12/31/2014 12/31/2015 12/31/2014
Authorized but not contracted for - 2 - 2
Contracted but not paid for 2,402 2,716 2,381 2,715
Total 2,402 2,718 2,381 2,717
213
2 0 1 5 ANNUAL REPORT
4. Operating lease commitmentsAs a tenant, according to the non-cancellable lease contracts, the required minimum lease payments by the Group and the Bank are as follows:
UNIT: RMB Million
The Group The Bank
12/31/2015 12/31/2014 12/31/2015 12/31/2014
Within one year 2,312 1,740 2,247 1,633
One to five years 5,744 4,725 5,630 4,688
Over five years 536 1,662 536 1,662
Total 8,592 8,127 8,413 7,983
5.Collateral5.1 Assets pledged
(i) The carrying amount of assets pledged as collateral under repurchase agreements is as follows:
UNIT: RMB Million
The Group The Bank
12/31/2015 12/31/2014 12/31/2015 12/31/2014
Bonds 43,657 81,188 43,657 81,188
Bills 8,036 19,864 8,036 19,864
Others - 519 - -
Total 51,693 101,571 51,693 101,052
As at 31 December, 2015, in the Group and the Bank’s purchased bills under resale agreement, the amount for sold for repurchase is RMB3,656 million (31 December, 2014:RMB18,279 million)
(ii) On 31 December, 2015, the Group and the Bank pledged RMB853 to credit derivative transaction (31 December, 2014: nil).
214
5.2 Collateral obtained
In the resale agreement, if the counterparty of the transaction has not violated the contractual terms, the Group can sell some of the pledged assets or transfer the pledged assets in other transactions. The fair value of the pledged assets available for sale and available for pledge on 31 December, 2015 is RMB97,839 million. (31 December, 2014:RMB366,673 million).
6. Transfer of financial assets6.1 Asset-backed securities
The Bank carries out asset-backed securities transactions in the normal course of business. The Bank will sell part of credit assets to a special purpose trust, then the special purpose trust will issue asset-backed securities to investors.
The book value of credit assets which have been securitized by the Bank in 2015 amounted to RMB32,659 million(2014:RMB15,049 million) on the transfer day. As of 31 December, 2015, the book value of the asset-backed securities held by the Group and the Bank is RMB5,863 million(31 December, 2014:RMB625million).
In the above procedure of transferring financial assets, because the issue price is same as the carrying amount of the transferred financial assets’ book value, the Bank does not recognize profit or loss in these financial assets transferred process, the Bank will charge a service fee as a loan provider during the follow-up. Although the Bank establishes the special purpose trust as cosponsors, the Bank neither has authority to obtain most benefits of a special purpose trust, nor bear most risk of a special purpose trust, hence the Bank won’t merge these special purpose trusts, which means special purpose trust that is not an integral part of the Group.
The Bank transfers related financial assets, and transferred substantially all the risks (including part credit risk of the transferred credit assets, prepayment risk and interest rate risk) and rewards to other investors, therefore related financial assets are derecognized.
The Bank loses the right to use the related credit assets during the transferring of asset-backed securities transactions to credit assets. Once the special purpose trust is established, the Bank should distinguish it from other property that the Bank has not established trust. According to the relevant transaction documents, when the Bank dismisses in accordance with law, be liquidated in accordance with law or declared bankrupt, the trust property will not be liquidated as liquidated property.
6.2 Repurchase agreements
Repurchase agreements refer to agreements made by the Group and the counter-parities that financial assets (or financial assets that share the same substance) are settled a fixed price of repurchasing when they are sold at a fixed date. Due to the fixed repurchasing price, the Group shoulders almost all the credit and market risks and benefit of the assets. The sold financial assets (cannot be used within the period) should not be recognized in the financial statement, but should be regarded as guarantees because the Group retains all the risks and returns. Besides, the Group recognizes the financial liabilities by the price received. In these trading, the counter-parties’ right to the Group is not limited within the transferred financial assets.
In 31 December, 2015 and 31 December, 2014, the Group conducted trading of the equities, bills, and financial assets sold under repurchase agreements. The price of selling these financial assets is called financial assets sold under repurchase agreements price (Note VIII, 23).
215
2 0 1 5 ANNUAL REPORT
Book value:
UNIT: RMB Million
The Group
12/31/2015 12/31/2014
Equity Bill Others Equity Bill Others
Assets book value 43,657 8,036 - 81,188 19,864 519
Liabilities book value 39,980 8,036 - 78,188 19,864 519
UNIT: RMB Million
The Bank
12/31/2015 12/31/2014
Equity Bill Others Equity Bill Others
Assets book value 43,657 8,036 - 81,188 19,864 -
Liabilities book value 39,980 8,036 - 78,188 19,864 -
7. Redemption commitment of certificate government bonds and saving government bonds(1) The Group entrusted by the MOF as its agent issues certificate government bonds and saving government bonds. Holders of certificate government bonds and saving government bonds can require advance redemption, and the Group has the obligation to execute the redemption responsibility. Redemption amount for the certificate government bonds and saving government bonds includes principal and interest payable till redemption date.
As of 31 December, 2015 and 31 December, 2014, the cumulative principal balances of the certificate government bonds and saving government bonds which are issued by the Group under trust prior to maturity and not been paid are as follows:
UNIT: RMB Million
The Group and the Bank
Contractual amount
12/31/2015 12/31/2014
Certificate government bonds and saving government bonds 2,989 2,940
The Group believes the Group’s redemption amount of these certificate government bonds and saving government bonds is not significant before their maturity.
(2) The Group has no announced but unissued bonds underwriting amount on 31 December, 2015 and 31 December, 2014.
216
8. Fiduciary BusinessUNIT: RMB Million
The Group and the Bank
12/31/2015 12/31/2014
Fiduciary deposits and loans 640,795 580,572
Fiduciary wealth management 1,045,052 628,007
Fiduciary investment 49,717 12,944
Fiduciary deposits and loans are deposits and loans that depositor designated specific third party as the loan party, and related credit risk of the loan is borne by depositors who designated borrowers.
Fiduciary wealth management refers to a kind of service that the entrusted Group is responsible for the operation and management of customer assets. The investment risk of fiduciary wealth management is borne by the trustee.
Fiduciary investment refers to a kind of service that the entrusted Group engaged in capital operation, investment management, investment advisory and other investment services based on the principal-agent relationship. The investment risk of fiduciary investment is borne by the trustee.
XII. OTHER SIGNIFICANT EVENTS1. Assets and liabilities measured at fair value
UNIT: RMB Million
The Group
2015
Opening Balance
Profit or loss arising from
changes in fair value for the
period
Changesin fair value recognised
in equity
Provision for impairment
losses in thecurrentperiod
ClosingBalance
Financial assets at fair value through profit or loss 44,435 (109) - - 128,685
(1) Financial liabilities include amount due to Central Bank, amount due to banks and other financial institutions, placement from banks and other financial institutions, financial liabilities at fair value through profit or loss, financial assets sold under repurchase agreements, derivative financial liabilities, due to customers and debt securities issued, etc.
(2) The items of assets and liabilities listed on the above tables have no inevitable relationship.
219
2 0 1 5 ANNUAL REPORT
XIII. FINANCIAL RISK MANAGEMENT 1. OverviewThe Group is exposed to various types of risks due to its financing businesses including banking business. The Group identifies, assesses and monitors various risks on an on-going basis. The most significant types of risk to which the Group is exposed are credit risk, market risk, liquidity risk and operation risk. Market risk includes interest rate risk, foreign currency risk and other price risk.
The Group's risk management objectives are to achieve a proper balance between risks and benefits and run business safely and prudently under reasonable level of risk.
2. Risk management frameworkRisk management is the basic safeguard of survival and development of commercial banks. The Group has taken risk management as one of its core competitiveness, formulated development strategy focus on business operation as well as risk management, established risk control system with a core of risk asset management, set up risk management rules and operation regulations for each business sector, improved risk accountability and punishment mechanism. The Group has integrated credit risk, market risk, liquidity risk, operational risk and other risk into the overall risk management, clarified specific responsibility of Board of Directors, Board of Supervisors, senior management and operation executives, formed a defined, clear and effective overall risk management system. In daily risk management work, the Group’s business sector, risk management department and internal audit department build up the “three defences”; they perform their respective functions and work together to achieve the objective of risk management. Among them, operation institutions and business sector form the first line of defences to conduct risk management according to the risk management rules and policies. Operation institutions take precautions against all the business and operating risk, while business sector is in charge of making its risk management policy, evaluating the effectiveness of risk management regularly and taking corrective actions if necessary. The risk management department is the second line of defences, which is responsible for the constitution of the Group’s risk management strategy, policy, regulations and process, and supervision of the execution. Meanwhile, the risk management department is responsible for the identification, evaluation and supervision of the risk that the Group faces, assessing the Group’s risk condition periodically, taking measures for continuously improvement, pushing forward the outspread of overall risk management work. The internal audit department is the third line of defences. It provides independent, objective supervision, evaluation and consultation to the Group’s risk management, provides post-event risk management assessment and feedback adjustment.
3. Credit riskCredit risk represents the potential loss that may arise from a customer or counterparty’s failure to meet its obligation. Credit risk can also arise from operational failures that result in an unauthorised or inappropriate advance, commitment or investment of funds. The Group’s major credit risks come from loans and receivables (enterprises and personal credit loans), treasury operations (including creditors’ investment) and off-balance sheet related credit risk exposures. The Group manages and controls credit risk according to the following processes: customer investigation before granting of credit limits, credit review and approval and post-disbursement loan monitoring and collection.
The Group establish the risk management department, which is responsible for organizing, implementing the credit risk management strategies and policies of the Group, it is also responsible for making basic rules for the Group risk management affairs, in addition, it is also professionally managing, evaluating, guiding the general operation of the Group risk management together with inspecting and supervising the activities mentioned above. As the leading party, the risk management department formulates unified standards, responsible for the credit management on the whole. All the actions taken are to ensure the overall credit risk under control. The Group set up risk management
220
department and professional risk management desk in all the three major lines called enterprise financial line, retail banking line and financial markets line. Each of the risk departments is responsible for the credit management in its own line or professional operating department, and it is also responsible for making detailed regulation and operating rules and approving projects within the approving authority. The Group also sets up several specialized committees such as Credit Approval Committee and Credit Accountability Committee. The first one is responsible for the examination and approval of the loans within the authority. The other one is responsible for determining the responsibility of related loans.
The Group has formulated a whole set of credit policies on approval process and management procedure, and implemented throughout the Group. The credit management procedure for corporate and personal loans can be classified as credit investigation, credit examination, credit approval, credit disbursement, and post disbursement monitoring and recovery process. In addition, the Group issued Due Diligence of Credit approval to clarify the duties of different positions, to effectively control the credit risk, and to strengthen compliance of credit business.
The Group set up detailed rules for implementing of credit policy, which intensified the credit support for the real economy. In accordance with the discriminative credit policy of "protecting, controlling, and pressing", the Group also goes along with the policy that "speeds up the transforming of economy development mode, intensifies the adjustment of economic structure, and ties to the core spirit of protecting & improving the people's livelihood". The Group accurately understands the credit layout of mainstream business, give more financial support to related entities in key industry or field, strengthen the credit management over the industries that involves in "high contaminative, high level of energy consumption, and industries over capacities" .The Group compresses and gradually withdraws projects that belong to the restrictive and eliminative list of backward production capacity, and continue to promote the structure optimization and adjustment of credit assets.
The Group has established a customer credit rating system which comprehensively and systematically investigated various factors and variation trends that influence customer solvency in future; disclosed and evaluated customers’ credit risks and capabilities based on qualitative and quantitative analysis. Credit rating results become an important foundation to draw up credit service polices, adjust and optimize client structure, as well as identify credit service of individual customer. The Group has developed and established the non-retail section of internal rating system according to the Basel New Capital Accord and the relevant guidelines of CBRC, the accomplishment is put into practice in risk management such as business authorization, quota management and development of client to enhance the ability of credit risk identification, estimation and control, credit risk weighted assets measurement system is developed completely and got on-line in January 2014, the Group has the ability to follow the measurement method IRB credit risk-weighted assets in 2015. As the new agreement related capital projects are completed, the Group's capacity of credit risk identification, measurement and control capability has been further improved.
The Group strengthens the monitoring and warning of credit operations by drawing up Corporate Customer Risk Warning Regulations and Personal Credit Risk Warning Regulations, so that a variety of credit risk information can be accessed through internal and external sources. Also, warnings would be notified and relevant procedures would be carried out to prevent and overcome risks. Besides, the Group develops the credit management information system to provide management information and advices 24/7 to detect and prevent the credit risk through conducting dynamic monitoring, real-time warning and pre-controlling of customer operation status and credit assets status of the Group.
The Group properly handled the relations between risk management and business development, fully took advantages of internal credit rating results to formulate limitations on credit facility amount and strengthen the restriction function of the limitation and took them into practice to reconcile customer structure adjustment. Setting limitations on credit facility amount to ensure effective allocation of credit resources and prevent excessive concentration of credit loans.
The Group accurately identified risks conditions of credit asset, reasonably reflected the income after risk adjustment to guide capital allocation optimization in operation institutions and allocation of credit resources to strengthen risk
221
2 0 1 5 ANNUAL REPORT
awareness in operation institutions. Therefore, Credit Asset Risks Classification Implementation Method and Credit Asset Risks Classification Implementation Standards and others have been established to make sure branches adjust credit asset risks classification according to real conditions of projects. Based on 5 levels classified by CBRC, the Group has classified its credit asset risks into nine levels as level one (normal), level 2 (normal), level 3 (normal), level 4 (attention), level 5 (attention), level 6 (attention), sublevel, doubtful and loss. The Group has various management policies to each level.
Risks arising from credit commitments are similar to risks of loans and advances to customers in substance. Therefore, requirements for application, post-loan management and pledge and guarantees are the same with those in loans and advances to customers.
3.1 Concentration of credit risk
Concentration of credit risk exists when changes in geographic, economic or industry factors similarly affect groups of counterparties whose aggregate credit exposure is material in relation to the Group's total exposures. The Group's portfolio of financial instrument is diversified along geographic, industry and product sectors.
The Group operates the lending business in the PRC mainland only. Since there are different economic development characteristics in the different regions in China, the characteristics of credit risks are also different.
For the geographical and industrial concentration of the loans and advances to customers please refer to Note VIII 8.
3.2 Maximum exposure to credit risk
Despite any usable guarantee or pledge, and other credit enhancement measures, the max credit risk exposure that the Group and the Bank can afford in balance sheet date is the related financial assets (including derivative instrument and deducted equity instrument) plus the amount of off-balance sheet book value in Note XI 2. Up to 31 December, 2015, the max credit risk exposure: the Group:RMB5,920,510 million (31 December, 2014:RMB5,146,359 million), the Bank:RMB5,803,461 million (31 December, 2014:RMB5,062,261 million).
222
3.3 Analysis of exposure to credit risk of the Group and the Bank about loans and advances to customers, inter-bank placement, investment and finance lease receivables
Provision for impairment (6,581) (89) (811) (149) (7,630)
Net value of assets 7,906 - 860 250 9,016
Collective assessment
Total assets 3,057 - - - 3,057
Provision for impairment (1,599) - - - (1,599)
Net value of assets 1,458 - - - 1,458
Past due but not impaired:
Total assets 18,540 - - - 18,540
Including:
Within 90 days 16,474 - - - 16,474
90 to 360 days 1,767 - - - 1,767
360 days to 3 years 299 - - - 299
Provision for impairment (3,136) - - - (3,136)
Net value of assets 15,404 - - - 15,404
Neither past due nor impaired:
Total assets 1,557,064 864,726 1,358,183 59,440 3,839,413
Provision for impairment (32,580) - (6,062) (1,436) (40,078)
Net value of assets 1,524,484 864,726 1,352,121 58,004 3,799,335
Total of net value of assets 1,549,252 864,726 1,352,981 58,254 3,825,213
224
UNIT: RMB Million
The Bank
12/31/2015
Loans and advancesto customers
Inter-bankplacement(1) Investment(2) Total
Impaired:
Individual assessment
Total assets 21,579 89 4,794 26,462
Provision for impairment (11,297) (89) (1,561) (12,947)
Net value of assets 10,282 - 3,233 13,515
Collective assessment
Total assets 4,379 - - 4,379
Provision for impairment (2,082) - - (2,082)
Net value of assets 2,297 - - 2,297
Past due but not impaired:
Total assets 23,012 9,117 2,428 34,557
Including:
Within 90 days 20,678 2,139 2,428 25,245
90 to 360 days 2,134 3,979 - 6,113
360 days to 3 years 200 2,999 - 3,199
Provision for impairment (3,672) - - (3,672)
Net value of assets 19,340 9,117 2,428 30,885
Neither past due nor impaired:
Total assets 1,728,202 317,391 2,466,146 4,511,739
Provision for impairment (37,454) - (11,166) (48,620)
Net value of assets 1,690,748 317,391 2,454,980 4,463,119
Total of net value of assets 1,722,667 326,508 2,460,641 4,509,816
225
2 0 1 5 ANNUAL REPORT
UNIT: RMB Million
The Bank
12/31/2014
Loans and advancesto customers
Inter-bankplacement(1) Investment(2) Total
Impaired:
Individual assessment
Total assets 14,487 89 1,671 16,247
Provision for impairment (6,581) (89) (811) (7,481)
Net value of assets 7,906 - 860 8,766
Collective assessment
Total assets 3,057 - - 3,057
Provision for impairment (1,599) - - (1,599)
Net value of assets 1,458 - - 1,458
Past due but not impaired:
Total assets 18,540 - - 18,540
Including:
Within 90 days 16,474 - - 16,474
90 to 360 days 1,767 - - 1,767
360 days to 3 years 299 - - 299
Provision for impairment (3,136) - - (3,136)
Net value of assets 15,404 - - 15,404
Neither past due nor impaired:
Total assets 1,557,164 863,027 1,347,348 3,767,539
Provision for impairment (32,579) - (6,062) (38,641)
Net value of assets 1,524,585 863,027 1,341,286 3,728,898
Total of net value of assets 1,549,353 863,027 1,342,146 3,754,526
(1) Inter-bank placement includes amount due from banks and other financial institutions, placements with banks and other financial institutions and financial assets sold under repurchase agreements.
(2) Investment includes financial assets at fair value through profit or loss, available-for-sale financial assets, held-to-maturity investments and debt investment of debt securities classified as receivables.
226
3.4 Collateral and other credit enhancements
The amount and type of collateral required depend on the assessment of the credit risk of the counterparty. The pledge rate depends on the credit information, operation and management, and financial position of pledgers, the condition of collateral, the market price, the pledged periods, and the convertibility of collateral. In addition, the Collateral Guideline of the Group set an upper limit of the pledged rate. Furthermore, the Group classifies and manages collateral by the difficulty of appraisal and management, the stability of market price and the convertibility of collateral. Following are the main types of collateral:
● For reverse repurchase agreements, collateral mainly includes bills, loans and securities
● For commercial loans, collateral mainly includes land, properties, equipment and shares, etc.
● For retail loans, collateral mainly includes properties
The management will monitor the market value of the collateral, ask the borrowers to increase collateral if necessary according to the agreements and monitor the change in the market value of the collateral when reviewing the adequacy of impairment.
3.5 Analysis of collateral value
3.5.1 The Group evaluates the fair value of collateral periodically
1) As at 31 December, 2015, the fair value of collateral that related to loans past due but not impaired amounted to RMB26,394 million (31 December, 2014:RMB22,631 million). The collateral includes land, properties, equipment and shares assets etc.
2) As at 31 December, 2015, the fair value of collateral that related to loans individually assessed to be impaired amounted to RMB14, 923 million (31 December, 2014:RMB8,811 million). The collateral includes land, properties, equipment and shares assets.
3.5.2 The book value of foreclosed assets the Group obtained during 2015 amounted to RMB475 million (2014:RMB63 million).
3.6 Rescheduled loans
Reschedule including the extension of payment time, approval of external management plans and modification and extension of payment. After rescheduling, the customers who were overdue are now back to normal and managed with other similar customers. Rescheduled policies are made under the criteria of local management's judgement that the payment is highly possible to continue. These policies' appliance should be checked constantly. As at 31 December, 2015, the carrying amount of rescheduled loans and advances to customers amounted to RMB17,808 million (31 December, 2014:RMB7,660 million). The carrying amount of rescheduled loans and advances to customers past due over 90 days amounted to RMB1,729 million (31 December, 2014:RMB118 million).
4. Market riskMarket risk is the risk of loss, in respect of the Group’s on and off-balance sheet activities, arising from movements in market rates including interest rates, foreign exchange rates, commodity prices and stock prices. Market risk arises from both the Group’s proprietary and customer driven business. The Group’s market risk management objective is to control the market risk within a reasonable scope in order to achieve the optimal risk adjusted benefit.
227
2 0 1 5 ANNUAL REPORT
According to the Group’s market risk management structure, market risk management is critical for the management of the Group’s assets and liabilities. Any major events should be reported to the Asset and Liability Management Committee for review and then authorized by President of the Bank. The planning and financial department is responsible for implementing the Group’s asset and liability management policy, analyzing and monitoring the implementation status of each type of indicators.
For daily control and management of treasury business, the risk management department of the treasure center built up mid-stage risk control system to carry out an implanting risk management and report to the risk management department of the Group.
4.1 Interest rate risk
The interest rate risk of the Group includes repricing risk, yield curve risk, benchmark risk and optional risk, among which repricing risk is the main risk. It is the risk arising from the mismatch between the agreed maturity date (fixed interest rate day) and the repricing date (floating interest rate) of interest bearing assets and interest payment liabilities. Currently, the Group has fully carried out the internal capital transfer pricing. The Group determined the transfer pricing by different products and terms, and gradually centralized the interest rate risk to the Head Office, so as to improve the efficiency of management and control the interest rate risk.
For the interest risk management of bank accounts, the Group mainly evaluates the interest rate risk of balance sheet through gap analysis. The Group dynamically monitors and controls the interest rate sensitive gap of balance sheet through information systems like assets-liabilities management system, and simply calculates the interest rate sensitivity affected by revenue and economic value on the basis of gap analysis. The revenue analysis emphasizes on the effect of the interest rate fluctuation on short-term income, while the economic value analysis emphasizes on the effect of the interest rate fluctuation on present value of net cash flow.
For the interest risk management of transaction accounts, the Group mainly achieves the real-time monitoring of the interest rate risk of the trading accounts through the quota system, the use of financial transactions and analysis system and the scientific exposure measurement models. According to regulatory requirement, the Group has strengthened the management of market risk measurement models, standardized the developing, testing and commissioning process, and built on regular evaluation mechanisms to ensure the accuracy of measurement models. The Group applies the on-line trading and analysis system to timely measure and control the interest rate risk exposure of transaction accounts, which provides effective technical support to control the interest rate risk of transaction accounts.
228
At the balance sheet date, an analysis of contractual reprising date or maturity date, whichever is earlier, of the financial assets and liabilities are as follows:
UNIT: RMB Million
The Group
12/31/2015
Within 3 months
3-12months
1-5years
Over 5years
Non-interestbearing Total
Financial assets:
Cash and balances with Central Bank 401,804 - - - 16,107 417,911
Amount due from banks and other financial institutions 29,243 11,546 1,558 - - 42,347
Placements with banks and other financial institutions 29,670 26,166 500 - - 56,336
Financial assets at fair value through profit or loss 4,887 14,523 8,089 1,850 99,336 128,685
Derivative financial assets - - - - 13,933 13,933
Financial assets held under resale agreements 169,762 40,145 16,017 - - 225,924
Loans and advances to customers 892,259 747,322 78,319 6,922 - 1,724,822
Total financial liabilities 2,734,534 795,675 300,572 41,114 186,095 4,057,990
Net position (607,199) 372,840 377,726 216,264 (134,259) 225,372
232
The following tables illustrate the potential impact of a parallel upward or downward shift of 100 basis points in all currencies’ yield curves on the Group’s net interest income and other comprehensive income, based on the Group’s positions of financial assets and liabilities at the balance sheet date.
UNIT: RMB Million
The Group
12/31/2015 12/31/2014
Net interestincome
increase(decrease)
Other comprehensiveincome
increase(decrease)
Net interestincome
increase(decrease)
Other comprehensiveincome
increase(decrease)
+100 basis points (1,880) (4,070) 4,645 (5,571)
- 100 basis points 1,880 4,321 (4,645) 5,903
UNIT: RMB Million
The Bank
12/31/2015 12/31/2014
Net interestincome
increase(decrease)
Other comprehensiveincome
increase(decrease)
Net interestincome
increase(decrease)
Other comprehensiveincome
increase(decrease)
+100 basis points (2,337) (4,047) 4,384 (5,532)
- 100 basis points 2,337 4,297 (4,384) 5,861
The sensitivity analysis on net interest income is based on reasonably possible changes in interest rates with the assumption that the structure of financial assets and financial liabilities held at the period end remains unchanged.
The sensitivity analysis on other comprehensive income is the effect on changes of fixed rate available-for-sale financial assets at the period end after adjusting in accordance with the reasonably possible changes in interest rates.
The above prediction assumes that all yield curves of assets and liabilities, except demand deposit, shift upward or downward parallel. Therefore it does not reflect the potential impact of non-parallel shift in yield curves. The prediction also assumes that all positions are held to maturity. The Group anticipates that the amount of sensitivity analysis is insignificant if a position is not held to maturity.
The assumption does not represent the group’s capital and interest rate risk management policy. Therefore the above analysis may differ from the actual situation.
In addition, the impact of interest rate fluctuation is only for illustrating purpose, showing the anticipated net interest income and other comprehensive income of the Group under the current interest rate risk situation. And such impact has not taken into account the potential interest rate risk control activities carried out by the management.
233
2 0 1 5 ANNUAL REPORT
4.2 Foreign currency risk
The Group conducts its businesses mainly in RMB, with certain businesses denominated in USD and other currencies. RMB is the functional currency. The foreign exchange rate is regulated by the PBOC.
The Group is mainly exposed to currency risk resulting from currency mismatches of assets and liabilities, foreign currency transactions and foreign currency capital, etc.
The financial market department of the Bank centrally manages the currency risk. The currency risk that arises from all types of foreign exchange transactions at the branch level should be centralized to head office to manage the risk exposure and squares positions through the core business system.
The currency risk exposure between foreign currencies is managed on the basis of “overnight position limit” and “day time self-trading positions”. The positions are centralized to the financial market department in a timely way and managed centrally. This kind of position is relatively small compared to the Group’s asset scale and is controllable.
Regarding the currency risk exposure between RMB and foreign currencies, the Group is mainly exposed to currency risk resulting from the comprehensive positions of the RMB market maker and the position of the foreign currency capital. As an active RMB market maker, the Group controls the position limit properly. The comprehensive positions of the market maker are managed close to zero and the overnight positions are kept at low level.
234
The following tables are the structure analysis of the relevant financial assets and liabilities by currency.
UNIT: RMB Million
The Group
12/31/2015
RMB USD RMB equivalent
Other currenciesRMB equivalent Total
Financial assets:
Cash and balances with Central Bank 405,339 11,255 1,317 417,911
Amount due from banks and other financial institutions 23,116 16,796 2,435 42,347
Placements with banks and other financial institutions 45,265 11,071 - 56,336
Financial assets at fair value through profit or loss 124,536 4,105 44 128,685
Financial assets sold under repurchase agreements 97,884 168 - 98,052
Amount due to customers 2,119,010 142,722 6,048 2,267,780
Debt securities issued 182,924 2,151 712 185,787
Other liabilities 172,421 2,694 139 175,254
Total financial liabilities 3,856,839 191,058 10,093 4,057,990
Net position 288,964 (63,864) 272 225,372
238
The table below indicates the potential effect of an appreciation or depreciation of RMB spot and forward exchange rate against all other currencies by 5% on the foreign exchange gains or losses.
UNIT: RMB Million
The Group
2015 2015
Foreign exchangeincrease/(decrease)
Foreign exchangeincrease/(decrease)
5% appreciation (287) 415
5% depreciation 287 (415)
UNIT: RMB Million
The Bank
2015 2014
Foreign exchangeincrease/(decrease)
Foreign exchangeincrease/(decrease)
5% appreciation (230) 375
5% depreciation 230 (375)
The above sensitivity analysis is measured on the basis that all assets and liabilities have a static currency risk structure. The relevant assumptions are:
(1) The exchange rate sensitivity represents the exchange gains or losses arisen from a 5% change of the closing exchange rates (middle price) of the different foreign currencies against RMB at the balance sheet date;
(2) The exchange rate changes of different foreign currencies against RMB move in the same direction simultaneously.
The effect on foreign exchange gains or loss is based on the assumption that the Group’s net positions of foreign exchange sensitivity and foreign exchange derivative instruments at the end of the reporting period remain unchanged. The Group mitigates its foreign currency risk through active management of its foreign currency exposures and appropriate use of derivative instruments, based on the management expectation of future foreign currency movements, and therefore the above sensitivity analysis may differ from the actual situation.
4.3 Other price risk
Other price risk mainly derives from equity investment, held-for-trading precious metals investment and other bonds and derivatives linked to commodity price.
The Group considers that the market risk of commodity price or stock price from portfolio is insignificant.
239
2 0 1 5 ANNUAL REPORT
5. Liquidity riskLiquidity risk refers to the risk of being unable to acquire sufficient funds in time or failing to acquire sufficient funds at a reasonable cost to meet repayment obligations for asset growth or other business. The Group's liquidity risk mainly derives from advanced or concentrated withdrawal, principal-guaranteed wealth management products redemption, deferred loan repayment and mismatches of assets and liabilities.
The assets and liabilities management committee of the Group monitors and manages the liquidity risk of the Group. The committee will determine the liquidity risk management strategy, the monitoring indicators and the alarming index, regularly analyse and discuss the liquidity risk assessment report submitted, and determine the liquidity risk management measures.
The financial planning department is responsible for: (1) drafting liquidity risk management policies and measures; (2) monitoring different types of liquidity ratios and exposure indicators. The planning and financial department monitors the liquidity risk ratios monthly by reviewing the assets’ and liabilities’ structure. If there are any ratios close to or over the alarming limits, the department has to investigate the reasons and make recommendations to adjust the assets’ and liabilities’ structure accordingly; (3) analysing the liquidity risk and reporting to the assets and liability management committee regularly; and (4) daily operation of liquidity management, establishment of a cash position forecast system at the Bank level in order to meet the cash payment needs and assure the liquidity for the business development requirements.
The Group regularly monitors the surplus reserve ratio, liquidity ratio, loan-to-deposit ratio and sets alarming and security limits for each ratio. The Group also prepares general liquidity analysis report based on liquidity indicators recorded and net cash flow position of assets and liabilities, incorporating the consideration of macro economy and interbank liquidity status. The report is submitted to the assets and liabilities management committee for assessment. The assessment report will be submitted together with credit risk, liquidity risk and market risk to the risk management committee of the Board of Directors for the analysis of the Group’s overall risk assessment to determine the management strategy accordingly.
5.1 A maturity analysis of financial assets and liabilities of the Group as follows
The following tables are the structure analysis of non-derivative financial assets and liabilities by contractual maturities at the balance sheet date. The amounts disclosed in each term are the undiscounted contractual cash flows.
240
The
Gro
up
12/3
1/20
15
On
dem
and
Less
than
1 m
onth
1 to
3
mon
ths
3 m
onth
s to
1 y
ear
1 to
5ye
ars
Ove
r 5
year
sP
ast d
ue/
unda
ted
Tota
l
Non
-der
ivat
ive
finan
cial
ass
ets:
Cas
h an
d ba
lanc
es w
ith C
entra
l Ban
k64
,289
-
- -
--
353,
802
418
,091
Am
ount
due
from
ban
ks a
nd o
ther
fina
ncia
l ins
titut
ions
21,3
11
4,2
85
3,6
87
11,
773
1,5
58
- 2
1 4
2,63
5
Pla
cem
ents
with
ban
ks a
nd o
ther
fina
ncia
l ins
titut
ions
- 1
7,48
5 1
2,62
4 2
6,80
5 5
14
-68
57,4
96
Fin
anci
al a
sset
s at
fair
valu
e th
roug
h pr
ofit o
r los
s99
,182
2
,225
2
,633
1
3,14
2 1
2,59
4 5
,780
20
913
5,76
5
Fin
anci
al a
sset
s he
ld u
nder
resa
le a
gree
men
ts-
118,
221
47,9
9743
,249
16,5
96-
4,81
923
0,88
2
Loa
ns a
nd a
dvan
ces
to c
usto
mer
s-
202,
204
139,
950
691,
924
551,
681
427,
199
35,3
112,
048,
269
Ava
ilabl
e-fo
r-sa
le fi
nanc
ial a
sset
s26
,308
9,2
96
44,
034
95,1
14
236
,736
70,8
921,
392
483,
772
Deb
t sec
uriti
es c
lass
ified
as
rece
ivab
les
-26
4,88
4 2
04,2
87
673
,126
7
12,4
54
217
,412
5,
795
2,07
7,95
8
Fin
anci
al le
ase
rece
ivab
les
-
2,18
54,
193
18,4
7056
,273
3,47
758
985
,187
Hel
d-to
-mat
urity
inve
stm
ents
- 1
,455
1
,803
1
8,50
6 9
7,92
6 1
67,2
90
130
287,
110
Oth
er n
on-d
eriv
ativ
e fin
anci
al a
sset
s1,
851
6,03
9 5
,091
6
,484
2
2,47
6 2
,416
653
45,
010
Tota
l non
-der
ivat
ive
finan
cial
ass
ets
212,
941
628,
279
466,
299
1,59
8,59
31,
708,
808
894,
466
402,
789
5,91
2,17
5
Non
-der
ivat
ive
finan
cial
liab
ilitie
s:
Am
ount
due
to C
entra
l Ban
k-
20,
337
11,
947
36,
021
--
-68
,305
Am
ount
due
to b
anks
and
oth
er fi
nanc
ial i
nstit
utio
ns60
4,73
033
4,64
835
2,51
648
2,54
88,
478
551
1,78
3,47
1
Pla
cem
ents
from
ban
ks a
nd o
ther
fina
ncia
l ins
titut
ions
-21
,763
28,3
8352
,592
2,56
71,
242
-10
6,54
7
Fin
anci
al li
abili
ties
at fa
ir va
lue
thro
ugh
profi
t or l
oss
--
--
1-
-1
Fin
anci
al a
sset
s so
ld u
nder
repu
rcha
se a
gree
men
ts-
26,8
4321
,062
301
--
-48
,206
Am
ount
due
to c
usto
mer
s1,
159,
751
259,
285
281,
913
603,
096
230,
145
2,51
8-
2,53
6,70
8
Deb
t sec
uriti
es is
sued
-22
,579
115,
410
207,
795
80,4
3910
,575
-43
6,79
8
Oth
er n
on-d
eriv
ativ
e fin
anci
al li
abili
ties
11,0
474,
149
467
1
,800
7
,128
1
,132
29
25,7
52
Tota
l non
-der
ivat
ive
finan
cial
liab
ilitie
s1,
775,
528
689,
604
811,
698
1,38
4,15
332
8,75
816
,018
295,
005,
788
Net
pos
ition
(1,5
62,5
87)
(61,
325)
(345
,399
)21
4,44
01,
380,
050
878,
448
402,
760
906,
387
UN
IT: R
MB
Mill
ion
241
2 0 1 5 ANNUAL REPORT
UN
IT: R
MB
Mill
ion
The
Gro
up
12/3
1/20
14
On
dem
and
Less
than
1 m
onth
1 to
3
mon
ths
3 m
onth
s to
1 y
ear
1 to
5ye
ars
Ove
r 5
year
sP
ast d
ue/
unda
ted
Tota
l
Non
-der
ivat
ive
finan
cial
ass
ets:
Cas
h an
d ba
lanc
es w
ith C
entra
l Ban
k10
3,17
2-
--
--
388,
195
491,
367
Am
ount
due
from
ban
ks a
nd o
ther
fina
ncia
l ins
titut
ions
25,1
7725
,011
9,19
234
,138
8,90
6-
2110
2,44
5
Pla
cem
ents
with
ban
ks a
nd o
ther
fina
ncia
l ins
titut
ions
-23
,284
2,65
526
,782
1,16
7-
6853
,956
Fin
anci
al a
sset
s at
fair
valu
e th
roug
h pr
ofit o
r los
s4,
512
2,14
04,
367
17,3
7117
,561
2,34
8-
48,2
99
Fin
anci
al a
sset
s he
ld u
nder
resa
le a
gree
men
ts-
231,
668
165,
960
218,
887
125,
393
--
741,
908
Loa
ns a
nd a
dvan
ces
to c
usto
mer
s-
139,
978
148,
481
733,
417
498,
621
323,
087
23,6
181,
867,
202
Ava
ilabl
e-fo
r-sa
le fi
nanc
ial a
sset
s67
811
,273
37,6
4511
3,28
821
5,40
894
,544
314
473,
150
Deb
t sec
uriti
es c
lass
ified
as
rece
ivab
les
503
68,9
5289
,810
240,
232
355,
483
56,6
581,
782
813,
420
Fin
anci
al le
ase
rece
ivab
les
-1,
422
2,94
513
,698
4
6,22
6 4
,646
-
68,
937
Hel
d-to
-mat
urity
inve
stm
ents
-26
11,
378
8,66
096
,214
178,
269
122
284,
904
Oth
er n
on-d
eriv
ativ
e fin
anci
al a
sset
s85
968
81,
108
2,90
511
,691
1,44
586
919
,565
Tota
l non
-der
ivat
ive
finan
cial
ass
ets
134,
901
504,
677
463,
541
1,40
9,37
81,
376,
670
660,
997
414,
989
4,96
5,15
3
Non
-der
ivat
ive
finan
cial
liab
ilitie
s:
Am
ount
due
to C
entra
l Ban
k-
-30
,210
--
--
30,2
10
Am
ount
due
to b
anks
and
oth
er fi
nanc
ial i
nstit
utio
ns42
1,33
1 34
0,60
3 30
7,47
5 18
0,03
2 23
,052
-
-1,
272,
493
Pla
cem
ents
from
ban
ks a
nd o
ther
fina
ncia
l ins
titut
ions
-22
,997
18,0
0240
,116
1,98
9-
-83
,104
Fin
anci
al li
abili
ties
at fa
ir va
lue
thro
ugh
profi
t or l
oss
-1,
702
-20
01
--
1,90
3
Fin
anci
al a
sset
s so
ld u
nder
repu
rcha
se a
gree
men
ts-
78,6
4316
,283
3,53
060
6-
-99
,062
Am
ount
due
to c
usto
mer
s1,
040,
079
193
,511
2
45,9
12
568
,464
2
67,6
52
1,2
76
- 2
,316
,894
Deb
t sec
uriti
es is
sued
-18
,317
21,9
9166
,230
81,2
0114
,294
-20
2,03
3
Oth
er n
on-d
eriv
ativ
e fin
anci
al li
abili
ties
114,
025
25,0
9814
32,
092
6,04
391
79
148,
327
Tota
l non
-der
ivat
ive
finan
cial
liab
ilitie
s1,
575,
435
680,
871
640,
016
860,
664
380
,544
1
6,48
7 9
4,
154,
026
Net
pos
ition
(1,4
40,5
34)
(176
,194
) (1
76,4
75)
548
,714
9
96,1
26
644
,510
4
14,9
80
811,
127
Ass
ets
avai
labl
e to
mee
t al
l of
the
liabi
litie
s an
d ou
tsta
ndin
g lo
an c
omm
itmen
ts in
clud
e ca
sh a
nd b
alan
ces
with
Cen
tral B
ank,
due
fro
m b
anks
and
oth
er
finan
cial
inst
itutio
ns, p
lace
men
ts w
ith b
anks
and
oth
er fi
nanc
ial i
nstit
utio
ns a
nd fi
nanc
ial a
sset
s at
fair
valu
e th
roug
h pr
ofit o
r los
s, e
tc. I
n th
e no
rmal
cou
rse
of b
usin
ess,
the
maj
ority
of c
usto
mer
dep
osits
repa
yabl
e on
dem
and
are
expe
cted
to b
e re
volv
ed. I
n ad
ditio
n, th
e G
roup
is a
ble
to s
ell t
he a
vaila
ble-
for-
sale
fin
anci
al a
sset
s to
repa
y th
e m
atur
ed li
abili
ties
if ne
cess
ary.
242
The
Ban
k
12/3
1/20
15
On
dem
and
Less
than
1
mon
th1
to 3
m
onth
s3
mon
ths
to 1
yea
r1
to 5
ye
ars
Ove
r 5
year
sP
ast d
ue/
unda
ted
Tota
l
Non
-der
ivat
ive
finan
cial
ass
ets:
Cas
h an
d ba
lanc
es w
ith C
entra
l Ban
k64
,289
--
--
-35
3,74
541
8,03
4
Am
ount
due
from
ban
ks a
nd o
ther
fina
ncia
l ins
titut
ions
18,9
96
4,2
85
3,6
87
11,
773
1,5
58
-21
4
0,32
0
Pla
cem
ents
with
ban
ks a
nd o
ther
fina
ncia
l ins
titut
ions
- 1
8,54
9 1
3,60
3 2
9,04
8 5
14
-68
61,7
82
Fin
anci
al a
sset
s at
fair
valu
e th
roug
h pr
ofit o
r los
s98
,012
2
,180
2
,128
1
3,02
5 1
2,10
2 5
,780
10
013
3,32
7
Fin
anci
al a
sset
s he
ld u
nder
resa
le a
gree
men
ts-
118,
221
47,9
9743
,249
16,5
96-
4,81
923
0,88
2
Loa
ns a
nd a
dvan
ces
to c
usto
mer
s-
202,
039
139,
616
690,
593
550,
963
427,
199
35,2
672,
045,
677
Ava
ilabl
e-fo
r-sa
le fi
nanc
ial a
sset
s23
,045
8
,203
4
3,91
9 94
,904
2
34,8
8670
,138
1,
143
476,
238
Deb
t sec
uriti
es c
lass
ified
as
rece
ivab
les
-26
4,87
7 2
02,5
86
672
,166
7
10,4
03
215
,347
5,
795
2,07
1,17
4
Hel
d-to
-mat
urity
inve
stm
ents
- 1
,355
1
,803
1
8,50
6 9
7,92
6 1
67,2
90
130
287,
010
Oth
er n
on-d
eriv
ativ
e fin
anci
al a
sset
s42
06,
210
3,0
28 7
82
485
8
341
911
,427
Tota
l non
-der
ivat
ive
finan
cial
ass
ets
204,
762
625,
919
458,
367
1,57
4,04
61,
625,
433
885,
837
401,
507
5,77
5,87
1
Non
-der
ivat
ive
finan
cial
liab
ilitie
s:
Am
ount
due
to C
entra
l Ban
k-
20,
337
11,
947
36,
021
--
-68
,305
Am
ount
due
to b
anks
and
oth
er fi
nanc
ial i
nstit
utio
ns61
1,37
933
3,63
835
1,56
648
0,73
88,
478
551
1,78
6,35
0
Pla
cem
ents
with
ban
ks a
nd o
ther
fina
ncia
l ins
titut
ions
-9,
861
6,09
84,
393
--
-20
,352
Fin
anci
al a
sset
s so
ld u
nder
repu
rcha
se a
gree
men
ts-
26,8
4321
,062
301
--
-48
,206
Am
ount
due
to c
usto
mer
s1,
159,
751
259,
285
281,
913
603,
096
230,
145
2,51
8-
2,53
6,70
8
Deb
t sec
uriti
es is
sued
-22
,579
115,
410
207,
598
75,0
4610
,575
-43
1,20
8
Oth
er n
on-d
eriv
ativ
e fin
anci
al li
abili
ties
7,95
34,
108
238
4
88
358
3
9-
13,1
84
Tota
l non
-der
ivat
ive
finan
cial
liab
ilitie
s1,
779,
083
676,
651
788,
234
1,33
2,63
531
4,02
713
,683
-4,
904,
313
Net
pos
ition
(1,5
74,3
21)
(50,
732)
(329
,867
)24
1,41
11,
311,
406
872,
154
401,
507
871,
558
UN
IT: R
MB
Mill
ion
243
2 0 1 5 ANNUAL REPORT
The
Ban
k
12/3
1/20
14
On
dem
and
Less
than
1
mon
th1
to 3
m
onth
s3
mon
ths
to 1
yea
r1
to 5
ye
ars
Ove
r 5
year
sP
ast d
ue/
unda
ted
Tota
l
Non
-der
ivat
ive
finan
cial
ass
ets:
Cas
h an
d ba
lanc
es w
ith C
entra
l Ban
k10
3,17
2-
--
--
388,
073
491,
245
Am
ount
due
from
ban
ks a
nd o
ther
fina
ncia
l ins
titut
ions
24,5
0323
,790
9,05
933
,290
8,62
5-
2199
,288
Pla
cem
ents
with
ban
ks a
nd o
ther
fina
ncia
l ins
titut
ions
-23
,334
2,35
426
,887
1,16
7-
6853
,810
Fin
anci
al a
sset
s at
fair
valu
e th
roug
h pr
ofit o
r los
s4,
339
1,44
24,
351
17,0
5517
,325
2,34
8-
46,8
60
Fin
anci
al a
sset
s he
ld u
nder
resa
le a
gree
men
ts-
231,
668
165,
960
218,
887
125,
393
--
741,
908
Loa
ns a
nd a
dvan
ces
to c
usto
mer
s-
139,
978
148,
481
733,
519
498,
621
323,
087
23,6
181,
867,
304
Ava
ilabl
e-fo
r-sa
le fi
nanc
ial a
sset
s18
11,2
6437
,645
113,
022
213,
252
93,5
3681
468,
818
Deb
t sec
uriti
es c
lass
ified
as
rece
ivab
les
-68
,943
89,3
0523
9,88
735
3,35
755
,651
1,54
980
8,69
2
Hel
d-to
-mat
urity
inve
stm
ents
-26
11,
378
8,66
096
,214
178,
269
122
284,
904
Oth
er n
on-d
eriv
ativ
e fin
anci
al a
sset
s85
950
858
679
332
061
481
3,60
8
Tota
l non
-der
ivat
ive
finan
cial
ass
ets
132,
891
501,
188
459,
119
1,39
2,00
01,
314,
274
652,
952
414,
013
4,86
6,43
7
Non
-der
ivat
ive
finan
cial
liab
ilitie
s:
Am
ount
due
to C
entra
l Ban
k-
-30
,210
--
--
30,2
10
Due
to b
anks
and
oth
er fi
nanc
ial i
nstit
utio
ns42
3,29
2 34
0,60
3 30
7,47
5 18
0,03
2 23
,052
-
-1,
274,
454
Pla
cem
ents
with
ban
ks a
nd o
ther
fina
ncia
l ins
titut
ions
-16
,262
4,61
54,
082
--
-24
,959
Fin
anci
al li
abili
ties
at fa
ir va
lue
thro
ugh
profi
t or l
oss
-1,
702
--
--
-1,
702
Fin
anci
al a
sset
s so
ld u
nder
repu
rcha
se a
gree
men
ts-
78,6
4316
,283
3,53
0-
--
98,4
56
Am
ount
due
to c
usto
mer
s1,
040,
079
193
,511
2
45,9
12
568
,464
2
67,6
52
1,2
76
- 2
,316
,894
Deb
t sec
uriti
es is
sued
-18
,317
21,9
9166
,230
81,2
0114
,294
-20
2,03
3
Oth
er n
on-d
eriv
ativ
e fin
anci
al li
abili
ties
114,
025
25,0
6913
738
127
08
-13
9,89
0
Tota
l non
-der
ivat
ive
finan
cial
liab
ilitie
s1,
577,
396
674,
107
626,
623
822
,719
3
72,1
75
15,
578
- 4
,088
,598
Net
pos
ition
(1,4
44,5
05)
(172
,919
) (1
67,5
04)
569
,281
9
42,0
99
637
,374
4
14,0
13
777,
839
UN
IT: R
MB
Mill
ion
244
5.2 Liquidity risk analysis of derivative instruments
(i) Derivative settled on a net basis
Derivatives that will be settled on a net basis are mainly interest rate related and credit related etc. The tables below set forth the Group’s net derivative financial instruments positions by remaining contractual maturities at the balance sheet date. The amounts disclosed in the tables are the undiscounted contractual cash flows.
UNIT: RMB Million
The Group and the Bank
12/31/2015
Less than 1 month
1-3months
3-12 months
1-5years
Over 5 years Total
Interest rate derivatives 2 18 16 (38) - (2)
Other derivatives - - 15 9 - 24
Total 2 18 31 (29) - 22
UNIT: RMB Million
The Group and the Bank
12/31/2014
Less than 1 month
1-3months
3-12 months
1-5years
Over 5 years Total
Interest rate derivatives 10 (12) 15 55 - 68
Other derivatives 62 76 327 - - 465
Total 72 64 342 55 - 533
245
2 0 1 5 ANNUAL REPORT
(ii) Derivatives settled on a gross basis
The Group’s derivatives that will be settled on a gross basis refer to exchange rate derivatives and precious metals forward with delivery precious metals. The tables below set forth the Group’s positions by remaining contractual maturities at the balance sheet date. The amounts disclosed in the tables are the undiscounted contractual cash flows.
The Group’s off-balance sheet items mainly include credit card commitments, letters of credit, letters of guarantee and bank acceptances. The tables below set forth the amounts of the off-balance sheet items by remaining maturity.
Letter of credit 111,072 475 - 111,547 160,024 118 - 160,142
Letter of guarantee 39,805 38,927 53,398 132,130 39,164 28,931 50,065 118,160
Bank acceptances 498,589 - - 498,589 450,914 - - 450,914
Total 741,823 39,402 53,398 834,623 710,814 29,049 50,065 789,928
6. Capital Management During the year, the Group had conscientiously implemented the capital management policy according to the regulations of China Banking Regulatory Commission Administrative Measures for the Capital of Commercial Banks (for Trial Implementation). As per "2011-2015 Development Strategy Plan" and "2014-2016 Capital Adequacy Standards Planning of Transition Period", from the perspective of business strategy, risk conditions and regulatory requirements, the Group will achieve healthy, sustainable and rapid development in order to ensure capital adequacy ratio and the overall strategic development match with risk preference and risk management capabilities.
The Group verified the necessity and the feasibility of capital supplement based on balancing the asset growth, capital demand and capital supplement channel in 2015, issued RMB13 billion preferred shares for the supplementing of tier one capital. After that, the capital structure of the Group was improved, capital adequacy ratio was increased, the anti-risk ability and the ability of serving the real economy were further enhanced.
The Group implemented capital intensive operation and management to continuously improve and optimize risk-weighted asset amount allocation and governing system: oriented by risk-weighted asset yields, the Group makes overall arrangements in operation institutions, risk-weighted assets scale of business lines to reasonably adjust industry structure and promote capital allocation and strengthen capital internalization capability.
The Group implemented new capital agreement to real-time monitor the sufficiency and utilization of corporate capital of the Group as required by Administrative Measures for the Capital of Commercial Banks (for Trial Implementation) and other regulations. As of 31 December, 2015, the Group’s net level-one core capital is RMB2,89.036 billion, net level-one capital is RMB3,14.945 billion and net capital is RMB3,83.504 billion.
247
2 0 1 5 ANNUAL REPORT
7. Fair value of financial instruments7.1 Method of fair value recognition
Part of the financial assets and financial liabilities of the Group is measured at fair value. Fair value are measured through appropriate method and parameters, and regularly reviewed by related department to keep its applicability.
When recognizing the fair value of the financial instrument, to those financial instruments which can obtain unadjusted price of same assets and liabilities in the active market, the Group regards the unadjusted price in the active market as the best evidence of fair value. And then the Group recognizes the fair value and classifies it to level 1.
If the parameters of the estimation are observable and acquirable in the active market, such financial instruments (including equity instrument and derivative financial instrument) should be classified to level 2. The Group uses internal or external professionals to estimate the value with techniques aimed at the model and Black-Scholes non-derivative financial instrument and part of the derivative financial instrument (including interest swaps, forward foreign exchange etc.) which cannot obtain prices in the active market. The main parameters used in the discounted cash flow model include the recent trading price, the relevant yield curve, exchange rates, prepayment rates and counterparty credit spreads, the main parameters of Black-Scholes option pricing model used include relevant yield curve, exchange rates, fluctuations level, and counterparty credit spreads, etc.
To loans and advances, part of debt securities classified as receivables and available-for-sale financial assets, their fair value is based on cash flow discount model, and confirmed by unobservable discount rate which reflect credit risk. Such financial instruments are classified to level 3.
To unlisted equity (private equity) owned by the Group, the measure of fair value may adopt the unobservable input parameters which has significant influence over the estimation. Therefore, such financial instruments are classified to level 3. The management estimates the financial instruments fair value of level 3 by a series of method, including unobservable parameters such as discount rate which lacks market liquidity. If one or more unobservable parameters change based on reasonably possible alternative hypothesis, the fair value of such financial instruments will change accordingly. The Group has established related internal control process in order to supervise the exposure of the financial instrument.
248
7.2 Financial assets and financial liabilities continued at fair value
Financial assets and financial liabilities continued at fair value, their three levels of fair value measurement are analysed as follows:
UNIT: RMB Million
The Group
12/31/2015 12/31/2014
Level 1 Level 2 Level 3 Total Level 1 Level 2 Level 3 Total
Financial assets:
Financial assets at fair value through profit or loss 99,182 29,503 - 128,685 4,512 39,923 - 44,435
There are no transfers from Level 1 and Level 2 to Level 3, and no transfers between Level 1 and Level 2 for the fair value measurements of the Group's financial instruments in 2015 and in 2014.
These debt instruments, using the discounted cash flow model for evaluating, the main significant unobservable inputs is the discount rate, the weighted average of 5.83%, and the significant unobservable inputs are inversely proportional to the fair value.
Adjustment of financial assets and liabilities in level 3 at fair value:
UNIT: RMB Million
Available-for-sale financial assets The Group
12/31/2015 12/31/2014
Opening 146,179 78,809
Total profit and loss 12,280 4,584
Interest income 12,280 4,584
Bought/Sold 181,935 90,578
Settle (126,425) (23,208)
Closing 201,689 146,179
Unimplemented profit or loss - -
UNIT: RMB Million
Available-for-sale financial assets The Bank
12/31/2015 12/31/2014
Opening 145,959 78,524
Total profit and loss 12,203 4,507
Interest income 12,203 4,507
Bought/Sold 181,840 90,444
Settle (126,226) (23,009)
Closing 201,573 145,959
Unimplemented profit or loss - -
251
2 0 1 5 ANNUAL REPORT
7.3 Financial assets and liabilities measured not by fair value
The table below shows the carrying value of financial assets and financial liabilities at non-fair value and the corresponding fair value on the balance sheet date. The book value approximates the fair value of financial assets and financial liabilities, such as deposits with Central Bank, amount due from banks and other financial institutions, loans to other banks, financial assets purchased under resale agreements, amount due to the Central Bank, borrowing money, sell back purchase money not included in the table below.
UNIT: RMB Million
The Group
12/31/2015 12/31/2014
Book value Fair value Book value Fair value
Financial assets:
Loans and advances to customers 1,724,822 1,727,210 1,549,252 1,549,578
All of the above-mentioned assumptions and methods provide a consistent basis for the calculation of the fair values of the Group’s assets and liabilities. However, other institutions may use different assumptions and methods. Therefore, the fair values disclosed by different financial institutions may not be entirely comparable.
255
2 0 1 5 ANNUAL REPORT
XIV. NON-ADJUSTING EVENTS AFTER BALANCE SHEET 1. On 31 December, 2012, The Bank issued 1,915,146,700 ordinary shares (A shares) to following specific objects: The People’s Insurance Company (Group) of China Limited, People's Insurance Company of China, China Life Insurance Company, China National Tobacco Corporation, Shanghai Zhengyang International Economic and Trade Co., Ltd., the issue approved by the China Securities Regulatory Commission’s Reply of Approval for Non-public offering of shares of Industrial Bank Co., Ltd. (Commission license [2012] No.1750). These shares completed registration and custody procedures on 7 January, 2013 in Shanghai Branch of China Securities Depository and Clearing Corporation Limited, it shall not be transferred within 36 months from the end of the issue (if relevant regulatory authorities have other requirements for the lock-up period, it shall prevail). The Bank actualized 2012 Annual profit distribution plan in July 2013, through getting 5 shares and a cash dividend of RMB5.70 (including tax) for every 10 shares. After the profit distribution, restricted shares corresponding increase to 2,872,720,050 shares, the number of restricted shares listed in circulation is the same. After 7 January, 2016, the restricted shares listed, the Bank's restricted shares will be 0, and the unlimited tradable shares will be 19,052,336,751.
2. In 23 March, 2016, upon approval of the State Council, the pilot program of the collection of value-added tax in lieu of business tax (hereinafter referred to as the “VAT in lieu of BT”) shall be promoted nationwide in a comprehensive manner as of 1 May, 2016, and all taxpayers of business tax engaged in the building industry, the real estate industry, the financial industry and the life service industry shall be included in the scope of the pilot program with regard to payment of value-added tax (VAT) instead of business tax (BT). From 1 May, 2016, the Group should pay the value-added tax (VAT) instead of business tax (BT).
3. Approved by CBRC and People's Bank of China, the Bank issued RMB30,000 million secondary capital bonds in the National Interbank Bond Market in April, 2016. The bonds mature in 10 years with fixed interest rate and can be redeemed at the end of the fifth year by the issuers (coupon rate: 3.74%). The raising fund will replenish the secondary capital of the bank by the applicable law and the approval of the supervision department.
XV. FINANCIAL STATEMENTS APPROVEDThe financial statements were approved by the Board of Directors on 27 April, 2016.
END OF FINANCIAL STATEMENTS
256
SUPPLEMENTARY INFORMATION
YEAR 20151. Breakdown of non-recurring profit or lossThe following table is in accordance with the requirement of Information Disclosure and Presentation Rules for Companies Making Public Offering of Securities No. 1 - Non-recurring Profit or Loss (2008) (ZJHGG [2008] No.43) issued by China Securities Regulatory Commission.
UNIT: RMB Million
The Group
2015 2014
Gains and losses on the disposal of non-current assets 9 83
Government grants recognised in profit or loss 334 379
Recovery of assets written-off in previous years 531 242
Net non-operating income and expense in addition to the above 91 (54)
Subtotal 965 650
Impact on income tax expenses (252) (172)
Total 713 478
Net earnings attributable to the parent company shareholders 714 478
Net earnings attributable to the parent company shareholders, after deduction of non-recurring gains and losses (1) -
Net profit 49,442 46,660
Non-recurring profit or loss refers to the profit or loss not related to normal business or the profit or loss which is related to normal business but affects the user of financial statements to make correct judgement for the company’s financial position and financial performance because of its distinctiveness and non-recurring. Considering the nature of its normal business, Industrial Bank Co., Ltd. (hereinafter referred to as “the Bank”) does not include “investment income from financial assets designated as at fair value through profit or loss, financial liabilities designated as at fair value through profit or loss and available-for-sale financial assets” in non-recurring profit or loss.
257
2 0 1 5 ANNUAL REPORT
2. Return on net assets and earnings per share (“EPS”)The related data is calculated in accordance with the provisions in the Rule No.9 for the Preparation of Information Disclosure of Companies with Public Offering - the Calculation and Disclosure of ROE and EPS (revised in 2010). In the related period, basic EPS is calculated by dividing net profit by weighted average ordinary shares issued.
UNIT: RMB Million
The Group
2015
Weighted averagenet ROEROE (%)
Basic EPS,basic
(RMB Yuan per share)
Net profit attributable to shareholders of the Bank 18.89 2.63
Net profit attributable to shareholders of the Bank, after deduction of non-recurring profit or loss 18.63 2.60
2014
Weighted averageROE (%)
Basic EPS(RMB Yuan per share)
Net profit attributable to shareholders of the Bank 21.21 2.47
Net profit attributable to shareholders of the Bank, after deduction of non-recurring profit or loss 21.00 2.45
The RMB26,000 million preferred stocks of the Bank approved in November 2014 were successfully issued in June 2015. When calculating the earnings per share, the current net profit attributed to ordinary shareholders did not include preferred stock dividends announced of insurance. In addition, it had no influence on basic earnings per share and diluted earnings per share in 2015 and 2014.
258
THE COMPANY’S ORGANIzATIONAL STRUCTURE
259
2 0 1 5 ANNUAL REPORT
This annual report is printed on PEFC certified paper.


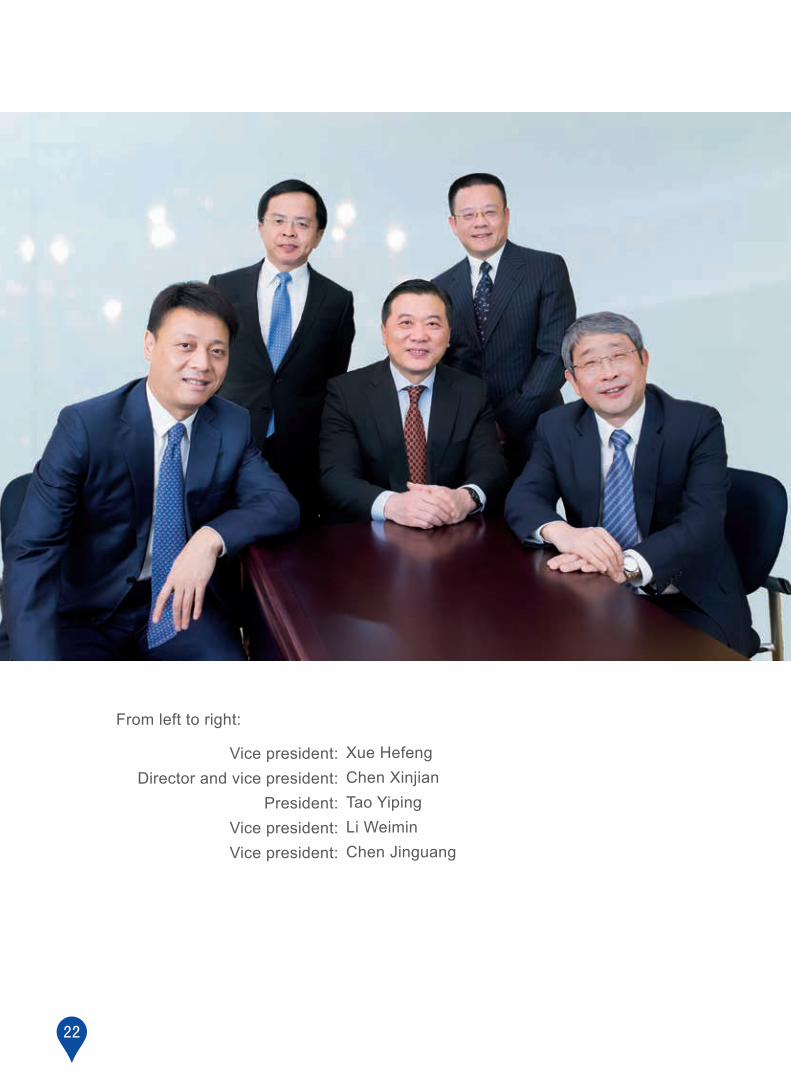


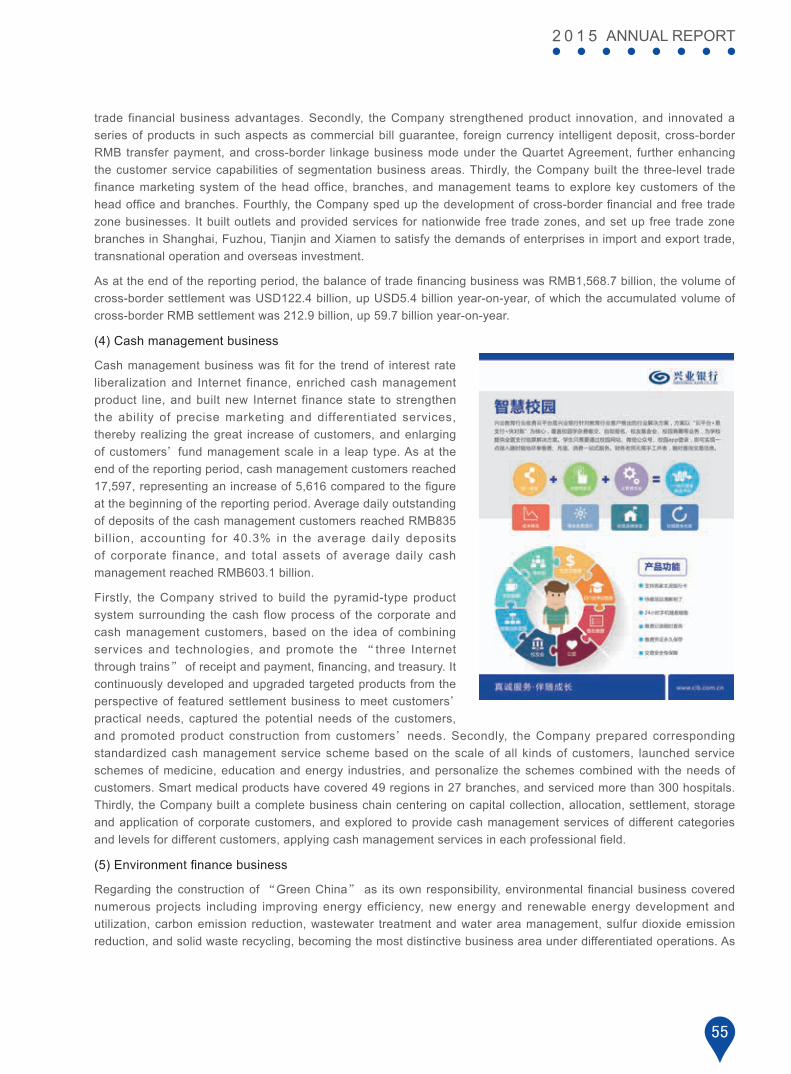


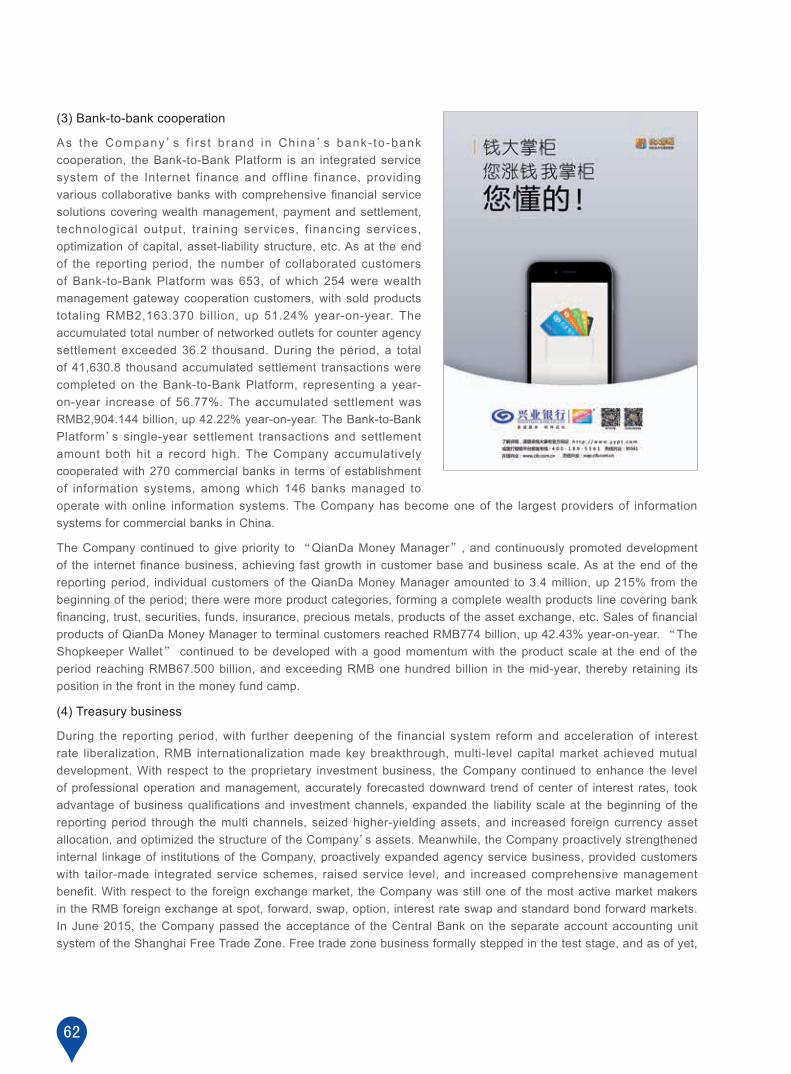


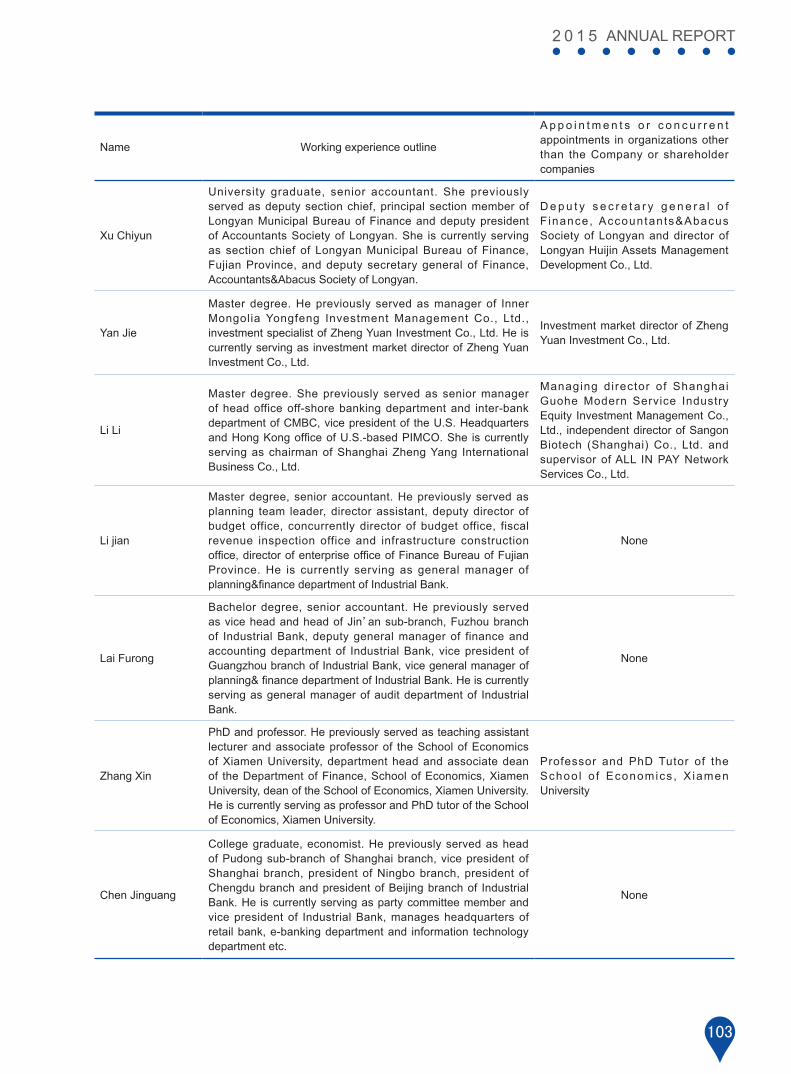


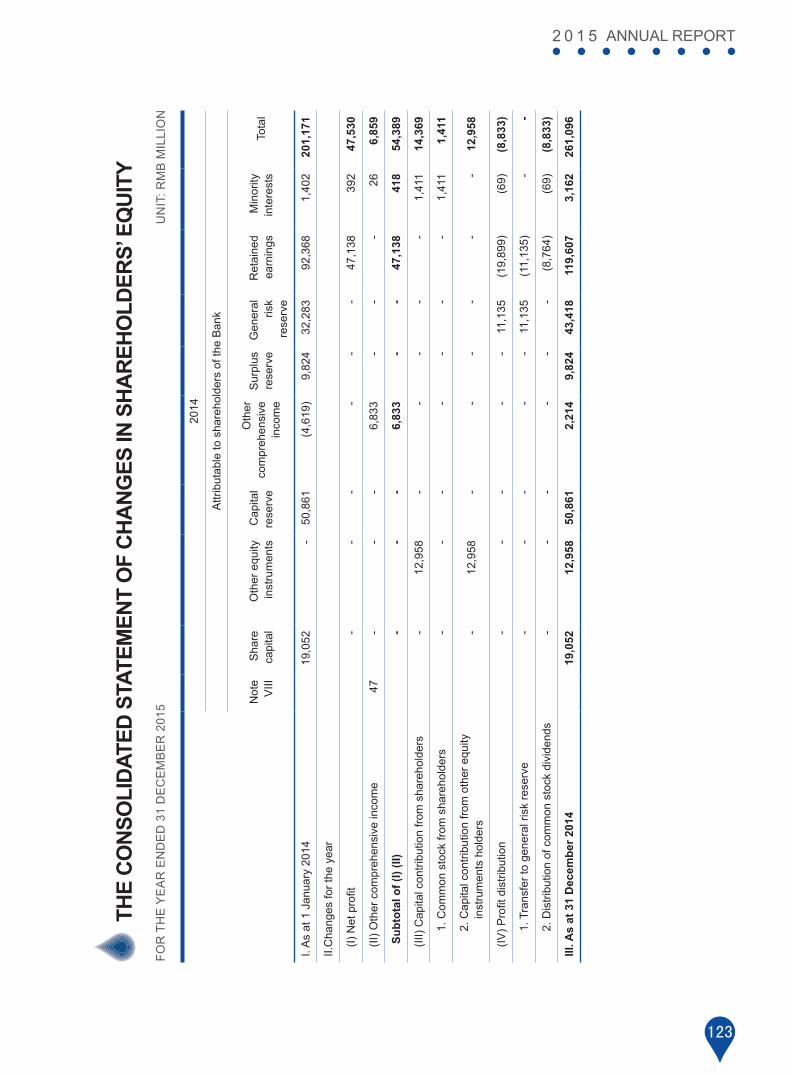


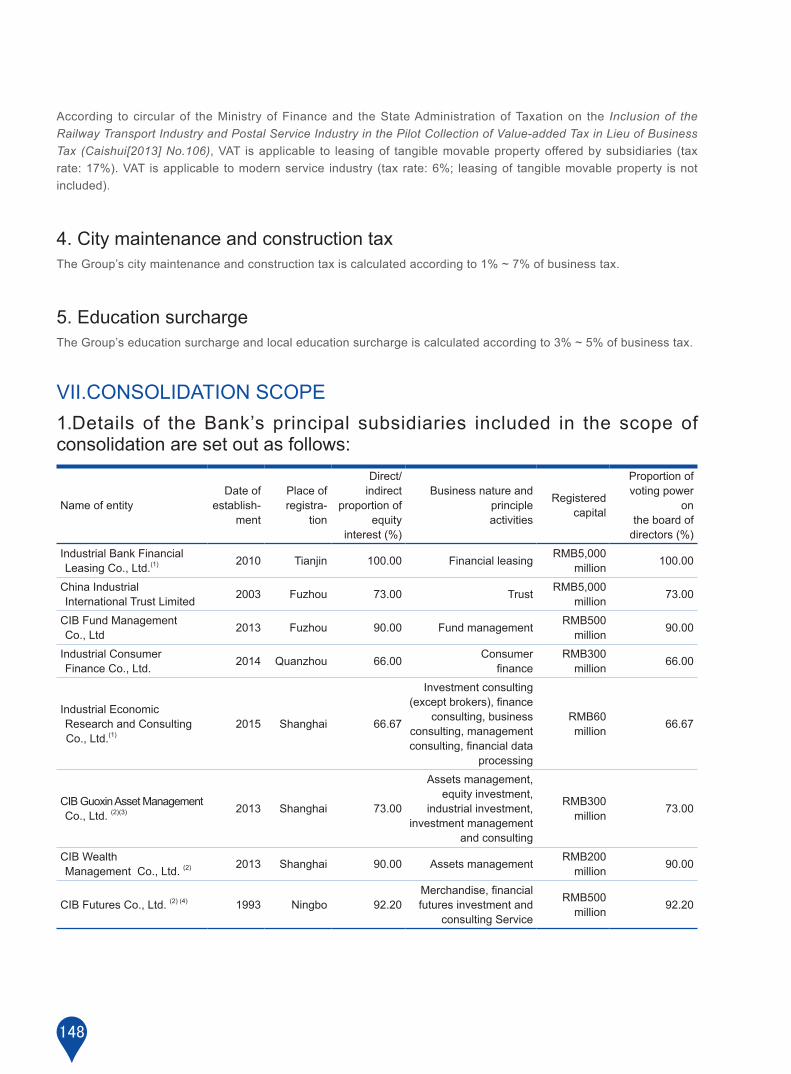


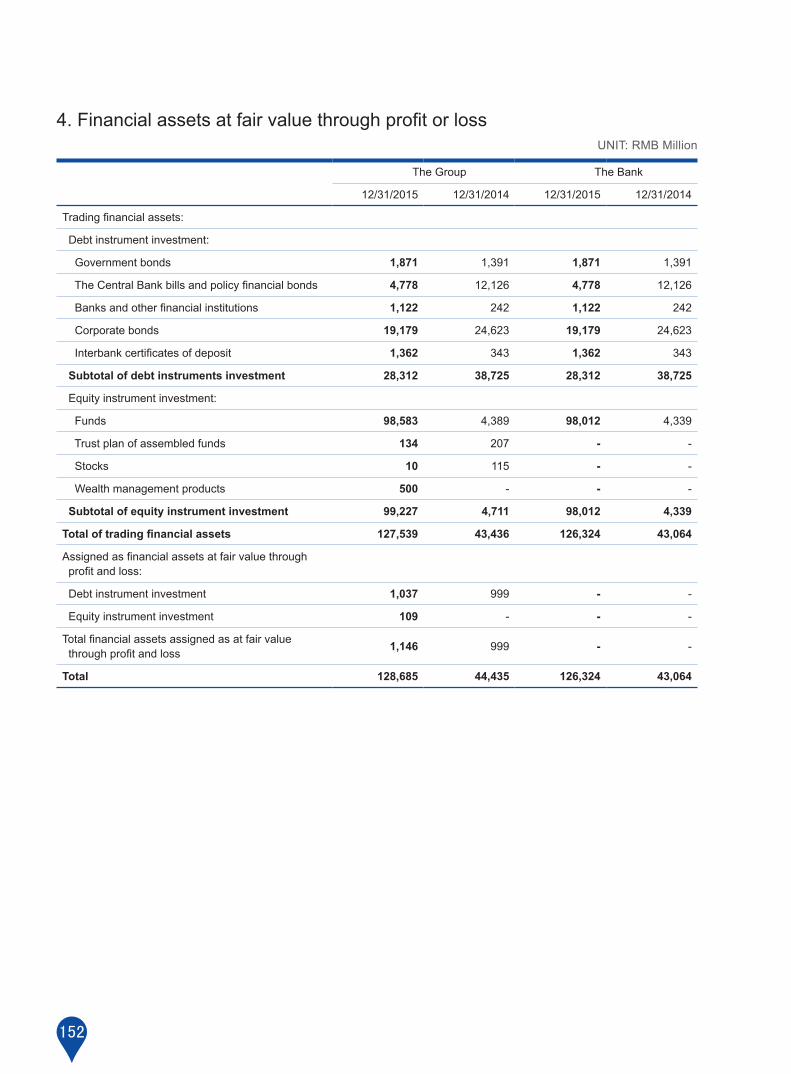


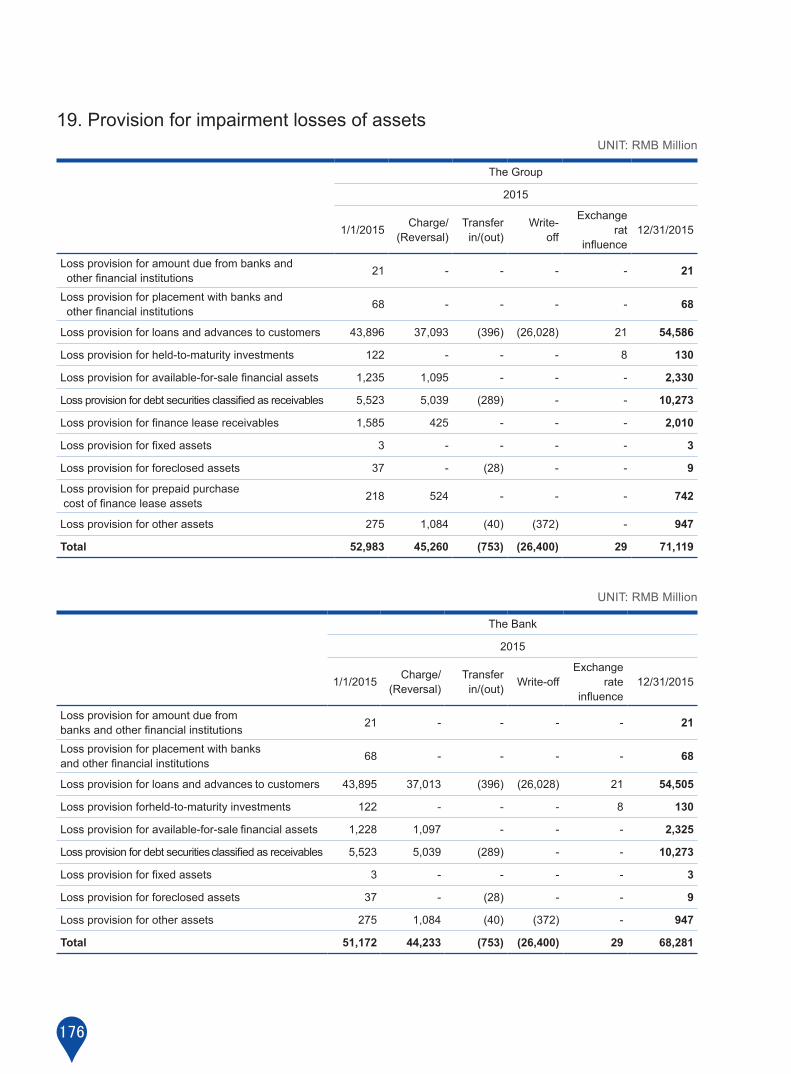


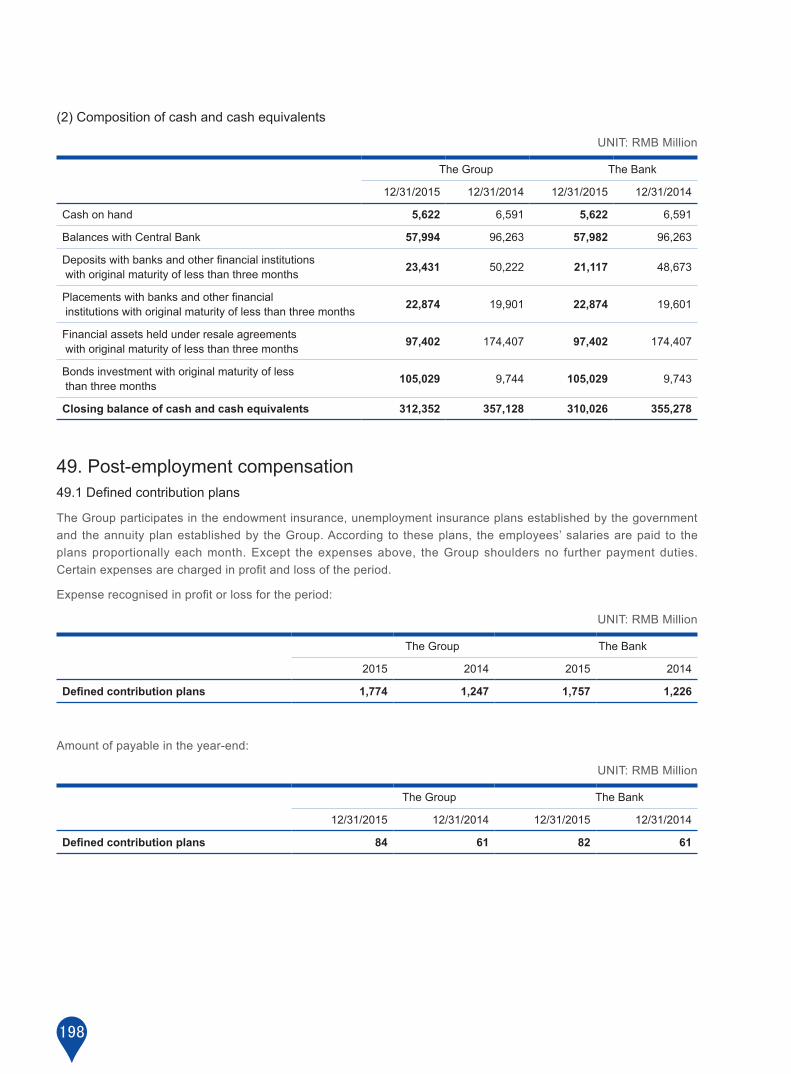


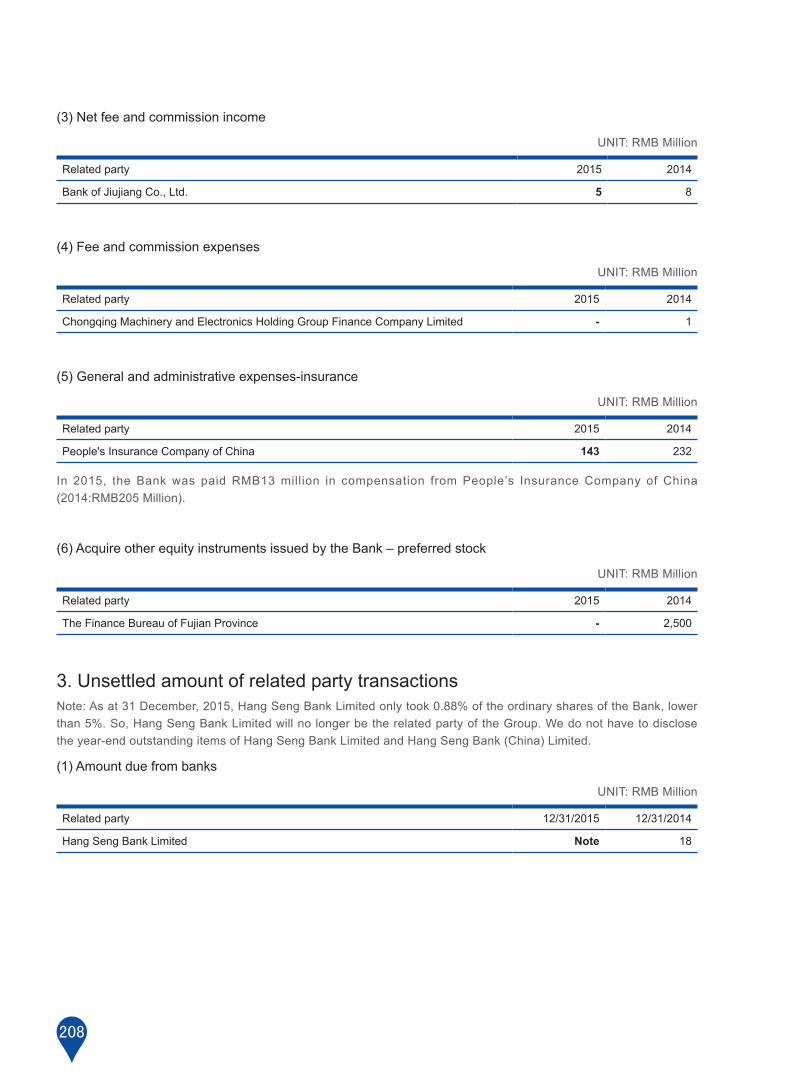


![Top 10-global-cord-blood-banks[1]](https://static.documents.pub/doc/80x56/55664c43d8b42ab75e8b4a31/top-10-global-cord-blood-banks1.jpg)


