88
WIRELESS GSM HAZE MONITORING SYSTEM SZETO YANG YANG DEGRE OF BACHELOR UNIVERSITI MALAYSIA PAHANG

WIRELESS GSM HAZE MONITORING SYSTEM
SZETO YANG YANG
DEGRE OF BACHELOR
UNIVERSITI MALAYSIA PAHANG

UNIVERSITI MALAYSIA PAHANG
NOTE : * If the thesis is CONFIDENTIAL or RESTRICTED, please attach a thesis declaration letter.
DECLARATION OF THESIS AND COPYRIGHT Author’s Full Name : ___________________________________________________ Date of Birth : _____________________________________________________ Title : _____________________________________________________ _____________________________________________________ _____________________________________________________ Academic Session : _____________________________________________________ I declare that this thesis is classified as: CONFIDENTIAL (Contains confidential information under the Official
Secret Act 1997)*
RESTRICTED (Contains restricted information as specified by the
organization where research was done)*
OPEN ACCESS I agree that my thesis to be published as online open
access (Full Text)
I acknowledge that Universiti Malaysia Pahang reserves the following rights: 1. The Thesis is the Property of Universiti Malaysia Pahang 2. The Library of Universiti Malaysia Pahang has the right to make copies of the thesis for
the purpose of research only. 3. The Library has the right to make copies of the thesis for academic exchange. Certified by:
_____________________ (Student’s Signature) _____________________ New IC/Passport Number Date:
_______________________ (Supervisor’s Signature) _______________________ Name of Supervisor Date:
THESIS DECLARATION LETTER (OPTIONAL)
Librarian, Perpustakaan Universiti Malaysia Pahang, Universiti Malaysia Pahang, Lebuhraya Tun Razak, 26300, Gambang, Kuantan. Dear Sir, CLASSIFICATION OF THESIS AS RESTRICTED Please be informed that the following thesis is classified as RESTRICTED for a period of three (3) years from the date of this letter. The reasons for this classification are as listed below.
Thank you. Yours faithfully, _____________________________ (Supervisor’s Signature) Date: Stamp: Note: This letter should be written by the supervisor, addressed to the Librarian, Perpustakaan Universiti Malaysia Pahang with its copy attached to the thesis.
Author’s Name Thesis Title Reasons (i)
(ii)
(iii)

SUPERVISOR’S DECLARATION
I hereby declare that I have checked this thesis and in my opinion, this thesis is adequate in
terms of scope and quality for the award of the degree of Bachelor of Engineering in
Mechatronic Engineering.
_______________________________
(Supervisor’s Signature)
Full Name :
Position :
Date :
:

STUDENT’S DECLARATION
I hereby declare that the work in this thesis is based on my original work except for
quotations and citations which have been duly acknowledged. I also declare that it has
not been previously or concurrently submitted for any other degree at Universiti
Malaysia Pahang or any other institutions.
_______________________________
(Student’s Signature)
Full Name : SZETO YANG YANG
ID Number : FB13034
Date : 30 MAY 2017

WIRELESS GSM HAZE MONITORING SYSTEM
SZETO YANG YANG
Report submitted in partial fulfilment of the requirements
for the award of the degree of
Bachelor of Engineering in Mechatronic Engineering
Faculty of Manufacturing Engineering
UNIVERSITI MALAYSIA PAHANG
June 2017

ii
ACKNOWLEDGEMENT
Throughout the entire span of my final year project, I am grateful for being blessed with
good health and a peaceful state of mind to see this project to a fruitful end.
In addition, I am also very grateful to my project supervisor, Dr. Arshed Abdulahameed
Oudah, in Faculty of Manufacturing Engineering for his continuous support and guidance
which were valuable and sincere.
Moreover, I am thankful for the spiritual and mental support which had been so kindly
extended to me by my dear family and friends, it kept me going through challenging times
and arduous moments.
Apart from that, I would like to take this opportunity to express my sincere gratitude to
the Faculty of Manufacturing Engineering for providing me with all the necessary
facilities and equipment for this project.

ABSTRAK
Jerebu adalah satu keadaan di atmosfera yang menghalang penglihatan di kawasan yang
terjejas. Malaysia adalah salah sebuah negara yang terpaksa menghadapi kejadian jerebu
berulang kali, namun bacaan kualiti udara tidak mudah diaskses oleh penduduk Malaysia.
Oleh itu, unit mudah alih dilengkapi dengan sensor dan peranti komunikasi boleh menjadi
alternatif untuk memperoleh data. Antara alatan yang terdiri dalam unit adalah alat deria
yang boleh mengukur suhu, kelembapan, tahap karbon monoksida dan ketumpatan debu
bersama-sama dengan sistem global untuk modul komunikasi mudah alih dan modul
frekuensi radio. Oleh begitu, pengguna dapat menerima bacaan melalui Sistem
Komunikasi Mudah Alih Global (GSM) untuk Khidmat Pesanan Ringkas (SMS) atau
melihatnya dari monitor. Unit ini datang dalam satu set dua, terminal pemantauan dan
pusat pemantauan. Semua bacaan sensor akan diperolehi dari terminal pemantauan dan
dihantar ke pusat pemantauan mudah alih untuk paparan visual.

ABSTRACT
Haze is a condition in the atmosphere that hinders visibility in an affected area. Malaysia
is a recurring country which haze exists and poses a threat to public health. For a country,
which is frequented by the occurrence of haze, air quality readings are not easily
accessible by the public. Hence, portable units equipped with sensors and communicative
devices could be an alternative to acquire the data. With sensory units that can measure
temperature, humidity, carbon monoxide level and dust density along with a global
system for mobile communication module and radio frequency module, users will be able
to receive readings via Global System for Mobile Communications (GSM) for Short
Message Service (SMS) or view them from a monitor. This unit comes in a set of two, a
monitoring terminal and a monitoring center. All sensor readings will be acquired from
the monitoring terminal and be sent to portable monitoring center for a visual display.

TABLE OF CONTENTS
DECLRATION
TITLE PAGE
ACKNOWLEDGEMENT ii
ABSTRAK iii
ABSTRACT iv
TABLE OF CONTENTS v
CHAPTER 1: INTRODUCTION 3
1.1 BACKGROUND STUDY 3
1.2 PROBLEM STATEMENT 4
1.3 PROJECT OBJECTIVES 5
1.4 PROJECT SCOPE 5
CHAPTER 2: LITERATURE REVIEW 7
2.1 INTRODUCTION 7
2.2 WIRELESS GSM (GLOBAL SYSTEM FOR MOBILE
COMMUNICATION) 8
2.2.1 GSM Related-Works 10
2.3 SMOKE SENSOR 15
2.3.1 Calibration of Smoke Sensor 15
2.4 ARDUINO 18
CHAPTER 3: METHODOLOGY 20
3.1 INTRODUCTION 20
3.2 PROJECT FLOW CHART 21
3.3 PROJECT GANNT CHART 24
3.4 BLOCK DIAGRAM OF THE SYSTEM 25

3.5 HARDWARE 27
3.5.1 MQ-135 Smoker Sensor 27
3.5.2 Arduino Uno 28
3.5.3 GPRS GSM Module A6 29
3.5.4 Optical Dust Sensor GP2Y1010AUF 31
3.6 SOFTWARE 33
3.6.1 Arduino Software (IDE) 33
3.6.2 Visual Studio 2015 33
3.7 BILL OF MATERIALS 33
3.8 EXPECTED OUTCOME 34
CHAPTER 4: RESULTS AND DISCUSSION 35
4.1 INTRODUCTION 35
4.2 HARDWARE IMPLEMENTATION 36
4.3 SOFTWARE IMPLEMENTATION 37
4.4 Test Phase 39
4.4.1 PRELIMINARY TEST 1 39
4.4.1.1 DATA FROM MONITORING CENTRE 39
4.4.4.2 GSM Service Message 42
4.4.2 PRELIMINARY TEST 2 43
4.4.3 PRELIMINARY TEST 3 45
4.5 POWER CONSUMPTION 47
CHAPTER 5: CONCLUSION AND RECOMMENDATIONS 48
5.1 INTRODUCTION 48
5.2 CONCLUSION 49
5.3 RECOMMENDATIONS FOR FUTURE WORK 50
REFERENCES 51
TABLE AND FIGURE REFERENCE 54

APPENDICES 55
A PROGRAM CODE FOR HAZE MONITORING TERMINAL 55
B PROGRAM CODE FOR HAZE MONITORING CENTER 62
C. CONFERENCE PAPER 63
D. AINEX 2017 COMPETITION CERTIFICATE 63
E. ELECTRICAL CIRCUIT DIAGRAM 63

LIST OF TABLES
Table 2.1: Comparison Between Arduino Uno, Arduino Mega and Arduino Nano 19
Table 3.1 Shows the Gannt Chart for The Project 24
Table 3.2 Technical Data of MQ-135 Smoke Sensor 27
Table 3.3: General Parameters of A6 Chip 29
Table 3.4: Parameters of GP2Y1010AUF Dust Sensor 31
Table 3.5: General Health Effects and Cautionary Statements Within Each API
Categories 32
Table 3.6: Shows the bill of material of the project 33
Table 4.1: Parameters of Test 2 43
Table 4.2: Parameters of Test 3 45
Table 4.3: Total Current Consumption of Terminal Unit 47
Table 4.4: Total Current Consumption of Center Unit 47

1
LIST OF FIGURES
Figure 2.1: Architecture of GSM 9
Figure 2.2: Metal Oxide Sensor Circuit 16
Figure 2.3: Typical Sensitivity Characteristics of MQ-135 for several gas at 20, 65%
RH, 21% 𝑶𝟐 concentration, 𝑹𝑳= 20kΩ 17
Figure 2.4: Arduino Variants 18
Figure 3.1: Shows the flow chart of the project 21
Figure 3.2: Shows the flow chart of the methodology 22
Figure 3.3: Shows the flow chart of the Software and Hardware Implementation
Procedures 23
Figure 3.4: Shows the block diagram of the haze monitoring terminal 25
Figure 3.5: Shows the flow chart of the haze monitoring terminal 26
Figure 3.6: Shows the block diagram of the haze monitoring centre 26
Figure 3.7: Shows the flow chart for the haze monitoring centre 27
Figure 3.8: MQ-135 Smoke Sensor 27
Figure 3.9: Arduino Nano 28
Figure 3.10: A6 GSM Module 29
Figure 3.11: A6 GSM Being Initialised by AT Command 30
The above Figure 3.11 portrays AT command is still widely used to control a GSM
module to activate and operate it. Various AT commands could be sent via a serial port
to communicate with the device. Hence, a study of AT commands would be needed. 30
Figure 3.12: Optical Dust Sensor GP2Y1010AUF 31
Figure 3.13: Output Voltage Versus Dust Density 32
Figure 4.1 and Figur 4.2: Haze Monitorng Terminal Front and Back View 36
Figure 4.3: Haze Monitoring Centre 37
Figure 4.4: Graphical User Interface for Data Monitoring 37
Figure 4.5: Graphical Plot Outlook of Sensor Readings 38
Figure 4.6: Data Acquired Displayed on GUI 39
Figure 4.7: Air API Reading Graph 40
Figure 4.8: Temperature Reading Graph 40
Figure 4.9: Humidity Reading Graph 41
Figure 4.10: CO Level Reading Graph 41
Figure 4.11: SMS Alert Message Every 15 Minutes Via GSM 42

Figure 4.12: SMS Alert Message When Haze Readings Exceed Safe Level 42
Figure 4.13: Graphical Data of API, CO Level, Temperature & Humidity from
Terminal for Test No.2 44
Figure 4.14: Graphical Data of API, CO Level, Temperature & Humidity from
Terminal for Test No.3 46

CHAPTER 1
INTRODUCTION
1.1 BACKGROUND STUDY
From meteorological standpoint, it is an atmospheric phenomenon where a
conglomeration of small dry suspended particles in the atmosphere named lithometeor.
In layman term, haze is a condition in the atmosphere that hinders visibility in an affected
area. Haze typically comprises of dust and smoke particles that causes the scattering of
light when sunlight is present. They are usually white in colour in the atmosphere and
appear to be yellowish or orange-reddish when against a bright background (cwb, online).
Therefore, when haze is unmistakably present in the atmosphere, our horizontal visibility
is damped substantially.
Relating to everything that exist in nature, when is in excessive amount, it could conjure
a threat to topple the equilibrium of a system. Likewise, as haze looms over our clear sky
disproportionately, it accumulates and when air flow is stagnant or restricted, the high
density of haze could very well affect our health, respiratory difficulties and impairs
visibility. The effects of haze are detrimental and unfavourable for any outdoor activities.
To quantify the severity of haze, various government agencies use an easy to comprehend
air quality index which measure the concentration of air pollutant in the air. The air
quality index is translated from the data acquired via an air monitoring unit installed at a
given location along with a particle sensor. Air quality standards are typically classified
into different ranges. Each of the range is assigned with a descriptor, colour code and
public health advisory.
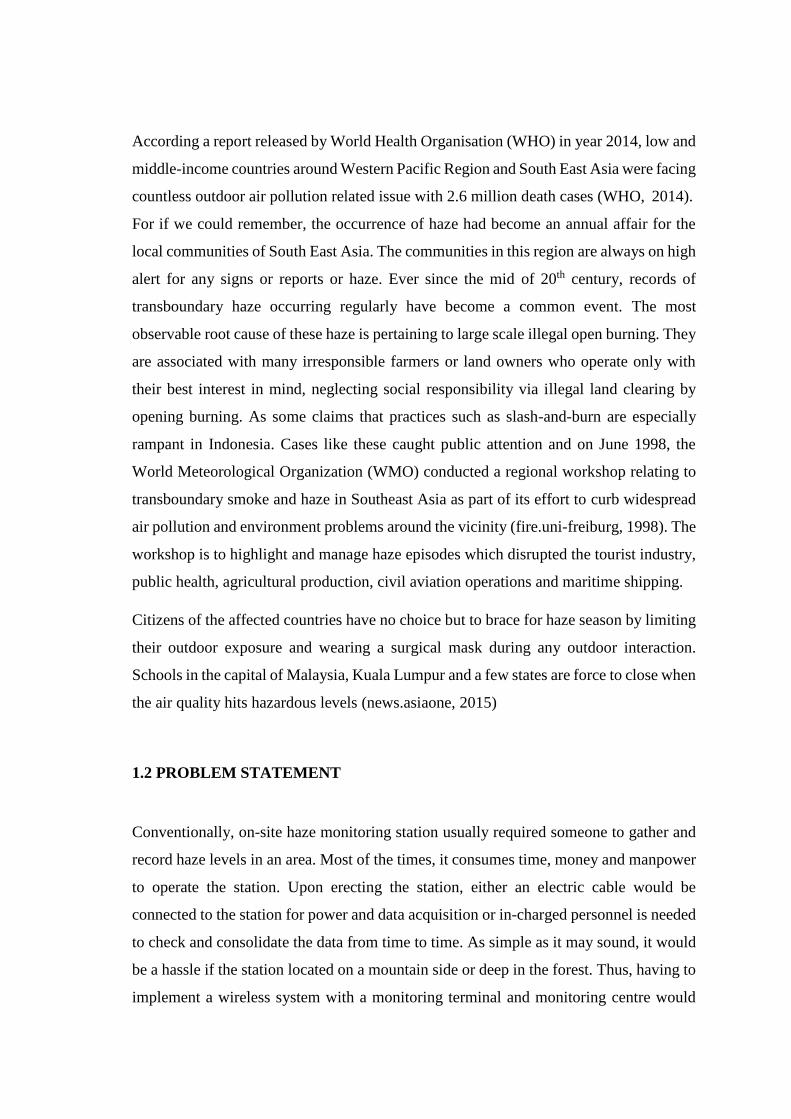
According a report released by World Health Organisation (WHO) in year 2014, low and
middle-income countries around Western Pacific Region and South East Asia were facing
countless outdoor air pollution related issue with 2.6 million death cases (WHO, 2014).
For if we could remember, the occurrence of haze had become an annual affair for the
local communities of South East Asia. The communities in this region are always on high
alert for any signs or reports or haze. Ever since the mid of 20th century, records of
transboundary haze occurring regularly have become a common event. The most
observable root cause of these haze is pertaining to large scale illegal open burning. They
are associated with many irresponsible farmers or land owners who operate only with
their best interest in mind, neglecting social responsibility via illegal land clearing by
opening burning. As some claims that practices such as slash-and-burn are especially
rampant in Indonesia. Cases like these caught public attention and on June 1998, the
World Meteorological Organization (WMO) conducted a regional workshop relating to
transboundary smoke and haze in Southeast Asia as part of its effort to curb widespread
air pollution and environment problems around the vicinity (fire.uni-freiburg, 1998). The
workshop is to highlight and manage haze episodes which disrupted the tourist industry,
public health, agricultural production, civil aviation operations and maritime shipping.
Citizens of the affected countries have no choice but to brace for haze season by limiting
their outdoor exposure and wearing a surgical mask during any outdoor interaction.
Schools in the capital of Malaysia, Kuala Lumpur and a few states are force to close when
the air quality hits hazardous levels (news.asiaone, 2015)
1.2 PROBLEM STATEMENT
Conventionally, on-site haze monitoring station usually required someone to gather and
record haze levels in an area. Most of the times, it consumes time, money and manpower
to operate the station. Upon erecting the station, either an electric cable would be
connected to the station for power and data acquisition or in-charged personnel is needed
to check and consolidate the data from time to time. As simple as it may sound, it would
be a hassle if the station located on a mountain side or deep in the forest. Thus, having to
implement a wireless system with a monitoring terminal and monitoring centre would

greatly improve efficiency, where the data could be remotely monitored and analyse in
real time.
As responsible and law abiding Malaysian, Malaysians usually receive our air pollution
index readings through news media channel or other government regulatory agency. Any
signs of spike in haze level in the atmosphere would be notify by the authority. Given the
situation, a fair amount of time is needed before the information would be fed to the
public. Therefore, when public health is concern, it is of utmost importance that the public
are provided with a timely warning and possible forecast through electronic mail such as
email, SMS or voice message? In a way, the public could anticipate before the haze hits.
1.3 PROJECT OBJECTIVES
I. To integrate a GSM (global system for mobile communication) module and
RF module into the system to enable real time tracking or warning of haze
level.
II. To notify or inform subscribers by sending SMS when haze level in a
designated area is hazardous.
1.4 PROJECT SCOPE
There are two main parts in this project, which are the hardware section and software
section. This current project will only be done on the prospects of using 1 monitoring
terminal, a monitoring centre and a GSM supported mobile phone.
The primary limitation of this system is that its solely based on GSM network for data
communication and transmission. It would work well when the monitoring terminal and
monitoring centre is within the network coverage of the service provider. The monitoring
terminal functions as a data sensing terminal where input data are recorded and processed.
When haze level approaches hazardous level, a warning message will be relayed out to a
set of subscribers via GSM. Furthermore, an additional signal will send data to the

monitoring terminal and be further processed and analyse to display graphical data and
more relevant readings.

CHAPTER 2
LITERATURE REVIEW
2.1 INTRODUCTION
This section is a consolidation of the journals read pertaining to the study that are either
directly or indirectly related. By reading and cross-referencing multiple journals, a clearer
picture and insightful findings of the study at hand are acquired.

2.2 WIRELESS GSM (GLOBAL SYSTEM FOR MOBILE COMMUNICATION)
The world’s first cellular system to specify digital modulation is the Global System for
Mobile Communication. It is classified as a second-generation system where it was
developed to solve the first-generation network, 1-G fragmentation problem. It was
initially introduced in Europe in 1991 and gradually it had been adopted in many Non-
European countries (Vikrant Vij, 2010).
Global System for Mobile communications in short, GSM dominate as the world most
widely used cell phone technology. Most cell phones operate under a cell phone service
carrier’s GSM network by communicating with cell phone towers located in the nearby
area. Dating back to the year 1982, the Groupe Special Mobile (GSM) was created by the
European Conference of Postal and Telecommunications Administrations (CEPT) to
serve as a pan-European mobile technology. As an up-to-date report, according GSM
Association (GSMA) nearly 80 percent of the world, which is about 3 billion global
population uses GSM technology when making wireless calls and sending text messages.
While in the United States, cell phone users can subscribe to either CDMA or GSM based
network carriers. In this case, CDMA stands for Code Division Multiple Access is
another major radio system used in cell phones. To clarify this issue, CDMA are used by
Sprint, Verizon, Virgin Mobile network carrier, while AT&T and T-Mobile uses GSM.
Apart from that, the rest of the world uses GSM network.
The services that are provided by GSM could be classified into three main categories,
they are telephone service, data services and supplementary services. However, in this
project, we would be utilizing General Packet Radio Services to enable communication
between devices that is also part of GSM system.
To simply GSM system architecture in Figure 2.1, the system consists of three major
subsystems that are virtually connected together with users through network interfaces,
which are Base Station Controller (BSC), Base Transceiver Station (BTS), and Mobile
Switching (MSC). In GSM network, a Mobile Station (MS) are the portable devices that
we are carrying with us every day, better known as a hand phone in layman terms. Two
main components of a MS are Subscriber Identity Module (SIM) and a handset. Whereas

a BTS and BSC are under Base Station Subsystem, its role is to perform functions ranging
from radio resource controlling to digital signal processing. MSC is tasked to perform
setting up call, call routing, collecting billing information, paging, echo cancellation and
alerting appropriate registers (Vikrant Vij, 2010). Visitor Location Register (VLR),
Equipment Identity Register (EIR) and Home Location Register basically identity the
location, the user and manage database of the user.
Figure 2.1: Architecture of GSM
Source: Wireless Communication by Vikrant Vij., (2010)
The users of GSM network are identified through a unique SIM (subscriber identity
module) card (Gagliarducci, M., Lampasi, D. A., & Podestà, L., 2007). They can utilize
the SMS service which falls under GSM function that enable users to transmit to and
from a mobile station (MS) text message, containing up to 160 bytes of characters
(Peersman, C., Cvetkovic, S., Griffiths, P., & Spear, H., 2000).
GSM network has the advantages of wide covering area, long communication distance
mature technology, and sound communication effect and et-cetera (Calcante, A.,
Tangorra, F. M., Marchesi, G., & Lazzari, M., 2014). As stated by SMS point-point

(SMSPP) standard defined by ETSI (European Telecommunication Standards Institute),
this function relies on the nature and of the SMS origin and destination. Whenever a
message is send by a mobile station and is terminated, in the absence low connectivity or
no connection, a local SMS Center will store it and tries to send it repeatedly for three
days as soon as a mobile station is available. Frequency bands in which the GSM network
could be operated in Malaysia and most of the world are 900MHz or 1800 MHz (Pereira
V., Sousa T., Mendes P., Monteiro E., 2004).
Typically, a GSM module are controlled using industry standard AT command, which is
an abbreviation for Attention. Every command line begins with “at” or “AT”, it is a prefix
to inform the module the starting line of command. However, they’re also used to control
wired dial-up modem. Each of the modem interfaces to the host through a USART
(universal synchronous/asynchronous serial receiver-transmitter), that is automatically
detected by the operating system. As a clarification, when the term mobile station is
mentioned, it refers to the modem. Furthermore, AT commands consist of three parts,
starting with AT, then by a command and ended with a line termination character <cr>.
2.2.1 GSM Related-Works
A distribution transformer monitoring system implemented using GSM in (Al-Ali, A. R.,
Khaliq, A., & Arshad, M., 2004) for the purpose of monitoring and recording key
indicators found in a distribution transformer. It is said that, when any abnormality or
emergency happen at the transformer, a short message could be send to designated mobile
phone to alert whom it may concern. In this research, the parameters measured are load
currents, transformer oil and ambient temperatures. Having established that, an embedded
system module is designed which consist of a signal conditioning circuit block and
controller block. The signal conditioning block is serve to take readings from sensors and
convert it to a compatible signal. Whereas the controller block would be in-charge of
parameters acquisition, processing, displaying, transmitting and receiving. It is then
attach to a GSM modem using a RS-232 data adapter where it could send and receive
message of size not more than 160 characters. The time taken to receive an SMS varies
from 2-10 seconds depending network traffic.

Chen Peijiang discussed about implementation of a remote monitoring system based on
GSM (Peijiang, C., & Xuehua, J., 2008). This system aims to establish remote monitoring
platform utilising GSM short message mode. It is stated that this sort of monitoring is
most fitting for occasions which has random monitoring scope, small data, difficult
wiring and low real-time requirement and so on. Following this implementation, the
system consists of a central monitoring station, a GSM network and remote monitoring
station. MSP340F149 a 16-bit ultra-low power microcontroller is used as part of the
remote monitoring station along with a GSM module TC35 and peripheral circuit. Similar
to it, the central monitoring station will also use GSM module TC35 to enable
communication between the two station. In addition, Visual Basic 6.0 is the base
language that was chosen to develop the control interface, for program initialization of
monitoring centre, the program of accepting and sending short messages, data processing
and preserving program along with facilitating serial communication. It was also
mentioned that GSM network can be interconnected and roamed all over the country.
Looking at a wireless system monitoring point of view, Hui liu proposed a type of
wireless sensor network prototype for environmental monitoring in greenhouses that is
divided into a two-part framework (Liu, H., Meng, Z., & Cui, S. 2007). Where the first
one is allocated for data acquisition with parameters being temperature, soil moisture and
humidity, sense by a monitoring network. After that, all the data is redirect to a sink node
which it will employ the use of a GSM network to transfer the data to remote management
centre. The benefits by doing so comes in lots, it could provide a dynamic real-time data
of the landscape on its monitored variables, thus allow scientist to measure properties that
had not been previously measured continuously. Similar to our project, the data will be
able to be accessed by the terminal through a RS-232 serial interface by the terminal
(microcontroller), a single board computer. The terminal is integrated to a few
communication ports and its peripheral modules such as GSM module, LCD and touch
panel. The system is programmed to perform time-triggered sampling of the sensors for
every 5 minutes and programmed to be in sleep state when not sensing or communicating.
In addition, the management centre will have a GSM module for receiving data from the
monitoring network to be logged in and analyse. It was also stated that RSSI (received
signal strength indicator) could be used in such way to examine radio propagation losses
caused by misalignment of antenna and its height.

A feasibility study was conducted on application of GSM-SMS technology to field data
acquisition (Tseng, C.-L, et al 2006). It is based on field data collection prototype system
that composed of field monitoring and host control platforms. Using GSM-SMS based
communication architecture to developed a short message format that is used to monitor
farming area and record field data, such as humidity, wind speed, number of pest captured
and temperature. There are four advantages to mobile communication technology, they
are low power requirement, covers a wide range of area, user data can be stored in GSM
service centre temporarily and having group broadcast function. Besides that, SMS used
in filed data acquisition do not need long cables, contains encryption to protect SMS data
and during transmission failure, retransmission can be configured again. Coding and
decoding of data between field monitoring and host control platforms can be achieved by
predefining data format of SMS. Generally, 160 bytes is the maximum length of a SMS
message. As a means to verify the correctness and feasibility of SMS data transmitting
across the field, a simple trap device for moth was integrated in the field monitoring
platform with a 8051 chip as a counter. Host control platform prototype was create using
Visual Basic 6.0 on a PC for the graphical user interface program. The data transmission
had a test record of 100% data accuracy rating from performance rating test.
Another study focuses on GSM-based remote wireless automatic monitoring system for
field information on case study relating to ecological monitoring of the oriental fruit fly
(Jiang, J.-A, et al.2008). In aid of building an accurate and reliable integrated pest
management system, information on popular dynamics and related ecological factors can
be acquired using modern day wireless communication technology (GSM). Through
replaying through traditional monitoring method, cost will be reduced and data collection
are more synchronized. By having the population dynamics of the fly over a large scale
area, appropriate pest control measures can be taken at the right time and place. Similarly,
the system is make-up of 2 parts, which is the remote monitoring platform(RMP) and
host control platform(HCP), both with a GSM module to transmit and receive data. To
ensure a higher accuracy of the trapping device used here, double counting sensors are
used to reduce counting errors of fly. The RMP with its MSP430F449 chip are able to
package sensory data and number of trapped flies in a short message and be transmitted
to HCP at a pre-set time interval by GSM module. After that, it is written on to MySQL

database done in LabView by the HCP for users to access the information. The reliability
of this system is concluded to be 95%.
According to Othman, K. A work developing a mobile monitoring system to measure
haze level in an area with GSM implementation (Othman, K. A., Abdullah, E. H., Li, N.,
& Rashid, N. E. A. 2014). GSM modem is one of the application in wireless technology
that enable communication between user and the microcontroller system through short-
message-system. A MQ-2 smoke sensor reads data which is processed digitally and
evaluated before transmitting to receiving mobile phone using GSM modem. MPLAB
IDE Version 8 is used for simulation and initial testing to ensure hardware and software
are error free. It was highlighted that GSM network is reliable due to its capability on
different bands and able to send data to multiple users
A paper by Tang, Z. present a remote alarm monitor and a control system based on GSM
and ARM (Tang, Z., Shuai, W., & jun, L. 2011). The system uses a LPC2368
microcontroller, smoke sensor MQ-2, DS18B20 temperature sensor, HS1101 humidity
sensor and camera to operate. They are to record any abnormally and send MMS using a
GSM module to alert the user. Communication between GSM and the microcontroller is
made via RS232 interface. Through testing, the project was a success and whenever
abnormality was detected, the system will send an alert message.
As conducted by Gagliarducci, Lamapsi and Podesta on GSM-based monitoring and
control of photovoltaic power generation, it is observable that this system is able to record
and periodically reports the overall performance of the plant along with in case of
anomaly, operators will also be informed immediately (Gagliarducci, M., Lampasi, D. A.,
& Podestà, L. 2007). Besides that, with appropriate instruction, users are able to modify
some working elements of the plants and settings of measurement system. All of this are
done under the reliance of GSM network, where the users and the system communicate.
The location of where the system is placed are usually difficult to reach and presence of
maintenance operators should be low. Thus the reason why the plant had to be monitored
and controlled remotely. This motoring and control system (MCS) is a combination of 3
sub-systems, which are the sensor module (photovoltaic sensor cell), data acquisition
system (DAS) and the transmission system to and from the MCS using GSM. This system
launches three parallel process when it is activated, the first one is to supervise the correct

working of the plant and inform the operators when an alarm is set off. The second
process records data on the regular functioning of the plant and send an SMS in a timely
manner. In the third process, it is dedicated to remotely control and change the
measurement settings of the plant after recognition of commands receive by SMS. The
changes can be done either through software or activating special switches. As the three
process runs concurrently, the shared resources need to be managed, where priority is
always given to the third process. Once it is built, the system was tested in a controlled
room where long-time verification was done to foresee the working conditions.
A GPS/GSM based birth alarm system for grazing cows by Calcante A. help farmers to
act promptly and reduce potential injury to the calf directly cause by the mother or by
environmental factors (Calcante, A., Tangorra, F. M., Marchesi, G., & Lazzari, M. 2014).
Monitoring calving is important for cows with poor health or with primary labor
insufficiencies as well as for cows with valuable off spring. This GPS-Calving Alarm
(GPS-CAL) allows farmers to quickly intervene when needed by sending a SMS when
delivery begin. In the SMS, birth event data, hour, animal ID and GPS coordinates are
stated as well. This particular study is divided into 2 phase, the first phase is to design
and develop the GSP-CAL system where hardware selection and firmware
implementation, static test to determine horizontal accuracy, precision of GPS and power
consumption testing. Whereas the second phase include prototyping under real operating
conditions. The GPS-CAL hardware for transceiver and receiver are powered by lithium
batteries which could last up to 32 days on regular basis. Upon testing, the system proved
to be reliable with 100% sensitivity and 100% positive predictive value.
Another study was done by Hu, J. M on automobile anti-theft system based on GSM and
GPS module to notify users of suspicious actions and detect car location (Hu, J. M., Li,
J., & Li, G. H., 2012). This system is made up of a GSM module, GPS module, vibration
sensor, wireless remote control and MCU unit. Focusing on the GSM module, TC35i by
Siemens is selected because it is an integrated module with 900/1800MHZ which support
voice and short message.

2.3 SMOKE SENSOR
Smoke sensors are devices that can detect various types of particle in the air, commonly
found in smoke detector which in the presence of anomaly would give off an alarm. There
are two types of conventional smoke sensor that are typically found, one of which uses
an optical smoke sensing unit, where a side of its internal wall will emit light and be
received by another side of its wall. Contrary to that, there is also the ionization smoke
sensing unit, this concept is similar to an inductor which is able to measure smoke particle
smaller than an optical sensor, having cavity in its interior that allows particle to flow
through which directly affect the current (Chien, H. C., 2014).
In a simple research done by Ansar Suyuti and her partners on portable gas emission
design using microcontroller (Suyuti A., Tola M., Muh. Saleh Pallu, Harun N.,
Syafaruddin, Takashi Hiyama, 2013). Air pollutant that normally exist in the air are 𝑂2,
S𝑂2, CO, N𝑂𝑥, S𝑂4 gaseous and dust particle with heavy metals. Thus smoke sensor with
high sensitivity should be implemented to in detecting air pollution or haze. Also
mentioned are the types of sensors used in the study, among them are KE25 to detect
oxygen, MQ136 for S𝑂2, MQ7 for CO, TGS2201 for N𝑂𝑥 and MQ2 for opacity of smoke
in the air.
Furthermore, research by Abdul Hadi Nograles H. on low cost internet based wireless
sensor network for air pollution monitoring using zigbee module, mentioned that MQ2
smoke sensor is able to detect 7 different types of gas compounds and at the same time
commercially available (Nograles et al, 2014). This sensor’s sensitivity mainly depends
on the ratio of sensor resistance (Rs) during expose to smoke and the initial sensor
resistance reading, Rs/Ro then being converted to Parts Per Million (PPM) figure using
designated equations.
2.3.1 Calibration of Smoke Sensor
Smoke sensors are very handy and useful components to detect the level of certain gas in
the air, however proper calibration must be performed to avoid low accuracy and improve
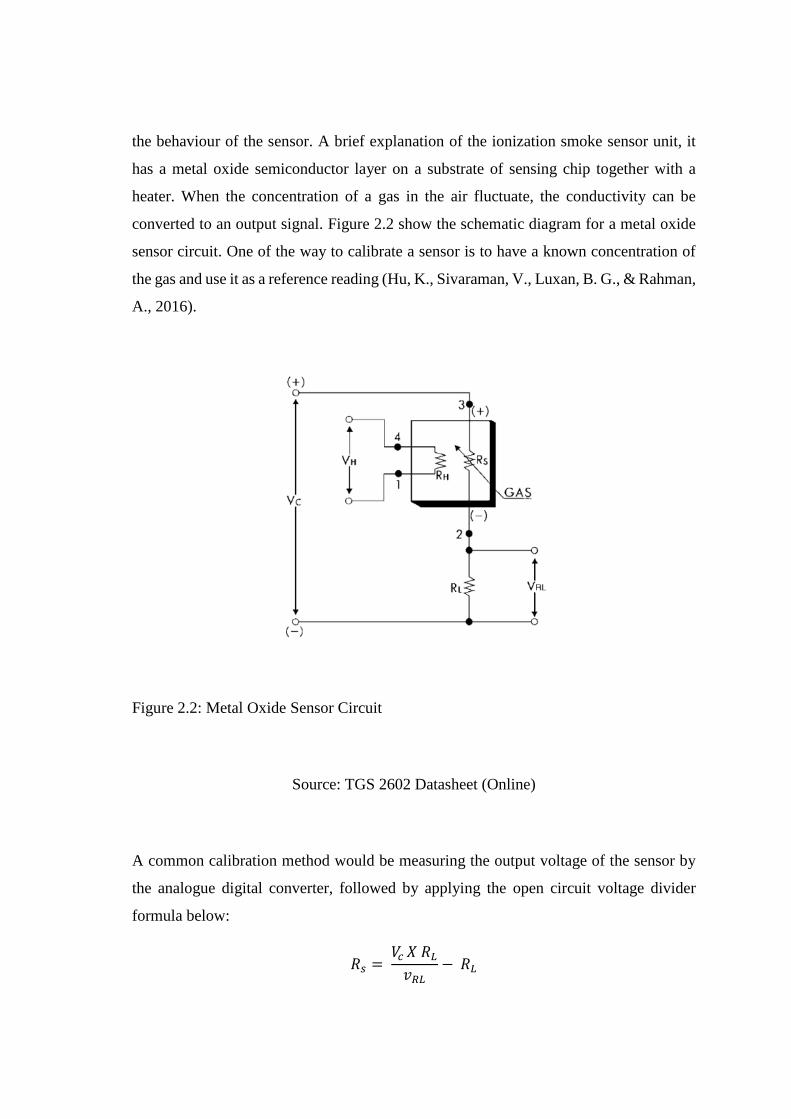
the behaviour of the sensor. A brief explanation of the ionization smoke sensor unit, it
has a metal oxide semiconductor layer on a substrate of sensing chip together with a
heater. When the concentration of a gas in the air fluctuate, the conductivity can be
converted to an output signal. Figure 2.2 show the schematic diagram for a metal oxide
sensor circuit. One of the way to calibrate a sensor is to have a known concentration of
the gas and use it as a reference reading (Hu, K., Sivaraman, V., Luxan, B. G., & Rahman,
A., 2016).
Figure 2.2: Metal Oxide Sensor Circuit
Source: TGS 2602 Datasheet (Online)
A common calibration method would be measuring the output voltage of the sensor by
the analogue digital converter, followed by applying the open circuit voltage divider
formula below:
𝑅𝑠 = 𝑉𝑐 𝑋 𝑅𝐿
𝑣𝑅𝐿− 𝑅𝐿

Source: TGS 2602 Datasheet (Online)
Where,
Vc = Input Voltage, normally 5V
𝑣𝑅𝐿 = Output Voltage
𝑅𝑠 = Sensor Resistance
𝑅𝐿 = Load Resistance
𝑉𝐻 = Heater Voltage
𝑅𝐻 = Heater Resistance
Load resistance, 𝑅𝐿 is usually a resistance value that’s is predefined according to specific
type of gas. Next, 𝑅0 is to be calculated, it is the value of sensor resistance at a known
concentration without the presence of other gases. The calculated 𝑅0 will be used to find
the concentration of the gas. Following that, we will then connect the sensor to a
microcontroller unit, define the gain and 𝑅𝐿 to determine the 𝑅0 resistance at a known
concentration.
Figure 2.3: Typical Sensitivity Characteristics of MQ-135 for several gas at 20, 65%
RH, 21% 𝑶𝟐 concentration, 𝑹𝑳= 20kΩ
Source: MQ-135 Sensor Technical Data

From the log-log plot Figure 2.3,
Ro: sensor resistance at 100ppm of NH3 in the clean air.
Rs: sensor resistance at various concentrations of gases.
Clean Air Factor: 𝑅𝑆
𝑅𝑂⁄ = 3.59
By referring to this value, we are able to calculate 𝑅𝑂 of the sensor and calibrate it
accordingly.
2.4 ARDUINO
Figure 2.4: Arduino Variants
Source: Online, SparkFun Arduino Comparison Guide, (Online)
Arduino is an open source hardware that was developed to simplify our experience when
dealing with microcontroller hardware and software. Arduino was founder by a small
group of competent entrepreneur in Italy, they’re none other than Massimo Banzi, David
Curtilles, Tom Igoe, Gianluca Martino and David Mellis (Arduino, Online). Their goal is

to develop a line of microcontrollers which are easy to learn and user-friendly, at the
same time having a significant amount of processing power. The penetration of Arduino
platform is usually aim at beginners, hobbyists and students who are learning to program
a microcontroller for a projects. Even so, Arduino could also be used to run a complex
system with adequate knowledge.
Arduino uses a simple programming language derived from C/C++ language in Arduino
Software (IDE), to top that up, it a cross platform software where it could run on Windows,
Mac OS X and Linux. Arduino products are built to accommodate an open source
hardware and software, which translate to openly sharing its development to stimulate
fresh ideas among users and further advance its concept (Steven F. Barrett, 2012).
Arduino products are program using Arduino Development Environment where
interfacing and burning a code into an Arduino is done. One of the product called Arduino
Uno is built upon ATmega328 chipset, connecting to a computer via USB port. Another
product would the Arduino Mega, slightly bulkier than Uno with added ports is based on
Atmega1280 chipset. Sketches are what we use write our program in an Arduino
Software which would be later saved in the form of a file extension .ino. Table 2.1 below
is a comparison of specifications between Arduino Uno and Mega:
Table 2.1: Comparison Between Arduino Uno, Arduino Mega and Arduino Nano
Source: Arduino, (Online)
NAME Arduino UNO Arduino Mega Arduino Nano
Processor ATMega328P ATMega2560 ATMega328P
CPU Speed 16MHz 16MHz 16MHz
Analog In/Out 6/0 16/0 8/0
Digital In/Out 14/6 54/15 14/6
EEPROM (kB) 1 4 1
SRAM (kB) 2 8 2
Flash (kB) 32 256 32
UART 1 4 1

CHAPTER 3
METHODOLOGY
3.1 INTRODUCTION
This chapter emphasizes on the methods used to develop a wireless based haze
monitoring system. This mainly involve establishing different systems block and how it
interfaced with each other. A brief explanation of each block and its components are
described.

3.2 PROJECT FLOW CHART
Start
Title Selection
Define Research Area & Problem
Literature Review
(Concept with Theory &
Previous Works)
Simulation & Expected Results
Results & Discussion
Conclusion
Recommendation & Future Works
A
A
End
Methodology
Software & Hardware
Implementation
Figure 3.1: Shows the flow chart of the project
Figure 3.1 presents the flow chart for the entire project, it began by defining research
areas and problems after a title was selected. Once that is done, various journals relating
to similar concept with theory and previous works are studied. Upon gathering enough
information, a project methodology is created which then act as a reference for our
simulation and expected results phase. After that, the software part and the hardware part
are implemented, which would then be used to obtain results and make discussion. Lastly,
a conclusion will be written along with recommendation for future works.

Methodology Flow Chart
Start
Compare and Analyze Different
Types of Components
Selection of Components and
Materials Procurement
Design Circuit Layout
Design Remote Monitoring
Terminal Outlook
Create a Bill of Material
Finalize Project Specifications and
Functionalities
B
B
End
Figure 3.2: Shows the flow chart of the methodology
In Figure 3.2, the chart further explains the methodology that is being adopted in this
project. The process is done in an ascending order. The first process would be to
determine the project specifications and functionalities. After knowing that, comparison
of different types of components is done and be selected. Followed by designing a circuit
layout and its exterior outlooks with dimensions. Lastly, create a bill of material and make
procurement.

Software and Hardware Implementation Flowchart
Start
Coding
Identify Problems and Troubleshoot
Assemble and Combine with
Hardware
Compile & Burn Written Code into
Microcontroller Unit
Build Circuit
Perform Test and Iterate
C
C
End
Figure 3.3: Shows the flow chart of the Software and Hardware Implementation
Procedures
In the above Figure 3.3 depicts a more detailed flow chart of software and hardware
implementation presented in Figure 3.1.

3.3 PROJECT GANNT CHART
Table 3.1 Shows the Gannt Chart for The Project

3.4 BLOCK DIAGRAM OF THE SYSTEM
Haze Monitoring Terminal
Gas/Smoke
Sensor
Signal
Conditioning
Ciruit
Arduino Nano
(Microcontroller)
A6 GPRS
GSM Module
Battery Pack
(Power
Source)
Wireless
Transceiver
(NRF24L01)
Optical Dust
Sensor
Figure 3.4: Shows the block diagram of the haze monitoring terminal
START
POWER UP
INITIALIZE PORTS & PERIPHERALS
RECORD HAZE LEVEL IN PPM
SEND READING & BATTERY LEVEL VIA
RF MODULE TO MONITORING
CENTRE
HAZE LEVEL HAZARDOUS?
NO
SEND SMS TO ALERT USERS VIA
GSM
END

Figure 3.5: Shows the flow chart of the haze monitoring terminal
Haze Monitoring Centre
ARDUINO Nano (Monitoring
Centre)
LCD
DISPLAY
Battery Pack
(Power
Source)
Computer
Wireless
Transceiver
(NRF24L01)
Figure 3.6: Shows the block diagram of the haze monitoring centre
START
POWER UP
INITIALIZE PORTS & PERIPHERALS
RECEIVE HAZE READING & BATTERY
LEVEL VIA RF MODULE FROM MONITORING
TERMINAL
RECEIVE WARNING MESSAGE?
NO
DISPLAY WARNING
MESSAGE ON LCD
END
YES
Display Haze Level on LCD & Battery Level

Figure 3.7: Shows the flow chart for the haze monitoring centre
3.5 HARDWARE
3.5.1 MQ-135 Smoker Sensor
Figure 3.8: MQ-135 Smoke Sensor
Source: Circuitstoday , (Online)
According to the datasheet, this sensor is highly sensitive to NH3, NOx, alcohol, Benzene,
smoke, CO2 and CO. It is suitable for various application such as gas detecting gas
leakage in home or industry use. Besides that, we will be using this sensor to detect CO
in the presence of air and to measure the saturation level. Table 3.2 shown below is the
technical specification of the sensor:
Table 3.2 Technical Data of MQ-135 Smoke Sensor
Model. No MQ-135
Sensor Type Semiconductor
Detection Gas Combustible Gas and Smoke
Concentration 10 – 110ppm
Operating Temperature -20°C to +50°C
Operating Voltage 5V
Load Resistance Adjustable
Sensing Resistance 30KΩ to 200 KΩ

3.5.2 Arduino Uno
Figure 3.9: Arduino Nano
Source: Arduino, (Online)
Arduino Uno will be selected and used as the core of the data acquisition system. It would
receive data from the sensor, analyse the data and later on transmit a signal to the haze
monitoring centre. Arduino Nano is chosen because it has a library build on top of it with
a simplified programming platform. In addition, the operating voltage for this
microcontroller is 5V, which coincide with the operating voltage of their other
components in this project.
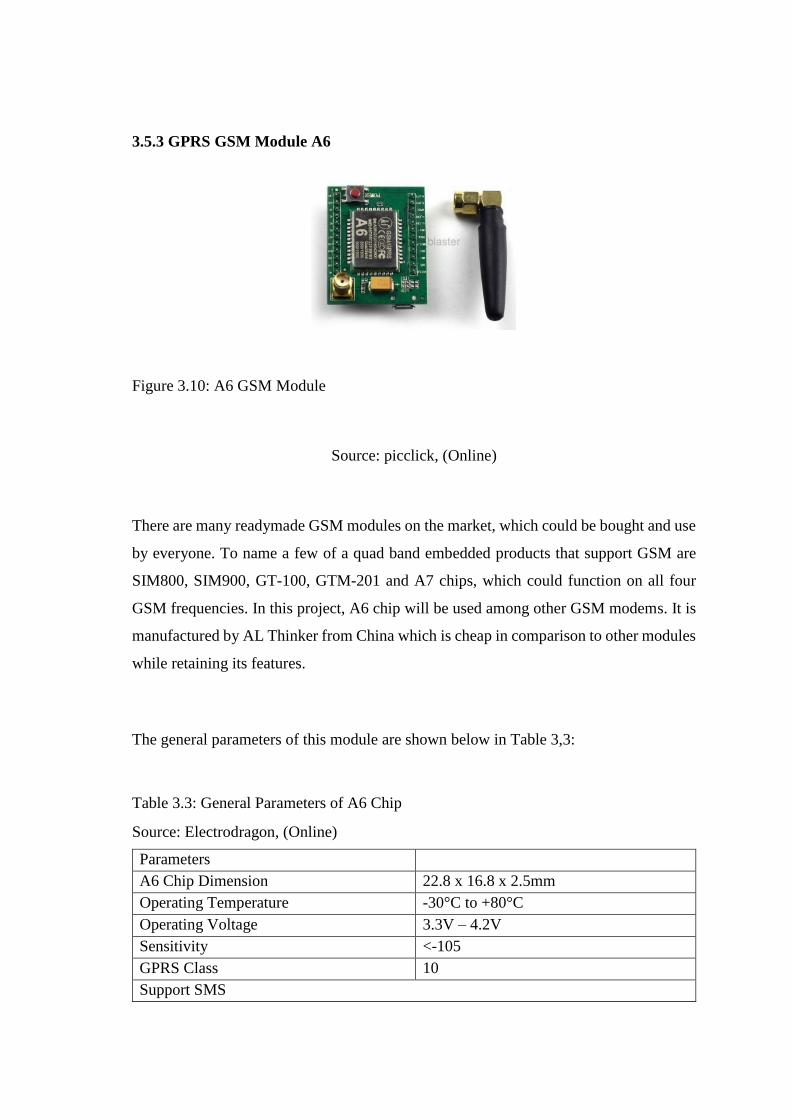
3.5.3 GPRS GSM Module A6
Figure 3.10: A6 GSM Module
Source: picclick, (Online)
There are many readymade GSM modules on the market, which could be bought and use
by everyone. To name a few of a quad band embedded products that support GSM are
SIM800, SIM900, GT-100, GTM-201 and A7 chips, which could function on all four
GSM frequencies. In this project, A6 chip will be used among other GSM modems. It is
manufactured by AL Thinker from China which is cheap in comparison to other modules
while retaining its features.
The general parameters of this module are shown below in Table 3,3:
Table 3.3: General Parameters of A6 Chip
Source: Electrodragon, (Online)
Parameters
A6 Chip Dimension 22.8 x 16.8 x 2.5mm
Operating Temperature -30°C to +80°C
Operating Voltage 3.3V – 4.2V
Sensitivity <-105
GPRS Class 10
Support SMS

Support Voice Calls
Standby average current less than 3ma
Support Standard GSM 07.07, 07.05 AT commands
Support GPRS data traffic
Support 2 serial ports
Figure 3.11: A6 GSM Being Initialised by AT Command
The above Figure 3.11 portrays AT command is still widely used to control a GSM
module to activate and operate it. Various AT commands could be sent via a serial port
to communicate with the device. Hence, a study of AT commands would be needed.

3.5.4 Optical Dust Sensor GP2Y1010AUF
Figure 3.12: Optical Dust Sensor GP2Y1010AUF
Source: Itead, (Online)
This dust sensor uses an infrared emitting diode(IRED) and a phototransistor which is
arranged diagonally to detects the reflected light of dust in air. It is especially useful in
detecting fine particle such as smoke. It has a low current consumption at 20mA and is
46.0 x 30.0 x 17.6 mm in dimension.
Table 3.4: Parameters of GP2Y1010AUF Dust Sensor
Recommended Parameter
Value
Supply Voltage, Vcc (V) 5 ± 0.5
Input Terminal Voltage, -0.3 to
Vcc
Current Consumption(mA)
11 to 20
From Table 3.4, the working parameters of the dust sensor are listed. It will be referred
when necessary and during establishing connection to the microcontroller used. The
recommended supply voltage of this sensor is 5V ±0.5V with current draw between the
range of 11mA to 20mA.

Figure 3.13: Output Voltage Versus Dust Density
Source: Sparksfun, (Online)
On the other hand, Figure 3.12 shows response graph of this sensor in term of dust density
(mg/𝑚3) to amount of output voltage emitted. The trend in this graph shows a linear
proportional response from the start till it reaches a saturation limit and remains the same.
Hence, it would be easy to operate this sensor without much mathematical model.
Table 3.5: General Health Effects and Cautionary Statements Within Each API
Categories
Source: A Guide to Air Pollutant Index in Malaysia by Department of Environment
Malaysia
Air Pollution Index (API) Description
0 - 50 Good
51 – 100 Moderate
101 – 200 Unhealthy
201 – 300 Very Unhealthy
>300 Hazardous
The above table is a general guideline to safe air quality corresponding to API that is
being adhered in by the Malaysia’s department of environment. For a better
understanding, air quality is categorized into five different levels with the ideal being
good and least desirable being hazardous. Hence, the project will be based on this
reference to translate air readings from ppm to API.

3.6 SOFTWARE
3.6.1 Arduino Software (IDE)
This software is used to preload or program an Arduino. Besides that, it has its standalone
cross platform user interface. Version 1.6.13 will be used to program the board for this
project.
3.6.2 Visual Studio 2015
Visual Studio 2015 will be used to make a graphical user interface implementing C# to
present, record, tabulate and save data from the haze monitoring terminals. This serve as
a handy add-on to the project for better data presentation and analysis.
3.7 BILL OF MATERIALS
Table 3.6: Shows the bill of material of the project
No. Price Quantity Cost Remarks
1 MYR 39.90 2 MYR 79.80 gie.com.my
2 MYR 16.30 1 MYR 16.30 aliexpress.com
3 MYR 9.00 1 MYR 9.00 lelong.com.my
4 MYR 19.10 2 MYR 38.20 mydruino.com
5 MYR 22.90 1 MYR 22.90 lelong.com.my
6 MYR 11.30 1 MYR 11.30 gie.com.my
7 MYR 0.30 1 MYR 0.30 lelong.com.my
8 MYR 14.30 1 MYR 14.30 lelong.com.my
9 MYR 6.00 2 MYR 12.00 lelong.com.my
10 MYR 26.80 1 MYR 26.80 gie.com.my
11 MYR 5.00 2 MYR 10.00 lelong.com.my
12 MYR 28.80 1 MYR 28.80 lelong.com.my
13 MYR 2.00 2 MYR 4.00 lelong.com.my
14 MYR 4.00 1 MYR 4.00 aliexpress.com
15 MYR 15.00 2 MYR 30.00 lelong.com.my
16 MYR 41.50 postal
Main Components
Arduinon Nano 3.0
A6 GSM GPRS Module
MQ-135 Smoke Sensor
DHT-22 Temperature Humidity Sensor
16X2 LCD
Resistor (set)
Battery (12 units)
Single Core Wire
PCB Board
Weatherproof Electrical Junction Box
Toggle Switch
5V Mini Fan
Shipping Fees
MYR 349.20Total
Nordic NRF24L01 Module
Battery Holder with Switch
Optical Dust Sensor GP2Y1010AUF

Table 3.6 depicts the total amount of budget that had been allocated for the procurement
of the necessary components at RM 349.2. The quantity and source of procurement are
listed out in the above table.
3.8 EXPECTED OUTCOME
This project expects the user to be able to monitor the haze level from a distance not less
than 100m away through the monitoring center and be alerted with a SMS at a fixed time
interval.
In addition, when haze level exceeds preset level, a SMS alert will be delivered to mobile
subscribers to provide a warning, indicating haze category.

CHAPTER 4
RESULTS AND DISCUSSION
4.1 INTRODUCTION
This chapter consists of the data that had been collected upon experimenting on the output
values of the haze monitor after it is built. A couple of test are performed to measure and
record the data for further analysis.

4.2 HARDWARE IMPLEMENTATION
Figure 4.1 and Figur 4.2: Haze Monitorng Terminal Front and Back View
Figure 4.1 and Figure 4.2 are the final design outlook of the haze terminal which will be
placed outside to measure and convey out haze readings. Attaached on the boxis a antenna
for the A6 GSM module together with a toggle On/Off switch next to it. In Figure 4.1, a
small 5V mini fan is attached to the box as an intake point of the surrounding air to the
dust sensor inside. Next in Figure 4.2, MQ-135 gas sensor and DHT-22 temperature
humidity sensor are protruding out from the box’s surface to measure data.
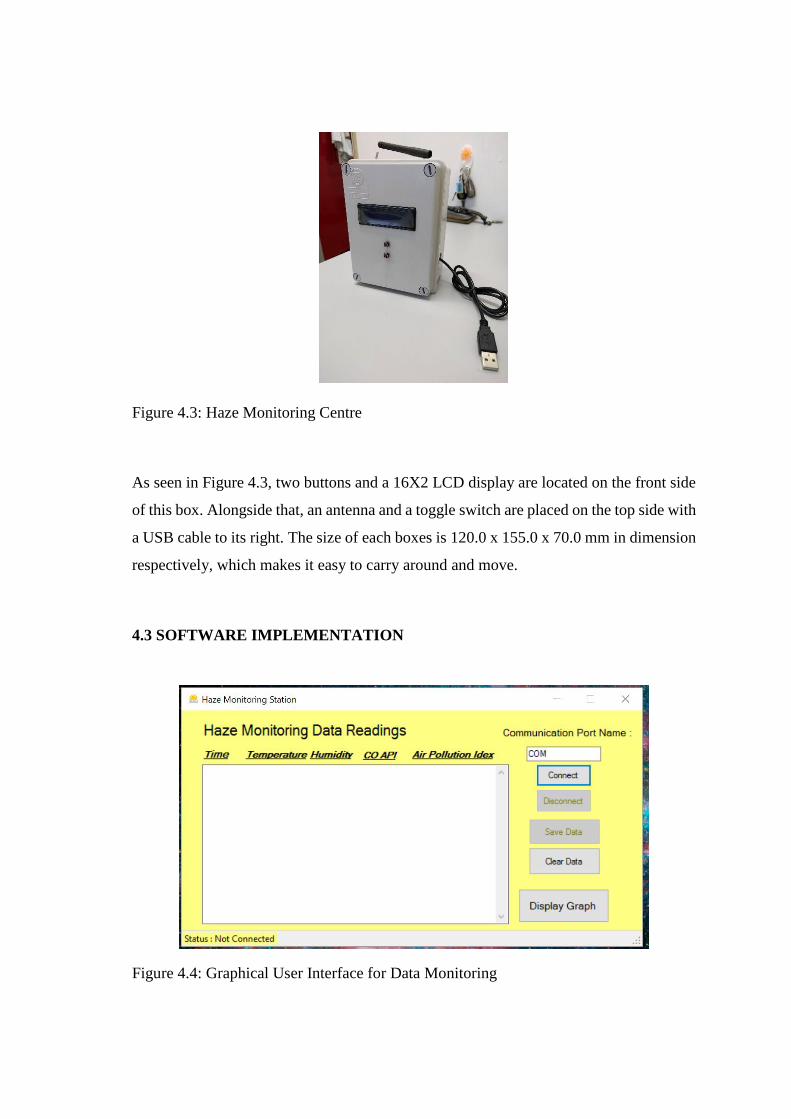
Figure 4.3: Haze Monitoring Centre
As seen in Figure 4.3, two buttons and a 16X2 LCD display are located on the front side
of this box. Alongside that, an antenna and a toggle switch are placed on the top side with
a USB cable to its right. The size of each boxes is 120.0 x 155.0 x 70.0 mm in dimension
respectively, which makes it easy to carry around and move.
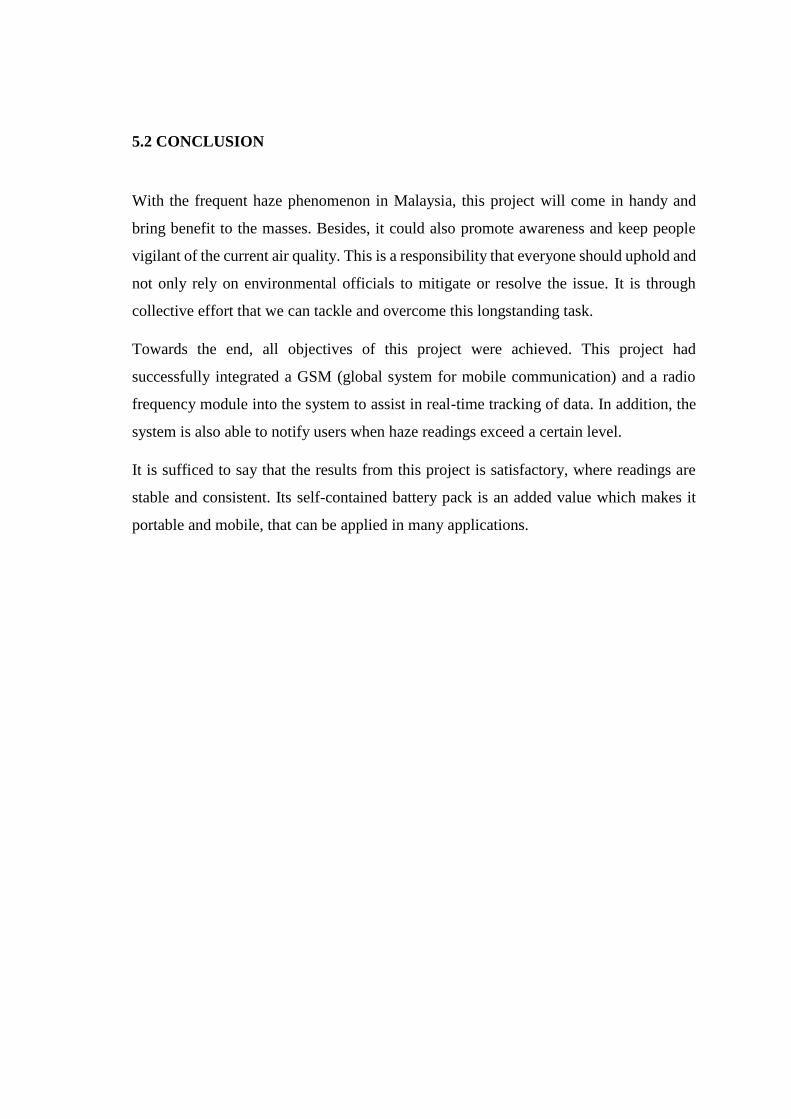
4.3 SOFTWARE IMPLEMENTATION
Figure 4.4: Graphical User Interface for Data Monitoring

Shown in Figure 4.4 above is a blank GUI when it is not connected to the monitoring
centre. The interface is user friendly and easy to use even for first timers. On it, users will
be able to flick through sensor readings at different times. To initialize the program, users
will need to connect the monitoring centre to the computer via USB cable for data to
appear.
Figure 4.5: Graphical Plot Outlook of Sensor Readings
From Figure 4.5, it shows the outlook of graphical data of the sensor readings after its
recorded over time. The readings will be graph in coloured separated form to distinguish
different input data.

4.4 Test Phase
4.4.1 PRELIMINARY TEST 1
4.4.1.1 DATA FROM MONITORING CENTRE
The first test run after both hardware and software implementation was completed. The
first test was conducted on 14/04/2017
UMP Pekan KK512 from 1512 hour to 1712 hour.
Figure 4.6: Data Acquired Displayed on GUI
It can be observed in Figure 4.6 that the first data was displayed on the GUI at 1513
hour and constantly be updated on a minute by minute basis. The data is presented in an
orderly and organised fashion which is easy to read.

Figure 4.7: Air API Reading Graph
From Figure 4.7, throughout the 2 hours during the preliminary testing, the API level of
UMP Pekan fall within the range of 10 to 22. The readings are mostly populated in
between 10 and 15. Whilst it is true and relatable, since UMP Pekan is an academic
institution with hostels, the air pollution index wouldn’t possible be high under normal
circumstances. The readings on this graph is measure using optical dust sensor
GP2Y1010AUF.
Figure 4.8: Temperature Reading Graph
The above Figure 4.8 depicts the temperature readings at UMP Pekan having readings
between 31°C to 34°C over a span of two hours. The readings are measured using DHT-
22 temperature humidity sensor.

Figure 4.9: Humidity Reading Graph
In Figure 4.9, humidity readings from the monitoring terminal shows a steady level at
around 60% humidity with no apparent fluctuations. The readings are measured using
DHT-22 temperature humidity sensor.
Figure 4.10: CO Level Reading Graph
Figure 4.10 above, the readings of CO level that was recording from the test stays at 1
API throughout the entire test. This might be due to the minimal amount of car exhaust
emission in the area. The readings are measured using MQ-135 gas sensor.

4.4.4.2 GSM Service Message
Figure 4.11: SMS Alert Message Every 15 Minutes Via GSM
In the test conducted, the SMS alert is programmed send an update of haze level with
every 20minutes interval. The format of the message is displayed in Figure 4.11. To
determine who to send the SMS, the designated recipient phone number is programmed
into the microcontroller beforehand.
Figure 4.12: SMS Alert Message When Haze Readings Exceed Safe Level
The above Figure 4.12 is a type of SMS response when haze levels goes beyond safe
levels which had been programmed to the microcontroller. This would be like an alarm
bell where the user should be on high alert and more cautious of the surrounding air
quality.

4.4.2 PRELIMINARY TEST 2
Table 4.1: Parameters of Test 2
Date 15th April 2017
Time (hour) 1514 to 1916
Location UMP Jalan Tegak,
Pekan.
SMS INTERVAL 15 minutes
Supposedly No. of
SMS 8
No. of SMS Received 7
SMS Consistency 87.5%
A second test was conducted to record the readings from the modules to determine its
consistency and reliability. Table 4.1 shows the parameters and results of the test. In a
span of two hours, seven SMS out of eight was received in the duration. This data amount
to 87.5% consistency of the SMS feature, which had been set to send one every 15
minutes.

Figure 4.13: Graphical Data of API, CO Level, Temperature & Humidity from
Terminal for Test No.2
By looking at Figure 4.13, it is deducible that the API value dropped slightly as dusk
approached, from a range of in between 11 and 15 to 6 and 11. This imply that the amount
of dust in the air has reduced. Similarly, this trend also applies to the carbon monoxide
gas in the air. However, the level of temperature and humidity in the area remains in the
same range throughout.

4.4.3 PRELIMINARY TEST 3
Table 4.2: Parameters of Test 3
Date 20th April 2017
Time (hour) 0709 to 1113
Location UMP Jalan Tegak,
Pekan.
SMS Interval 15 minutes
Supposedly No. of
SMS 17
No. of SMS Received 17
SMS Consistency 100%
Table 4.2 shows the parameters that were involved in the third test which lasted for 4
hours. Like test 2, at fifteen minutes, a SMS is program to be sent to the users. This time,
the SMS consistency was at 100% with seventeen over seventeen SMS were received.
This occurrence isn’t very unusual as SMS could be stored in a local SMS center when
there is no network signal.

Figure 4.14: Graphical Data of API, CO Level, Temperature & Humidity from
Terminal for Test No.3
By observing the graph on Figure 4.15, it can be said that API levels within that 4 hours
experience an insignificant yet noticeable increase. Besides that, the temperature graph
shows a steady increase in temperature from 27 to 33, whereas the percentage of
humidity decreases with time from 80% to 60%. Apart from that, carbon monoxide levels
show consistent readings. From the trend of readings, this set of data matches the
behaviour of a normal scenario for a normal morning with temperature rising and
humidity dropping and human activities incite dust.

4.5 POWER CONSUMPTION
Haze Monitoring Terminal
Table 4.3: Total Current Consumption of Terminal Unit
Electronic Components Current Draw (mA)
MQ-135 Gas Sensor 0.09
A6 GSM Module 0.04
Arduino Nano 0.02
DHT-22 Temperature Humidity Sensor 0.0015
NRF24L01 Nordic Module 0.014
GP2Y1010AUF Dust Sensor 0.02
Total 0.1855
From Table 4.3, it is known that the unit is powered by 6 x AA batteries in series which
sums up to 9V. We are then able to determine the power draw from the batteries to be:
0.1855 x 9 = 1.6695 W
Haze Monitoring Center
Table 4.4: Total Current Consumption of Center Unit
Electronic Components Current Draw (mA)
Arduino Nano 0.02
2 x 16 LCD 0.02
NRF24L01 Nordic Module 0.014
Total 0.054
From Table 4.4, it is depicted that the total current consumption of the unit would be
0.054mA. Hence, by knowing that the voltage being supplied is 9V, the total power used
would be:
0.054 x 9 = 0.486 W

CHAPTER 5
CONCLUSION AND RECOMMENDATIONS
5.1 INTRODUCTION
In this chapter, the focus is to discuss about any possible limitations and to provide a
proper conclusion for this project. Apart from that, also to propose suitable
recommendations for possible future improvements of the project.
5.2 CONCLUSION
With the frequent haze phenomenon in Malaysia, this project will come in handy and
bring benefit to the masses. Besides, it could also promote awareness and keep people
vigilant of the current air quality. This is a responsibility that everyone should uphold and
not only rely on environmental officials to mitigate or resolve the issue. It is through
collective effort that we can tackle and overcome this longstanding task.
Towards the end, all objectives of this project were achieved. This project had
successfully integrated a GSM (global system for mobile communication) and a radio
frequency module into the system to assist in real-time tracking of data. In addition, the
system is also able to notify users when haze readings exceed a certain level.
It is sufficed to say that the results from this project is satisfactory, where readings are
stable and consistent. Its self-contained battery pack is an added value which makes it
portable and mobile, that can be applied in many applications.

5.3 RECOMMENDATIONS FOR FUTURE WORK
Even though this project was a success, there is always still room for improvement to be
made. By taking into consideration of limitation imposed on the modules, we can identify
and determine the aspects that we could improve on. Following this technical approach,
we would have a systematic guideline.
Speaking from a user point of view, it is indeed favourable that we are constantly being
updated on the haze readings via short message services. However, this could be further
improved by increasing the versatility of system by implementing a two-way
communication, where users can prompt the system to send the current haze reading
instead of utilizing time interval. On top of that, as good as it already is, the GSM (global
system for mobile communication) could be upgraded to GPRS (global packet radio
service) which supports mobile data and increases its accessibility. This way, the concept
of IOT (internet of things) can be applied and this project could penetrate the market of
modern society.
Furthermore, apart from the existing sensors such as DHT-22 temperature humidity
sensor, MQ-135 gas sensor and GP2Y1010AUF dust sensor, it is also suggested to add
the number of sensors to increase the types of data that is collected from our surrounding.
From there, we would have more data to analyse and have a more detailed understanding
and comprehension.

REFERENCES
This thesis is prepared based on the following references:
[1] [Online]. Available:
http://www.cwb.gov.tw/V7e/knowledge/encyclopedia/me014.htm
[2] World-Health-Organization. 7 Million Premature Deaths Annually Linked to Air
Pollution. [Online]. Available: http://www.who.int/mediacentre/news/releases/2014/air-
pollution/en/
[3] [Online]. Available http://www.fire.uni-
freiburg.de/programmes/un/wmo/wmorep.htm
[4] Vikrant Vij, 2010. “Wireless Communication.” Published by Laxmi Publications, Ltd.
[5] Gagliarducci, M., Lampasi, D. A., & Podestà, L. (2007). GSM-based monitoring and
control of photovoltaic power generation. Measurement, 40(3), 314-321.
doi:http://dx.doi.org/10.1016/j.measurement.2006.05.018
[6] Peersman, C., Cvetkovic, S., Griffiths, P., & Spear, H. (2000). The Global System for
Mobile Communications Short Message Service. IEEE Personal Communications, 7(3),
15-23. doi:10.1109/98.847919
[7] Calcante A., Tangorra F. M., Marchesi, G., & Lazzari, M. (2014). A GPS/GSM based
birth alarm system for grazing cows. Computers and Electronics in Agriculture, 100, 123-
130. doi:http://dx.doi.org/10.1016/j.compag.2013.11.006
[8] Pereira V., Sousa T., Mendes P., Monteiro E., (2004) “Evaluation of Mobile
Communication: From Voice Calls to Ubiquitous Multimedia Group Communication”,
in Proc. Of the 2nd International Working Conference on Performance Modelling and
Evaluation of Heterogeneous Networks, HET-NET’s04, IIkley, West Yorkshire, U.K.,
[9] Al-Ali, A. R., Khaliq, A., & Arshad, M. (2004, 12-15 May 2004). GSM-based
distribution transformer monitoring system. Paper presented at the Electrotechnical
Conference, 2004. MELECON 2004. Proceedings of the 12th IEEE Mediterranean.
[10] Peijiang, C., & Xuehua, J. (2008, 19-20 Dec. 2008). Design and Implementation of
Remote Monitoring System Based on GSM. Paper presented at the Computational
Intelligence and Industrial Application, 2008. PACIIA '08. Pacific-Asia Workshop on.
[11] Liu, H., Meng, Z., & Cui, S. (2007, 21-25 Sept. 2007). A Wireless Sensor Network
Prototype for Environmental Monitoring in Greenhouses. Paper presented at the 2007

International Conference on Wireless Communications, Networking and Mobile
Computing.
[12] Tseng, C.-L., Jiang, J.-A., Lee, R.-G., Lu, F.-M., Ouyang, C.-S., Chen, Y.-S., &
Chang, C.-H. (2006). Feasibility study on application of GSM–SMS technology to field
data acquisition. Computers and Electronics in Agriculture, 53(1), 45-
59.doi:10.1016/j.compag.2006.03.005
[13] Jiang, J.-A., Tseng, C.-L., Lu, F.-M., Yang, E.-C., Wu, Z.-S., Chen, C.-P., . . . Liao,
C.-S. (2008). A GSM-based remote wireless automatic monitoring system for field
information: A case study for ecological monitoring of the oriental fruit fly, Bactrocera
dorsalis (Hendel). Computers and Electronics in Agriculture, 62(2), 243-259.
doi:http://dx.doi.org/10.1016/j.compag.2008.01.005
[14] Othman, K. A., Abdullah, E. H., Li, N., & Rashid, N. E. A. (2014, 6-8 May 2014).
GSM wireless technology implementation in haze monitoring. Paper presented at the
Digital Information and Communication Technology and it's Applications (DICTAP),
2014 Fourth International Conference on.
[15] Tang, Z., Shuai, W., & jun, L. (2011). Remote Alarm Monitor System Based On
GSM and ARM. Procedia Engineering, 15, 65-69.
doi:http://dx.doi.org/10.1016/j.proeng.2011.08.014
[16] Hu, J. M., Li, J., & Li, G. H. (2012, 1-3 Nov. 2012). Automobile Anti-theft System
Based on GSM and GPS Module. Paper presented at the Intelligent Networks and
Intelligent Systems (ICINIS), 2012 Fifth International Conference on.
[17] Chien, H. C. (2014). Smoke Sensor: Google Patents
[18] Suyuti A., Tola M., Muh. Saleh Pallu, Harun N., Syafaruddin, Takashi Hiyama, 2013
“Simple And Portable Gas Emission Detector Design Using Microcontroller ATMEGA”,
ICIC Express Letters, Part B: Application ICIC International c2013 ISSN 2185-2766,
Volume 4, Number 1, February 2013 pp.13-18
[19] Nograles, H. A. H., Agbay, C. P. D., Flores, I. S. L., Manuel, A. L., & Salonga, J. B.
C. (2014, 6-8 May 2014). Low cost internet based wireless sensor network for air
pollution monitoring using Zigbee module. Paper presented at the Digital Information
and Communication Technology and it's Applications (DICTAP), 2014 Fourth
International Conference on.
[20] We are Arduino [Online]. Available https://www.arduino.cc/en/Main/AboutUs
[21] Steven F. Barrett, “Arduino Microcontroller Processing For Everyone”, Published
by Morgan & Claypool Publishers, 2nd Edition (18. Juni 2012)
[22] TGS 2602-for the detection of Air Contaminants [Online]. Available: http://fr.rs-
online.com/webdocs/065f/0900766b8065f325.pdf

[23] Hu, K., Sivaraman, V., Luxan, B. G., & Rahman, A. (2016). Design and Evaluation
of a Metropolitan Air Pollution Sensing System. IEEE Sensors Journal, 16(5), 1448-1459.
doi:10.1109/JSEN.2015.2499308
[24] Department of Environment Malaysia (2000). A Guide to Air Pollution Index (API)
in Malaysia. Retrieved from: https://aqicn.org/images/aqi-scales/malaysia-api-guide.pdf

TABLE AND FIGURE REFERENCE
1. Vikrant Vij. “Wireless Communication.” Published by Laxmi Publications, Ltd.
Pg. 89
2. Arduino Comparison Guide [Online Image]. Retrieved on November 21th 2016,
From https://learn.sparkfun.com/tutorials/arduino-comparison-guide
3. TGS 2602-for the detection of Air Contaminants Retrieved on December 1st 2016,
From http://fr.rs-online.com/webdocs/065f/0900766b8065f325.pdf
4. Compare Board Specs. Retrieved on November 21th 2016, From
https://www.arduino.cc/en/Products/Compare
5. Arduino Uno. Retrieved on November 24th 2016, From
http://www.arduino.org/products/boards/arduino-uno
6. GPRS GSM Module A6. Retrieved on November 24th 2016, From
http://picclick.ca/Quad-band-A6-GPRS-GSM-Module-Adapter-Board-Plate-
252509609051.html
7. Interfacing MQ2 to Arduino-Gas Sensor for Smoke-Butae-CH4 and LPG.
Retrieved on November 24th 2016, From
http://www.circuitstoday.com/interfacing-mq2-to-arduino
8. Arduino Community Logo. Retrieved on November 24th 2016, From
https://www.arduino.cc/en/Trademark/CommunityLogo
9. GSM GPRS A6 Module. Retrieved on November 24th 2016, From
http://www.electrodragon.com/w/GSM_GPRS_A6_Module
10. Optical Dust Sensor GP2Y1010AUF Retrieved on April 17th 2017. From
https://www.itead.cc/gp2y1010au0f-compact-optical-dust-sensor.html
11. Technical Data MQ-135 Gas Sensor. Retrieved on April 17th 2017. From
https://www.olimex.com/Products/Components/Sensors/SNS-
MQ135/resources/SNS-MQ135.pdf

APPENDICES
A PROGRAM CODE FOR HAZE MONITORING TERMINAL
#include <SPI.h>
#include <nRF24L01.h>
#include <RF24.h>
#include <SoftwareSerial.h>
SoftwareSerial mySerial(3, 4); // RX, TX
#include "DHT.h"
#define DHTPIN 7
#define DHTTYPE DHT22
DHT dht(DHTPIN, DHTTYPE);
#define CE_PIN 9
#define CSN_PIN 10
const byte slaveAddress[5] = 'R','x','A','A','A';
int dataToSend[7];
RF24 radio(CE_PIN, CSN_PIN); // Create a Radio
int measurePin = A3;
int ledPower = 8;
int samplingTime = 280;
int deltaTime = 40;
int sleepTime = 9680;
float voMeasured = 0;
float calcVoltage = 0;
float dustDensity = 0;
float density = 0;
double ppmapi = 1;
int densityapi = 0;
int ppm1 = 0;
int api;
int counter = 0;
int counter1 = 500;
int maxCount = 1500;
char phone_no[]="0133905227";
int aray[51];
int aray135[11];
int i, j;

int z = 1;
float sum, sum135;
int newapi;
int fan = 5;
int gsm = 6;
#define MQ135PIN (1)
#define RL_VALUE_MQ135 (1)
#define RO_CLEAN_AIR_FACTOR_MQ135 (3.59) ,
#define READ_SAMPLE_INTERVAL (5)
#define READ_SAMPLE_TIMES (2)
float Ro = 1.6;
void setup()
Serial.begin(9600);
mySerial.begin(115200);
dht.begin();
pinMode(ledPower,OUTPUT);
pinMode(fan, OUTPUT);
digitalWrite(fan, HIGH);
digitalWrite(gsm, HIGH);
radio.begin();
radio.setDataRate( RF24_250KBPS );
radio.setRetries(3,5); // delay, count
radio.openWritingPipe(slaveAddress);
delay(2000);
digitalWrite(gsm,LOW);
void loop()
particlesensor();
mq135sensor();
float h = dht.readHumidity();
float t = dht.readTemperature();
density = dustDensity*1000;
APIcal();
dataToSend[0] = t;
dataToSend[1] = h;
dataToSend[2] = density;
dataToSend[3] = ppm1;
dataToSend[4] = newapi;

dataToSend[5] = counter;
dataToSend[6] = 69;
send();
counter++;
counter1++;
Serial.print("Temperature = ");
Serial.print(t);
Serial.print(" Humidity = ");
Serial.print(h);
Serial.print(" Dust Density: ");
Serial.print(density);
Serial.print(" CO ppm = ");
Serial.println(ppm1);
Serial.print("Air API = ");
Serial.println(newapi);
Serial.print(i);
Serial.print(" ");
Serial.print(ppmapi);
Serial.print(" ");
Serial.print(densityapi);
Serial.print(" ");
Serial.println(MQGetGasPercentage(MQRead(MQ135PIN)/Ro) );
Serial.print(" ");
Serial.println(counter );
delay(400);
sum = 0;
i++;
aray[i] = api;
if(i == 50)
for(i = 1; i < 51; i++)
sum += aray[i];
sum = sum/50;
newapi = sum;
i=0;
if ( (newapi >100) && (newapi <150) && (counter1 > 500))
mySerial.print("AT+CMGF=1\r"); //Because we want to send the SMS in text
mode

delay(2000);
mySerial.print("AT+CMGS=\"");
mySerial.print(phone_no);
mySerial.write(0x22);
mySerial.write(0x0D); // hex equivalent of Carraige return
mySerial.write(0x0A); // hex equivalent of newline
delay(2000);
mySerial.print("Alert, air pollution index value has risen to ");
mySerial.print(newapi);
mySerial.print("! Children and adult with respiratory disease, limit prolonged outdoor
exertion by Haze Monitor Prototype ~");
mySerial.print(z);
delay(100);
mySerial.println((char)26);
delay(2000);
counter1 = 0;
if ( (newapi>150) && (counter1 > 500))
mySerial.print("AT+CMGF=1\r"); //Because we want to send the SMS in text
mode
delay(2000);
mySerial.print("AT+CMGS=\"");
mySerial.print(phone_no);
mySerial.write(0x22);
mySerial.write(0x0D); // hex equivalent of Carraige return
mySerial.write(0x0A); // hex equivalent of newline
delay(2000);
mySerial.print("Warning, air pollution index value has risen to ");
mySerial.print(newapi);
mySerial.print("! Everyone should limit prolonged outdoor exertion by Haze Monitor
Prototype ~");
mySerial.print(z);
delay(100);
mySerial.println((char)26);
delay(2000);
counter1 = 0;
if (counter > maxCount)
mySerial.print("AT+CMGF=1\r"); //Because we want to send the SMS in text
mode

delay(2000);
mySerial.print("AT+CMGS=\"");
mySerial.print(phone_no);
mySerial.write(0x22);
mySerial.write(0x0D); // hex equivalent of Carraige return
mySerial.write(0x0A); // hex equivalent of newline
delay(2000);
mySerial.print("Timely update of current API level: ");
mySerial.print(newapi);
mySerial.print(". Current outdoor temperature is ");
mySerial.print(t);
mySerial.print(" Celsius. Air Humidity: ");
mySerial.print(h);
mySerial.print("% by Haze Monitor Prototype ~");
mySerial.print(z);
delay(100);
mySerial.println((char)26);
delay(2000);
counter = 0;
z++;
void particlesensor()
digitalWrite(ledPower,LOW);
delayMicroseconds(samplingTime);
voMeasured = analogRead(measurePin);
delayMicroseconds(deltaTime);
digitalWrite(ledPower,HIGH);
delayMicroseconds(sleepTime);
calcVoltage = voMeasured * (5.0 / 1024.0);
dustDensity = 0.17 * calcVoltage - 0.1;
if ( dustDensity < 0)
dustDensity = 0.00;
void mq135sensor()
sum135 = 0;
j++;

aray135[j] =MQGetGasPercentage(MQRead(MQ135PIN)/Ro);;
if(j == 10)
for(j = 1; j < 11; j++)
sum135 += aray135[j];
sum135 = sum135/10;
ppm1 = sum135 ;
j=0;
float MQResistanceCalculation(int raw_adc)
return ( ((float)RL_VALUE_MQ135*(1023-raw_adc)/raw_adc));
float MQRead(int mq_pin)
int i;
float rs=0;
for (i=0;i<READ_SAMPLE_TIMES;i++)
rs += MQResistanceCalculation(analogRead(mq_pin));
delay(READ_SAMPLE_INTERVAL);
rs = rs/READ_SAMPLE_TIMES;
return rs;
int MQGetGasPercentage(float rs_ro_ratio)
return (pow(10,(1.457*pow((log10(rs_ro_ratio)), 2) - 4.725*(log10(rs_ro_ratio)) +
2.855)));
void send()
bool rslt;
rslt = radio.write( &dataToSend, sizeof(dataToSend) );
void APIcal()
if ( (density >= 0) && (density < 50))
densityapi = density;

else if ( (density >= 50) && (density < 350))
densityapi = ((density -50)/2) + 50;
else if ( (density >= 350) && (density < 420))
densityapi = (density -350)*3.5/5 + 200;
else if ( (density >= 420) && (density < 500))
densityapi = (density - 420)*5/4 + 300;
else if ( (density >= 500) && (density < 600))
densityapi = (density -500) + 400;
if ( 0 <= ppm1 < 9)
ppmapi = (100/9)*ppm1;
else if ( 9<= ppm1 < 15)
ppmapi = (ppm1-9)/0.3*5 + 9;
else if ( 15 <= ppm1 < 30)
ppmapi = (ppm1 -15)/0.75*5 + 15;
else if ( 30 <= ppm1 < 50)
ppmapi = (ppm1- 30)*10 + 30;
api = densityapi;
//if (ppmapi < densityapi)
// api = densityapi;
//
//else if (ppmapi > densityapi)
// api = ppmapi;
//

B PROGRAM CODE FOR HAZE MONITORING CENTER
#include <SPI.h>
#include <nRF24L01.h>
#include <RF24.h>
#include <LiquidCrystal.h>
#define CE_PIN 9
#define CSN_PIN 10
const byte thisSlaveAddress[5] = 'R','x','A','A','A';
RF24 radio(CE_PIN, CSN_PIN);
int dataReceived[7]; // this must match dataToSend in the TX
bool newData = false;
LiquidCrystal lcd(7, 6, 2, 3, 4, 5);
int screen = 1;
int upstate = 0;
int downstate = 0;
int lcdstate = 0;
int timer;
void setup()
lcd.begin(16, 2); // start the library
lcd.setCursor(0,0);
lcd.print("Haze Monitoring");
lcd.setCursor(0,1);
lcd.print("Terminal by Yang");
Serial.begin(9600);
radio.begin();
radio.setDataRate( RF24_250KBPS );
radio.openReadingPipe(0, thisSlaveAddress);
radio.startListening();
pinMode(A1 , INPUT);
pinMode(A2, INPUT);
delay(2000);
lcd.setCursor(0,0);
lcd.print("Initiation ");
lcd.setCursor(0,1);
lcd.print("Wait ~ ");
for ( int i = 0; i<10; i++)
timer = 10 -i;
if (timer == 9)
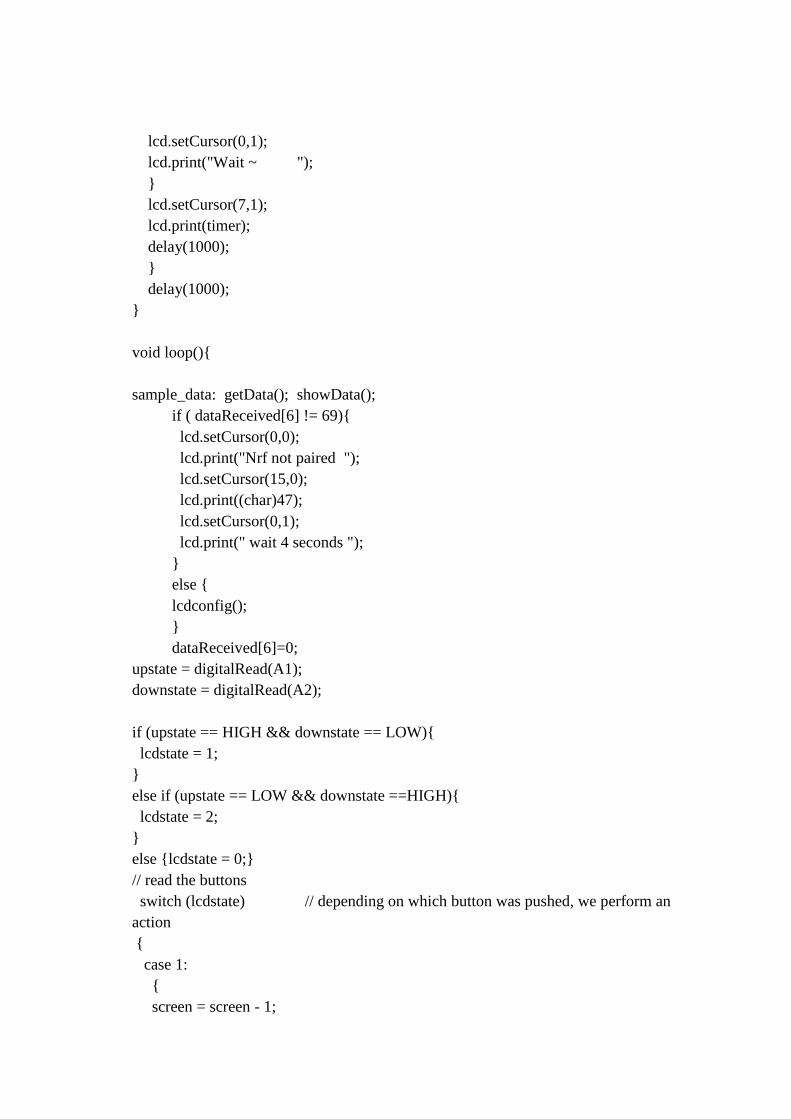
lcd.setCursor(0,1);
lcd.print("Wait ~ ");
lcd.setCursor(7,1);
lcd.print(timer);
delay(1000);
delay(1000);
void loop()
sample_data: getData(); showData();
if ( dataReceived[6] != 69)
lcd.setCursor(0,0);
lcd.print("Nrf not paired ");
lcd.setCursor(15,0);
lcd.print((char)47);
lcd.setCursor(0,1);
lcd.print(" wait 4 seconds ");
else
lcdconfig();
dataReceived[6]=0;
upstate = digitalRead(A1);
downstate = digitalRead(A2);
if (upstate == HIGH && downstate == LOW)
lcdstate = 1;
else if (upstate == LOW && downstate ==HIGH)
lcdstate = 2;
else lcdstate = 0;
// read the buttons
switch (lcdstate) // depending on which button was pushed, we perform an
action
case 1:
screen = screen - 1;

delay(300);
break;
case 2:
screen = screen + 1;
delay(300);
break;
delay(650);
void getData()
if ( radio.available() )
radio.read( &dataReceived, sizeof(dataReceived) );
newData = true;
void showData()
if (newData == true)
Serial.print(",");
Serial.print(dataReceived[0]); //Humidity =
Serial.print(",,");
Serial.print(dataReceived[1]); //DDensity =
Serial.print(",,,");
Serial.print(dataReceived[2]); //CO ppm
Serial.print(",,,,");
Serial.print(dataReceived[3]); //Air API =
Serial.print(",,,,,");
Serial.print(dataReceived[4]); //Counter =
Serial.print(",,,,,,");
Serial.print(dataReceived[5]);
Serial.println(",,,,,,,");
newData = false;
void lcdconfig()
if (screen >4)
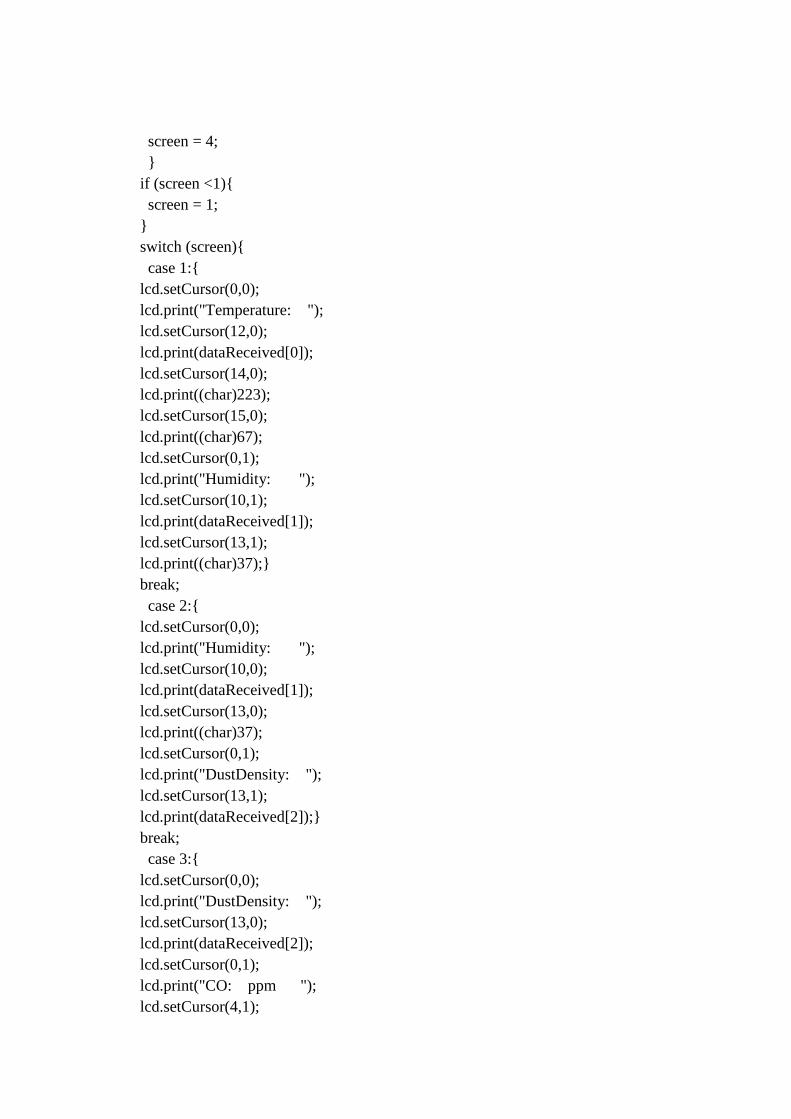
screen = 4;
if (screen <1)
screen = 1;
switch (screen)
case 1:
lcd.setCursor(0,0);
lcd.print("Temperature: ");
lcd.setCursor(12,0);
lcd.print(dataReceived[0]);
lcd.setCursor(14,0);
lcd.print((char)223);
lcd.setCursor(15,0);
lcd.print((char)67);
lcd.setCursor(0,1);
lcd.print("Humidity: ");
lcd.setCursor(10,1);
lcd.print(dataReceived[1]);
lcd.setCursor(13,1);
lcd.print((char)37);
break;
case 2:
lcd.setCursor(0,0);
lcd.print("Humidity: ");
lcd.setCursor(10,0);
lcd.print(dataReceived[1]);
lcd.setCursor(13,0);
lcd.print((char)37);
lcd.setCursor(0,1);
lcd.print("DustDensity: ");
lcd.setCursor(13,1);
lcd.print(dataReceived[2]);
break;
case 3:
lcd.setCursor(0,0);
lcd.print("DustDensity: ");
lcd.setCursor(13,0);
lcd.print(dataReceived[2]);
lcd.setCursor(0,1);
lcd.print("CO: ppm ");
lcd.setCursor(4,1);

lcd.print(dataReceived[3]);
break;
case 4:
lcd.setCursor(0,0);
lcd.print("CO: ppm ");
lcd.setCursor(4,0);
lcd.print(dataReceived[3]);
lcd.setCursor(0,1);
lcd.print("API: ");
lcd.setCursor(6,1);
lcd.print(dataReceived[4]);
break;

WIRELESS GSM HAZE MONITORING
SYSTEM
Szeto Yang Yang
Faculty of Manufacturing Engineering
Universiti Malaysia Pahang
26600 Pekan, Pahang, Malaysia
Dr. Arshed Abdulhameed Oudah
Faculty of Manufacturing Engineering
Universiti Malaysia Pahang
26600 Pekan, Pahang, Malaysia
Abstract— Haze is a condition in the atmosphere
that hinders visibility in an affected area. Malaysia is
a recurring country which haze exists and poses a
threat to public health. For a country, which is
frequented by the occurrence of haze, air quality
readings are not easily accessible by the public.
Hence, portable units equipped with sensors and
communicative devices could be an alternative to
acquire the data. With sensory units that can measure
temperature, humidity, carbon monoxide level and
dust density along with a global system for mobile
communication module and Radio Frequency (RF)
module, users will be able to receive readings via
Global System for Mobile Communications (GSM)
for Short Message Service (SMS) or view them from
a monitor. This unit comes in a set of two, a
monitoring terminal and a monitoring center. All
sensor readings will be acquired from the monitoring
terminal and be sent to portable monitoring center
for a visual display.
Keywords—Haze;Portable;RF;GSM;SMS;
I. INTRODUCTION
From meteorological standpoint, it is an atmospheric phenomenon where a conglomeration of small dry suspended particles in the atmosphere named lithometeor. In layman term, haze is a condition in the atmosphere that hinders visibility in an affected area. Haze typically comprises of dust and smoke particles that causes the scattering of light when sunlight is present. They are usually white in colour in the atmosphere and appear to be yellowish or orange-reddish when against a bright background [1]. Therefore, when haze is unmistakably present in the atmosphere, our horizontal visibility is damped substantially.
Relating to everything that exist in nature, when is in excessive amount, it could conjure a threat to topple the equilibrium of a system. Likewise, as haze looms over our clear sky disproportionately, it accumulates and when air flow is stagnant or restricted, the high density of haze could very well affect our health, respiratory difficulties and impairs visibility. The effects of haze are detrimental and
unfavourable for any outdoor activities. To quantify the severity of haze, various government agencies use an easy to comprehend air quality index which measure the concentration of air pollutant in the air. The air quality index is translated from the data acquired via an air monitoring unit installed at a given location along with a particle sensor. Air quality standards are typically classified into different ranges. Each of the range is assigned with a descriptor, colour code and public health advisory.
According a report released by World Health Organisation (WHO) in year 2014, low and middle-income countries around Western Pacific Region and South East Asia were facing countless outdoor air pollution related issue with 2.6 million death cases [2]. For if we could remember, the occurrence of haze had become an annual affair for the local communities of South East Asia. The communities in this region are always on high alert for any signs or reports or haze. Ever since the mid of 20th century, records of transboundary haze occurring regularly have become a common event. The most observable root cause of these haze is pertaining to large scale illegal open burning. They are associated with many irresponsible farmers or land owners who operate only with their best interest in mind, neglecting social responsibility via illegal land clearing by opening burning. They are associated with many irresponsible farmers or land owners who operate only with their best interest in mind, neglecting social responsibility via illegal land clearing by opening burning. As some claims that practices such as slash-and-burn are especially rampant in Indonesia. Cases like these caught public attention and on June 1998, the World Meteorological Organization (WMO) conducted a regional workshop relating to transboundary smoke and haze in Southeast Asia as part of its effort to curb widespread air pollution and environment problems around the vicinity [3]. The workshop is to highlight and manage haze episodes which disrupted the tourist industry, public health, agricultural production, civil aviation operations and maritime shipping.
C. CONFERENCE PAPER

Conventionally, on-site haze monitoring station usually required someone to gather and record haze levels in an area. Most of the times, it consumes time, money and manpower to operate the station. Upon erecting the station, either an electric cable would be connected to the station for power and data acquisition or in-charged personnel is needed to check and consolidate the data from time to time. As simple as it may sound, it would be a hassle if the station located on a mountain side or deep in the forest. Thus, having to implement a wireless system with a monitoring terminal and monitoring center would greatly improve efficiency, where the data could be remotely monitored and analyse in real time.
This paper presents an integrated haze monitoring system which utilize GSM wireless technology and RF wireless technology to allow real-time tracking and monitoring of haze level in its vicinity. Where the user will be notified via SMS at an interval rate or when haze level exceeds safety limit.
II. LITERATURE REVIEW A. WIRELESS GSM (GLOBAL SYSTEM
FOR WIRELESS COMMUNICATION)
GSM network has the advantages of wide covering area, long communication distance mature technology, and sound communication effect and et-cetera [4]. As stated by SMS point-point (SMSPP) standard defined by ETSI (European Telecommunication Standards Institute), this function relies on the nature and of the SMS origin and destination. Whenever a message is send by a mobile station and is terminated, in the absence low connectivity or no connection, a local SMS Center will store it and tries to send it repeatedly for three days as soon as a mobile station is available. Frequency bands in which the GSM network could be operated in Malaysia and most of the world are 900MHz or 1800 MHz [5].
Typically, a GSM module are controlled using industry standard AT command, which is an abbreviation for Attention. Every command line begins with “at” or “AT”, it is a prefix to inform the module the starting line of command. However, they’re also used to control wired dial-up modem. Each of the modem interfaces to the host through a USART (universal synchronous/asynchronous serial receiver-transmitter), that is automatically detected by the operating system. As a clarification, when the term mobile station is mentioned, it refers to the modem. Furthermore, AT commands consist of three parts, starting with AT, then by a command and ended with a line termination character <cr>.
A feasibility study was conducted on application of GSM-SMS technology to field data
acquisition [6]. It is based on field data collection prototype system that composed of field monitoring and host control platforms. Using GSM-SMS based communication architecture to developed a short message format that is used to monitor farming area and record field data, such as humidity, wind speed, number of pest captured and temperature. There are four advantages to mobile communication technology, they are low power requirement, covers a wide range of area, user data can be stored in GSM service centre temporarily and having group broadcast function. Besides that, SMS used in filed data acquisition do not need long cables, contains encryption to protect SMS data and during transmission failure, retransmission can be configured again. Coding and decoding of data between field monitoring and host control platforms can be achieved by predefining data format of SMS. Generally, 160 bytes is the maximum length of a SMS message. As a means to verify the correctness and feasibility of SMS data transmitting across the field, a simple trap device for moth was integrated in the field monitoring platform with a 8051 chip as a counter. Host control platform prototype was create using Visual Basic 6.0 on a PC for the graphical user interface program. The data transmission had a test record of 100% data accuracy rating from performance rating test.
B. SMOKE SENSOR
Smoke sensors are devices that can detect various types of particle in the air, commonly found in smoke detector which in the presence of anomaly would give off an alarm. There are two types of conventional smoke sensor that are typically found, one of which uses an optical smoke sensing unit, where a side of its internal wall will emit light and be received by another side of its wall. Contrary to that, there is also the ionization smoke sensing unit, this concept is similar to an inductor which is able to measure smoke particle smaller than an optical sensor, having cavity in its interior that allows particle to flow through which directly affect the current [7]
In a simple research done by Ansar Suyuti and her partners on portable gas emission design using microcontroller [8]. Air pollutant that normally exist in the air are O_2, SO_2, CO, NO_x, SO_4 gaseous and dust particle with heavy metals. Thus smoke sensor with high sensitivity should be implemented to in detecting air pollution or haze. Also mentioned are the types of sensors used in the study, among them are KE25 to detect oxygen, MQ136 for SO_2, MQ7 for CO, TGS2201 for NO_x and MQ2 for opacity of smoke in the air.
Furthermore, research by Abdul Hadi Nograles H. on low cost internet based wireless sensor network for air pollution monitoring using zigbee module, mentioned that MQ2 smoke sensor is able to detect 7 different types of gas compounds and at

the same time commercially available [9].This sensor’s sensitivity mainly depends on the ratio of sensor resistance (Rs) during expose to smoke and the initial sensor resistance reading, Rs/Ro then being converted to Parts Per Million (PPM) figure using designated equations.
C. ARDUINO
Arduino uses a simple programming language derived from C/C++ language in Arduino Software (IDE), to top that up, it a cross platform software where it could run on Windows, Mac OS X and Linux. Arduino products are built to accommodate an open source hardware and software, which translate to openly sharing its development to stimulate fresh ideas among users and further advance its concept [10]. Arduino products are program using Arduino Development Environment where interfacing and burning a code into an Arduino is done. One of the product called Arduino Uno is built upon ATmega328 chipset, connecting to a computer via USB port. Another product would the Arduino Mega, slightly bulkier than Uno with added ports is based on Atmega1280 chipset. Sketches are what we use write our program in an Arduino Software which would be later saved in the form of a file extension .ino. Table 2.1 below is a comparison of specifications between Arduino Uno and Mega:
III. METHODOLOGY
From Figure 1 and Figure 2 below, it shows the
completed hardware of the project. With Figure 1
showing the portable out on the field monitoring
terminal unit where data will be collected from and
in Figure 2, the monitoring center unit where data
will be received for display and logging purpose.
Figure1: Monitoring Terminal
Figure 2: Monitoring Center
A. BLOCK DIAGRAM OF THE
MODULES
Gas/Smoke
Sensor
Signal
Conditioning
Ciruit
Arduino Nano
(Microcontroller)
A6 GPRS
GSM Module
Battery Pack
(Power
Source)
Wireless
Transceiver
(NRF24L01)
Optical Dust
Sensor
Figure 3: Block Diagram of Haze Monitoring Terminal
Figure 3 depicts the block diagram of the haze monitoring terminal. The hardware that are integrated into this comprises of data collections, data processing and data transmission. Both gas sensor and optical dust sensor are used for data collection and data processing, while the GSM module and RF transceiver is used for data transmission.

ARDUINO Nano (Monitoring
Centre)
LCD
DISPLAY
Battery Pack
(Power
Source)
Computer
Wireless
Transceiver
(NRF24L01)
Figure 4: Block Diagram of Haze Monitoring Center
In Figure 4, the block diagram shown is for haze monitoring center. This unit is involving in data reception, data visualization and data logging. A computer would be required to plot the data into graphical form and data logging.
B. SOFTWARE
The software that was used to preload or program
the Arduino is open-source Arduino 1.8.2 software.
It has its standalone cross platform user interface
which contain a text editor for writing code and a
series of menu.
Besides that, Visual Studio 2015 was used to make
a graphical user interface implementing C# to
present, record, tabulate and save data from the
haze monitoring terminals. This serve as a handy
add-on to the project for better data presentation
and analysis.
IV. RESULTS AND DISCUSSION
The range of value in Table 1 will act as a reference as to determine the quality of the air in terms of Air Pollution Index (API). Each category has different level of classification of health indicator and warning as seen in the table.
API Air Pollution Level
0 - 50 Good
51 - 100 Moderate
101 - 200 Unhealthy
201 - 300 Very Unhealthy
301 and above Hazardous
Table 1: Classification of Air Quality
Following Table 2, the location for data collection is UMP Jalan Tegak, Pekan. Around the vicinity of this area are mostly covered with trees and bushes where vehicle movements are few and
seldom. Observation was done for 4 hours continuously from 0709 hour to 1113 hour with SMS was prompt to send every 15 minutes’ interval. Data collected by the system is converted into Air Pollution Index (API) covertly from parts per million (PPM)
Date 20th April 2017
Time (hour) 0709 to 1113
Location UMP Jalan Tegak, Pekan.
SMS Interval 15 minutes
Supposedly
No. of SMS 17
No. of SMS
Received 17
SMS
Consistency 100%
Table 2: Parameters of The Experiment
Figure 5: Graph Of Sample Air Pollution Index Collected
Figure 6: Graph Of Sample Carbon Monoxide Level

Figure 7: Graph of Sample Temperature Collected
Figure 8: Graph of Sample Humidity Percentage Collected
By observing the graph on Figure 5, it can be said that API levels within that 4 hours experience an insignificant yet noticeable increase. The range of the value falls between 7 to 17, which in this case, air quality is good according to Table 1.
Besides that, in Figure 7 and Figure 8, the temperature graph shows a steady increase in temperature from 27 to 33, whereas the percentage of humidity decreases with time from 80% to 60%. Apart from that in Figure 6, carbon monoxide levels show consistent readings. From the trend of readings, this set of data matches the behavior of a normal scenario for a normal morning with temperature rising and humidity dropping and human activities incite dust. On top of that, Pekan District is a place with abundance greenery with minin hassling and bustling compare to a city.
Figure 9: SMS Update on Every Interval
The Figure 9 above portray the SMS received from GSM module in terminal unit functioning well as intended. Update message are sent at an interval rate of 15minutes along with content of message displaying API level, temperature and air humidity level. This way, it is very convenient to the user to acquire readings with minimal effort.
V. CONCLUSION
This project had successfully integrated a GSM
(global system for mobile communication) and a
radio frequency module into the system to assist in
real-time tracking of data. In addition, the system
is also able to notify users when haze readings
exceed a certain level. It is sufficed to say that the results from this
project is satisfactory, where readings are stable and consistent. Its self-contained battery pack is an added value which makes it portable and mobile, that can be applied in many applications.
ACKNOWLEDGEMENT
The authors would like to express gratitude and acknowledge the Faculty of Manufacturing Engineering, Universiti Malaysia Pahang for continuous support.

REFERENCES
(1) Central Weather Bureau – Weather Phenomenon,
Haze. Internet: http://www.cwb.gov.tw/V7e/knowledge/encyclope
dia/me014.htm
(2) World-Health-Organization. 7 Million Premature Deaths Annually Linked to Air Pollution. Internet::
http://www.who.int/mediacentre/news/releases/201
4/air-pollution/en/I.S. (3) WMO Workshop on Regional Transboundary
Smoke and Haze in Southeast Asia. Internet:
www.fire.uni-freiburg.de/programmes/un/wmo/wmorep.htm
(4) Calcante A., Tangorra F. M., Marchesi, G., &
Lazzari, M. (2014). A GPS/GSM based birth alarm system for grazing cows. Computers and Electronics
in Agriculture, 100, 123-130.
doi:http://dx.doi.org/10.1016/j.compag.2013.11.006 (5) Pereira V., Sousa T., Mendes P., Monteiro E., (2004)
“Evaluation of Mobile Communication: From Voice
Calls to Ubiquitous Multimedia Group Communication”, in Proc. Of the 2nd International
Working Conference on Performance Modelling and
Evaluation of Heterogeneous Networks, HET-NET’s04, IIkley, West Yorkshire, U.K.,
(6) Tseng, C.-L., Jiang, J.-A., Lee, R.-G., Lu, F.-M.,
Ouyang, C.-S., Chen, Y.-S., & Chang, C.-H. (2006).
Feasibility study on application of GSM–SMS technology to field data acquisition. Computers and
Electronics in Agriculture, 53(1), 45-
59.doi:10.1016/j.compag.2006.03.005 (7) Chien, H. C. (2014). Smoke Sensor: Google Patents
(8) Suyuti A., Tola M., Muh. Saleh Pallu, Harun N.,
Syafaruddin, Takashi Hiyama, 2013 “Simple And Portable Gas Emission Detector Design Using
Microcontroller ATMEGA”, ICIC Express Letters,
Part B: Application ICIC International c2013 ISSN 2185-2766, Volume 4, Number 1, February 2013
pp.13-18
(9) Nograles, H. A. H., Agbay, C. P. D., Flores, I. S. L.,
Manuel, A. L., & Salonga, J. B. C. (2014, 6-8 May
2014). Low cost internet based wireless sensor network for air pollution monitoring using Zigbee
module. Paper presented at the Digital Information
and Communication Technology and it's Applications (DICTAP), 2014 Fourth International
Conference on.
(10) Steven F. Barrett, “Arduino Microcontroller Processing For Everyone”, Published by Morgan &
Claypool Publishers, 2nd Edition (18. Juni 2012)

D. AINEX 2017 COMPETITION CERTIFICATE

Electrical Ciruit Diagram for Haze Monitoring Center
E. ELECTRICAL CIRCUIT DIAGRAM

Electrical Circuit Diagram for Haze Monitoring Terminal


