Table 36 Trends in Covered Days of Care, Covered Charges, and Program Payments for Skilled Nursing Facility Services Used by Medicare Beneficiaries, by Type of Entitlement: Selected Calendar Years 1967-1999 Covered Days of Care Covered Charges Total Medicare Program Payments Type of Number Per Amount Program Amount Percent Percent of Entitlement in 1,000 HI in Per Payments in of Covered Total Medicare Per HI Per and Year Thousands Enrollees Millions Day in Millions Millions Charges Program Payments Enrollee Day All Beneficiaries 1967 19,997 1,026 --- --- $4,239 $313 --- 7.4 $16 $16 1971 6,481 361 --- --- 7,354 195 --- 2.7 9 30 1975 8,874 360 $420 $47 14,549 261 62.1 1.8 11 29 1983 9,032 305 897 99 53,438 456 50.9 0.9 15 51 1984 8,864 296 975 110 59,132 465 47.7 0.8 16 52 1986 7,770 249 1,123 144 68,583 501 44.6 0.7 16 65 1987 7,041 221 1,188 169 75,817 544 45.8 0.7 17 77 1988 11,802 364 1,982 168 80,595 964 48.7 1.2 30 82 1989 28,571 865 4,537 159 86,038 2,837 62.5 3.3 86 99 1990 21,242 630 4,263 201 101,419 1,827 42.9 1.8 54 86 1991 22,210 645 5,308 239 110,887 2,277 42.9 2.2 66 103 1992 25,271 719 6,904 273 132,951 3,128 45.3 2.4 89 124 1993 30,985 863 9,711 313 136,718 4,385 45.2 3.2 122 142 1994 1 36,091 1,072 12,864 356 147,106 5,904 45.9 4.0 175 164 1995 1 40,182 1,194 16,099 401 158,980 7,495 46.6 4.7 223 187 1996 1 45,883 1,378 20,134 439 167,063 9,095 47.5 5.4 273 208 1997 1 48,239 1,479 23,274 482 175,423 11,199 48.1 6.4 343 232 1998 1 45,422 1,421 22,516 496 168,164 11,224 49.9 6.7 351 247 1999 1 43,397 1,366 18,226 420 166,687 9,617 52.8 5.8 303 222 Aged Beneficiaries 1967 19,997 1,026 --- --- $4,239 $313 --- 7.4 $16 $16 1971 6,481 361 --- --- 7,354 195 --- 2.7 9 30 1975 8,585 382 $406 $47 13,056 252 62.0 1.9 11 29 1983 8,738 328 865 99 46,727 441 51.0 0.9 17 50 1984 8,578 361 940 110 52,118 449 47.8 0.9 17 52 1986 7,493 265 1,075 144 60,459 482 44.9 0.7 17 64 1987 6,875 235 1,136 167 67,893 524 46.1 0.8 18 77 1988 11,360 388 1,893 167 71,780 926 48.9 1.3 32 81 1989 27,216 911 4,300 158 76,356 2,698 62.7 3.5 90 99 1990 20,398 669 4,067 199 89,620 1,752 43.1 2.0 57 86 See footnotes at end of table.
Transcript
Table 36
Trends in Covered Days of Care, Covered Charges, and Program Payments for Skilled Nursing Facility Services Usedby Medicare Beneficiaries, by Type of Entitlement: Selected Calendar Years 1967-1999
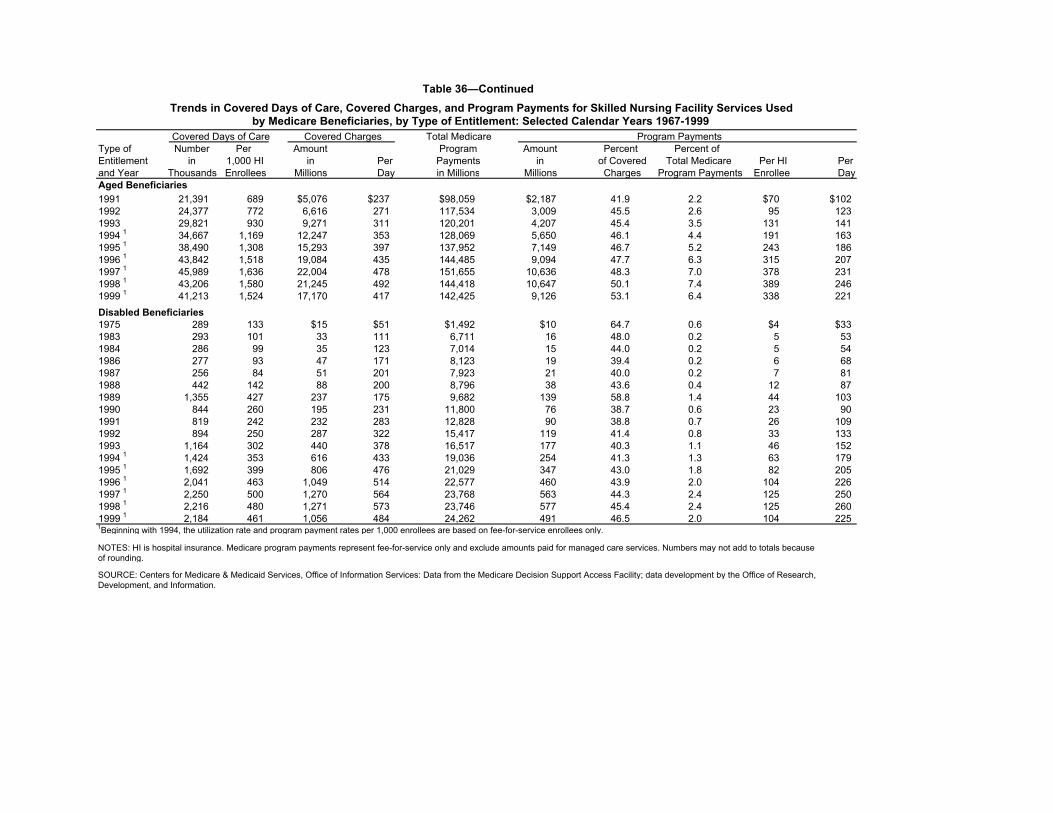
Table 36—ContinuedTrends in Covered Days of Care, Covered Charges, and Program Payments for Skilled Nursing Facility Services Used
by Medicare Beneficiaries, by Type of Entitlement: Selected Calendar Years 1967-1999Covered Days of Care Covered Charges Total Medicare Program Payments
NOTES: HI is hospital insurance. Medicare program payments represent fee-for-service only and exclude amounts paid for managed care services. Numbers may not add to totals becauseof rounding.
SOURCE: Centers for Medicare & Medicaid Services, Office of Information Services: Data from the Medicare Decision Support Access Facility; data development by the Office of Research,Development, and Information.
Table 37
Covered Admissions, Covered Days of Care, Covered Charges, and Program Payments for SkilledNursing Facility Services Used by Medicare Beneficiaries, by Demographic Characteristics, Type
of Entitlement, and Discharge Status: Calendar Year 1999Demographic Covered Admissions 1 Covered Days of Care Characteristic, Per Total Per Type of Entitlement, 1,000 HI in 1,000 HI Perand Discharge Status Number Enrollees 2 Thousands Enrollees2 AdmissionTotal 1,902,496 60 43,397 1,366 23
AgeUnder 65 Years 93,193 20 2,099 443 2365-69 Years 132,943 19 2,731 385 2170-74 Years 218,222 32 4,518 665 2175-79 Years 348,402 61 7,574 1,318 2280-84 Years 415,179 108 9,492 2,466 2385 Years or Over 694,557 195 16,983 4,772 25
Type of EntitlementAged5 1,805,444 67 41,213 1,524 23Disabled6 97,052 20 2,184 461 23
Discharge StatusAlive 1,770,614 NA 41,157 NA 23Dead 131,882 NA 2,240 NA 171Includes skilled nursing care admissions with at least 1 day of covered care under Medicare. 2Beginning with 1994, the utilization rate and program payment rates per 1,000 enrollees are based on fee-for-service enrollees only.3The denominator used to calculate the average program payment per covered admission includes only those bills with Medicarereimbursement greater than zero.4Excludes unknown race.5Includes aged persons with end stage renal disease (ESRD).6Includes disabled persons with ESRD and persons entitled to Medicare because of ESRD only.
NOTES: HI is hospital insurance. Medicare program payments represent fee-for-service only and exclude amounts paid for managedcare services. Numbers may not add to totals because of rounding. NA is not applicable.
SOURCE: Centers for Medicare & Medicaid Services, Office of Information Services: Data from the Medicare Decision Support AccessFacility; data development by the Office of Research, Development, and Information.
Table 37—Continued
Covered Admissions, Covered Days of Care, Covered Charges, and Program Payments for SkilledNursing Facility Services Used by Medicare Beneficiaries, by Demographic Characteristics, Type
of Entitlement, and Discharge Status: Calendar Year 1999 Covered Charges Program Payments
Amount Amount Percent ofin Per Per in Covered Per Per
East South Central 129,077 55 3,171 1,340 24.6 1,213,582 9,402 383 595,617 4,620 188 Alabama 28,099 45 816 1,320 29.0 282,436 10,051 346 150,872 5,383 185 Kentucky 35,363 62 797 1,393 22.5 300,981 8,511 378 147,498 4,174 185 Mississippi 20,096 49 452 1,106 22.5 195,069 9,707 432 79,531 3,959 176 Tennessee 45,519 59 1,106 1,439 24.3 435,095 9,559 393 217,716 4,788 197 See footnotes at end of table.
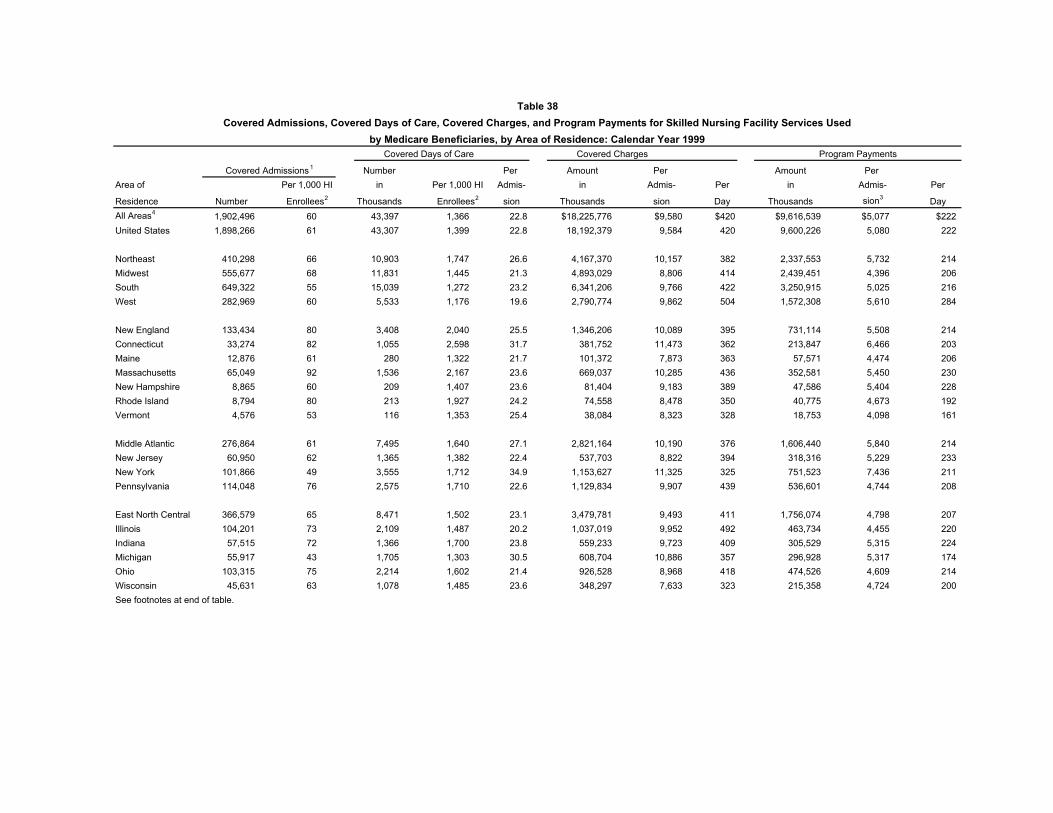
Table 38—Continued
Covered Admissions, Covered Days of Care, Covered Charges, and Program Payments for Skilled Nursing Facility Services Usedby Medicare Beneficiaries, by Area of Residence: Calendar Year 1999
Enrollees2 Enrollees2
Program Payments
Covered Admissions1
Per 1,000 HI Per 1,000 HI
Covered Days of Care Covered Charges
Number Per Amount Per Amount Per Area of in Admis- in Admis- Per in Admis- Per
Outlying Areas5 4,230 5 90 109 21.3 33,398 7,895 370 16,312 3,859 181 1Reflects skilled nursing admissions with at least 1 day of covered care under Medicare.2Beginning with 1994, the utilization rate and program payment rates per 1,000 enrollees are based on fee-for-service enrollees only. 3The denominator used to calculate the average program payment per covered admission includes only those bills with Medicare reimbursement greater than zero.4Includes 50 States, District of Columbia, and outlying areas.5Includes Puerto Rico, Guam, Virgin Islands, residence unknown, and outlying areas not shown separately.
NOTES: HI is hospital insurance. Medicare program payments represent fee-for-service only and exclude amounts paid for managed care services. Numbers may not add to totals becauseof rounding.
SOURCE: Centers for Medicare & Medicaid Services, Office of Information Services: Data from the Medicare Decision Support Access Facility; data development by the Office of Research,Development, and Information.
by Medicare Beneficiaries, by Area of Residence: Calendar Year 1999
Table 38—Continued
Covered Admissions, Covered Days of Care, Covered Charges, and Program Payments for Skilled Nursing Facility Services Used
Program Payments
Per 1,000 HI Per 1,000 HI
Enrollees2 Enrollees2
Covered Admissions1
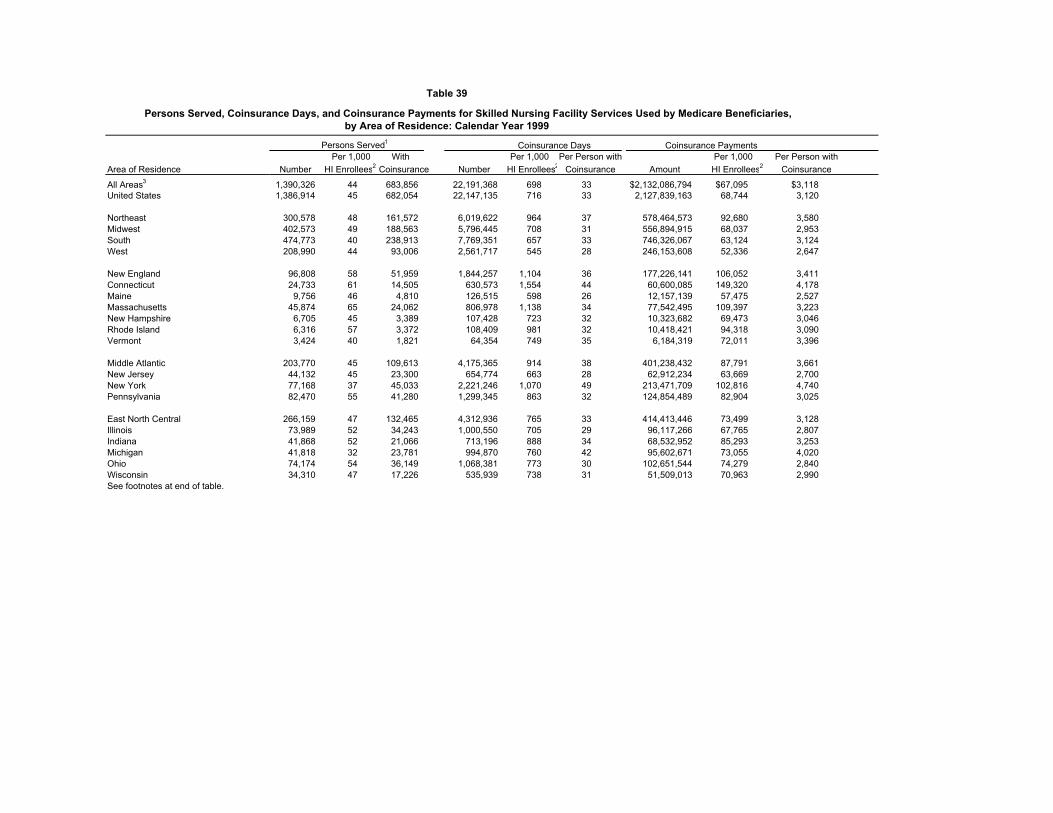
Table 39
Persons Served, Coinsurance Days, and Coinsurance Payments for Skilled Nursing Facility Services Used by Medicare Beneficiaries,by Area of Residence: Calendar Year 1999
Coinsurance Days Coinsurance Payments Per 1,000 With Per 1,000 Per Person with Per 1,000 Per Person with
Area of Residence Number HI Enrollees2 Coinsurance Number HI Enrollees2 Coinsurance Amount HI Enrollees2 Coinsurance
East North Central 266,159 47 132,465 4,312,936 765 33 414,413,446 73,499 3,128 Illinois 73,989 52 34,243 1,000,550 705 29 96,117,266 67,765 2,807 Indiana 41,868 52 21,066 713,196 888 34 68,532,952 85,293 3,253 Michigan 41,818 32 23,781 994,870 760 42 95,602,671 73,055 4,020 Ohio 74,174 54 36,149 1,068,381 773 30 102,651,544 74,279 2,840 Wisconsin 34,310 47 17,226 535,939 738 31 51,509,013 70,963 2,990 See footnotes at end of table.
Persons Served1
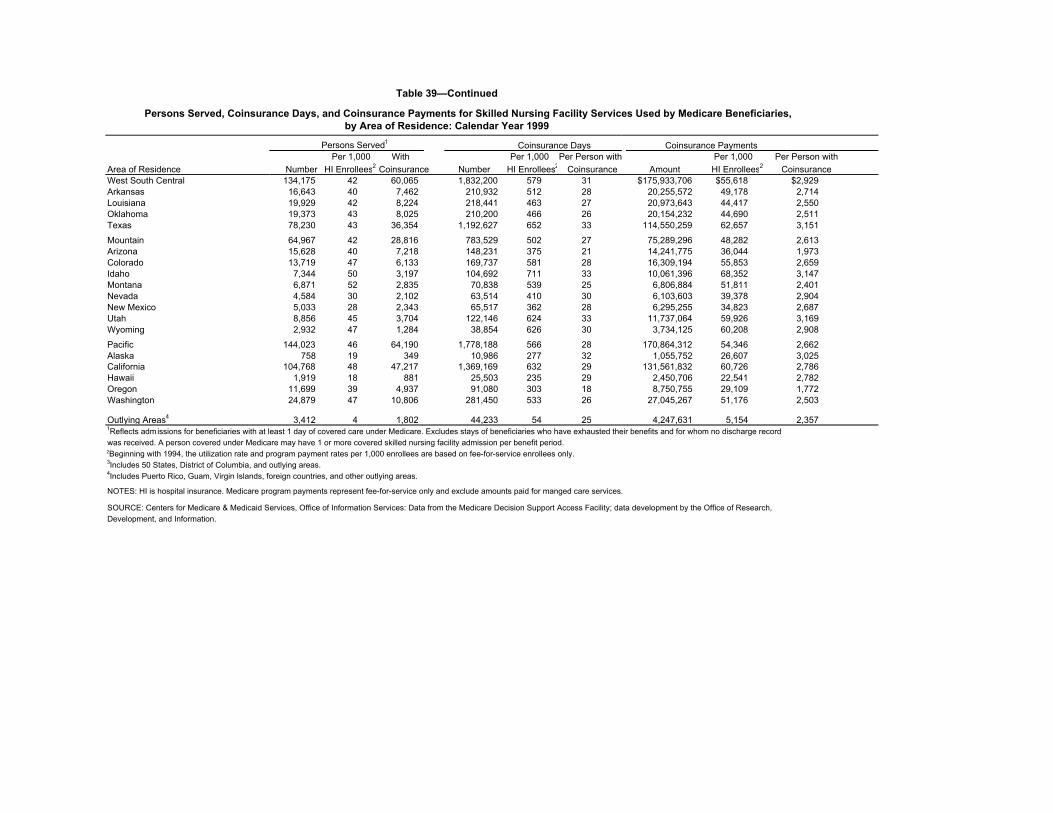
Table 39—Continued
Persons Served, Coinsurance Days, and Coinsurance Payments for Skilled Nursing Facility Services Used by Medicare Beneficiaries,by Area of Residence: Calendar Year 1999
Coinsurance Days Coinsurance Payments Per 1,000 With Per 1,000 Per Person with Per 1,000 Per Person with
Area of Residence Number HI Enrollees2 Coinsurance Number HI Enrollees2 Coinsurance Amount HI Enrollees2 CoinsuranceWest North Central 136,414 54 56,098 1,483,509 583 26 $142,481,469 $55,946 $2,540Iowa 23,411 51 8,243 169,848 373 21 16,314,605 35,781 1,979 Kansas 20,114 57 7,610 177,228 500 23 17,023,094 48,066 2,237 Minnesota 29,886 54 13,915 422,328 759 30 40,546,159 72,878 2,914 Missouri 37,868 52 16,357 445,303 615 27 42,780,777 59,111 2,615 Nebraska 12,965 54 5,045 136,249 571 27 13,085,915 54,881 2,594 North Dakota 5,675 56 2,182 52,473 521 24 5,038,853 50,048 2,309 South Dakota 6,495 55 2,746 80,080 682 29 7,692,066 65,509 2,801
East South Central 94,056 40 47,491 1,700,505 718 36 163,375,973 69,020 3,440 Alabama 21,054 34 11,245 457,871 741 41 43,994,614 71,200 3,912 Kentucky 25,131 44 12,379 420,995 736 34 40,450,867 70,708 3,268 Mississippi 14,845 36 7,015 228,512 559 33 21,936,710 53,685 3,127 Tennessee 33,026 43 16,852 593,127 772 35 56,993,782 74,164 3,382 See footnotes at end of table.
Persons Served1
Table 39—Continued
Persons Served, Coinsurance Days, and Coinsurance Payments for Skilled Nursing Facility Services Used by Medicare Beneficiaries,by Area of Residence: Calendar Year 1999
Coinsurance Days Coinsurance Payments Per 1,000 With Per 1,000 Per Person with Per 1,000 Per Person with
Outlying Areas4 3,412 4 1,802 44,233 54 25 4,247,631 5,154 2,3571Reflects admissions for beneficiaries with at least 1 day of covered care under Medicare. Excludes stays of beneficiaries who have exhausted their benefits and for whom no discharge recordwas received. A person covered under Medicare may have 1 or more covered skilled nursing facility admission per benefit period.2Beginning with 1994, the utilization rate and program payment rates per 1,000 enrollees are based on fee-for-service enrollees only.3Includes 50 States, District of Columbia, and outlying areas.4Includes Puerto Rico, Guam, Virgin Islands, foreign countries, and other outlying areas.
NOTES: HI is hospital insurance. Medicare program payments represent fee-for-service only and exclude amounts paid for manged care services.
SOURCE: Centers for Medicare & Medicaid Services, Office of Information Services: Data from the Medicare Decision Support Access Facility; data development by the Office of Research,Development, and Information.
Persons Served1
Type of Entitlement and Covered Covered Per Per Amount Per
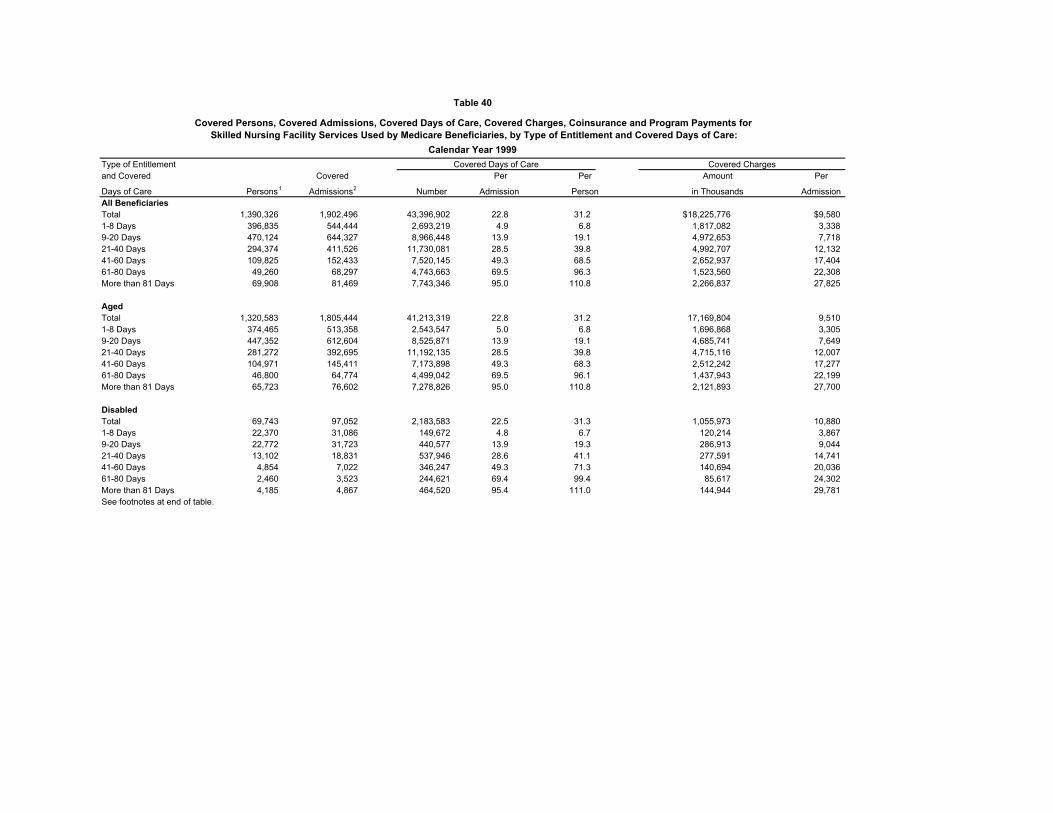
Days of Care Persons1 Admissions2 Number Admission Person in Thousands AdmissionAll BeneficiariesTotal 1,390,326 1,902,496 43,396,902 22.8 31.2 $18,225,776 $9,5801-8 Days 396,835 544,444 2,693,219 4.9 6.8 1,817,082 3,338 9-20 Days 470,124 644,327 8,966,448 13.9 19.1 4,972,653 7,718 21-40 Days 294,374 411,526 11,730,081 28.5 39.8 4,992,707 12,132 41-60 Days 109,825 152,433 7,520,145 49.3 68.5 2,652,937 17,404 61-80 Days 49,260 68,297 4,743,663 69.5 96.3 1,523,560 22,308 More than 81 Days 69,908 81,469 7,743,346 95.0 110.8 2,266,837 27,825
AgedTotal 1,320,583 1,805,444 41,213,319 22.8 31.2 17,169,804 9,510 1-8 Days 374,465 513,358 2,543,547 5.0 6.8 1,696,868 3,305 9-20 Days 447,352 612,604 8,525,871 13.9 19.1 4,685,741 7,649 21-40 Days 281,272 392,695 11,192,135 28.5 39.8 4,715,116 12,007 41-60 Days 104,971 145,411 7,173,898 49.3 68.3 2,512,242 17,277 61-80 Days 46,800 64,774 4,499,042 69.5 96.1 1,437,943 22,199 More than 81 Days 65,723 76,602 7,278,826 95.0 110.8 2,121,893 27,700
DisabledTotal 69,743 97,052 2,183,583 22.5 31.3 1,055,973 10,880 1-8 Days 22,370 31,086 149,672 4.8 6.7 120,214 3,867 9-20 Days 22,772 31,723 440,577 13.9 19.3 286,913 9,044 21-40 Days 13,102 18,831 537,946 28.6 41.1 277,591 14,741 41-60 Days 4,854 7,022 346,247 49.3 71.3 140,694 20,036 61-80 Days 2,460 3,523 244,621 69.4 99.4 85,617 24,302 More than 81 Days 4,185 4,867 464,520 95.4 111.0 144,944 29,781 See footnotes at end of table.
Covered Days of Care Covered Charges
Table 40
Covered Persons, Covered Admissions, Covered Days of Care, Covered Charges, Coinsurance and Program Payments forSkilled Nursing Facility Services Used by Medicare Beneficiaries, by Type of Entitlement and Covered Days of Care:
Calendar Year 1999
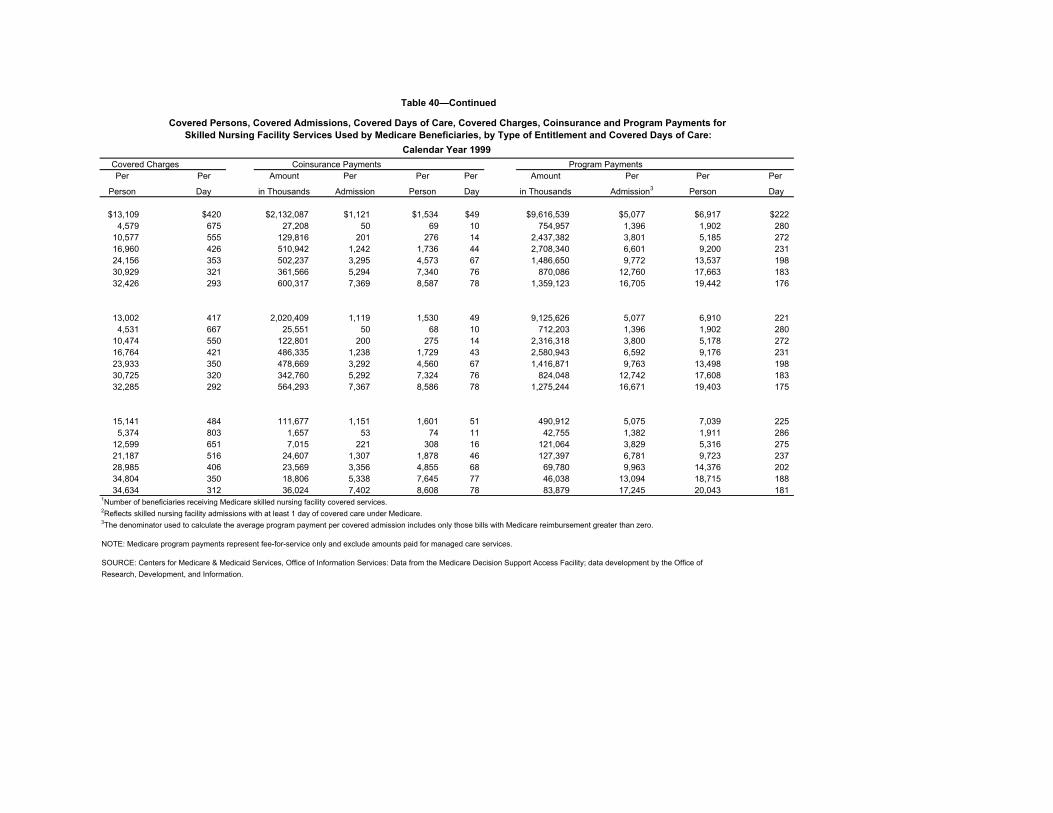
Covered Charges Coinsurance Payments Program PaymentsPer Per Amount Per Per Per Amount Per Per Per
Person Day in Thousands Admission Person Day in Thousands Admission3 Person Day
1Number of beneficiaries receiving Medicare skilled nursing facility covered services.2Reflects skilled nursing facility admissions with at least 1 day of covered care under Medicare. 3The denominator used to calculate the average program payment per covered admission includes only those bills with Medicare reimbursement greater than zero.
NOTE: Medicare program payments represent fee-for-service only and exclude amounts paid for managed care services.
SOURCE: Centers for Medicare & Medicaid Services, Office of Information Services: Data from the Medicare Decision Support Access Facility; data development by the Office of Research, Development, and Information.
Table 40—Continued
Covered Persons, Covered Admissions, Covered Days of Care, Covered Charges, Coinsurance and Program Payments forSkilled Nursing Facility Services Used by Medicare Beneficiaries, by Type of Entitlement and Covered Days of Care:
Calendar Year 1999
Table 41Covered Admissions, Covered Days of Care, Covered Charges, and Program Payments for
Medicare Beneficiaries Admitted to Skilled Nursing Facilities, by Principal Diagnoses Within Major Diagnostic Classification (MDC): Calendar Year 1999
Principal Covered Admissions1
ICD-9-CM PercentPrincipal ICD-9-CM2 Code Distri-Diagnosis Within MDC Category Number butionTotal All Diagnoses4 --- 1,902,496 100.0 Leading Diagnoses5 --- 1,508,330 79.3
Infectious and Parasitic Diseases (MDC 1) 001-139 30,966 1.6 Septicemia 038 20,373 1.1 Other --- 10,593 0.6
Neoplasms (MDC 2) 140-239 78,568 4.1 Malignant Neoplasm of Colon 153 7,475 0.4 Malignant Neoplasm of Rectum, Rectosigmoid Junction, and Anus 154 4,826 0.3 Malignant Neoplasm of Trachea, Bronchus, and Lung 162 12,382 0.7 Malignant Neoplasm of Female Breast 174 3,840 0.2 Malignant Neoplasm of Prostate 185 4,029 0.2 Secondary Malignant Neoplasm of Respiratory and Digestive Systems and Other Specified Sites 197-198 8,021 0.4 Other --- 37,995 2.0
Endocrine, Nutritional, and Metabolic Diseases and Immunity Disorders (MDC 3) 240-279 85,850 4.5
Diabetes 250 39,995 2.1 Nutritional Deficiencies 260-263 4,405 0.2 Disorders of Fluid, Electrolyte, and Acid-Base Balance 276 31,826 1.7 Other --- 9,624 0.5
Diseases of the Blood and Blood Forming Organs (MDC 4) 280-289 13,258 0.7 Other and Unspecified Anemias 285 7,363 0.4 Other --- 5,895 0.3
Mental Disorders (MDC 5) 290-319 43,383 2.3 Senile and Prosenile Organic Psychotic Conditions 290 14,302 0.8 Other Organic Psychotic Conditions (Chronic) 294 7,760 0.4 Other Non-Organic Psychoses 298 4,286 0.2 Other --- 17,035 0.9
Diseases of the Nervous System and Sense Organs (MDC 6) 320-389 48,103 2.5 Other Cerebral Degenerations 331 12,824 0.7 Parkinson's Disease 332 11,359 0.6 Hemiplegia 342 4,373 0.2 Other --- 19,547 1.0 See footnotes at end of table.
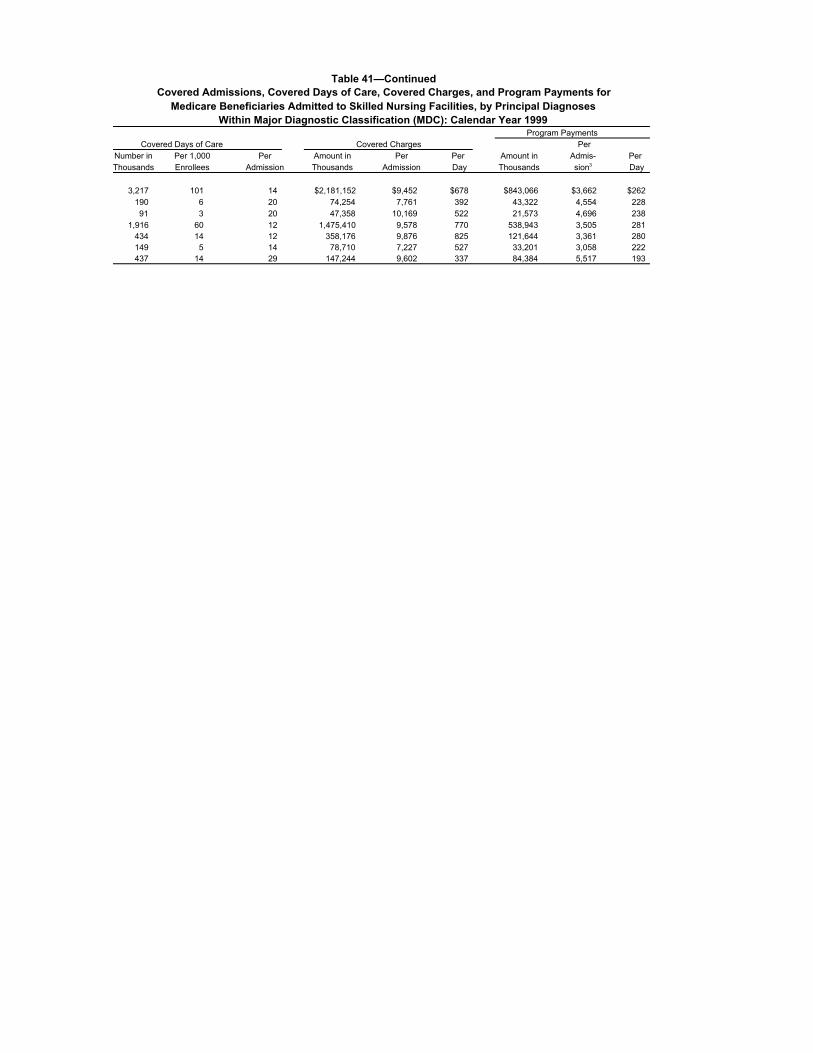
Table 41—ContinuedCovered Admissions, Covered Days of Care, Covered Charges, and Program Payments for
Medicare Beneficiaries Admitted to Skilled Nursing Facilities, by Principal Diagnoses Within Major Diagnostic Classification (MDC): Calendar Year 1999
Program Payments Covered Days of Care PerNumber in Per 1,000 Per Amount in Per Per Amount in Admis- PerThousands Enrollees Admission Thousands Admission Day Thousands sion3 Day
Table 41—ContinuedCovered Admissions, Covered Days of Care, Covered Charges, and Program Payments for
Medicare Beneficiaries Admitted to Skilled Nursing Facilities, by Principal Diagnoses Within Major Diagnostic Classification (MDC): Calendar Year 1999
Principal Covered Admissions1
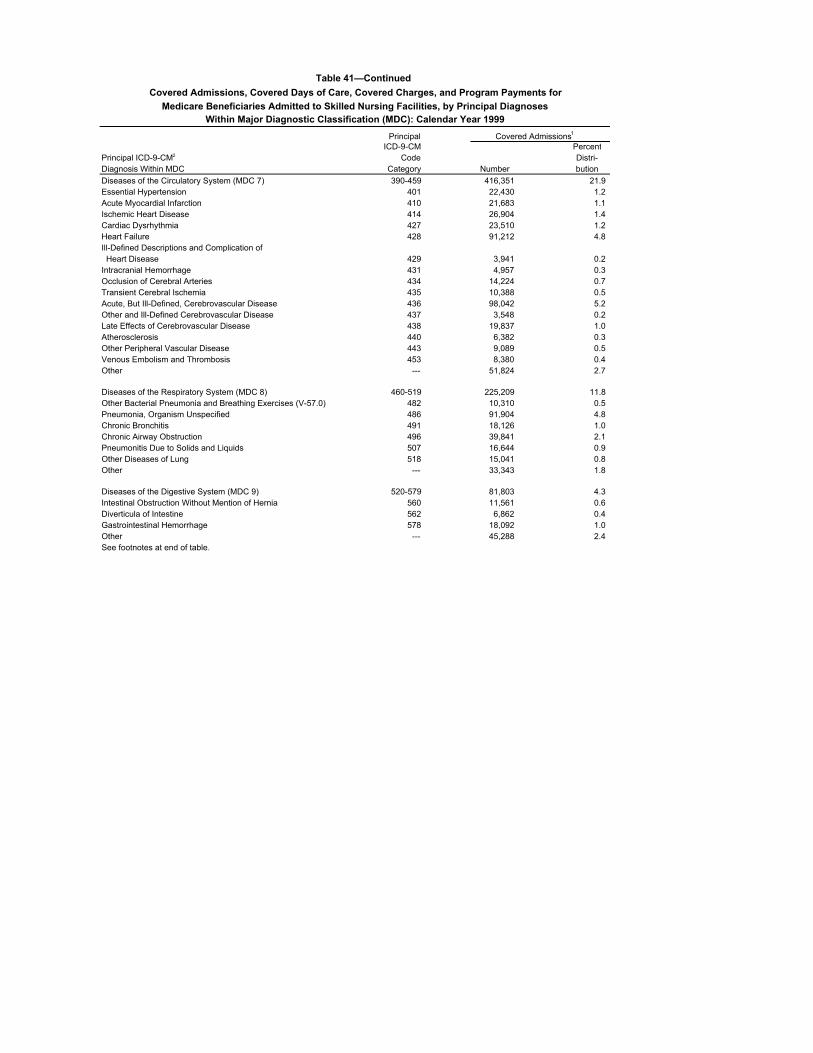
ICD-9-CM PercentPrincipal ICD-9-CM2 Code Distri-Diagnosis Within MDC Category Number butionDiseases of the Circulatory System (MDC 7) 390-459 416,351 21.9 Essential Hypertension 401 22,430 1.2 Acute Myocardial Infarction 410 21,683 1.1 Ischemic Heart Disease 414 26,904 1.4 Cardiac Dysrhythmia 427 23,510 1.2 Heart Failure 428 91,212 4.8 Ill-Defined Descriptions and Complication of Heart Disease 429 3,941 0.2 Intracranial Hemorrhage 431 4,957 0.3 Occlusion of Cerebral Arteries 434 14,224 0.7 Transient Cerebral Ischemia 435 10,388 0.5 Acute, But Ill-Defined, Cerebrovascular Disease 436 98,042 5.2 Other and Ill-Defined Cerebrovascular Disease 437 3,548 0.2 Late Effects of Cerebrovascular Disease 438 19,837 1.0 Atherosclerosis 440 6,382 0.3 Other Peripheral Vascular Disease 443 9,089 0.5 Venous Embolism and Thrombosis 453 8,380 0.4 Other --- 51,824 2.7
Diseases of the Respiratory System (MDC 8) 460-519 225,209 11.8 Other Bacterial Pneumonia and Breathing Exercises (V-57.0) 482 10,310 0.5 Pneumonia, Organism Unspecified 486 91,904 4.8 Chronic Bronchitis 491 18,126 1.0 Chronic Airway Obstruction 496 39,841 2.1 Pneumonitis Due to Solids and Liquids 507 16,644 0.9 Other Diseases of Lung 518 15,041 0.8 Other --- 33,343 1.8
Diseases of the Digestive System (MDC 9) 520-579 81,803 4.3 Intestinal Obstruction Without Mention of Hernia 560 11,561 0.6 Diverticula of Intestine 562 6,862 0.4 Gastrointestinal Hemorrhage 578 18,092 1.0 Other --- 45,288 2.4 See footnotes at end of table.
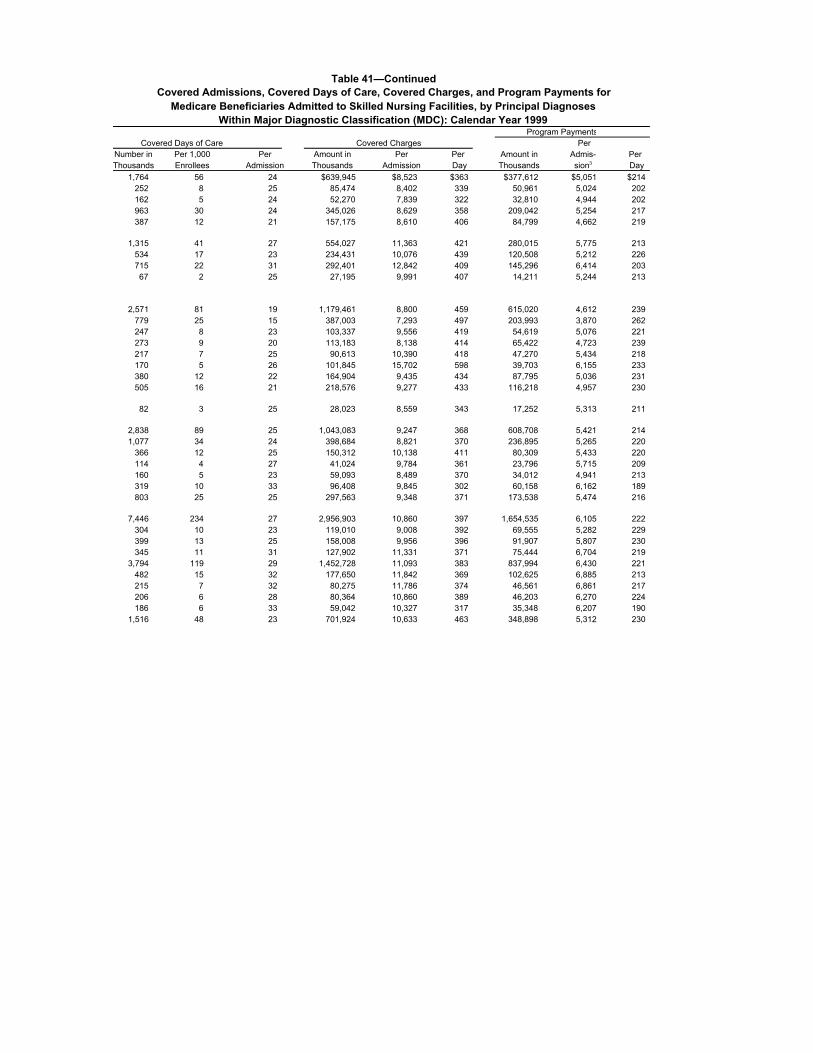
Table 41—ContinuedCovered Admissions, Covered Days of Care, Covered Charges, and Program Payments for
Medicare Beneficiaries Admitted to Skilled Nursing Facilities, by Principal Diagnoses Within Major Diagnostic Classification (MDC): Calendar Year 1999
Program Payments Covered Days of Care Per
Number in Per 1,000 Per Amount in Per Per Amount in Admis- PerThousands Enrollees Admission Thousands Admission Day Thousands sion3 Day
Table 41—ContinuedCovered Admissions, Covered Days of Care, Covered Charges, and Program Payments for
Medicare Beneficiaries Admitted to Skilled Nursing Facilities, by Principal Diagnoses Within Major Diagnostic Classification (MDC): Calendar Year 1999
Principal Covered Admissions1
ICD-9-CM PercentPrincipal ICD-9-CM2 Code Distri-Diagnosis Within MDC Category Number butionDiseases of the Genitourinary System (MDC 10) 580-629 75,081 3.9 Chronic Renal Failure 585 10,173 0.5 Renal Failure, Unspecified 586 6,668 0.4 Other Disorders of Urethra and Urinary Tract 599 39,984 2.1 Other --- 18,256 1.0
Diseases of the Skin and Subcutaneous Tissue (MDC 12) 680-709 48,757 2.6 Other Cellulitis and Abscess 682 23,266 1.2 Chronic Ulcer of Skin 707 22,769 1.2 Other --- 2,722 0.1
Diseases of the Musculoskeletal System and ConnectiveTissue (MDC 13) 710-739 134,035 7.0 Osteoarthrosis and Allied Disorders 715 53,068 2.8 Other and Unspecified Disorders of Joint 719 10,814 0.6 Spinal Stenosis 724 13,908 0.7 Disorders of Muscle, Ligament, and Fascia 728 8,721 0.5 Osteomyelitis, Periostitis, and Other Infections Involving Bone 730 6,486 0.3 Other Disorders of Bone and Cartilage 733 17,478 0.9 Other --- 23,560 1.2
Congenital Anomalies (MDC 14) 740-759 3,274 0.2
Other Ill Defined Conditions (MDC 16) 780-799 112,803 5.9 General Symptoms 780 45,199 2.4 Symptoms Involving Nervous and Musculosketal Systems 781 14,826 0.8 Symptom Disorders of Cardiovascular System 785 4,193 0.2 Symptoms Involving Respiratory System and Other Chest Symptoms 786 6,961 0.4 Symptoms Involving Digestive System 787 9,793 0.5 Other --- 31,831 1.7
Injury and Poisoning (MDC 17) 800-999 272,268 14.3 Fracture, Vertebra 805 13,212 0.7 Fracture, Pelvis 808 15,871 0.8 Fracture, Humerus 812 11,288 0.6 Fracture, Neck of Femur 820 130,956 6.9 Fracture, Shaft of Femur 821 15,002 0.8 Fracture, Tibia, Fibula 823 6,811 0.4 Fracture of Ankle 824 7,400 0.4 Amputation 897 5,717 0.3 Other --- 66,011 3.5 See footnotes at end of table.
Table 41—ContinuedCovered Admissions, Covered Days of Care, Covered Charges, and Program Payments for
Medicare Beneficiaries Admitted to Skilled Nursing Facilities, by Principal Diagnoses Within Major Diagnostic Classification (MDC): Calendar Year 1999
Program Payments Covered Days of Care Per
Number in Per 1,000 Per Amount in Per Per Amount in Admis- PerThousands Enrollees Admission Thousands Admission Day Thousands sion3 Day
Table 41—ContinuedCovered Admissions, Covered Days of Care, Covered Charges, and Program Payments for
Medicare Beneficiaries Admitted to Skilled Nursing Facilities, by Principal Diagnoses Within Major Diagnostic Classification (MDC): Calendar Year 1999
Principal Covered Admissions1
ICD-9-CM PercentPrincipal ICD-9-CM2 Code Distri-Diagnosis Within MDC Category Number butionSupplementary Classification of Factors Influencing Health Status and Contact with Health Services V01-V82 230,753 12.1 Organ of Tissue Replaced by Other Means V43 9,567 0.5 Orthopedic Aftercare V54 4,657 0.2 Breathing Exercises V57 154,038 8.1 Encounter for Other and Unspecified Procedures and Aftercare V58 36,266 1.9 Convalescence V66 10,891 0.6 Other --- 15,334 0.8 1Reflects skilled nursing facility admissions with at least 1 day of covered care under Medicare. 2ICD-9-CM is International Classification of Diseases, 9th Revision, Clinical Modification (Volume 1). Only the first listed or principal diagnosishas been used.3The denominator used to calculate the average program payment per covered admission includes only those bills with Medicarereimbursement greater than zero.4Includes invalid codes not shown separately.5Specific leading diagnostic categories were selected for presentation because of frequency of occurrences or special interest.
NOTES: Medicare program payments represent fee-for-service only. Numbers may not add to totals because of rounding. MDCs 11 and 15were not shown separately (but are included in the totals) because these diagnostic conditions are, for the most part, not applicable toMedicare beneficiaries.
SOURCE: Centers for Medicare & Medicaid Services, Office of Information Services: Data from the Medicare Decision Support Access Facility;data development by the Office of Research, Development, and Information.
Table 41—ContinuedCovered Admissions, Covered Days of Care, Covered Charges, and Program Payments for
Medicare Beneficiaries Admitted to Skilled Nursing Facilities, by Principal Diagnoses Within Major Diagnostic Classification (MDC): Calendar Year 1999
Program Payments Covered Days of Care Per
Number in Per 1,000 Per Amount in Per Per Amount in Admis- PerThousands Enrollees Admission Thousands Admission Day Thousands sion3 Day
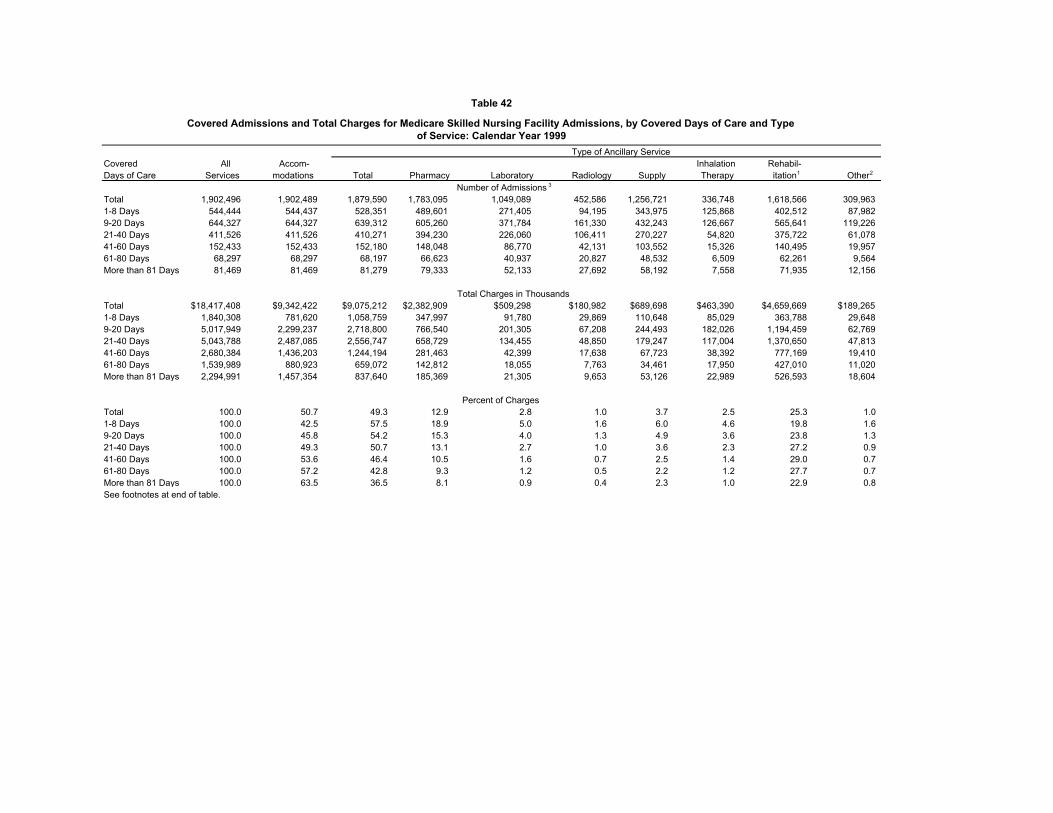
Covered Admissions and Total Charges for Medicare Skilled Nursing Facility Admissions, by Covered Days of Care and Typeof Service: Calendar Year 1999
Type of Ancillary ServiceCovered All Accom- Inhalation Rehabil-Days of Care Services modations Total Pharmacy Laboratory Radiology Supply Therapy itation1 Other2
Number of Admissions 3
Total 1,902,496 1,902,489 1,879,590 1,783,095 1,049,089 452,586 1,256,721 336,748 1,618,566 309,963 1-8 Days 544,444 544,437 528,351 489,601 271,405 94,195 343,975 125,868 402,512 87,982 9-20 Days 644,327 644,327 639,312 605,260 371,784 161,330 432,243 126,667 565,641 119,226 21-40 Days 411,526 411,526 410,271 394,230 226,060 106,411 270,227 54,820 375,722 61,078 41-60 Days 152,433 152,433 152,180 148,048 86,770 42,131 103,552 15,326 140,495 19,957 61-80 Days 68,297 68,297 68,197 66,623 40,937 20,827 48,532 6,509 62,261 9,564 More than 81 Days 81,469 81,469 81,279 79,333 52,133 27,692 58,192 7,558 71,935 12,156
Total Charges in ThousandsTotal $18,417,408 $9,342,422 $9,075,212 $2,382,909 $509,298 $180,982 $689,698 $463,390 $4,659,669 $189,2651-8 Days 1,840,308 781,620 1,058,759 347,997 91,780 29,869 110,648 85,029 363,788 29,648 9-20 Days 5,017,949 2,299,237 2,718,800 766,540 201,305 67,208 244,493 182,026 1,194,459 62,769 21-40 Days 5,043,788 2,487,085 2,556,747 658,729 134,455 48,850 179,247 117,004 1,370,650 47,813 41-60 Days 2,680,384 1,436,203 1,244,194 281,463 42,399 17,638 67,723 38,392 777,169 19,410 61-80 Days 1,539,989 880,923 659,072 142,812 18,055 7,763 34,461 17,950 427,010 11,020 More than 81 Days 2,294,991 1,457,354 837,640 185,369 21,305 9,653 53,126 22,989 526,593 18,604
Percent of ChargesTotal 100.0 50.7 49.3 12.9 2.8 1.0 3.7 2.5 25.3 1.0 1-8 Days 100.0 42.5 57.5 18.9 5.0 1.6 6.0 4.6 19.8 1.6 9-20 Days 100.0 45.8 54.2 15.3 4.0 1.3 4.9 3.6 23.8 1.3 21-40 Days 100.0 49.3 50.7 13.1 2.7 1.0 3.6 2.3 27.2 0.9 41-60 Days 100.0 53.6 46.4 10.5 1.6 0.7 2.5 1.4 29.0 0.7 61-80 Days 100.0 57.2 42.8 9.3 1.2 0.5 2.2 1.2 27.7 0.7 More than 81 Days 100.0 63.5 36.5 8.1 0.9 0.4 2.3 1.0 22.9 0.8 See footnotes at end of table.
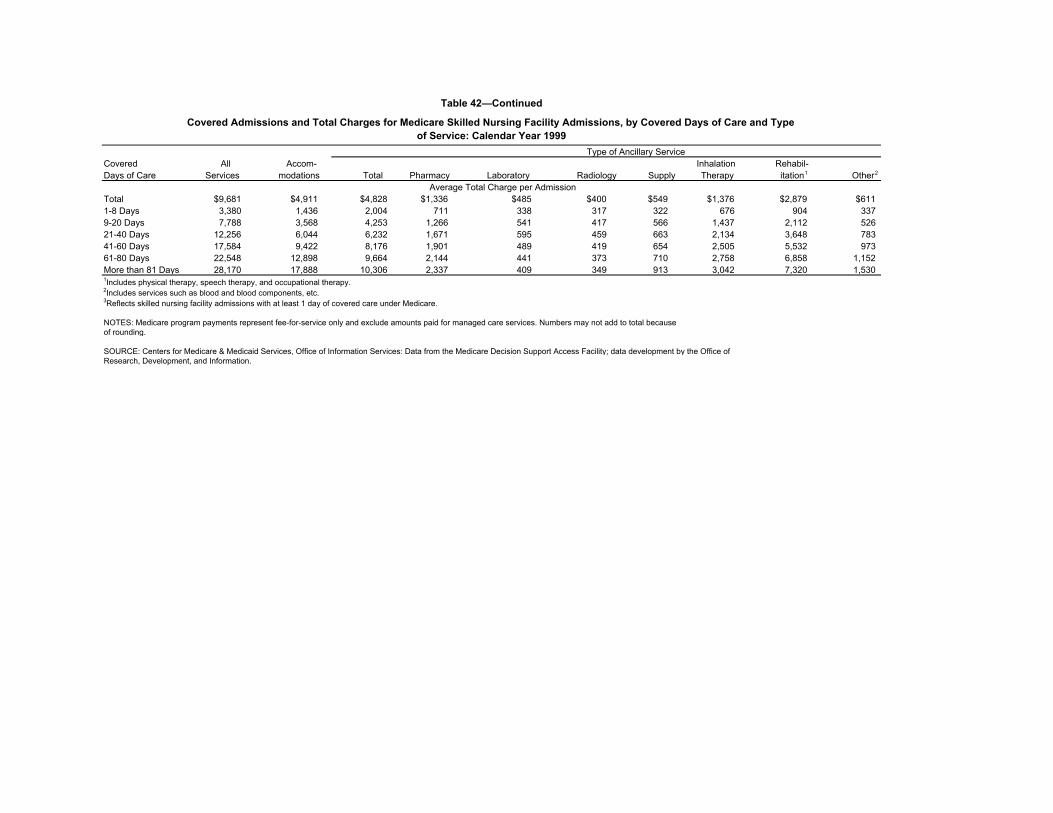
Table 42—Continued
Covered Admissions and Total Charges for Medicare Skilled Nursing Facility Admissions, by Covered Days of Care and Typeof Service: Calendar Year 1999
Type of Ancillary Service Covered All Accom- Inhalation Rehabil-Days of Care Services modations Total Pharmacy Laboratory Radiology Supply Therapy itation1 Other2
Average Total Charge per AdmissionTotal $9,681 $4,911 $4,828 $1,336 $485 $400 $549 $1,376 $2,879 $6111-8 Days 3,380 1,436 2,004 711 338 317 322 676 904 337 9-20 Days 7,788 3,568 4,253 1,266 541 417 566 1,437 2,112 526 21-40 Days 12,256 6,044 6,232 1,671 595 459 663 2,134 3,648 783 41-60 Days 17,584 9,422 8,176 1,901 489 419 654 2,505 5,532 973 61-80 Days 22,548 12,898 9,664 2,144 441 373 710 2,758 6,858 1,152 More than 81 Days 28,170 17,888 10,306 2,337 409 349 913 3,042 7,320 1,530 1Includes physical therapy, speech therapy, and occupational therapy.2Includes services such as blood and blood components, etc.3Reflects skilled nursing facility admissions with at least 1 day of covered care under Medicare.
NOTES: Medicare program payments represent fee-for-service only and exclude amounts paid for managed care services. Numbers may not add to total becauseof rounding.
SOURCE: Centers for Medicare & Medicaid Services, Office of Information Services: Data from the Medicare Decision Support Access Facility; data development by the Office of Research, Development, and Information.
Table 43
Number of Medicare Skilled Nursing Facilities (SNF) and Swing-Bed Hospitals Providing SNF Services, Covered Admissions,Covered Days of Care, and Program Payments, by Type of Facility and Bedsize: Calendar Year 1999
Type of Number Covered Covered Days of Care Program PaymentsFacility of Admissions 1 Number in Per Amount in Per Perand Bed Size Facilities Number Percent Thousands Percent Admission Thousands Percent Admissions 2 DaySNFsTotal 14,914 1,795,672 100.0 42,411 100.0 23.6 $9,400,197 100.0 $5,259 $2221-49 Beds 9,012 1,094,667 61.0 23,235 54.8 21.2 5,407,971 57.5 4,952 233 50-99 Beds 3,464 373,500 20.8 9,397 22.2 25.2 2,033,693 21.6 5,472 216 100-149 Beds 1,495 161,370 9.0 4,572 10.8 28.3 877,424 9.3 5,481 192 150-199 Beds 495 74,962 4.2 2,159 5.1 28.8 425,776 4.5 5,804 197 More than 200 Beds 448 91,173 5.1 3,049 7.2 33.4 655,334 7.0 7,271 215
Total 1,320 106,824 100.0 986 100.0 9.2 216,342 100.0 2,026 219 1-49 Beds 1,025 85,219 79.8 786 79.7 9.2 173,436 80.2 2,036 221 50-99 Beds 295 21,605 20.2 200 20.3 9.2 42,906 19.8 1,987 215 1Reflects SNF admissions with at least 1 day of covered care under Medicare.2Does not reflect admissions for beneficiaries with no program payments reported in the calendar year.3Swing-bed hospitals are not SNFs and are not included in the count of total SNFs; however, swing-bed hospital services are included in the total use and cost of Medicare SNF services.
NOTES: Medicare program payments represent fee-for-service only and exclude amounts paid for managed care services. Numbers may not add to total because of rounding.
SOURCE: Centers for Medicare & Medicaid Services, Office of Information Services: Data from the Medicare Decision Support Access Facility; data development by the Office of Research,Development, and Information.
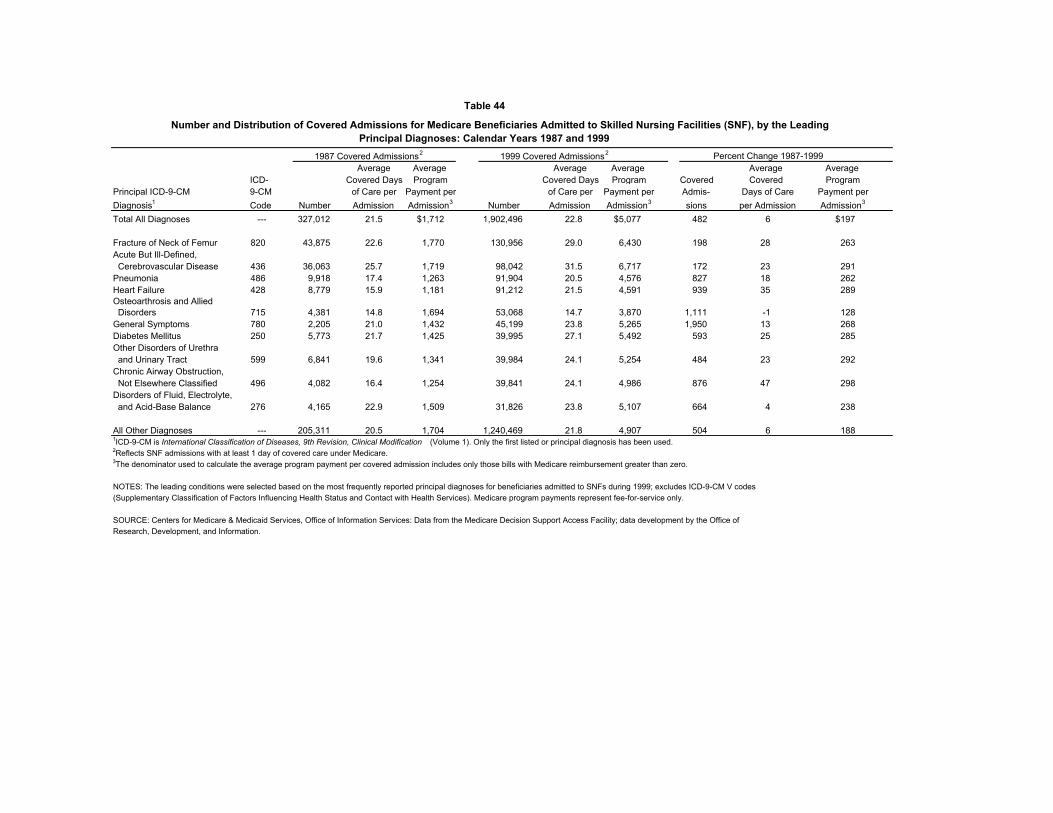
Table 44
Number and Distribution of Covered Admissions for Medicare Beneficiaries Admitted to Skilled Nursing Facilities (SNF), by the LeadingPrincipal Diagnoses: Calendar Years 1987 and 1999
1987 Covered Admissions2 1999 Covered Admissions2
Average Average Average Average Average Average ICD- Covered Days Program Covered Days Program Covered Covered Program
Principal ICD-9-CM 9-CM of Care per Payment per of Care per Payment per Admis- Days of Care Payment perDiagnosis1 Code Number Admission Admission3 Number Admission Admission3 sions per Admission Admission3
Total All Diagnoses --- 327,012 21.5 $1,712 1,902,496 22.8 $5,077 482 6 $197
All Other Diagnoses --- 205,311 20.5 1,704 1,240,469 21.8 4,907 504 6 1881ICD-9-CM is International Classification of Diseases, 9th Revision, Clinical Modification (Volume 1). Only the first listed or principal diagnosis has been used.2Reflects SNF admissions with at least 1 day of covered care under Medicare.3The denominator used to calculate the average program payment per covered admission includes only those bills with Medicare reimbursement greater than zero.
NOTES: The leading conditions were selected based on the most frequently reported principal diagnoses for beneficiaries admitted to SNFs during 1999; excludes ICD-9-CM V codes(Supplementary Classification of Factors Influencing Health Status and Contact with Health Services). Medicare program payments represent fee-for-service only.
SOURCE: Centers for Medicare & Medicaid Services, Office of Information Services: Data from the Medicare Decision Support Access Facility; data development by the Office of Research, Development, and Information.


![Comprehensive ESRD Care Initiative LDO Model€¦ · Comprehensive ESRD Care Initiative LDO Model . July [15], 2015 . ... Comprehensive ESRD Care Initiative Participation Agreement](https://static.documents.pub/doc/80x56/5af2cc657f8b9a95468ba91b/comprehensive-esrd-care-initiative-ldo-model-comprehensive-esrd-care-initiative.jpg)


