This document may not be distributed in the United States, Canada, Japan or Australia or to U.S. persons EQUITY RESEARCH November, 8 th 2013 Alternative Investment Market (AIM) - Italy NET INSURANCE – INITIAL PUBLIC OFFERING (IPO) TABLE OF CONTENTS Investment summary Investment overview 1. Group history 2. Group structure 3. Management 4. Use of proceeds 5. Background 6. Business dynamics and risks 7. Business model 8. Market and trends 9. Competition 10. Regulatory framework 11. SWOT analysis 12. Possible concerns and mitigating factors 13. Historical performance 14. Financial analysis 15. Our estimates 16. Valuation analysis Luigi Tardella – Head of Research [email protected]Phone +39 06 896841 Mobile +39 335 59 63 760 Silvia Piersimoni – Research Associate [email protected]Phone +39 06 896841 Mobile +39 345 87 67 247 Information pursuant to Article 69 et seq. of CONSOB (Italian Securities & Exchange Commission) Regulation no. 11971/1999 Investment summary • Strengthening leadership, while starting to differentiate Net Insurance is the Italian market leader in the insurance of salary and pension backed loans. Despite the highly dynamic competitive arena, over the last five years the Group has maintained a strong and stable market share leadership and now is moving towards a growth and diversification season, aiming to replicate its successful track record: - a larger high quality portfolio in the core business, leveraging on the reputation gained with major lenders - fast expansion in other Property and Casualty segments • A global giant for a new business partnership AXA Group, one of the largest global insurance groups and leading reinsurer, with consolidated gross revenues of € 90 billion in 2012, has recently entered into a strategic partnership with Net Insurance, acquiring a 3% stake and becoming one of its major reinsurers. • A promising niche segment Salary and pension backed loans is the only segment, of the broader consumer finance market, that recorded a positive performance (+3,8%) in the first half 2013, shifting from 8% to 9% of the total market. Being the only fully secured personal loan, in the last years major banks networks entered the segment. The Group top 5 customers, in the first 6 months of 2013, recorded an average growth rate of about 20% compared to the same period of the previous year. • In a long business cycle with deferred performance records, next 5 years will be the harvesting time Net Insurance portfolio has a long economic cycle (average 96 months). After two 5-year cycles of industry reorganization and navigation into the ups and downs of the financial crisis, the present portfolio is characterized by an implied lower risk, mainly due to an improvement of screening policies and lending process quality. This reduction of risk rate will consistently spread its effect over the next five years financial statements. Thus the next five years look as the harvesting time. • Time for a strong and profitable growth The present organizational structure, well dimensioned and assisted by proven processing procedures, is ready to manage significantly higher volumes and complexity, so that a substantial improvement in profitability should arise from the expected fast expansion.
Transcript
This document may not be distributed in the United States, Canada, Japan or Australia or to U.S. persons
EQUITY RESEARCH November, 8th 2013
Alternative Investment Market (AIM) - Italy NET INSURANCE – INITIAL PUBLIC OFFERING (IPO)
This document may not be distributed in the United States, Canada, Japan or Australia or to U.S. persons
EQUITY RESEARCH November, 8th 2013
This document is prepared by ENVENT S.p.A. This document is being furnished to you solely for your information on a confidential basis and may not be reproduced, redistributed or passed on, in whole or in part, to any other person. In particular, neither this document nor any copy thereof may be taken or transmitted or distributed, directly or indirectly, into Canada, Japan or Australia or to any resident thereof or into the United States, its territories or possessions or to U.S. persons. The distribution of this document in other jurisdictions may be restricted by law and persons into whose possession this document comes should inform themselves about, and observe, any such restrictions. Any failure to comply with these restrictions may constitute a violation of the laws of the United States, Canada, Japan, or Australia or any such other jurisdiction. This document does not constitute or form part of, and should not be construed as, an offer or invitation to subscribe for or purchase any securities in any jurisdiction, and neither this document nor anything contained herein shall form the basis of or be relied on in connection with or act as any inducement to enter into any contract or commitment whatsoever. This document has not been published generally and has only been made available to institutional investors. In making an investment decision, potential investors must rely on their own examination of the company and its group including the merits and risks involved. In Italy this document is being distributed only to, and is directed at qualified investors as defined in Article 34-ter, paragraph 1, letter b), of CONSOB regulation on Issuers no. 11971 of May 14, 1999, as subsequently amended (the ”Issuers’ regulation”), provided that such qualified investors will act in their capacity and not as depositories or nominees for other shareholders, such as persons authorized and regulated to operate in financial markets, both Italian and foreign, i.e.: a) banks; b) investment firms; c) other authorized and regulated financial institutions; d) insurance companies; e) collective investment undertakings and management companies for such undertakings; f) pension funds and management companies for such funds; g) dealers acting on their own account on commodities and commodity-based derivatives; h) persons dealing exclusively on their own account on financial instruments markets with indirect membership of clearing and settlement services and the local compensatory and guarantee system; i) other institutional investors; (l) stockbrokers; (2) large companies which at individual company level meet at least two of the following requirements: - balance sheet total: 20,000,000 euro, - net revenues: 40,000,000 euro, - own funds: 2,000,000 euro; (3) institutional investors whose main activities is investment in financial instruments, including companies dedicated to the securisation of assets and other financial transactions (all such persons together being referred to as “relevant persons”). Any person who is not a relevant person should not act or rely on this document or any of its contents. This document is not addressed to any member of the general public In Italy. Under no circumstances should this document circulate among, or be distributed in Italy to, distribution channel, through which information is, or is likely to become, available to a large number of persons, or to individuals or entities who do not fall within the definitions of qualified investors as previously specified and are not therefore a relevant person. In the United Kingdom, this document is being distributed only to, and is directed only at persons who (a) are (i) persons falling within Article 19 or Article 49 of the Financial Services and Markets Act 2000 (financial promotion) order 2005 (and only where the conditions contained in those articles have been, or will at the relevant time be, satisfied) or (ii) any other persons to whom it may be lawfully communicated; and (b) are qualified investors within the meaning of Article 2(1)(e) of the Prospectus Directive (Directive 2003/71/EC), (all such persons being referred to as “relevant persons”). This document must not be acted on or relied on by persons who are not relevant persons. Any investment or investment activity to which this communication relates is available only to relevant persons and will be engage in only with relevant persons. This document is being distributed to and is directed only at persons in members states of the European Economic Area (“EEA”) other than in Italy (in respect of which the regulation and requirements referred to above apply) who are “qualified investors” within the meaning of Article 2(1)(e) of the Prospectus Directive (Directive 2003/71/EC) (“qualified investors”). Any person in the EEA who receives this document will be deemed to have represented and agreed that it is a qualified investor. Any such recipient will also be deemed to have represented and agreed that it has not received this document on behalf of persons in the EEA other than qualified investors or persons in the UK, Italy and other member states (where equivalent legislation exists) for whom the investor has authority to make decisions on a wholly discretionary basis. The Company, the manager and their affiliates, and others will rely upon the truth and accuracy of the foregoing representations and agreements. Any person in the EEA who is not a qualified investor should not act or rely on this document or any of its contents. This document has been produced independently of Net Insurance S.p.A. (the "Company") and its shareholders and subsidiaries and affiliates, and any forecasts, opinions and expectations contained herein are entirely those of its author and are given as part of its normal research activity and should not be relied upon as having been authorized or approved by any other person. ENVENT S.p.A. has no authority whatsoever to make any representation or warranty on behalf of the Company, its shareholders, its subsidiaries, its affiliates, their respective advisors, or any other person in connection therewith. While all reasonable care has been taken to ensure that the facts stated herein are accurate and that the forecasts, opinions and expectations contained herein are fair and reasonable, and ENVENT S.p.A. has not verified the contents hereof and accordingly none of ENVENT S.p.A., the Company, its shareholders, its subsidiaries, its affiliates, their respective advisors or any other person in connection therewith nor any of their respective directors, officers or employees or advisers, shall be in any way responsible for the contents hereof and no reliance should be placed on the accuracy, fairness, or completeness of the information contained in this document. No person accepts any liability whatsoever for any loss howsoever arising from the use of this document or of its contents or otherwise arising in connection therewith. ENVENT S.p.A. (or its officers, directors or employees) may, to the extent permitted by law, have a position in the securities of (or options, warrants or rights with respect to, or interest in the shares or other securities of) the Company or act as a principal in any transaction in such securities.
1
1. GROUP HISTORY
Investment overview
• The instant leadership of a specialized Group in a niche market
segment Net Insurance S.p.A. – Net Insurance - was founded in 2000 in Rome by the
Amato family. Mr. Alfredo Rocchi and Prealpina Investimenti S.r.l. (Passeri
family) had minority shares.
The Group is since its foundation dedicated to credit protection related to
salary-backed loans and experienced a steady growth in the last ten years
(2003-2012 CAGR 8%), which allowed to gain the leadership in this niche
market since 2008.
The founders of the Company were driven by a strong innovation capability,
being able to identify a market segment in which the supply of insurance
products was generic and not specialized, while there was an increasing
unsatisfied demand from lenders that were progressively entering the market
segment.
Net Insurance soon gained a sound reputation as the Company specialized
in the business and, despite its small size and recent history, became rapidly
the market leader. The reputation and position gained attracted in the years
large and prestigious banking institutions as preferred business partners.
From 2004 to 2013 Swiss RE (2004), UniCredit (2006), UBI Group (2007), Banca
Monte dei Paschi di Siena (2011), Banca Etruria (2011), Veneto Banca (2012)
and Banca Popolare di Bari (2013), acquired minority stakes (between 1,5%-
10%) in the Group in order to establish a closer business relationship.
• AXA Group joins Net Insurance partner shareholders with a 3% stake In September 2013 AXA Group entered a strategic partnership with Net
Insurance, acquiring a 3% stake and becoming one of its major reinsurers
specialized in the salary-backed loans segment.
AXA Group is one of the world’s largest insurance groups and a leading
reinsurer, operating primarily in Europe, North America and in the Asia-Pacific
Region, with consolidated gross revenues of € 90 billion in 2012. In the P&C –
Property and Casualty - segment AXA Group ranks 1st in Switzerland and
Belgium with market shares of, respectively, 13% and 20%. In Italy it ranks 7th
with a market share of about 4%. In the Life & Savings segment it ranks 1st in
Switzerland, with a market share of 30% and 3rd in France and Belgium with
market shares of, respectively, 9% and 11%. In Italy it ranks 6th with a market
share of about 5%.
2
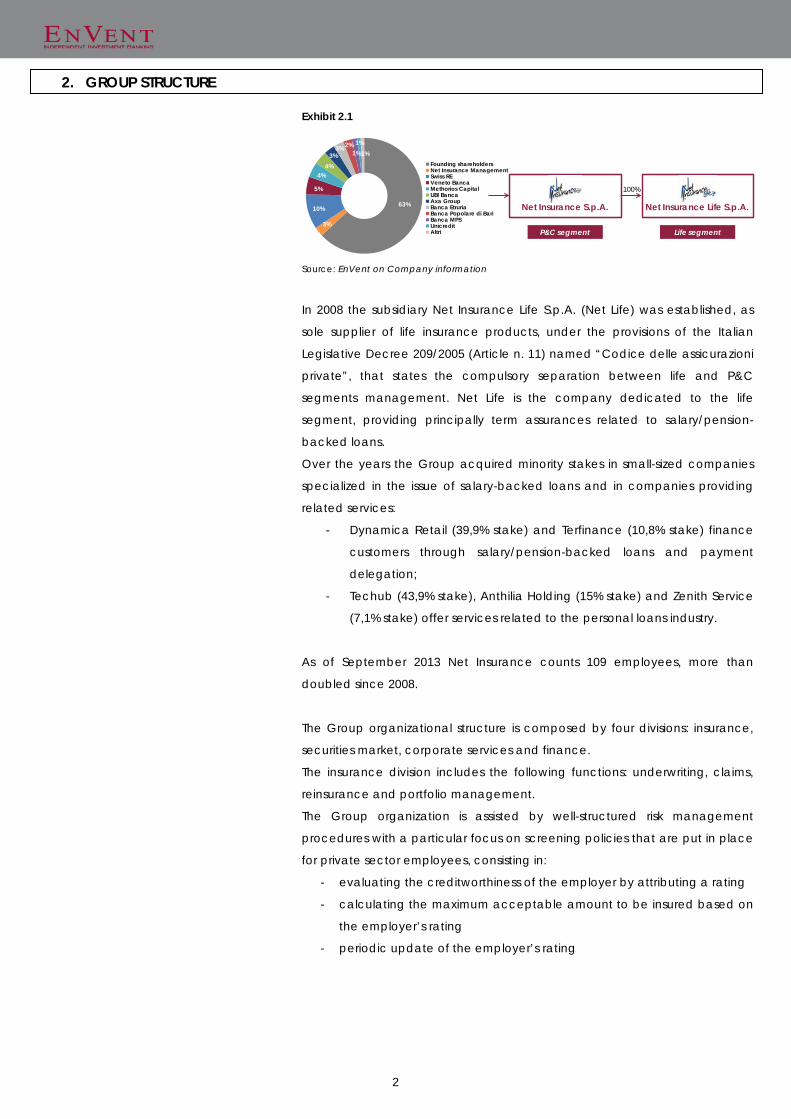
2. GROUP STRUCTURE
Exhibit 2.1
Source: EnVent on Company information
In 2008 the subsidiary Net Insurance Life S.p.A. (Net Life) was established, as
sole supplier of life insurance products, under the provisions of the Italian
Legislative Decree 209/2005 (Article n. 11) named “Codice delle assicurazioni
private”, that states the compulsory separation between life and P&C
segments management. Net Life is the company dedicated to the life
segment, providing principally term assurances related to salary/pension-
backed loans.
Over the years the Group acquired minority stakes in small-sized companies
specialized in the issue of salary-backed loans and in companies providing
related services:
- Dynamica Retail (39,9% stake) and Terfinance (10,8% stake) finance
customers through salary/pension-backed loans and payment
delegation;
- Techub (43,9% stake), Anthilia Holding (15% stake) and Zenith Service
(7,1% stake) offer services related to the personal loans industry.
As of September 2013 Net Insurance counts 109 employees, more than
doubled since 2008.
The Group organizational structure is composed by four divisions: insurance,
securities market, corporate services and finance.
The insurance division includes the following functions: underwriting, claims,
reinsurance and portfolio management.
The Group organization is assisted by well-structured risk management
procedures with a particular focus on screening policies that are put in place
for private sector employees, consisting in:
- evaluating the creditworthiness of the employer by attributing a rating
- calculating the maximum acceptable amount to be insured based on
- Magistrate of the Supreme Court- Member of the Judicial Council of the Appeal Court in Rome- Member of the Study office of the Superior Council of Judiciary- Has served the I talian judicial system in several roles
Giuseppe CarusoCEO General Manager
- From 1986 to 1991 Giuseppe Caruso served in the marketing functions of Gruppo Tirrena di Assicurazioni and Diner's Club d'I talia- From 1991 to 2000 he served as director of the business unit Mortgage insurance at FATA Assicurazioni (Generali Group)- In 2001 Mr. Caruso joined Net Insurance as CEO
Luigi Aiudi CFO
- Chartered Accountant and Auditor- From 1989 to 2001 Luigi Aiudi held several responsibilities in the administration and finance function of SOFID and SOFID Vita (Eni Group)- In 2001 Mr. Aiudi joined Net Insurance as CFO
Elio Migliardi Insurance OfficerBefore joining Net Insurance in 2001, Elio Migliardi served leading insurance companies in I taly such as FATA Assicurazioni, Unipol Assicurazioni and Allsecures Assicurazioni
4
4. USE OF PROCEEDS
• Strengthening market leadership while starting a differentiation
process Net Insurance in less than a decade has demonstrated to be able to
become the clear and stable market leader in its core business of
salary/pension-backed loans insurance and intends to further develop and
strengthen its leadership position, through strategic partnership agreements,
also supported by direct investments.
The Group also intends to diversify through the launch of new products in
other specialized niches and to expand its distribution networks, through the
increase in number of agents and brokers, enhancing direct distribution
(internet and telephone), creating partnerships with major national banking
groups and local banks.
The underlying strategic vision is the commitment to replicate the success in
other segments to fuel Group growth, balance ratios trends and benefit from
economies of scale.
• Deal structure
Issuer - Net Insurance S.p.A.
Market - AIM I talia - Alternative Investment Market
IPO structure - 100% capital increase - 1 bonus share every 10 shares held for at least 18m
Free Float - Minimum 10%
Lock up - 24-36 months on existing shareholders
Pre-marketing - End of October 2013
Bookbuilding - End of November 2013
Listing - Beginning of December 2013
Timing
Offering structure
5
5. BACKGROUND
• The Italian personal loans market called “Cessione del Quinto”
(salary and pension backed loans) The Group specialization is the credit protection related to salary and pension
backed loans, called in Italy “Cessione del Quinto”. This kind of loan is
regulated by a specific Italian law and regulation system and its peculiarity is
that the lender credit is guaranteed by salary or pension income, and is
reimbursed with monthly repayments, due by the employer on behalf of the
debtor, that cannot exceed one fifth of the net income.
Salary-backed loans were first introduced in Italy by the Decree Law D.P.R.
180/1950, followed by the Decree Law D.P.R. 895/1950, and were originally
reserved to Government and other Public Administrations employees.
Following the regulatory changes introduced by Law 311/2004 and Law
80/2005, salary-backed loans have been extended to private sector
employees and to retirees.
The requirements to enter into this kind of loan are an open-ended
employment contract and a minimum work experience (depending on the
lender and the insurer requirements).
Pension-backed loans are financing forms dedicated to pensioners,
guaranteed by the Italian Social Security Institutions, whose monthly
repayments too cannot exceed one fifth of pension income - without
affecting the minimum residual income imposed by law, equal to € 495 in
2013 - for a maximum period of ten years.
• Salary and pension backed loans contract mechanics
In a salary/pension-backed loan contract, the total amount to be repaid by
the borrower is given by the sum of the financed principal, interest, insurance
expense, agents’ commissions and other procedure expenses. The interest is
calculated based on the annual nominal interest rate (in Italy, TAN). This rate
is driven by the cost of funding of the lenders, provided by the banking
system. The insurance expense and agents’ commissions are calculated
based on a variable percentage on the financed capital, while other
expenses are generally fixed. The final annual actual interest rate implied in
the installments is the gross annual percentage rate (TAEG), that includes also
insurance expenses, agents’ commissions and other costs and can be
significantly higher than TAN.
It is to be noted that TAEG can not exceed an upper limit which is fixed by
Bank of Italy.
Each installment is calculated by dividing the total amount to be repaid by
the number of installments, of course if the nominal annual interest rate
increases, the financed capital decreases. For this reason, an increase of the
6
nominal annual interest rate implies a decrease of potential claims for the
insurer, whose risk is related only to the financed capital.
• The insurance policy within the salary and pension backed loans
According to Article 54 of said Law 180/1950, an insurance coverage must be
provided in all contracts. Insurance on salary/pension-backed loans protects
the lender against the inability of the borrower to repay the loan upon
occurrence of specific events as job loss and premature death.
The coverage of employment risk gives the insurance company the right of
recourse against the debtor in case of employment loss, within the limits of
the severance pay (in Italy TFR – Trattamento di Fine Rapporto) accrued to
data.
In the case of life risk the insurance company does not have the right of
recourse against the heirs of the borrower.
The insurance policy related to salary-backed loans, consists of:
- a P&C policy (credit class), which offers insurance against the risk of
the borrower's employment (resignation, dismissal, early retirement)
- a life policy (class I), which offers insurance in the case of premature
death of the borrower
Pension-backed loans are only assisted by a life insurance policy, aimed at
hedging the risk of death (the sole risk) of the borrower.
Borrowers have the right to repay the residual loan in advance. In this case,
since maturity of commissions, interest and insurance premiums is deferred
during the contract life, the insurance company has to refund the premiums
already collected, but not yet accrued as revenues up to that point.
7
6. BUSINESS DYNAMICS AND RISKS
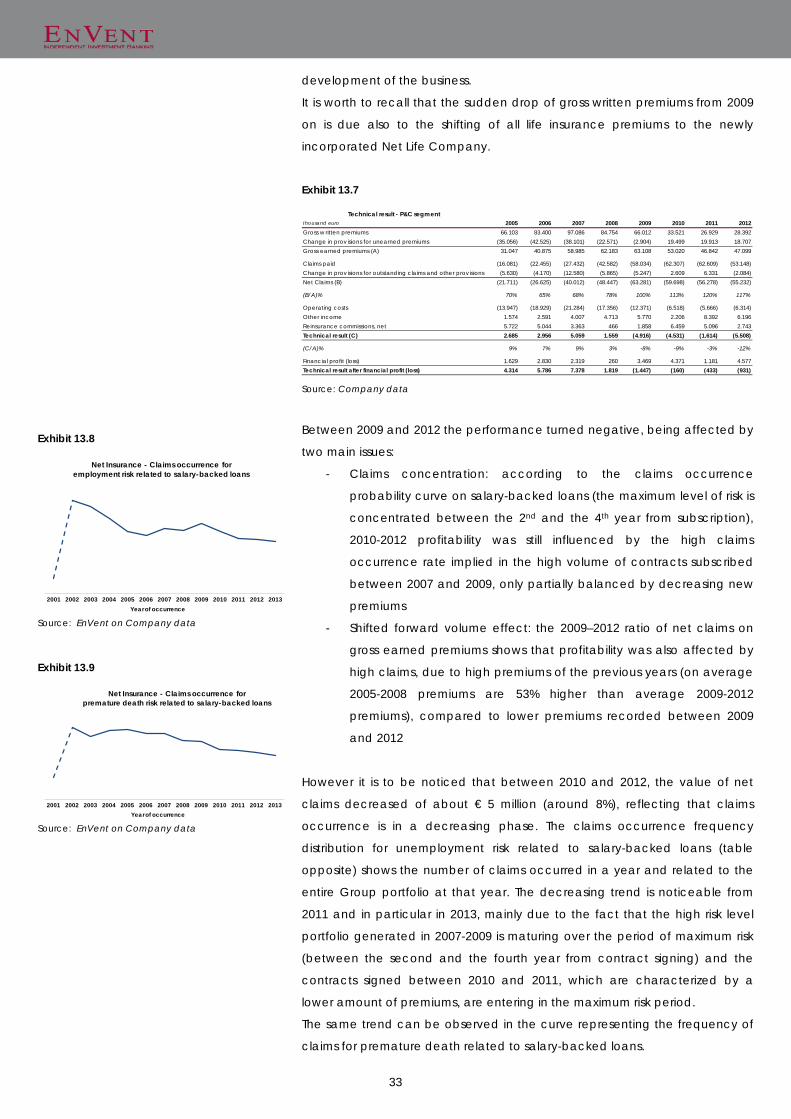
• Probability distribution of claims occurrence Considering that premiums are evenly distributed as revenues during contract
life and that historically, the occurrence of claims is higher in the first half of
the contract life, the consequence is that for each generation the Group has
a loss area between approximately the first and the fifth year from the signing
and a profit area from the sixth until the end, as shown in the table below
(reported as a graphic example and not based on Group figures).
Exhibit 6.1
Distribution of claims occurrence for job loss
The probability of claims occurrence for job loss, observed on historic data, is
concentrated between the second and fourth year from the signing of the
contract.
Exhibit 6.2
Source: EnVent on Company data
The analysis of job loss risk distribution by contract generation shows an
increasing percentage of risk for the 2008 generation, due to changes in
selection policies occurred in 2007. In a favorable market trend,
accompanied also by new comers in the competitive arena, the Group
decided to lower prices and establish less strict requirements for private sector
employees in order to benefit from the momentum. It is to be noted that 2007
has been recorded as the year of maximum economic expansion of the
decade. 2008 and 2009 were the years in which happened the general
Net Insurance - Probability of claims occurrence
Loss area
Profit area
1 2 3 4 5 6 7 8 9 10years from the signing of the contract
Net Insurance - Historical probability of claims occurrence in the credit segment (employment risk)
8
Exhibit 6.4
Source: EnVent on market and Company data Note: Year 2009 base 100
worsening of the economic climate that followed the global financial and
industrial crisis. The increasing business risk has been reflected in the following
3/4 years financials, by the combined effect of an exceptional growth in 2007
and 2008 premiums and the unexpected growth of job loss risk, beginning in
2009.
On the other hand, as shown on the table below, in the 2010 generation the
implied claim probability is lower due to a stricter screening policy and to an
average lower insured capital due the increase of the nominal rate of interest
on issued loans.
Exhibit 6.3
Source: EnVent on Company data
In the last years, considering the worsening of the macroeconomic crisis, the
Group has improved its scoring tools and screening policies aimed to select,
within the private sector, companies with an acceptable risk rate. The key
requirements are:
- Open ended contract
- Company with more than 15 employees
- Companies not characterized by high seasonality and high
employee turnover
- Scoring tool test based on the company financials
Based on the Group scoring tools, the number of private companies that
have obtained an acceptable risk rate represents only the 15% of the panel
(Italian private companies with more than 15 employees).
We have compared the trend of most important macro indicators, such as
the number of dismissals, the number of job losses due to business shutdown,
the number of bankruptcy procedures and the authorized hours for
unemployment compensation earnings in Italy, and Net Insurance key risk
indicators, such as claims paid, net claims and loss ratio trend over 2009-2012
in the P&C segment. As reported in the exhibit 6.4, the correlation between
macro and Net Insurance indicators is low or inverse. Despite the worsening of
job loss risk indicators Net Insurance performance has not been proportionally
affected.
Main factors:
- only the 30% of Net Insurance portfolio is composed by private sector
employees, thus exposed to job loss (see exhibit 7.1)
50
60
70
80
90
100
110
120
130
140
150
2009 2010 2011 2012
Correlation between macro risk indicators and Net Insurance risk trend
Job lossAuthorized hours for unemployment compensation earningsBankruptcy proceduresNet claimsClaims paidLoss ratio
1 2 3 4 5 6 7 8 9 10years from the signing of the contract
2001
2002
2003
2004
2005
2006
2007
2008
2009
2010
Net Insurance - Probability of claims occurrence in the credit segment (employment risk)
Net Insurance - Probability of claims occurrence in the credit segment (employment risk)
9
- the residual risk related to private sector employees has been
mitigated by the implementation of effective ad hoc screening
procedures
The nature of permanent risk mitigating factors reinforces the expectation of
a progressive reduction of claims rate in the short/mid-term.
Exhibit 6.5
Source: Ministry of Labour and Social Policies Note: The job loss trend represented in the exhibit 6.5 is based on the number of dismissals and job loss due to business shutdown, from 2009 to first half 2013.
Distribution of claims occurrence related to life risk Exhibit 6.6
Source: EnVent on Company data
The probability of claims occurrence for death, observed on historic data, is
concentrated between the second and fifth year of the contract.
903.183 949.445 1.025.620 1.164.878 481.688
5,1%
8,0%
13,6%
0%
5%
10%
15%
0
200.000
400.000
600.000
800.000
1.000.000
1.200.000
1.400.000
2009 2010 2011 2012 1H 2013
Job loss in Italy
Total job lossYoY growth % (right)
1 2 3 4 5 6 7 8 9 10years from the signing of the contract
Net Insurance - Historical probability of claims occurrence in the life segment (death risk)
10
Exhibit 6.7
Source: EnVent on Company data
The analysis of death risk distribution for each contract generation shows
basically a similar distribution for each generation. The Group has historically
experienced moral hazard behaviors on the pension-backed loans segment,
that partially explain why the death risk distribution is so stable between the
second and the fifth year from contract signing. In order to reduce moral
hazard behaviors, the Group has strengthened its screening procedures on
pension-backed loans, introducing:
- Compulsory medical certificate presentation
- Compulsory medical examination report (only above a certain
financed capital)
1 2 3 4 5 6 7 8 9 10
2002
2003
2004
2005
2006
2007
2008
2009
2010
Net Insurance - Probability of claims occurrence in the life segment (death risk)
years from the signing of the contract
11
7. BUSINESS MODEL Exhibit 7.1
Source: EnVent on Company data
Exhibit 7.2
Source: EnVent on Company data
Exhibit 7.3
Source: EnVent on Company data
Exhibit 7.4
Source: EnVent on Company data
• Business concept and risk management of a leader
Core business
The Group core business, which is worth 99% of 2012 revenues, is to provide
banks and consumer finance companies (B2B) with the mandatory insurance
coverage on salary/pension-backed loans contracts.
The present portfolio is mainly composed by loans issued to public sector and
government employees (69%), which are characterized by a lower risk rate.
In 2012 salary-backed loans insurance account for about 76% of the total
insured loans (average age of the borrower of about 45), while pension-
backed loans account for 24% (average age of the borrower of about 67).
Pension-backed loans have a higher price structure than salary-backed
loans, due to the higher intrinsic risk, but the average financed amount lower
than the one of salary-backed loans.
Over 65% of insured loans have a maturity date between the 8th and 10th year
of contract, the remaining 30% is almost equally divided between a 4-5 year
maturity and a 6-7 year maturity.
The average amount of insured loans is for the 90% between € 10 and 40
thousand. In particular, the 75% of total insured loans concentrates between
€ 10 and 30 thousand.
Other products
Net Insurance also offers other kinds of P&C and life policies dedicated to
retail customers (B2C):
- Natural events insurance
- A&H - Accident and Health – insurance
- Anti-crisis insurance, that offers pay protection in the cases of job loss,
accident or sickness
- Insurance on loans, in the form of term assurance and multi-risks
policies dedicated to borrowers
- Life insurance, in the form of term assurance
The Group addresses its other insurance products to the general public of
consumers through a network of agents and brokers and through the
channels of web marketing and direct marketing.
Following the Group diversification strategy, in the first half 2013 other
products gross premiums have reached a share of 18% out of total gross
69%
31%
Net Insurance - Distribution of insured salary-backed loans
Salary-backed loans toGovernment and PAemployees
Salary-backed loans toprivate sector employees
70,2% 70,4% 69,7% 75,9%
29,8% 29,6% 30,3% 24,1%
2009 2010 2011 2012
Net Insurance - Distribution of insured loans
Salary-backed loans Pension-backed loans
3% 4% 4% 3%13% 16% 16% 16%16% 16% 12% 13%
68% 64% 69% 68%
2009 2010 2011 2012
Net Insurance - Number of contracts per maturity date
[2-3] [4-5] [6-7] [8-10]years
0
20.000
40.000
60.000
80.000
100.000
120.000
140.000
160.000
180.000
10-40 40-80 80-120 >120
Net Insurance - Distribution of policies per insured loans
Salary-backed loansPension-backed loans
€ k € k€ k€ k
12
premiums collected, while in 2012 were almost nil.
The impressive growth of the non-core business has been mainly driven by
natural events insurance products related to the agricultural production.
In particular, the Group offers protection against the damages of hail.
Based on recent ANIA data (ANIA is the association which represents the
Italian insurance companies), gross written premiums of the whole hail risk
insurance segment are in the region of over € 350 million. Net Insurance, first
half 2013 results, in this segment, are 2% of the total market.
The premiums collected in the natural events insurance products have been
recorded through over 4.000 contracts, agreed with about 35 agriculture
consortiums. About half of the premiums collected are concentrated in the
northern regions of Italy (Veneto, Trentino Alto Adige, Emilia Romagna).
The distribution of this business is assigned to one broker.
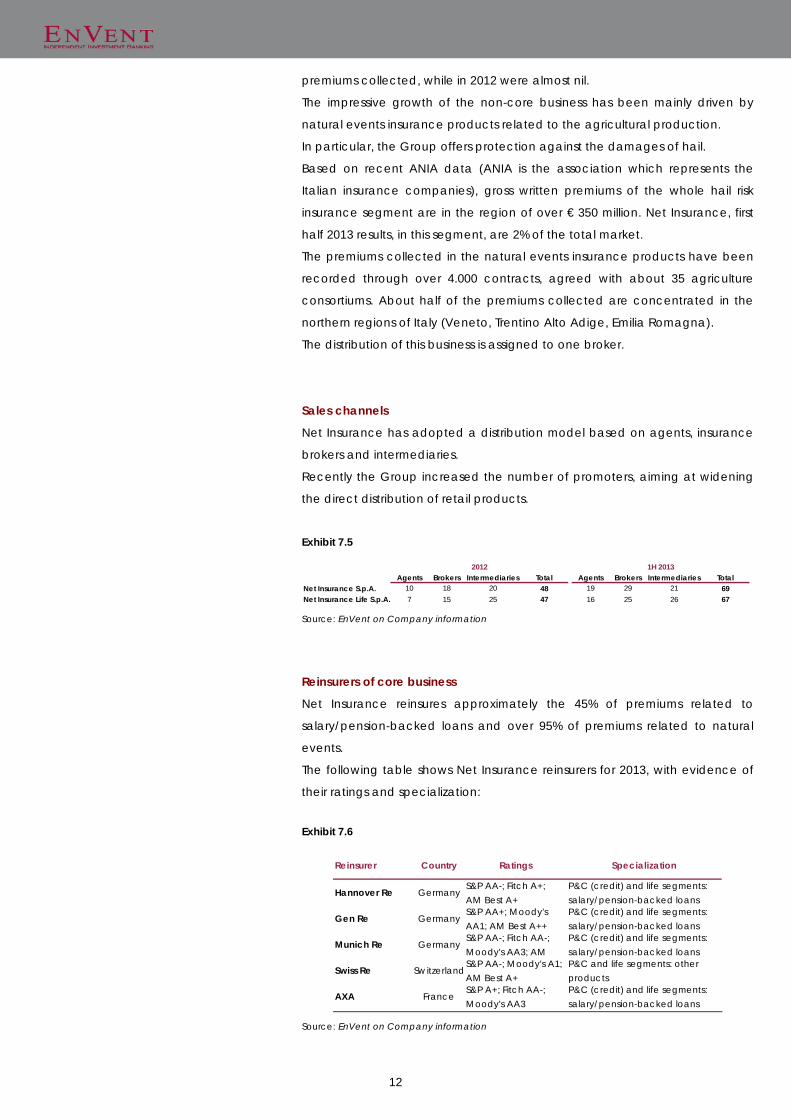
Sales channels
Net Insurance has adopted a distribution model based on agents, insurance
brokers and intermediaries.
Recently the Group increased the number of promoters, aiming at widening
the direct distribution of retail products.
Exhibit 7.5
Source: EnVent on Company information
Reinsurers of core business
Net Insurance reinsures approximately the 45% of premiums related to
salary/pension-backed loans and over 95% of premiums related to natural
events.
The following table shows Net Insurance reinsurers for 2013, with evidence of
Average financing in the salary/pension-backed loans industry
Average financingLoans to Government and PA employeesLoans to Private sector employeesLoans to Retirees
euro thousand
39% 38%
34%20%
27%42%
2008 2012
Change in loans distribution by borrower
Government and PA employeesPrivate sector employeesRetirees
16
respect of the regulations on transparency of the information to provide to
customers and some organizational aspects of financial intermediaries
operating in the salary/pension backed loans.
The vigilance action led to the exit of several lenders. 2008 major players like
Idea Finanziaria (a subsidiary of Eudea Holding, Barclays Bank Group), Delta,
Ktesios, plus other minor, have been sanctioned or put under compulsory
administration and soon substituted by emerging players belonging to major
Italian banks networks. This was the beginning of the selection and
reorganization process of the players operating in the salary/pension-backed
loans industry.
The present outcome of this process is that a marketplace traditionally
occupied by small independent and unregulated companies has been
entered by generalist large banks networks that now dominate the
marketplace.
In 2010 the reform of financial distribution networks (Legislative Decree
141/2010), which aimed at regulating the market and promoting responsible
lending, caused the exit of financial intermediaries which no longer had the
requirements to face the increasing competition and the progressive
entrance of major financial institutions and banking groups.
The biannual analyses of Assofin data (Assofin is the association of Italian
major players in the consumer credit sector) on salary/pension-backed loans
lenders show that in 2008 the market was concentrated in two main players
(Ubi Banca and Barclays Bank) which accounted for the 42% of the market,
with lending volumes much higher than other players (over € 1 billion of the
first two players versus € 200-500 million of other top ten players). It is possible
to observe that in 2012 the salary/pension-backed loans market is more
competitive, since there are no predominant players, and the top ten
players’ lending volumes, which account for about 80% of total market, are in
the range of € 200-500 million.
Moreover, some banking groups which accounted for the major share of the
market and several smaller financial intermediaries which were present in
2008, today are no longer present among the top ten players. While major
banking groups such as Neos Finance, BNL Group, Santander Consumer Bank
and Compass progressively increased their shares from 2008 to 2012.
In the first half of 2013 the first ten players (Intesa Sanpaolo and Neos Finance,
IBL Banca, Compass, Deutsche Bank Group, BNL Group, Santander Consumer
Bank, Prestitalia, Findomestic Group and Fiditalia) account for the 80% of the
market and their lending volumes are in the region of € 400-100 million.
17
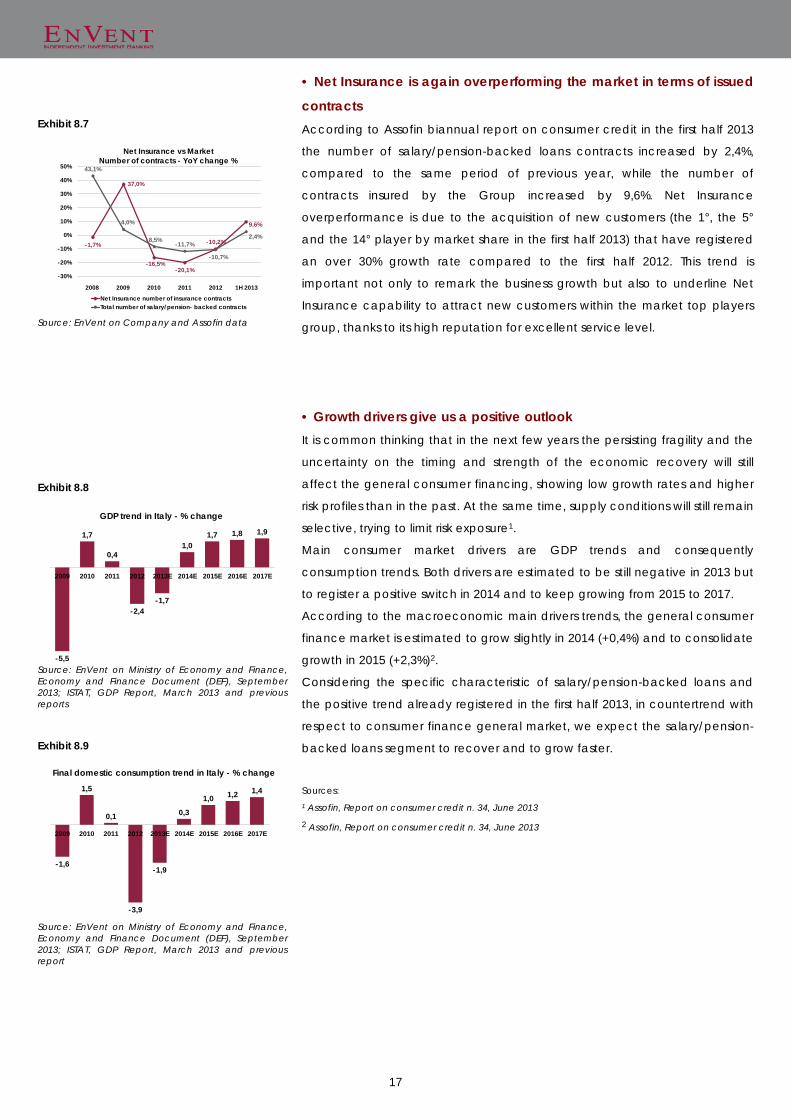
Exhibit 8.7
Source: EnVent on Company and Assofin data
Exhibit 8.8
Source: EnVent on Ministry of Economy and Finance, Economy and Finance Document (DEF), September 2013; ISTAT, GDP Report, March 2013 and previous reports Exhibit 8.9
Source: EnVent on Ministry of Economy and Finance, Economy and Finance Document (DEF), September 2013; ISTAT, GDP Report, March 2013 and previous report
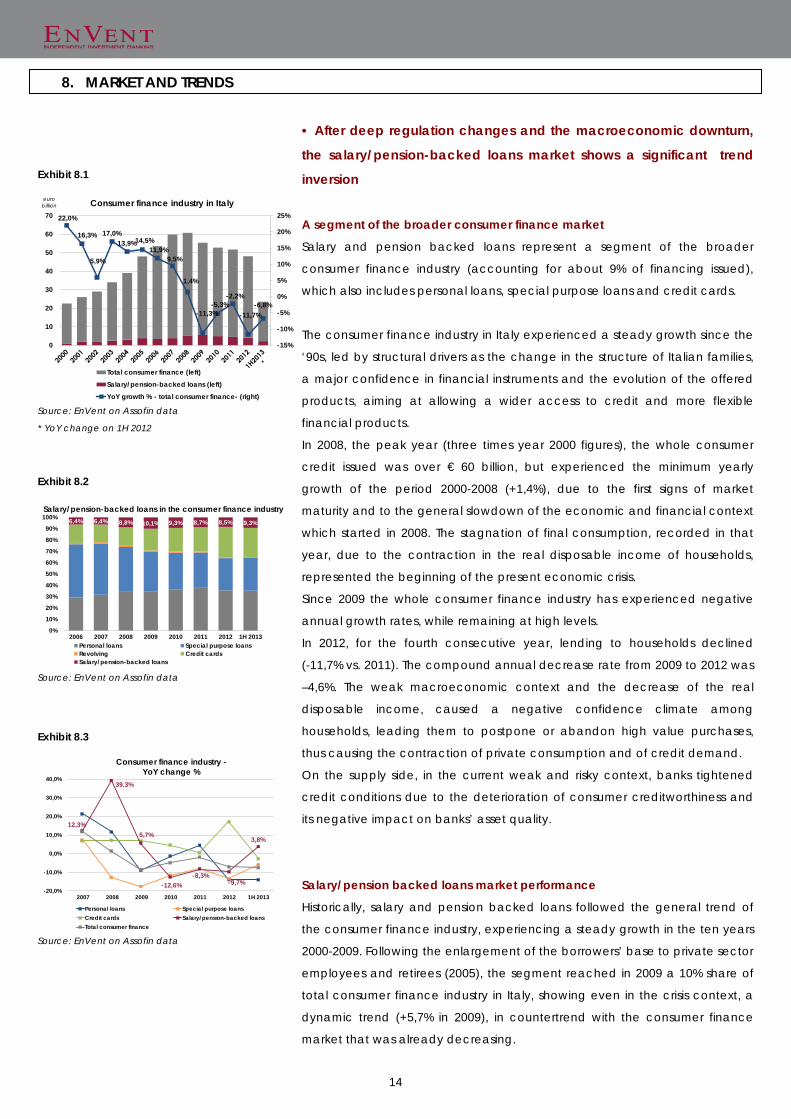
• Net Insurance is again overperforming the market in terms of issued
contracts According to Assofin biannual report on consumer credit in the first half 2013
the number of salary/pension-backed loans contracts increased by 2,4%,
compared to the same period of previous year, while the number of
contracts insured by the Group increased by 9,6%. Net Insurance
overperformance is due to the acquisition of new customers (the 1°, the 5°
and the 14° player by market share in the first half 2013) that have registered
an over 30% growth rate compared to the first half 2012. This trend is
important not only to remark the business growth but also to underline Net
Insurance capability to attract new customers within the market top players
group, thanks to its high reputation for excellent service level.
• Growth drivers give us a positive outlook It is common thinking that in the next few years the persisting fragility and the
uncertainty on the timing and strength of the economic recovery will still
affect the general consumer financing, showing low growth rates and higher
risk profiles than in the past. At the same time, supply conditions will still remain
selective, trying to limit risk exposure1.
Main consumer market drivers are GDP trends and consequently
consumption trends. Both drivers are estimated to be still negative in 2013 but
to register a positive switch in 2014 and to keep growing from 2015 to 2017.
According to the macroeconomic main drivers trends, the general consumer
finance market is estimated to grow slightly in 2014 (+0,4%) and to consolidate
growth in 2015 (+2,3%)2.
Considering the specific characteristic of salary/pension-backed loans and
the positive trend already registered in the first half 2013, in countertrend with
respect to consumer finance general market, we expect the salary/pension-
backed loans segment to recover and to grow faster.
Sources: 1 Assofin, Report on consumer credit n. 34, June 2013
2 Assofin, Report on consumer credit n. 34, June 2013
-1,7%
37,0%
-16,5%-20,1%
-10,2%
9,6%
43,1%
4,0%
-8,5%-11,7%
-10,7%
2,4%
-30%
-20%
-10%
0%
10%
20%
30%
40%
50%
Net Insurance vs MarketNumber of contracts - YoY change %
Net Insurance number of insurance contractsTotal number of salary/pension- backed contracts
2008 2009 2010 2011 2012 1H 2013
-5,5
1,7
0,4
-2,4-1,7
1,01,7 1,8 1,9
2009 2010 2011 2012 2013E 2014E 2015E 2016E 2017E
GDP trend in Italy - % change
-1,6
1,5
0,1
-3,9
-1,9
0,3
1,0 1,2 1,4
2009 2010 2011 2012 2013E 2014E 2015E 2016E 2017E
Final domestic consumption trend in Italy - % change
18
9. COMPETITION Exhibit 9.1
Source: EnVent on Company and Assofin data Exhibit 9.2
Source: EnVent confidential industry research data, 2008 Exhibit 9.3
Source: EnVent confidential industry research data, 2008 Exhibit 9.4
Source: EnVent on confidential industry research data, 2008
• The leader of its business segment Net Insurance is the number one in Italy in the credit protection of
salary/pension-backed loans, both in the P&C and life segments.
Based on the number of insurance contracts issued, the Group shows a
market share of approximately 30%, stable over the last five years.
Recently large insurance companies have made an attempt to enter the
pension-backed loans segment, with an initial low price strategy.
A picture of competition dynamics between 2008 and 2012
In the last five years the competitive scenario has been very dynamic, being
characterized by:
- exit of Axeria, HDI and Carige Assicurazioni, that in 2008 had a
market share respectively of 20%, 10% and 10% in the salary/pension
backed loans market. In particular, Axeria was the leader in the
pension-backed loans market with a market share of 50%
- reduced importance of some key players such as Vittoria
Assicurazioni, which in 2008 had a market share of about 15%,
decreased in 2012 to approximately 5%
- entrance of new comers, mainly Cardif and MetLife that in 2012 had
quickly reached respectively a 20% and 10% of market share in the
salary/pension backed loans market
Despite the highly dynamic competitive field the Group has maintained a
strong and stable market share leadership, over the last five years, with limited
fluctuations. Present positions by segment, per gross premiums collected, are:
60% market share in the insurance of salary-backed loans to private sector
employees, 40% market share in the insurance of salary-backed loans to
public sector employees and 25% in the pension-backed loans insurance.
By analyzing the competition dynamics, we can say that in the last four years
Net Insurance performance has been affected mainly by the general market
slowdown and only partially by the increasing competitive pressure.
According to a research institute, in 2008 in the credit protection business of
salary/pension-backed loans there were six main players. Among them Net
Insurance was the leading company with a market share in the region of 30%
and two new entrants, Axeria and Nationale Suisse, which quickly showed
good performances and market shares.
In the pension-backed loans insurance sub-segment an increasing
competition could be observed: new players as Axeria, Nationale Suisse and
Net Insurance (with a 5% market share in 2008, which was its first year of
activity in this segment) gained significant market shares at the expense of
29,0% 38,1% 34,8% 31,5% 31,7% 30,7%
2008 2009 2010 2011 2012 1H 2013
Market Share - number of contracts
Net Insurance Other players
Net Insurance
Axeria
Vittoria Assicurazioni
HDI Assicurazioni
Carige Assicurazioni
Nationale Suisse
-30%
-25%
-20%
-15%
-10%
-5%
0%
5%
10%
15%
20%
-5% 0% 5% 10% 15% 20% 25% 30% 35% 40%
YoY
grow
th %
Market share
Salary/pension-backed loans insurance industry in 2008
Net Insurance
Axeria
Vittoria Assicurazioni
HDI Assicurazioni
Carige Assicurazioni
Nationale Suisse
-70%
-60%
-50%
-40%
-30%
-20%
-10%
0%
10%
20%
-10% 0% 10% 20% 30% 40% 50% 60%
YoY
grow
th %
Market share
Pension-backed loans insurance industry in 2008
Net InsuranceVittoria Assicurazioni
HDI Assicurazioni
Carige Assicurazioni
Sasa
Liguria Assicurazioni
-40%
-30%
-20%
-10%
0%
10%
20%
30%
40%
-10% 0% 10% 20% 30% 40% 50% 60% 70%
YoY
grow
th %
Market share
Salary-backed loans insurance industry in 2008
19
Exhibit 9.5
Source: EnVent on confidential industry research data, 2012 Exhibit 9.6
Source: EnVent confidential industry research data, 2012 Exhibit 9.7
Source: EnVent confidential industry research data, 2012 Exhibit 9.8
Source: EnVent on confidential industry research data, 2012
the historical players.
In the salary-backed loans insurance sub-segment a higher concentration
could be observed. Net Insurance, Carige Assicurazioni and HDI Assicurazioni
accounted for about the 85% of the whole segment.
According to several market commentaries3, from 2009 to 2012 the major
players in the credit insurance of salary-backed loans segment had been Net
Insurance, with an average market share between 40%-50, Vittoria
Assicurazioni (between 20% and 30%) and Cattolica Assicurazioni (above 5%).
In the pension-backed loans segment, the major players have been Net
Insurance and Nationale Suisse with an approximate average market share of
respectively 30% and 25% since 2009. In 2010 and 2011 the followers were
Vittoria Assicurazioni e Cattolica with respectively an approximate market
share of 20% and 10%.
New players are making an impact in the market
In 2012, according to a research institute, Net Insurance had still an
undisputed leadership in the whole market. Among the first six players, there
were Cardif (BNP Paribas Group) and MetLife.
Cardif is a BNP Paribas company specialized in the credit protection through
retail/bankassurance, digital and partnerships channels.
MetLife is the Italian branch of a multinational group specialized in insurance
products related to savings and employee benefits.
In 2012 in the sub-segment of salary-backed loans to public sector
employees, despite Net Insurance confirmed its leadership position, its main
competitors changed. Net Insurance follower is now Cardif, with
approximately € 10 million of collected premiums. Other top players showed
similar performances: CF Assicurazioni, an Italian private company specialized
in the credit protection for individuals (about € 6 million), HDI (approximately €
5 million) and Intesasanpaolo Assicura (approximately € 5 million).
For the loans to private sector employees sub-segment, a huge gap between
Net Insurance (the leader with about € 27 million of collected premiums) and
the followers can be observed. The second player is CF Assicurazioni with
approximately € 6 million of collected premiums, followed by IntesaSanpaolo