TABLE OF CONTENTS P Executive Summary 1 Goals and Requirements 8 Methodology 10 Analysis 12 Appendices 13 APPENDICES Appendix I Statewide Scores Appendix II Statewide Scores by Element Type Appendix III District Scores by Element Type Appendix IV Total Scores by Road Type Appendix V Activity Spending Appendix VI Inspection Features
Transcript
TABLE OF CONTENTS P
Executive Summary 1
Goals and Requirements 8
Methodology 10
Analysis 12
Appendices 13
APPENDICES
Appendix I Statewide Scores
Appendix II Statewide Scores by Element Type
Appendix III District Scores by Element Type
Appendix IV Total Scores by Road Type
Appendix V Activity Spending
Appendix VI Inspection Features
2014 Maintenance Rating Program Report
Kentucky Transportation Cabinet Page 1
2014 MAINTENANCE RATING PROGRAM REPORT
EXECUTIVE SUMMARY
Introduction The Kentucky Transportation Cabinet (KYTC) has surveyed the state’s roadside conditions in order to estimate the needs for routine maintenance. The 2014 Maintenance Rating Program (MRP) inspections were completed statewide during summer 2013. The purpose of this report is to provide the results of the inspections and assess the current condition of the highway infrastructure maintenance activities. The report is broken into two parts – a statewide report used for higher level analysis; and individual district reports used on a local level for management decisions. Background The KYTC Maintenance Rating Program (MRP) is a systematic measurement process that uses annual performance measurements of highway infrastructure data to support planning and management decisions regarding maintenance activities and resources. Data collected from the MRP is used in conjunction with the cabinet's Operations Management System (OMS) to calculate the maintenance budget for each of the twelve highway districts. Target for Sustained Performance The target performance level score was set at 80 (service level B-good) for each highway district and for the statewide score for all highways. The target serves as a benchmark for districts to help identify best practices among high performers and opportunities for improvement. The statewide target may be increased in the future as the districts reach higher levels of performance. It is generally recognized that the level of service provided on the four road types for all features will not be the same. Interstate highways with higher traffic volumes and higher speed limits need to be maintained at a higher level of service than Rural Secondary roads. It is the responsibility of each district to set target values for every feature for each of the four road types to achieve the target score of 80.
2014 Maintenance Rating Program Report
Kentucky Transportation Cabinet Page 2
Results Table 1: Statewide Maintenance Levels of Service
70.0
75.0
80.0
85.0
90.0
95.0
100.0
2009 2010 2011 2012 2013 2014
Statewide Maintenance Rating
Program Score
Figure 1: StatewideOverall Maintenance Rating Program scores haveremained relatively unchanged during the past six years.
All Interstate National Highway System State Primary and Secondary Rural Secondary
FY 2014 KYTC MAINTENANCE STATEWIDE SCORES
CLASSIFICATION SCORE GRADE COMMENTS Interstates 91.9 A Improved
Strength - A feature scored at 90 or higher across the district.
Within Acceptable Limits - A feature scored between 70 and 90 points across the district.
Failing - A feature scored below 70 across the district.
Features did not have a sample size large enough to produce statistically valid data
*Some values may appear to be shaded incorrectly due to rounding
TABLE 2 - DISTRICT MAINTENANCE FEATURE SCORES All State Roads - Fiscal Year 2014
2014 Maintenance Rating Program Report
Kentucky Transportation Cabinet Page 7
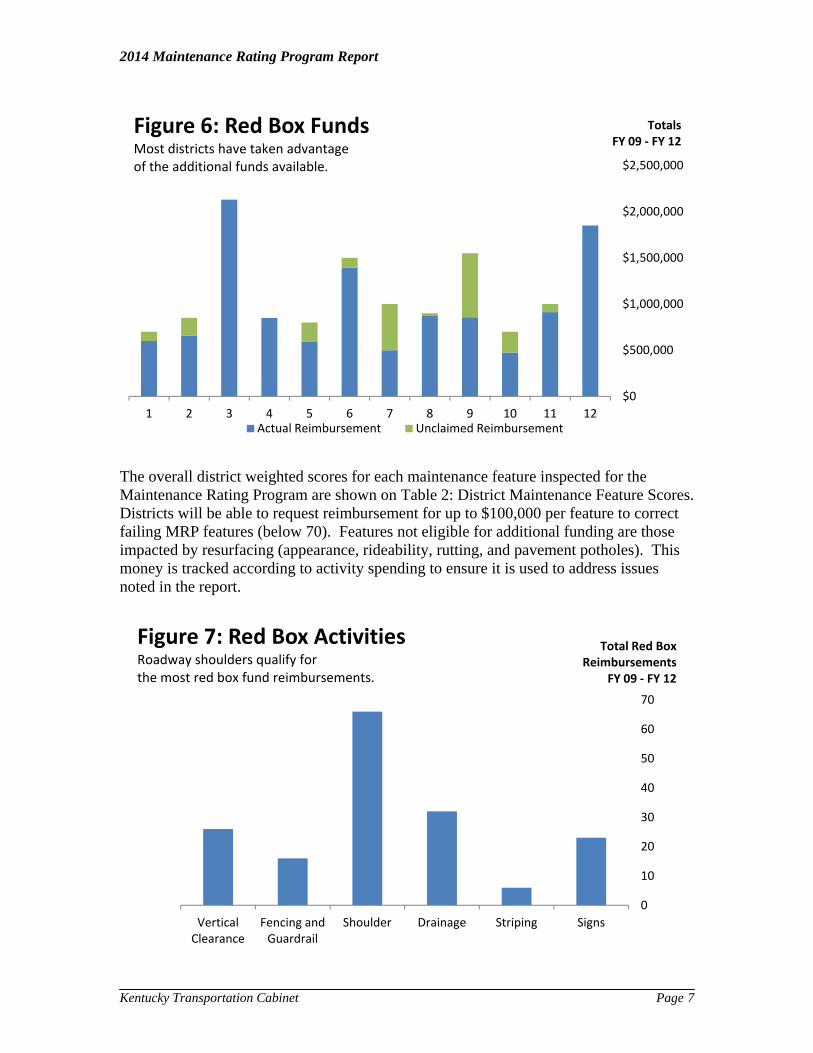
The overall district weighted scores for each maintenance feature inspected for the Maintenance Rating Program are shown on Table 2: District Maintenance Feature Scores. Districts will be able to request reimbursement for up to $100,000 per feature to correct failing MRP features (below 70). Features not eligible for additional funding are those impacted by resurfacing (appearance, rideability, rutting, and pavement potholes). This money is tracked according to activity spending to ensure it is used to address issues noted in the report.
$0
$500,000
$1,000,000
$1,500,000
$2,000,000
$2,500,000
1 2 3 4 5 6 7 8 9 10 11 12
Totals FY 09 ‐ FY 12
Figure 6: Red Box FundsMost districts have taken advantage of the additional funds available.
Actual Reimbursement Unclaimed Reimbursement
0
10
20
30
40
50
60
70
Vertical Clearance
Fencing and Guardrail
Shoulder Drainage Striping Signs
Total Red Box Reimbursements
FY 09 ‐ FY 12
Figure 7: Red Box ActivitiesRoadway shoulders qualify for the most red box fund reimbursements.
2014 Maintenance Rating Program Report
Kentucky Transportation Cabinet Page 8
A. GOALS AND REQUIREMENTS Assess the maintenance activities of the Kentucky Transportation Cabinet. The MRP allows the cabinet to assess the effectiveness of infrastructure maintenance activities and compare the outcomes to customer expectations. Make informed policy and management decisions. The results of the MRP provide guidance for investment decisions and resource allocation. In addition, the MRP findings also offer a means to assess effectiveness of prior decisions and resource allocations. MRP findings also reveal where additional resources are needed to bring performance to targeted levels. The MRP supports the cabinet goal of delivering a consistent level of customer service across the state by providing the necessary data to identify differences in performance across districts, road types, and roadway features. The results of the MRP demonstrate how each district is performing in comparison to targeted levels in specific categories. The MRP can thereby help district management determine how district resources should be allocated to achieve a consistent level of service. The MRP can also help district and cabinet management formulate the budget request necessary to achieve targeted levels of performance. Similarly, the MRP communicates targeted performance levels, along with the policy and budget decisions that drive them, to policy makers as well as citizens. The MRP thus aids the Commonwealth's Executive and Legislative branches in determining acceptable levels of performance for their constituents. The MRP is designed to support "management by fact" at all levels and provides a means to identify best practices among the districts by identifying districts exceeding target levels. These practices can then be shared with districts that may be falling short of their goals. Promote alignment with the Transportation Cabinet's Strategic Plan. The Maintenance Rating Program is vital to two of the cabinet's four strategic goals. These goals are as follows: Strategic Goal Number 1: "Ensure Mobility & Access" to preserve the transportation system infrastructure. Strategic Goal Number 3: "Continually Improve Organizational Performance" of Operational and Support Processes. The MRP is a direct assessment tool for maintenance activities related to infrastructure preservation, as defined in Strategic Goal Number 1. The MRP is also the principal
2014 Maintenance Rating Program Report
Kentucky Transportation Cabinet Page 9
performance measure for assessing maintenance process improvement, thereby facilitating Strategic Goal Number 3. Provide Data for GASB-34. MRP data can be used to satisfy the Governmental Accounting Standards Board Statement 34 (GASB-34) condition of highway assets requirement. This requirement obligates state governments to report all capital assets, including infrastructure, in a statement of net assets and to report depreciation expense associated with these assets. Infrastructure assets are not required to be depreciated if (1) the government manages the assets using an asset management system that has certain defined characteristics and (2) the government can document that the assets are being preserved approximately at (or above) a condition level established and disclosed by the government. KYTC's Operations Management System (OMS) satisfies the first requirement listed above. The MRP fulfills the second requirement.
2014 Maintenance Rating Program Report
Kentucky Transportation Cabinet Page 10
B. METHODOLOGY Sampling and Data Collection Data is collected during one wave each year, June through October. For this wave, between 300 and 400 roadway segments are randomly selected in each district among the following four road types: Interstates - Those routes designated as part of the Eisenhower National System of Interstate and Defense Highways. These include three north-south interstates (I-65, I-71, I-75); two east-west interstates (I-24 and I-64); and smaller loop routes in Louisville Metro and Northern Kentucky. Other NHS - Non-interstate routes that are part of the National Highway System. This category includes most of the state's parkways and major US routes. Some state routes (roads designated with a "KY" prefix) are also components of this system. Other SP/Sec - State Primary and Secondary roads include all "KY" routes which do not carry an NHS or Rural Secondary designation. Rural Secondary – The system of roads in Kentucky that are usually considered “farm to market” roads. Each roadway segment is 500 feet in length and includes all adjacent right-of-way. Two-person teams from each district inspect the selected roadway segments and complete the MRP inspection for each segment. The KYTC GIS department developed a mobile GIS application in 2010. This application allowed inspections to be completed with a Mobile GPS unit. The mobile application gave Central Office access to a SDE layer that was updated daily with inspection results. All districts have utilized the device and software since the 2011 data collection. The MRP collection splits performance measures into five main categories: roadway general, pavement, shoulders, drainage, and traffic. The following are some of the inspected features: general aesthetics, visual obstructions, potholes, rutting, drop off, ditches, and guide sign faces. These measures are then used in the calculation of statewide and district MRP scores.
2014 Maintenance Rating Program Report
Kentucky Transportation Cabinet Page 11
Quality Assurance The Field Data Collection Manual was revised in May 2006 to reflect the recording changes for some features. The training manual contains an introduction of the Maintenance Rating Program and its purposes, as well as definitions and guidelines for recording measurements and observations on the inspection form. Additionally, the manual establishes safety procedures for both the inspection team and the public. This manual along with a training power point presentation is available on the website: http://transportation.ky.gov/maintenance/ Statewide training was available prior to the summer 2009 data collection to ensure new employees are properly trained and to address any additional questions regarding the program. All districts requested and received training with the exception of districts three and eight during this time. District three requested and received training prior to the summer 2010 data collection. All districts were trained for mobile device collection in 2011 and additional training was offered in 2012. A quality assurance procedure was established to assess the accuracy of MRP data collection, and indirectly, the consistency of training. Two teams from the central office in Frankfort re-inspected approximately 10% of the segments surveyed in each district. The results of the quality assurance inspections will be compared to that of the original inspections and will be used to determine additional needs for training of the field data collection teams. A committee of stakeholders, including Maintenance and Traffic Engineers in the MRP will periodically meet to review the data collection procedures, features and weight factors to make further improvements to align the MRP with the Strategic Goals of the cabinet.
2014 Maintenance Rating Program Report
Kentucky Transportation Cabinet Page 12
C. ANALYSIS The inspection results for each of the sample sets were analyzed using the Operations Management System MRP module. Most of the information reported is statistical summaries of the data. Rideability indices were provided by the Pavement Management Branch within the Division of Maintenance. Each road type score was weighted according to the proportion of centerline miles for each of the four road types to produce district and statewide road type totals and a state total score. Spending data was taken from OMS and EMARS according to fiscal year. Spending data from the previous fiscal year is paired with MRP data collected during the current fiscal year. Each of the roadway features measured was evaluated and given an "importance weight" with respect to the other features so that the sum of all weights is 100. These importance weights were determined through a consensus of approximately 100 key KYTC managers and staff. They are based on the customer requirements identified and prioritized in the 1998 Voice of the Customer research conducted by the cabinet. These requirements include safety, protection of the infrastructure, comfort and convenience, and aesthetics. Importance weights were revised in 2011 to reflect results of the 2010 Maintenance Customer Survey performed by KTC. The targeted confidence levels and intervals are based on the size of the samples. The target confidence interval for the smallest sample, road type by district, is set as 90% +/- 10%. District totals and road type totals have a confidence interval of 90% +/- 5%, while the statewide total target confidence interval is set as 99% +/- 3%. For a feature where the number of occurrences is less than nineteen in the sample segments, no data is reported, as the data may lack statistical validity. If no data was present for a particular feature in a district, the scores were adjusted for missing values so that the potential value remained 100. This allows for calculation of overall district and road type scores in the absence of specific feature data.
2014 Maintenance Rating Program Report
Kentucky Transportation Cabinet
APPENDIX I
Statewide Scores
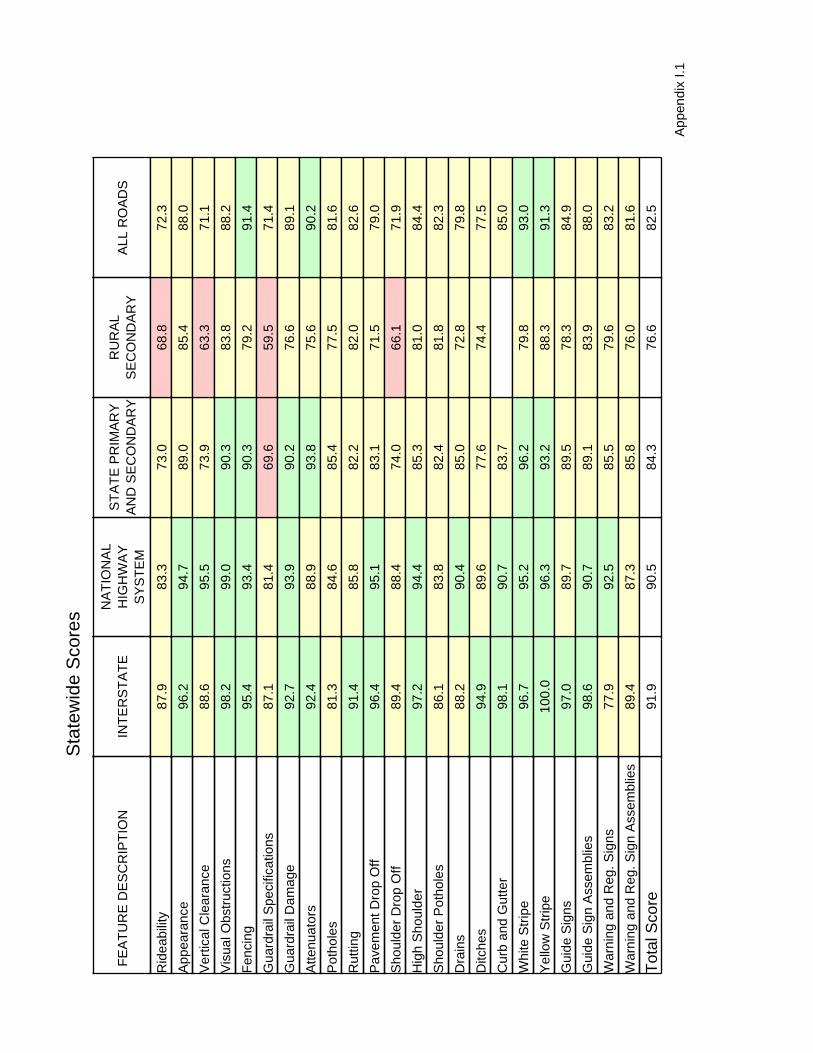
Appendix I charts show the MRP score by road type for each feature measured. Boxes are color coded according to scores:
Green – a strength, score at 90 or higher Yellow – within acceptable limits, score between 70 and 90 Red – failing, score below 70 In some cases, a score of "N/A" is listed. In these instances, there were not enough occurrences in order to achieve the desired confidence level. This may be due to the absence of a particular feature in the sample segments (such as guardrail, curb, etc.). It also may indicate that inspection crews were unable to measure certain items due to safety concerns (as with striping on interstates).
FE
AT
UR
E D
ES
CR
IPT
ION
Sta
tew
ide
Sco
res
INT
ER
ST
AT
EN
AT
ION
AL
HIG
HW
AY
SY
ST
EM
ST
AT
E P
RIM
AR
YA
ND
SE
CO
ND
AR
YR
UR
AL
SE
CO
ND
AR
YA
LL R
OA
DS
Rid
eabi
lity
87.9
83.3
73.0
68.8
72.3
App
eara
nce
96.2
94.7
89.0
85.4
88.0
Ver
tical
Cle
aran
ce88
.695
.573
.963
.371
.1
Vis
ual O
bstr
uctio
ns98
.299
.090
.383
.888
.2
Fen
cing
95.4
93.4
90.3
79.2
91.4
Gua
rdra
il S
peci
ficat
ions
87.1
81.4
69.6
59.5
71.4
Gua
rdra
il D
amag
e92
.793
.990
.276
.689
.1
Atte
nuat
ors
92.4
88.9
93.8
75.6
90.2
Pot
hole
s81
.384
.685
.477
.581
.6
Rut
ting
91.4
85.8
82.2
82.0
82.6
Pav
emen
t Dro
p O
ff96
.495
.183
.171
.579
.0
Sho
ulde
r D
rop
Off
89.4
88.4
74.0
66.1
71.9
Hig
h S
houl
der
97.2
94.4
85.3
81.0
84.4
Sho
ulde
r P
otho
les
86.1
83.8
82.4
81.8
82.3
Dra
ins
88.2
90.4
85.0
72.8
79.8
Ditc
hes
94.9
89.6
77.6
74.4
77.5
Cur
b an
d G
utte
r98
.190
.783
.785
.0
Whi
te S
trip
e96
.795
.296
.279
.893
.0
Yel
low
Str
ipe
100.
096
.393
.288
.391
.3
Gui
de S
igns
97.0
89.7
89.5
78.3
84.9
Gui
de S
ign
Ass
embl
ies
98.6
90.7
89.1
83.9
88.0
War
ning
and
Reg
. Sig
ns77
.992
.585
.579
.683
.2
War
ning
and
Reg
. Sig
n A
ssem
blie
s89
.487
.385
.876
.081
.6
Tot
al S
core
91.9
90.5
84.3
76.6
82.5
1A
ppen
dix
I.
FE
AT
UR
E D
ES
CR
IPT
ION
Dis
tric
t One
Sco
res
INT
ER
ST
AT
EN
AT
ION
AL
HIG
HW
AY
SY
ST
EM
ST
AT
E P
RIM
AR
YA
ND
SE
CO
ND
AR
YR
UR
AL
SE
CO
ND
AR
YA
LL R
OA
DS
Rid
eabi
lity
87.7
84.1
74.7
72.6
74.6
App
eara
nce
100.
098
.795
.189
.292
.5
Ver
tical
Cle
aran
ce41
.982
.379
.466
.772
.2
Vis
ual O
bstr
uctio
ns97
.796
.298
.095
.196
.4
Fen
cing
73.2
92.3
89.5
85.5
Gua
rdra
il S
peci
ficat
ions
91.7
75.1
Gua
rdra
il D
amag
e10
0.0
98.9
Atte
nuat
ors
96.7
Pot
hole
s82
.610
0.0
97.6
90.2
93.6
Rut
ting
55.8
54.4
61.8
68.6
64.6
Pav
emen
t Dro
p O
ff74
.491
.170
.661
.867
.5
Sho
ulde
r D
rop
Off
69.8
74.7
67.6
58.8
63.7
Hig
h S
houl
der
100.
097
.592
.291
.292
.2
Sho
ulde
r P
otho
les
94.2
81.0
80.4
95.1
88.2
Dra
ins
62.5
92.9
86.8
87.1
86.7
Ditc
hes
100.
095
.991
.489
.891
.1
Cur
b an
d G
utte
r
Whi
te S
trip
e10
0.0
100.
010
0.0
100.
0
Yel
low
Str
ipe
100.
010
0.0
98.0
94.9
96.6
Gui
de S
igns
86.2
97.6
88.1
66.7
77.9
Gui
de S
ign
Ass
embl
ies
100.
081
.280
.3
War
ning
and
Reg
. Sig
ns97
.797
.284
.290
.3
War
ning
and
Reg
. Sig
n A
ssem
blie
s10
0.0
86.1
Tot
al S
core
82.6
91.3
85.4
80.2
83.4
2A
ppen
dix
I.
FE
AT
UR
E D
ES
CR
IPT
ION
Dis
tric
t Tw
o S
core
s
INT
ER
ST
AT
EN
AT
ION
AL
HIG
HW
AY
SY
ST
EM
ST
AT
E P
RIM
AR
YA
ND
SE
CO
ND
AR
YR
UR
AL
SE
CO
ND
AR
YA
LL R
OA
DS
Rid
eabi
lity
86.5
81.5
70.6
69.5
71.5
App
eara
nce
92.2
94.5
89.2
93.4
91.5
Ver
tical
Cle
aran
ce98
.098
.996
.885
.892
.6
Vis
ual O
bstr
uctio
ns98
.010
0.0
97.8
95.3
97.0
Fen
cing
90.0
95.7
96.9
Gua
rdra
il S
peci
ficat
ions
71.0
86.5
73.6
Gua
rdra
il D
amag
e96
.896
.297
.7
Atte
nuat
ors
100.
087
.993
.2
Pot
hole
s41
.275
.386
.683
.583
.5
Rut
ting
98.0
100.
090
.393
.492
.6
Pav
emen
t Dro
p O
ff98
.093
.496
.886
.892
.4
Sho
ulde
r D
rop
Off
84.3
89.0
79.6
64.2
74.4
Hig
h S
houl
der
100.
097
.892
.594
.393
.9
Sho
ulde
r P
otho
les
70.6
86.3
86.6
90.6
87.9
Dra
ins
91.1
86.7
73.0
50.0
65.4
Ditc
hes
97.9
84.1
60.5
55.9
61.5
Cur
b an
d G
utte
r
Whi
te S
trip
e10
0.0
100.
010
0.0
100.
0
Yel
low
Str
ipe
100.
010
0.0
100.
099
.099
.6
Gui
de S
igns
86.7
85.7
89.2
87.3
Gui
de S
ign
Ass
embl
ies
76.9
89.2
89.5
88.1
War
ning
and
Reg
. Sig
ns10
0.0
91.7
87.1
90.6
War
ning
and
Reg
. Sig
n A
ssem
blie
s68
.082
.957
.170
.9
Tot
al S
core
89.6
89.8
86.5
80.7
84.7
3A
ppen
dix
I.
FE
AT
UR
E D
ES
CR
IPT
ION
Dis
tric
t Thr
ee S
core
s
INT
ER
ST
AT
EN
AT
ION
AL
HIG
HW
AY
SY
ST
EM
ST
AT
E P
RIM
AR
YA
ND
SE
CO
ND
AR
YR
UR
AL
SE
CO
ND
AR
YA
LL R
OA
DS
Rid
eabi
lity
88.8
86.4
76.2
73.0
75.4
App
eara
nce
96.4
98.5
88.2
83.6
86.6
Ver
tical
Cle
aran
ce10
0.0
100.
074
.564
.471
.4
Vis
ual O
bstr
uctio
ns10
0.0
100.
072
.659
.668
.1
Fen
cing
100.
076
.787
.4
Gua
rdra
il S
peci
ficat
ions
96.6
86.9
Gua
rdra
il D
amag
e82
.888
.8
Atte
nuat
ors
81.2
Pot
hole
s95
.492
.487
.883
.285
.8
Rut
ting
100.
010
0.0
94.1
96.2
95.6
Pav
emen
t Dro
p O
ff10
0.0
97.0
91.2
81.7
86.8
Sho
ulde
r D
rop
Off
96.4
100.
052
.940
.450
.2
Hig
h S
houl
der
100.
010
0.0
67.6
77.9
75.6
Sho
ulde
r P
otho
les
86.4
65.9
68.1
80.8
74.9
Dra
ins
98.2
86.2
58.1
71.3
Ditc
hes
100.
090
.559
.371
.368
.2
Cur
b an
d G
utte
r
Whi
te S
trip
e10
0.0
93.8
93.8
Yel
low
Str
ipe
96.6
88.2
97.2
93.4
Gui
de S
igns
100.
055
.683
.315
.847
.1
Gui
de S
ign
Ass
embl
ies
100.
010
0.0
100.
092
.7
War
ning
and
Reg
. Sig
ns70
.079
.272
.475
.1
War
ning
and
Reg
. Sig
n A
ssem
blie
s86
.786
.187
.987
.1
Tot
al S
core
96.4
89.4
80.9
72.4
77.6
4A
ppen
dix
I.
FE
AT
UR
E D
ES
CR
IPT
ION
Dis
tric
t Fou
r S
core
s
INT
ER
ST
AT
EN
AT
ION
AL
HIG
HW
AY
SY
ST
EM
ST
AT
E P
RIM
AR
YA
ND
SE
CO
ND
AR
YR
UR
AL
SE
CO
ND
AR
YA
LL R
OA
DS
Rid
eabi
lity
88.6
83.8
74.5
70.5
73.2
App
eara
nce
83.3
75.0
67.0
67.3
67.8
Ver
tical
Cle
aran
ce95
.096
.475
.764
.671
.5
Vis
ual O
bstr
uctio
ns98
.310
0.0
94.2
92.7
93.8
Fen
cing
96.6
93.3
84.1
Gua
rdra
il S
peci
ficat
ions
88.9
97.8
86.6
Gua
rdra
il D
amag
e85
.210
0.0
78.1
Atte
nuat
ors
100.
077
.7
Pot
hole
s10
0.0
94.0
78.2
65.9
73.2
Rut
ting
91.7
95.2
88.4
92.7
90.8
Pav
emen
t Dro
p O
ff10
0.0
95.2
86.4
73.6
80.8
Sho
ulde
r D
rop
Off
91.7
91.7
80.6
65.4
73.8
Hig
h S
houl
der
100.
098
.889
.386
.488
.5
Sho
ulde
r P
otho
les
83.3
88.1
70.9
52.3
62.7
Dra
ins
95.2
100.
082
.665
.175
.0
Ditc
hes
98.1
100.
072
.268
.872
.2
Cur
b an
d G
utte
r
Whi
te S
trip
e98
.297
.4
Yel
low
Str
ipe
96.8
90.8
93.7
Gui
de S
igns
100.
095
.489
.193
.191
.5
Gui
de S
ign
Ass
embl
ies
100.
010
0.0
91.8
93.9
93.4
War
ning
and
Reg
. Sig
ns92
.380
.586
.2
War
ning
and
Reg
. Sig
n A
ssem
blie
s85
.792
.689
.0
Tot
al S
core
93.5
93.8
84.0
77.5
81.5
5A
ppen
dix
I.
FE
AT
UR
E D
ES
CR
IPT
ION
Dis
tric
t Fiv
e S
core
s
INT
ER
ST
AT
EN
AT
ION
AL
HIG
HW
AY
SY
ST
EM
ST
AT
E P
RIM
AR
YA
ND
SE
CO
ND
AR
YR
UR
AL
SE
CO
ND
AR
YA
LL R
OA
DS
Rid
eabi
lity
86.3
70.1
72.8
66.1
71.3
App
eara
nce
100.
096
.799
.099
.099
.0
Ver
tical
Cle
aran
ce94
.778
.376
.266
.774
.3
Vis
ual O
bstr
uctio
ns94
.796
.786
.159
.876
.8
Fen
cing
97.9
98.4
Gua
rdra
il S
peci
ficat
ions
93.9
92.9
92.0
Gua
rdra
il D
amag
e90
.989
.388
.4
Atte
nuat
ors
90.5
100.
091
.5
Pot
hole
s86
.862
.577
.782
.880
.1
Rut
ting
96.5
86.7
76.2
63.7
73.6
Pav
emen
t Dro
p O
ff96
.585
.081
.256
.973
.0
Sho
ulde
r D
rop
Off
91.2
73.3
65.4
47.1
60.9
Hig
h S
houl
der
89.5
73.3
85.2
63.7
76.5
Sho
ulde
r P
otho
les
95.6
95.8
77.7
70.6
77.4
Dra
ins
90.7
97.5
84.8
77.3
82.8
Ditc
hes
83.7
83.3
87.6
77.9
83.1
Cur
b an
d G
utte
r90
.081
.082
.4
Whi
te S
trip
e10
0.0
93.9
100.
087
.594
.7
Yel
low
Str
ipe
100.
093
.695
.694
.295
.4
Gui
de S
igns
95.2
48.2
78.0
80.0
79.4
Gui
de S
ign
Ass
embl
ies
100.
056
.481
.070
.777
.8
War
ning
and
Reg
. Sig
ns84
.982
.082
.982
.7
War
ning
and
Reg
. Sig
n A
ssem
blie
s90
.982
.176
.580
.2
Tot
al S
core
93.2
82.0
83.3
72.9
80.3
6A
ppen
dix
I.
FE
AT
UR
E D
ES
CR
IPT
ION
Dis
tric
t Six
Sco
res
INT
ER
ST
AT
EN
AT
ION
AL
HIG
HW
AY
SY
ST
EM
ST
AT
E P
RIM
AR
YA
ND
SE
CO
ND
AR
YR
UR
AL
SE
CO
ND
AR
YA
LL R
OA
DS
Rid
eabi
lity
85.7
74.9
68.5
67.0
69.1
App
eara
nce
100.
072
.988
.578
.185
.1
Ver
tical
Cle
aran
ce96
.796
.679
.265
.675
.8
Vis
ual O
bstr
uctio
ns10
0.0
100.
093
.889
.692
.8
Fen
cing
100.
010
0.0
94.9
Gua
rdra
il S
peci
ficat
ions
71.4
97.6
60.0
62.4
Gua
rdra
il D
amag
e97
.697
.686
.787
.4
Atte
nuat
ors
100.
010
0.0
100.
010
0.0
Pot
hole
s91
.783
.089
.684
.487
.7
Rut
ting
95.0
71.2
86.5
79.2
84.0
Pav
emen
t Dro
p O
ff10
0.0
100.
087
.572
.983
.3
Sho
ulde
r D
rop
Off
98.3
94.9
72.9
66.7
72.7
Hig
h S
houl
der
100.
096
.695
.887
.593
.1
Sho
ulde
r P
otho
les
87.5
91.5
89.6
94.8
91.4
Dra
ins
100.
091
.888
.163
.079
.9
Ditc
hes
98.0
91.5
78.4
77.0
79.4
Cur
b an
d G
utte
r10
0.0
95.2
79.0
81.0
Whi
te S
trip
e10
0.0
95.8
95.6
95.9
Yel
low
Str
ipe
100.
010
0.0
94.0
97.7
Gui
de S
igns
100.
093
.310
0.0
66.7
87.9
Gui
de S
ign
Ass
embl
ies
100.
089
.287
.4
War
ning
and
Reg
. Sig
ns71
.480
.371
.776
.9
War
ning
and
Reg
. Sig
n A
ssem
blie
s83
.392
.973
.585
.3
Tot
al S
core
95.2
90.0
85.8
77.7
83.8
7A
ppen
dix
I.
FE
AT
UR
E D
ES
CR
IPT
ION
Dis
tric
t Sev
en S
core
s
INT
ER
ST
AT
EN
AT
ION
AL
HIG
HW
AY
SY
ST
EM
ST
AT
E P
RIM
AR
YA
ND
SE
CO
ND
AR
YR
UR
AL
SE
CO
ND
AR
YA
LL R
OA
DS
Rid
eabi
lity
90.2
81.6
73.4
68.3
73.0
App
eara
nce
91.7
89.4
88.0
84.0
86.7
Ver
tical
Cle
aran
ce96
.795
.457
.040
.656
.3
Vis
ual O
bstr
uctio
ns10
0.0
98.5
82.0
70.8
80.0
Fen
cing
98.0
96.3
94.8
Gua
rdra
il S
peci
ficat
ions
90.0
96.3
86.9
Gua
rdra
il D
amag
e95
.096
.386
.4
Atte
nuat
ors
90.5
75.7
Pot
hole
s54
.284
.890
.083
.584
.9
Rut
ting
98.3
89.4
86.0
82.1
85.4
Pav
emen
t Dro
p O
ff10
0.0
100.
084
.071
.781
.5
Sho
ulde
r D
rop
Off
80.0
92.4
76.0
53.8
68.8
Hig
h S
houl
der
100.
098
.584
.074
.582
.4
Sho
ulde
r P
otho
les
62.5
92.4
87.5
92.9
88.8
Dra
ins
66.0
90.9
81.7
72.1
77.9
Ditc
hes
98.2
91.1
75.3
76.0
78.4
Cur
b an
d G
utte
r96
.1
Whi
te S
trip
e90
.010
0.0
93.9
94.8
Yel
low
Str
ipe
100.
010
0.0
92.5
96.3
95.2
Gui
de S
igns
100.
097
.085
.486
.6
Gui
de S
ign
Ass
embl
ies
100.
092
.068
.474
.4
War
ning
and
Reg
. Sig
ns81
.048
.549
.352
.4
War
ning
and
Reg
. Sig
n A
ssem
blie
s62
.220
.943
.8
Tot
al S
core
89.5
92.2
78.8
69.1
77.4
8A
ppen
dix
I.
FE
AT
UR
E D
ES
CR
IPT
ION
Dis
tric
t Eig
ht S
core
s
INT
ER
ST
AT
EN
AT
ION
AL
HIG
HW
AY
SY
ST
EM
ST
AT
E P
RIM
AR
YA
ND
SE
CO
ND
AR
YR
UR
AL
SE
CO
ND
AR
YA
LL R
OA
DS
Rid
eabi
lity
89.2
83.1
77.0
73.4
75.5
App
eara
nce
80.0
95.6
96.0
92.2
93.5
Ver
tical
Cle
aran
ce10
0.0
98.9
88.9
71.8
79.5
Vis
ual O
bstr
uctio
ns10
0.0
100.
098
.095
.296
.4
Fen
cing
100.
010
0.0
100.
0
Gua
rdra
il S
peci
ficat
ions
100.
076
.474
.170
.3
Gua
rdra
il D
amag
e89
.389
.188
.986
.9
Atte
nuat
ors
84.6
90.9
88.3
Pot
hole
s65
.010
0.0
95.0
97.6
96.8
Rut
ting
92.0
95.6
96.0
98.1
97.2
Pav
emen
t Dro
p O
ff10
0.0
100.
096
.094
.295
.3
Sho
ulde
r D
rop
Off
96.0
93.3
95.0
83.5
87.7
Hig
h S
houl
der
100.
097
.896
.087
.490
.9
Sho
ulde
r P
otho
les
85.0
94.4
95.0
90.3
91.9
Dra
ins
100.
087
.897
.887
.890
.6
Ditc
hes
95.2
91.1
92.0
83.7
86.8
Cur
b an
d G
utte
r
Whi
te S
trip
e98
.697
.869
.680
.2
Yel
low
Str
ipe
100.
010
0.0
92.2
95.1
Gui
de S
igns
91.3
88.6
93.1
91.7
Gui
de S
ign
Ass
embl
ies
86.4
87.0
87.5
87.2
War
ning
and
Reg
. Sig
ns92
.271
.883
.781
.3
War
ning
and
Reg
. Sig
n A
ssem
blie
s91
.188
.193
.191
.5
Tot
al S
core
92.0
93.0
90.4
86.6
88.4
9A
ppen
dix
I.
FE
AT
UR
E D
ES
CR
IPT
ION
Dis
tric
t Nin
e S
core
s
INT
ER
ST
AT
EN
AT
ION
AL
HIG
HW
AY
SY
ST
EM
ST
AT
E P
RIM
AR
YA
ND
SE
CO
ND
AR
YR
UR
AL
SE
CO
ND
AR
YA
LL R
OA
DS
Rid
eabi
lity
89.3
84.3
72.3
66.0
71.0
App
eara
nce
98.1
98.6
87.1
81.8
86.0
Ver
tical
Cle
aran
ce98
.110
0.0
59.1
50.5
60.0
Vis
ual O
bstr
uctio
ns10
0.0
97.1
77.4
65.7
74.3
Fen
cing
98.0
89.1
92.3
Gua
rdra
il S
peci
ficat
ions
100.
076
.262
.165
.4
Gua
rdra
il D
amag
e93
.185
.789
.787
.8
Atte
nuat
ors
100.
094
.7
Pot
hole
s95
.378
.365
.054
.662
.3
Rut
ting
81.1
89.9
68.8
79.8
76.3
Pav
emen
t Dro
p O
ff10
0.0
88.4
73.1
41.4
60.3
Sho
ulde
r D
rop
Off
96.2
87.0
71.0
70.7
73.2
Hig
h S
houl
der
100.
089
.958
.145
.456
.3
Sho
ulde
r P
otho
les
95.3
81.9
94.6
82.3
87.7
Dra
ins
100.
088
.979
.568
.375
.7
Ditc
hes
96.1
88.5
83.7
67.4
76.8
Cur
b an
d G
utte
r
Whi
te S
trip
e10
0.0
82.6
92.9
87.9
Yel
low
Str
ipe
100.
095
.688
.272
.181
.6
Gui
de S
igns
100.
099
.4
Gui
de S
ign
Ass
embl
ies
100.
010
0.0
War
ning
and
Reg
. Sig
ns93
.992
.070
.681
.2
War
ning
and
Reg
. Sig
n A
ssem
blie
s86
.268
.477
.0
Tot
al S
core
95.3
88.2
80.4
65.5
75.3
10A
ppen
dix
I.
FE
AT
UR
E D
ES
CR
IPT
ION
Dis
tric
t Ten
Sco
res
NA
TIO
NA
LH
IGH
WA
YS
YS
TE
M
ST
AT
E P
RIM
AR
YA
ND
SE
CO
ND
AR
YR
UR
AL
SE
CO
ND
AR
YA
LL R
OA
DS
Rid
eabi
lity
85.6
69.4
61.1
67.0
App
eara
nce
100.
094
.588
.292
.1
Ver
tical
Cle
aran
ce95
.360
.661
.864
.0
Vis
ual O
bstr
uctio
ns99
.195
.490
.993
.7
Fen
cing
96.7
96.8
Gua
rdra
il S
peci
ficat
ions
41.2
63.3
59.4
Gua
rdra
il D
amag
e98
.890
.090
.1
Atte
nuat
ors
100.
089
.8
Pot
hole
s10
0.0
88.5
75.0
83.4
Rut
ting
54.2
78.9
64.6
70.4
Pav
emen
t Dro
p O
ff99
.190
.874
.684
.2
Sho
ulde
r D
rop
Off
87.8
76.2
90.9
83.8
Hig
h S
houl
der
100.
098
.296
.497
.5
Sho
ulde
r P
otho
les
100.
095
.479
.688
.7
Dra
ins
95.8
93.8
93.2
93.7
Ditc
hes
96.0
90.5
88.0
89.8
Cur
b an
d G
utte
r
Whi
te S
trip
e89
.688
.388
.3
Yel
low
Str
ipe
92.1
67.4
47.1
60.4
Gui
de S
igns
92.0
100.
010
0.0
99.3
Gui
de S
ign
Ass
embl
ies
100.
010
0.0
100.
0
War
ning
and
Reg
. Sig
ns97
.098
.510
0.0
99.0
War
ning
and
Reg
. Sig
n A
ssem
blie
s10
0.0
97.0
96.3
Tot
al S
core
91.6
86.1
78.8
83.8
11A
ppen
dix
I.
FE
AT
UR
E D
ES
CR
IPT
ION
Dis
tric
t Ele
ven
Sco
res
INT
ER
ST
AT
EN
AT
ION
AL
HIG
HW
AY
SY
ST
EM
ST
AT
E P
RIM
AR
YA
ND
SE
CO
ND
AR
YR
UR
AL
SE
CO
ND
AR
YA
LL R
OA
DS
Rid
eabi
lity
90.9
86.2
75.1
67.2
72.8
App
eara
nce
100.
097
.289
.781
.686
.8
Ver
tical
Cle
aran
ce48
.393
.075
.362
.170
.0
Vis
ual O
bstr
uctio
ns96
.710
0.0
87.6
84.5
87.4
Fen
cing
90.0
94.0
Gua
rdra
il S
peci
ficat
ions
100.
056
.576
.975
.2
Gua
rdra
il D
amag
e89
.710
0.0
96.2
95.3
Atte
nuat
ors
93.8
100.
099
.2
Pot
hole
s10
0.0
89.4
79.4
44.2
64.7
Rut
ting
98.3
90.1
70.1
57.3
66.5
Pav
emen
t Dro
p O
ff95
.090
.171
.170
.973
.1
Sho
ulde
r D
rop
Off
95.0
93.0
83.5
76.7
81.4
Hig
h S
houl
der
93.3
74.6
69.1
66.0
68.7
Sho
ulde
r P
otho
les
100.
057
.869
.163
.666
.4
Dra
ins
96.8
100.
093
.978
.087
.2
Ditc
hes
97.9
98.3
91.0
85.9
89.4
Cur
b an
d G
utte
r
Whi
te S
trip
e87
.896
.294
.692
.6
Yel
low
Str
ipe
100.
095
.487
.292
.0
Gui
de S
igns
100.
093
.110
0.0
96.9
Gui
de S
ign
Ass
embl
ies
84.6
93.6
89.8
War
ning
and
Reg
. Sig
ns10
0.0
97.1
95.4
96.5
War
ning
and
Reg
. Sig
n A
ssem
blie
s10
0.0
100.
094
.497
.4
Tot
al S
core
93.5
91.0
85.2
75.5
81.9
12A
ppen
dix
I.
FE
AT
UR
E D
ES
CR
IPT
ION
Dis
tric
t Tw
elve
Sco
res
NA
TIO
NA
LH
IGH
WA
YS
YS
TE
M
ST
AT
E P
RIM
AR
YA
ND
SE
CO
ND
AR
YR
UR
AL
SE
CO
ND
AR
YA
LL R
OA
DS
Rid
eabi
lity
85.8
73.8
59.3
70.0
App
eara
nce
100.
096
.590
.194
.6
Ver
tical
Cle
aran
ce96
.344
.432
.447
.1
Vis
ual O
bstr
uctio
ns99
.192
.291
.092
.7
Fen
cing
Gua
rdra
il S
peci
ficat
ions
82.1
63.5
52.2
61.8
Gua
rdra
il D
amag
e91
.192
.378
.386
.9
Atte
nuat
ors
82.4
82.4
79.0
81.1
Pot
hole
s60
.387
.068
.576
.4
Rut
ting
79.4
84.4
81.1
82.4
Pav
emen
t Dro
p O
ff97
.260
.040
.557
.9
Sho
ulde
r D
rop
Off
81.3
68.7
80.2
74.7
Hig
h S
houl
der
93.5
87.0
85.6
87.4
Sho
ulde
r P
otho
les
76.6
80.4
91.0
83.8
Dra
ins
80.6
84.8
80.9
82.8
Ditc
hes
77.0
69.8
47.6
62.5
Cur
b an
d G
utte
r93
.392
.2
Whi
te S
trip
e86
.394
.792
.4
Yel
low
Str
ipe
82.4
86.6
74.1
81.4
Gui
de S
igns
100.
084
.489
.588
.4
Gui
de S
ign
Ass
embl
ies
100.
089
.289
.0
War
ning
and
Reg
. Sig
ns10
0.0
85.4
69.2
81.4
War
ning
and
Reg
. Sig
n A
ssem
blie
s86
.486
.184
.1
Tot
al S
core
87.3
80.9
71.0
78.5
13A
ppen
dix
I.
2014 Maintenance Rating Program Report
Kentucky Transportation Cabinet
APPENDIX II
Statewide Scores by Element Type
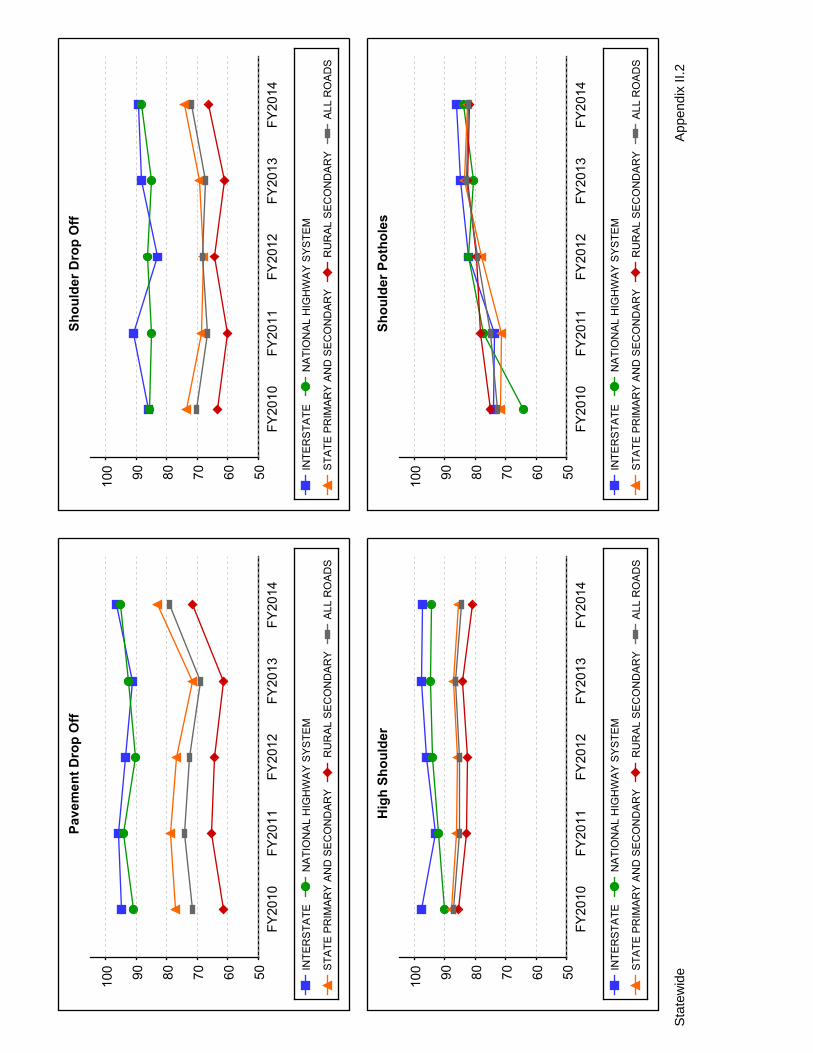
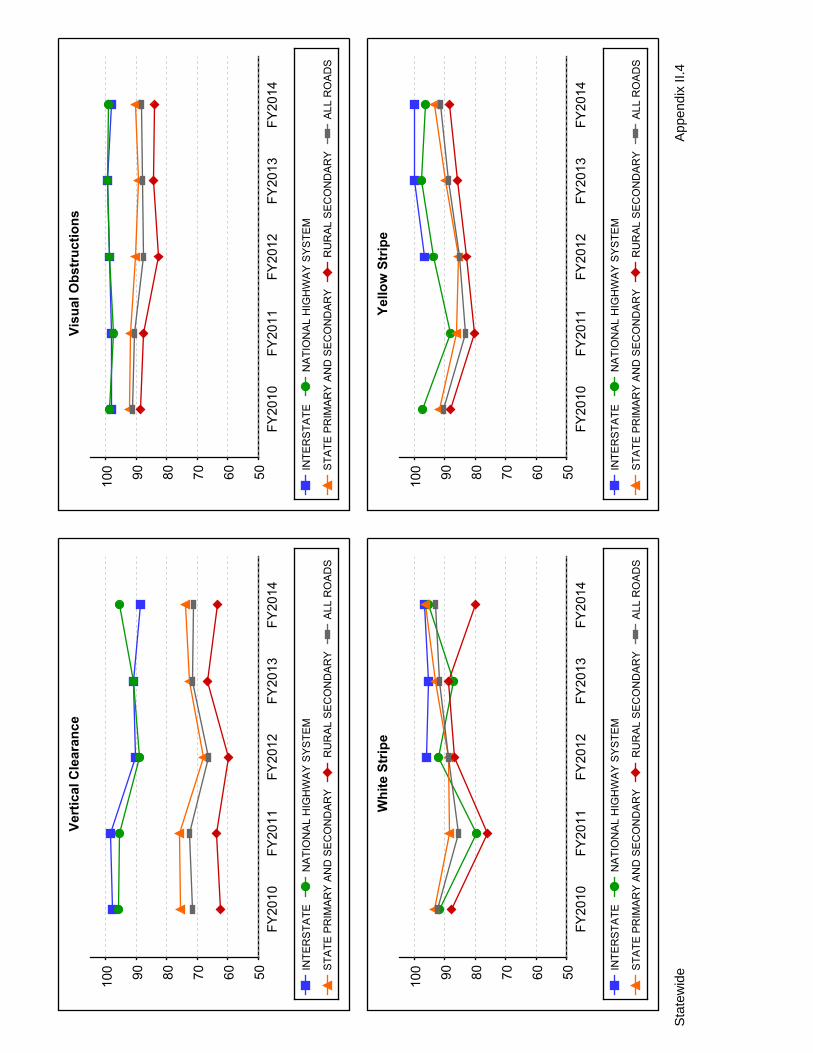
Appendix II is a graphical representation of historical scores on a statewide basis. Scores for the current and previous four years are represented in the graphs for each of the four road types. The gray shaded area represents the weighted average of all roads for the given feature. This weighting is based on the number of miles present for each road type. For this reason, the shaded area may not appear to be a true average of the individual lines. In general, the weighted average will tend to gravitate toward the RS and Other SP/SS scores as these have the majority of centerline miles. In some instances, there may be insufficient data available to analyze a specific road type. In these cases, individual lines may be broken or may not appear at all. Where possible, the overall average score is still displayed.
App
endi
x II.
1S
tate
wid
e
App
endi
x II.
2S
tate
wid
e
App
endi
x II.
3S
tate
wid
e
App
endi
x II.
4S
tate
wid
e
App
endi
x II.
5S
tate
wid
e
App
endi
x II.
6S
tate
wid
e
2014 Maintenance Rating Program Report
Kentucky Transportation Cabinet
APPENDIX III
District Scores by Element Type
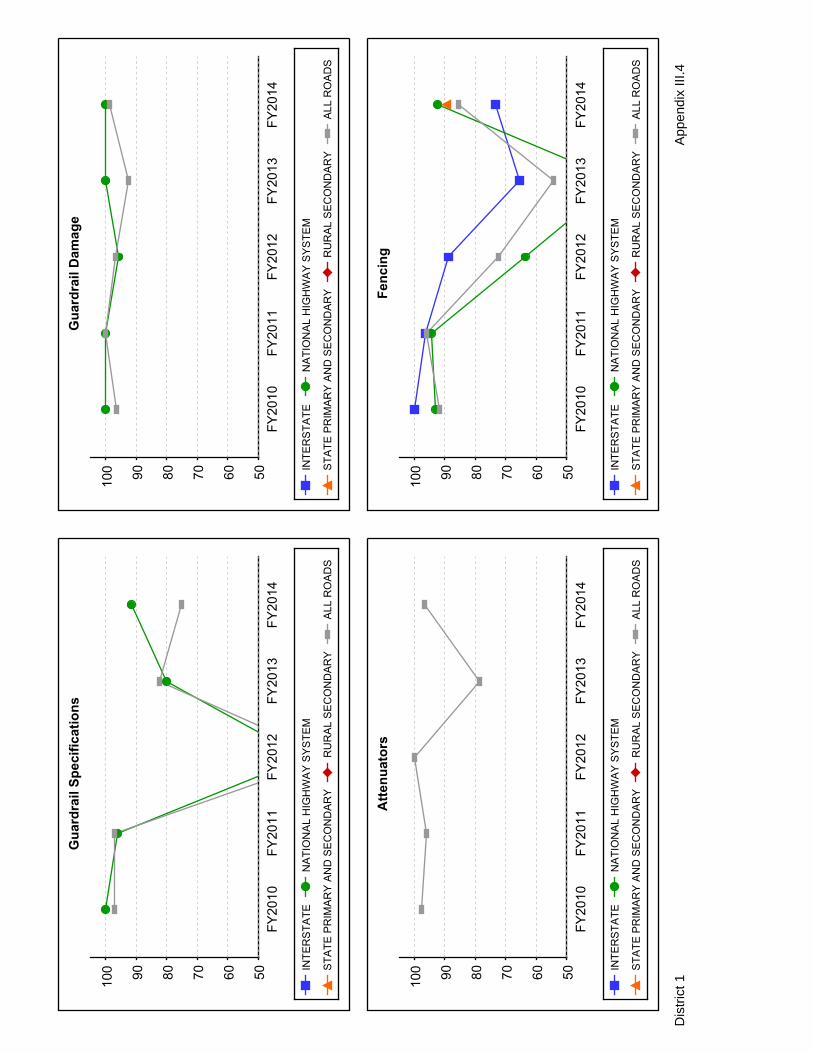
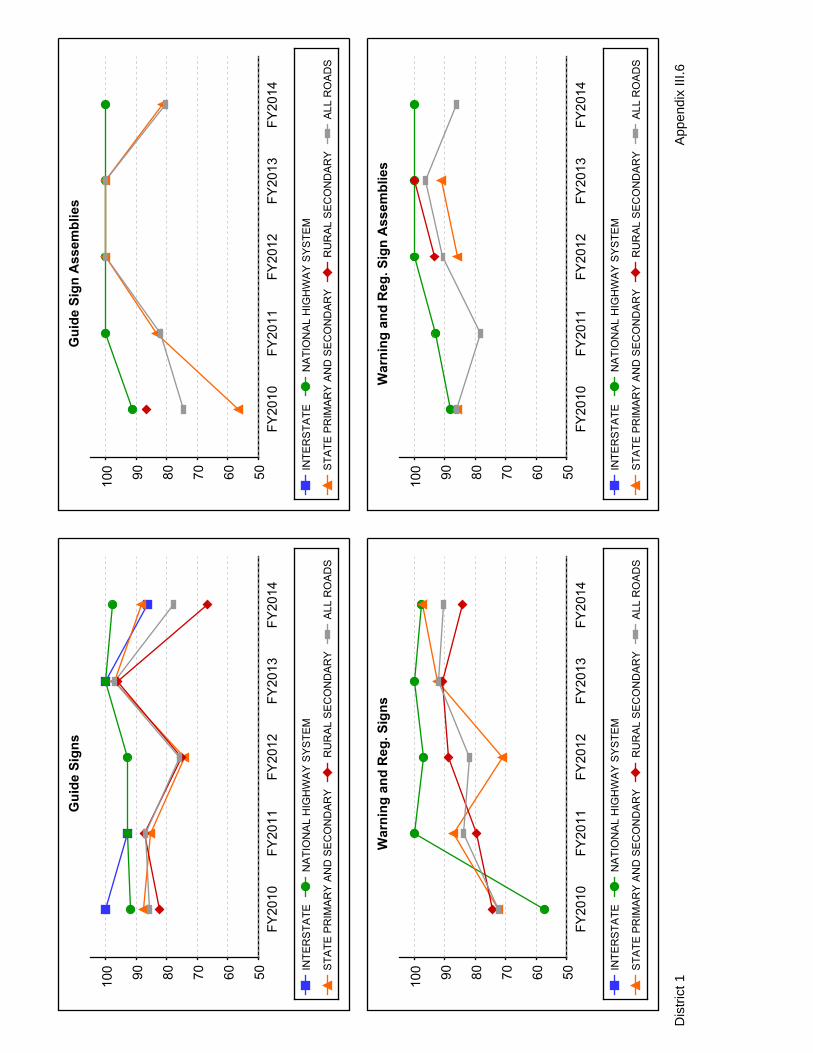
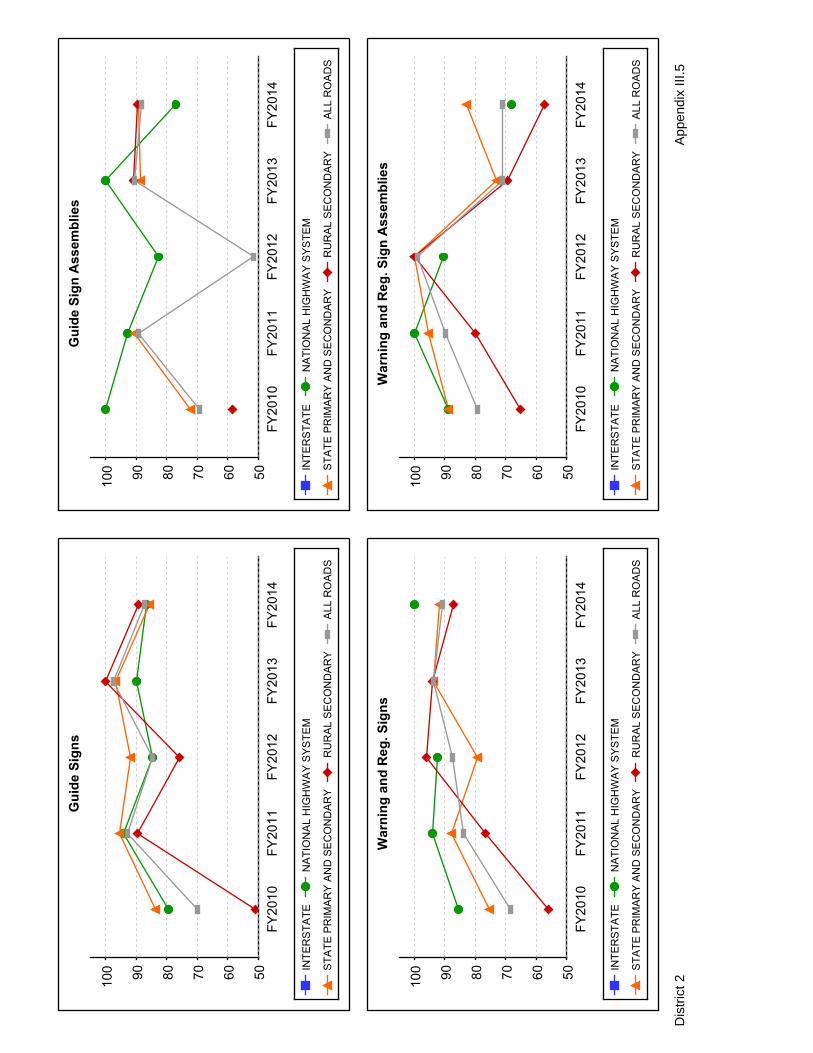
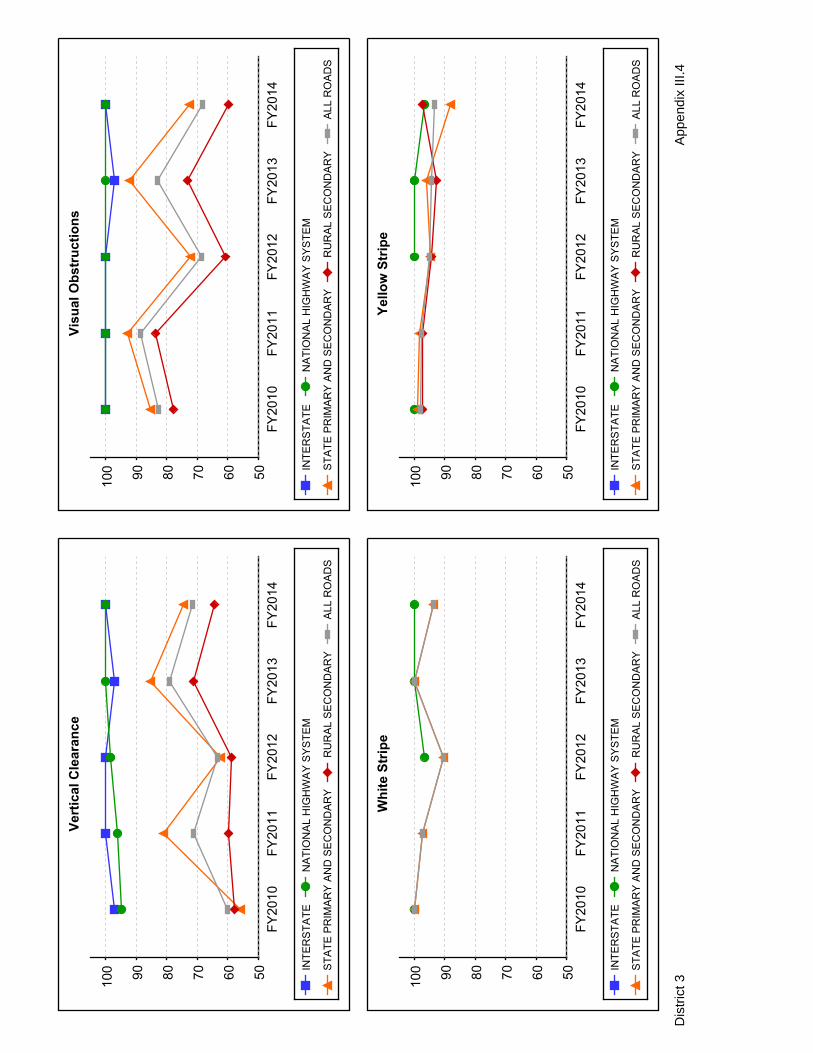
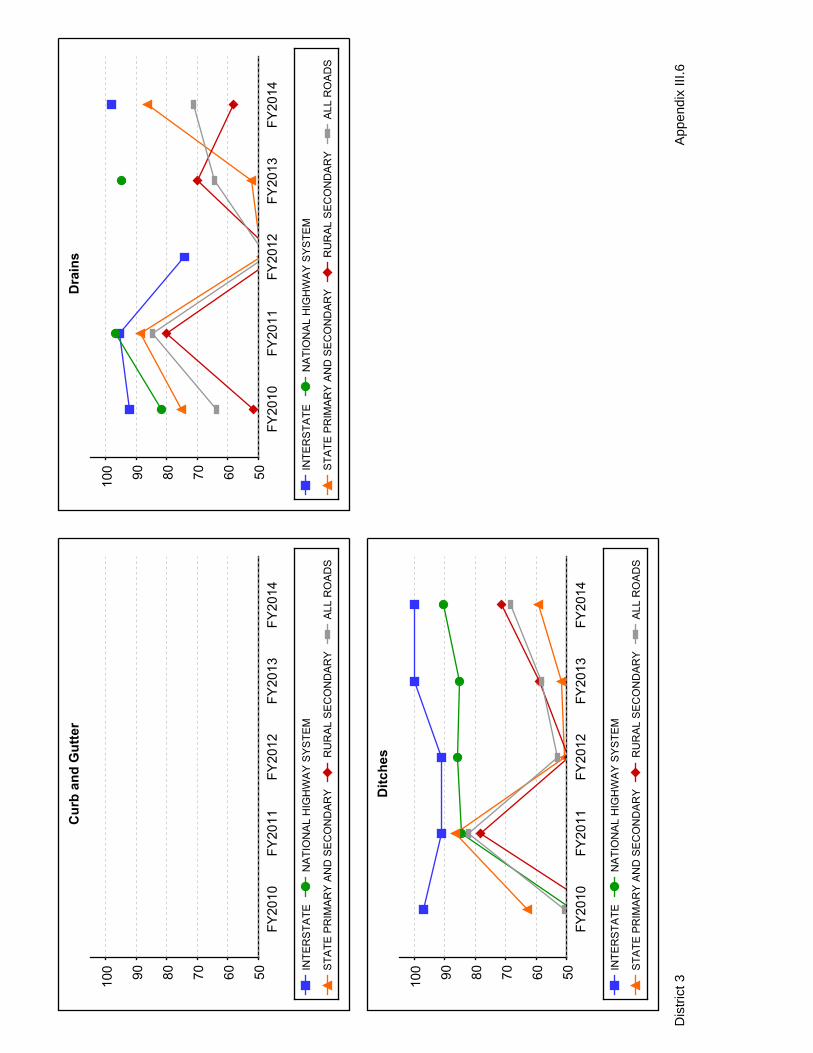
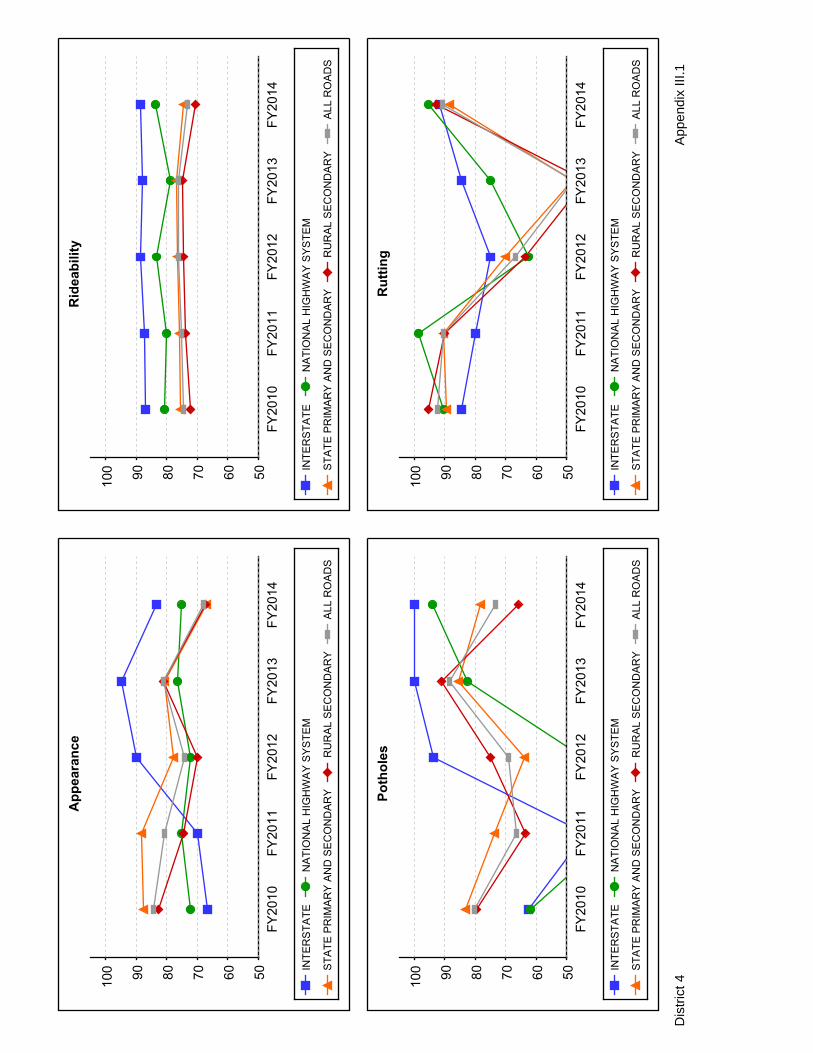
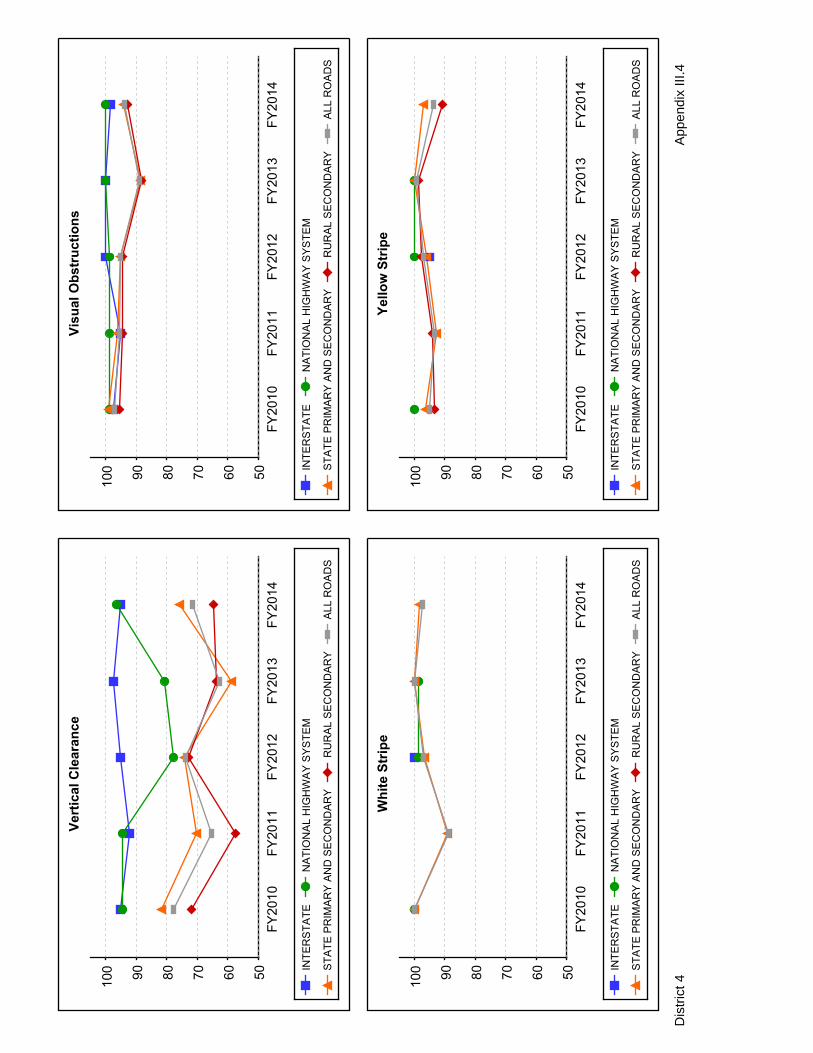
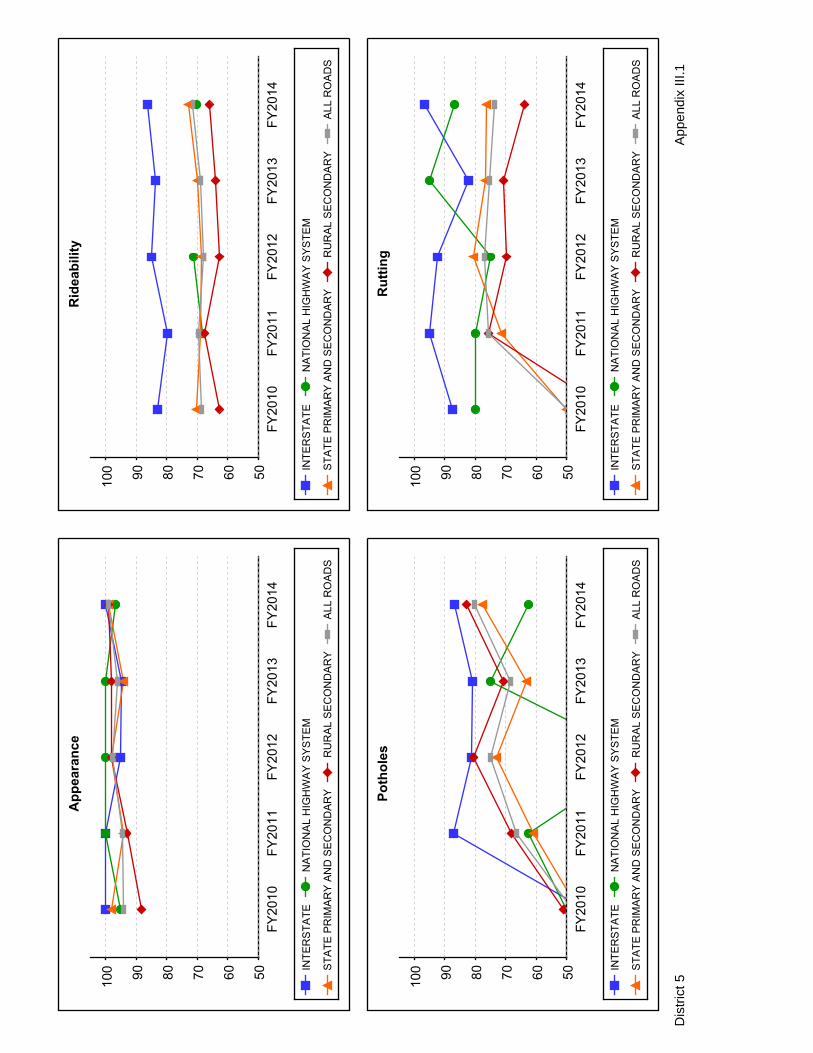
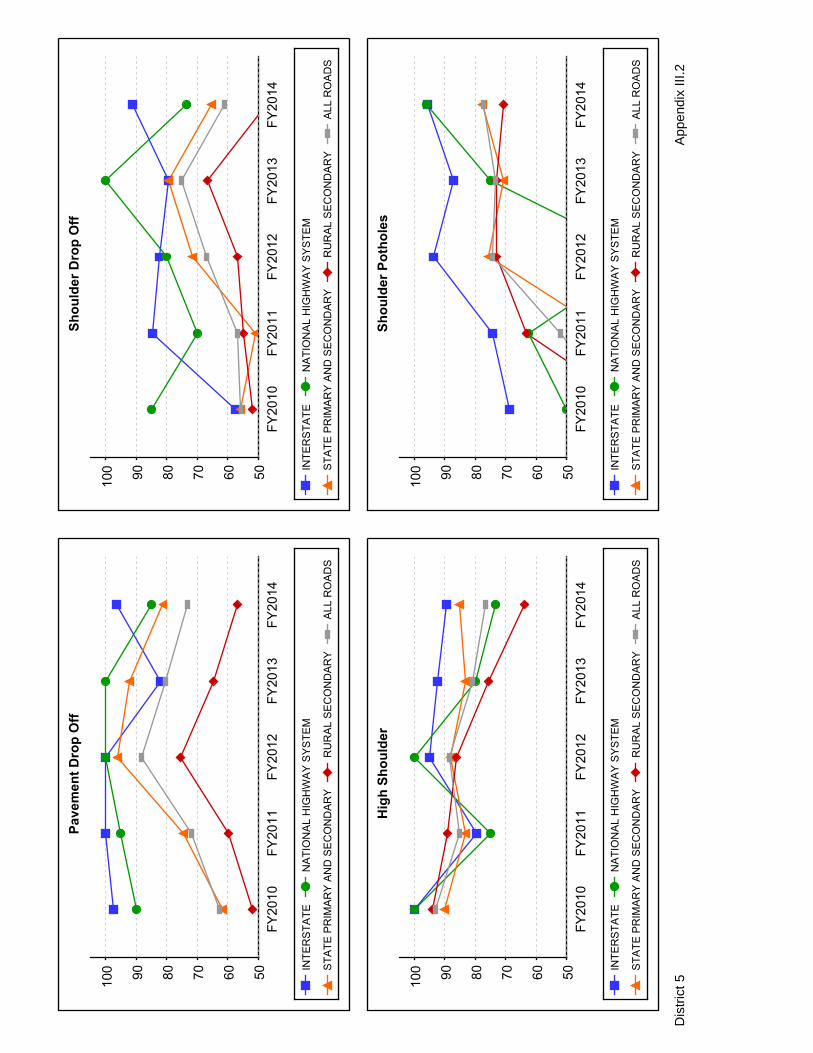
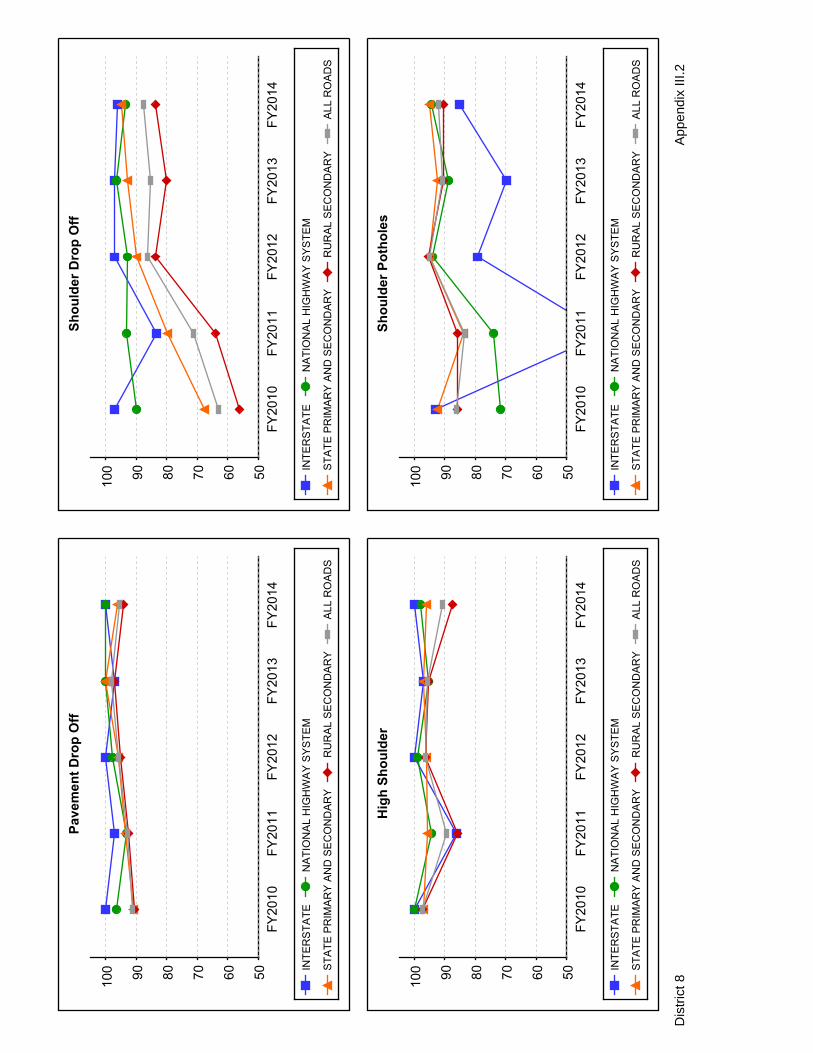
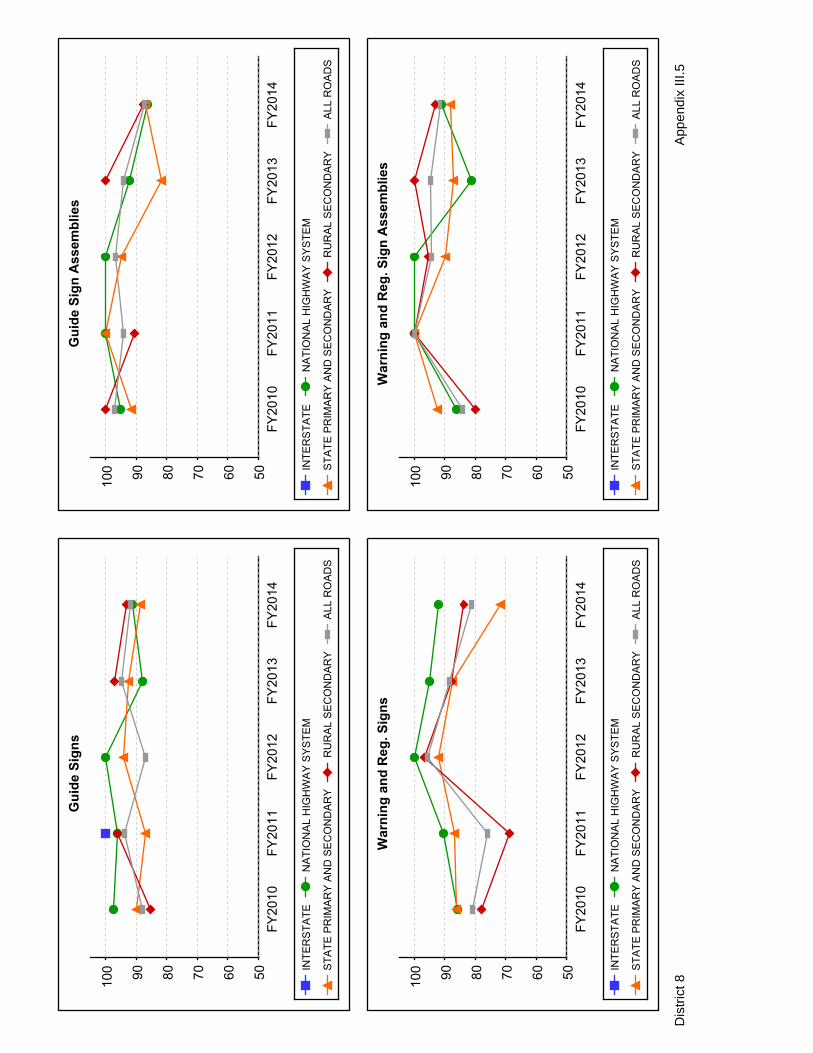
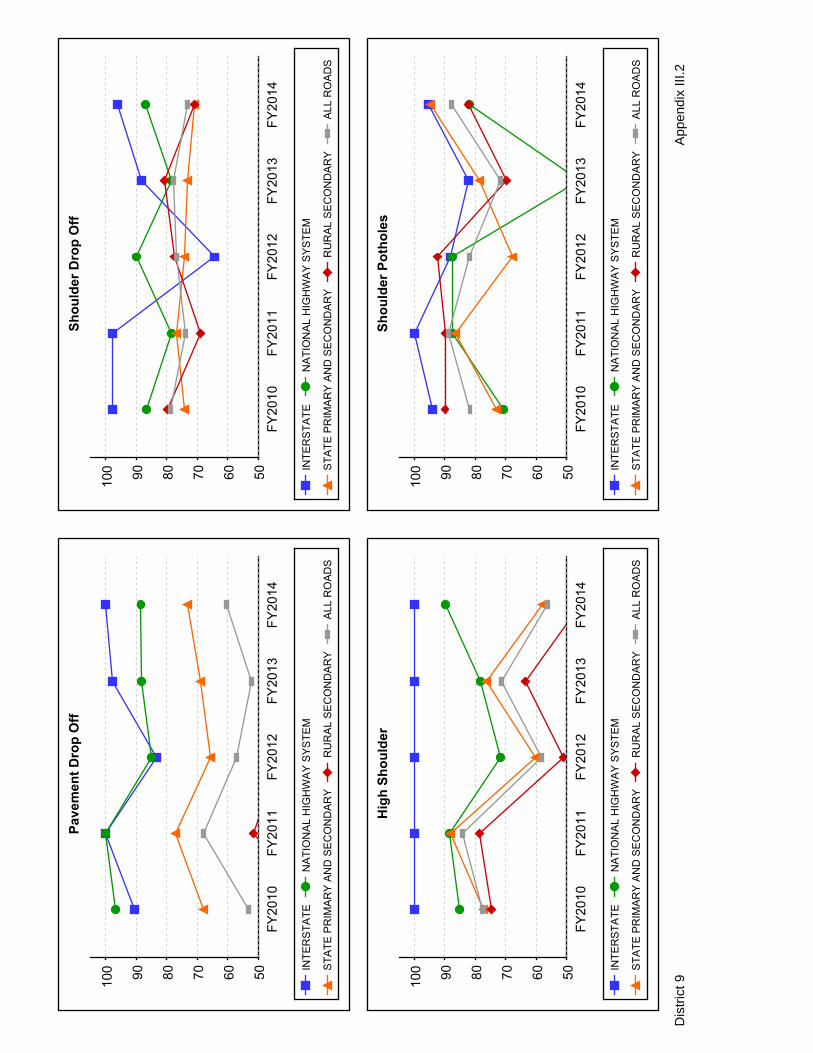
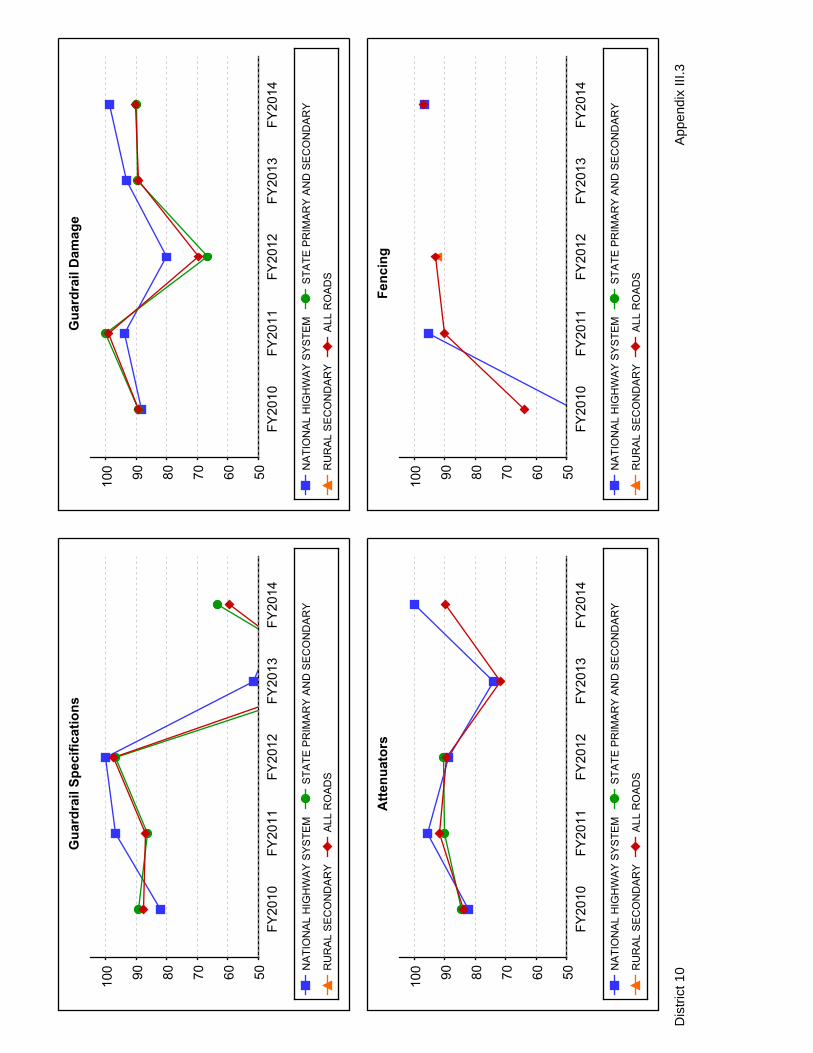
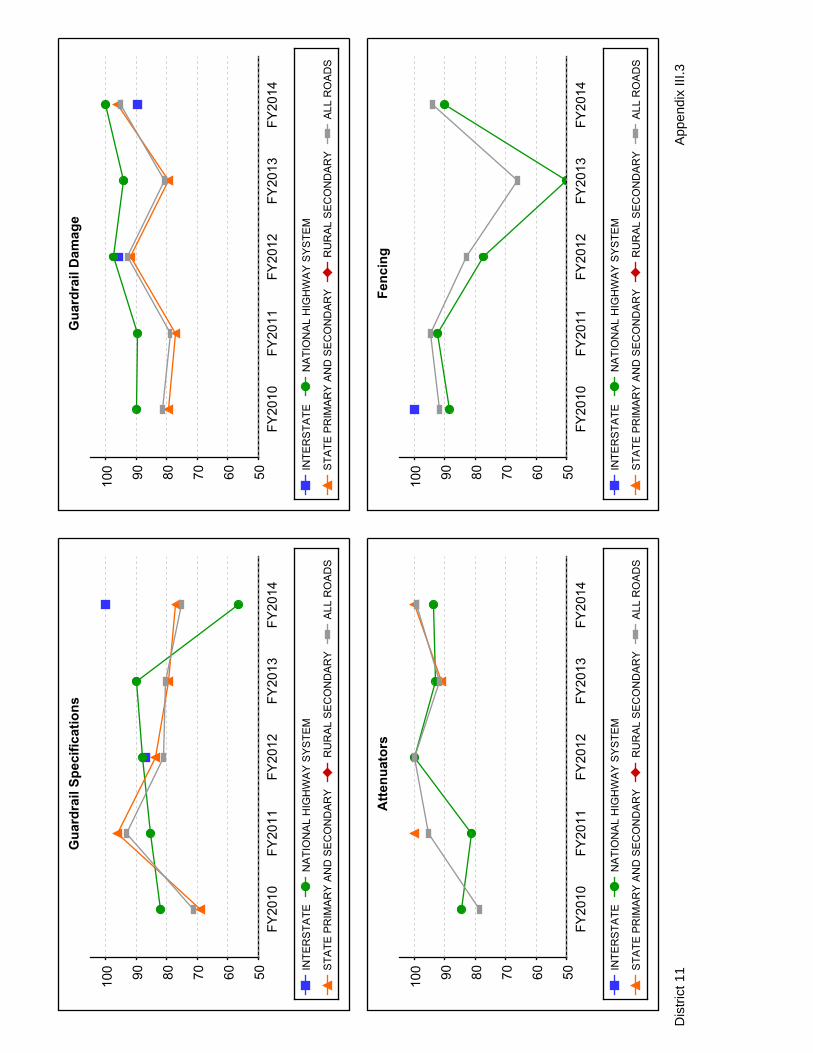
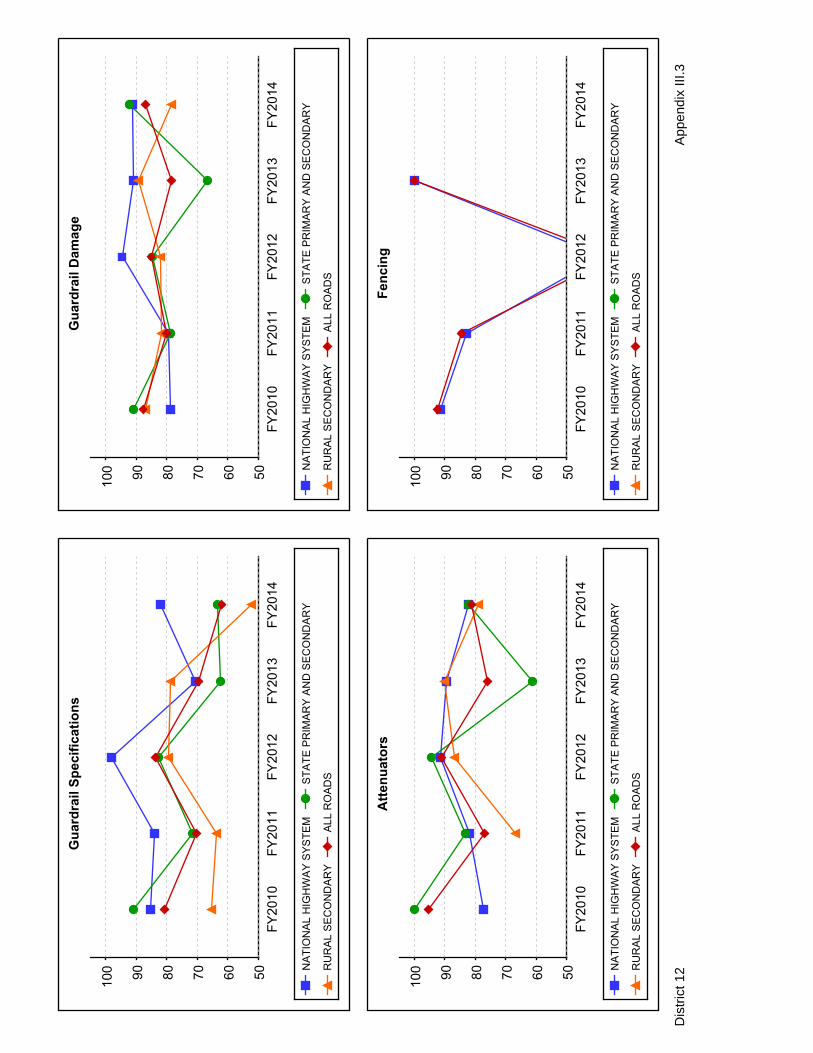
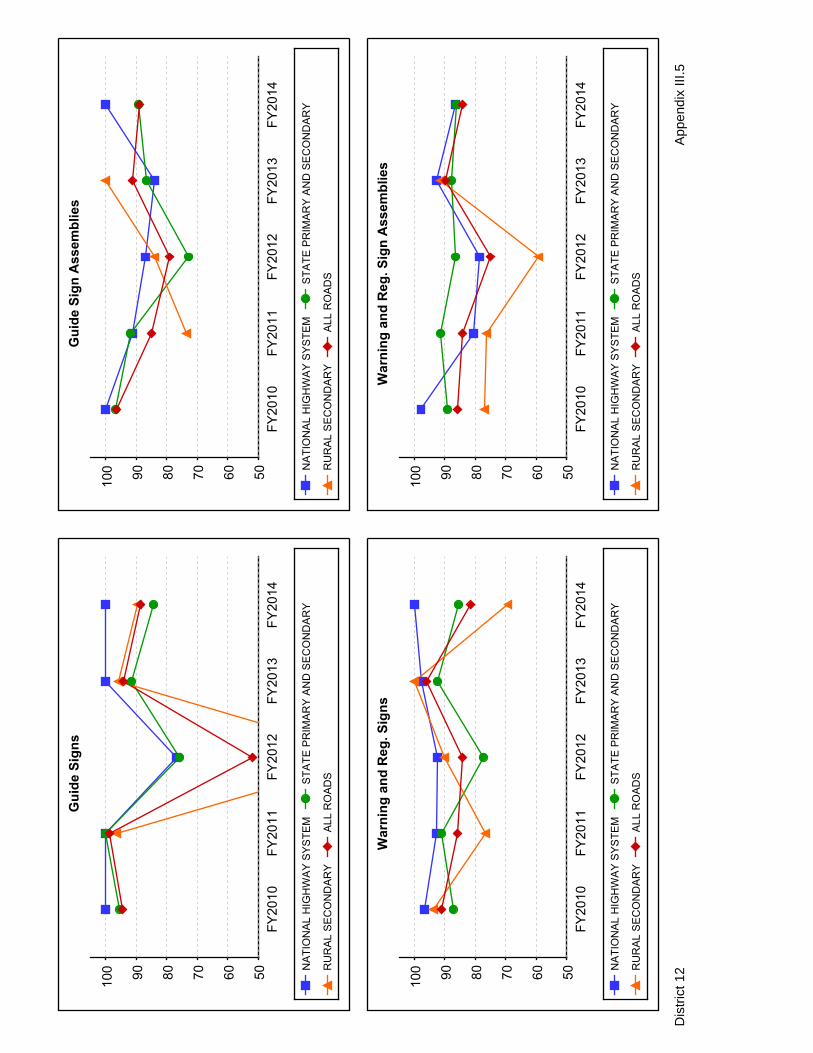
Similar to Appendix II, the District Scores by Element Type have scores for the current and previous four years represented in the graphs for each of the four road types. The gray shaded area represents the weighted average of all roads for the given feature. Due to the much smaller sample size in district evaluations, there are many more instances where there was insufficient data for analysis. These graphs are still shown, but will be marked accordingly. In some cases, the line representing a specific road type may be missing or broken due to insufficient data for a specific year or road type, but the district-wide average for all road types is still shown where possible.
Dis
tric
t 1A
ppen
dix
III.2
Dis
tric
t 1A
ppen
dix
III.3
Dis
tric
t 1A
ppen
dix
III.4
Dis
tric
t 1A
ppen
dix
III.5
Dis
tric
t 1A
ppen
dix
III.6
Dis
tric
t 1A
ppen
dix
III.7
Dis
tric
t 2A
ppen
dix
III.1
Dis
tric
t 2A
ppen
dix
III.2
Dis
tric
t 2A
ppen
dix
III.3
Dis
tric
t 2A
ppen
dix
III.4
Dis
tric
t 2A
ppen
dix
III.5
Dis
tric
t 2A
ppen
dix
III.6
Dis
tric
t 3A
ppen
dix
III.1
Dis
tric
t 3A
ppen
dix
III.2
Dis
tric
t 3A
ppen
dix
III.3
Dis
tric
t 3A
ppen
dix
III.4
Dis
tric
t 3A
ppen
dix
III.5
Dis
tric
t 3A
ppen
dix
III.6
Dis
tric
t 4A
ppen
dix
III.1
Dis
tric
t 4A
ppen
dix
III.2
Dis
tric
t 4A
ppen
dix
III.3
Dis
tric
t 4A
ppen
dix
III.4
Dis
tric
t 4A
ppen
dix
III.5
Dis
tric
t 4A
ppen
dix
III.6
Dis
tric
t 5A
ppen
dix
III.1
Dis
tric
t 5A
ppen
dix
III.2
Dis
tric
t 5A
ppen
dix
III.3
Dis
tric
t 5A
ppen
dix
III.4
Dis
tric
t 5A
ppen
dix
III.5
Dis
tric
t 5A
ppen
dix
III.6
Dis
tric
t 6A
ppen
dix
III.1
Dis
tric
t 6A
ppen
dix
III.2
Dis
tric
t 6A
ppen
dix
III.3
Dis
tric
t 6A
ppen
dix
III.4
Dis
tric
t 6A
ppen
dix
III.5
Dis
tric
t 6A
ppen
dix
III.6
Dis
tric
t 7A
ppen
dix
III.1
Dis
tric
t 7A
ppen
dix
III.2
Dis
tric
t 7A
ppen
dix
III.3
Dis
tric
t 7A
ppen
dix
III.4
Dis
tric
t 7A
ppen
dix
III.5
Dis
tric
t 7A
ppen
dix
III.6
Dis
tric
t 8A
ppen
dix
III.1
Dis
tric
t 8A
ppen
dix
III.2
Dis
tric
t 8A
ppen
dix
III.3
Dis
tric
t 8A
ppen
dix
III.4
Dis
tric
t 8A
ppen
dix
III.5
Dis
tric
t 8A
ppen
dix
III.6
Dis
tric
t 9A
ppen
dix
III.1
Dis
tric
t 9A
ppen
dix
III.2
Dis
tric
t 9A
ppen
dix
III.3
Dis
tric
t 9A
ppen
dix
III.4
Dis
tric
t 9A
ppen
dix
III.5
Dis
tric
t 9A
ppen
dix
III.6
Dis
tric
t 10
App
endi
x III
.1
Dis
tric
t 10
App
endi
x III
.2
Dis
tric
t 10
App
endi
x III
.3
Dis
tric
t 10
App
endi
x III
.4
Dis
tric
t 10
App
endi
x III
.5
Dis
tric
t 10
App
endi
x III
.6
Dis
tric
t 11
App
endi
x III
.1
Dis
tric
t 11
App
endi
x III
.2
Dis
tric
t 11
App
endi
x III
.3
Dis
tric
t 11
App
endi
x III
.4
Dis
tric
t 11
App
endi
x III
.5
Dis
tric
t 11
App
endi
x III
.6
Dis
tric
t 12
App
endi
x III
.1
Dis
tric
t 12
App
endi
x III
.2
Dis
tric
t 12
App
endi
x III
.3
Dis
tric
t 12
App
endi
x III
.4
Dis
tric
t 12
App
endi
x III
.5
Dis
tric
t 12
App
endi
x III
.6
2014 Maintenance Rating Program Report
Kentucky Transportation Cabinet
APPENDIX IV
Total Scores by Road Type
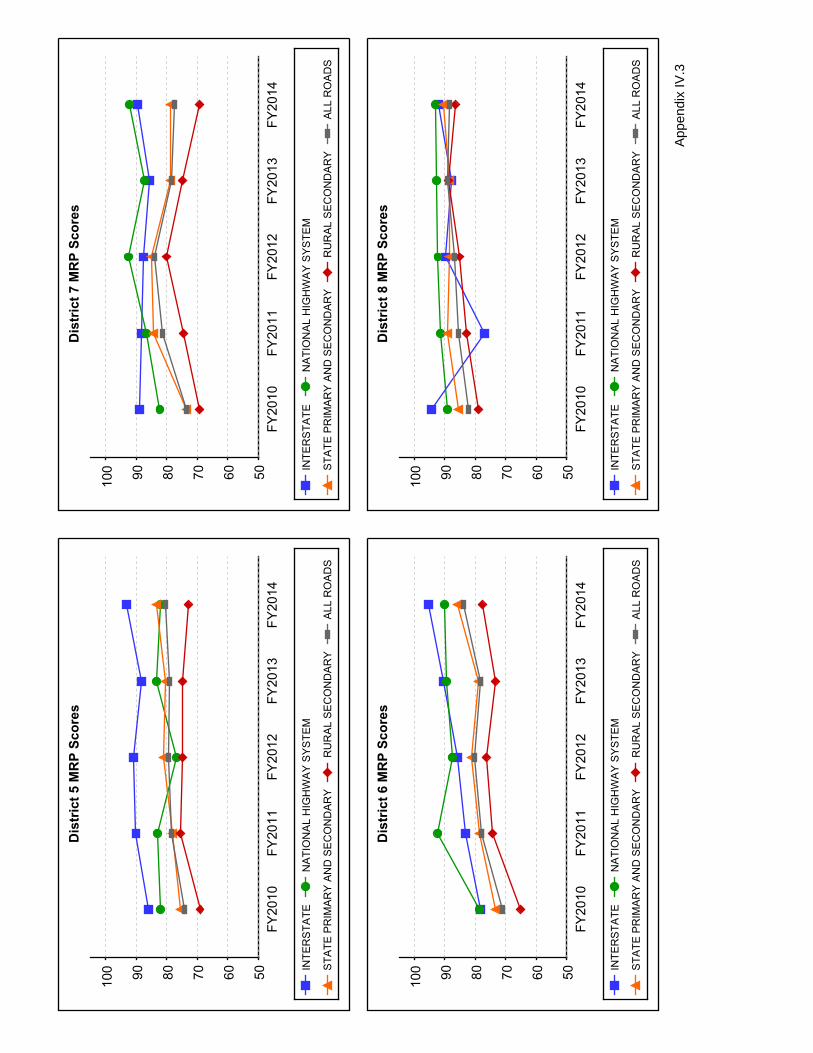
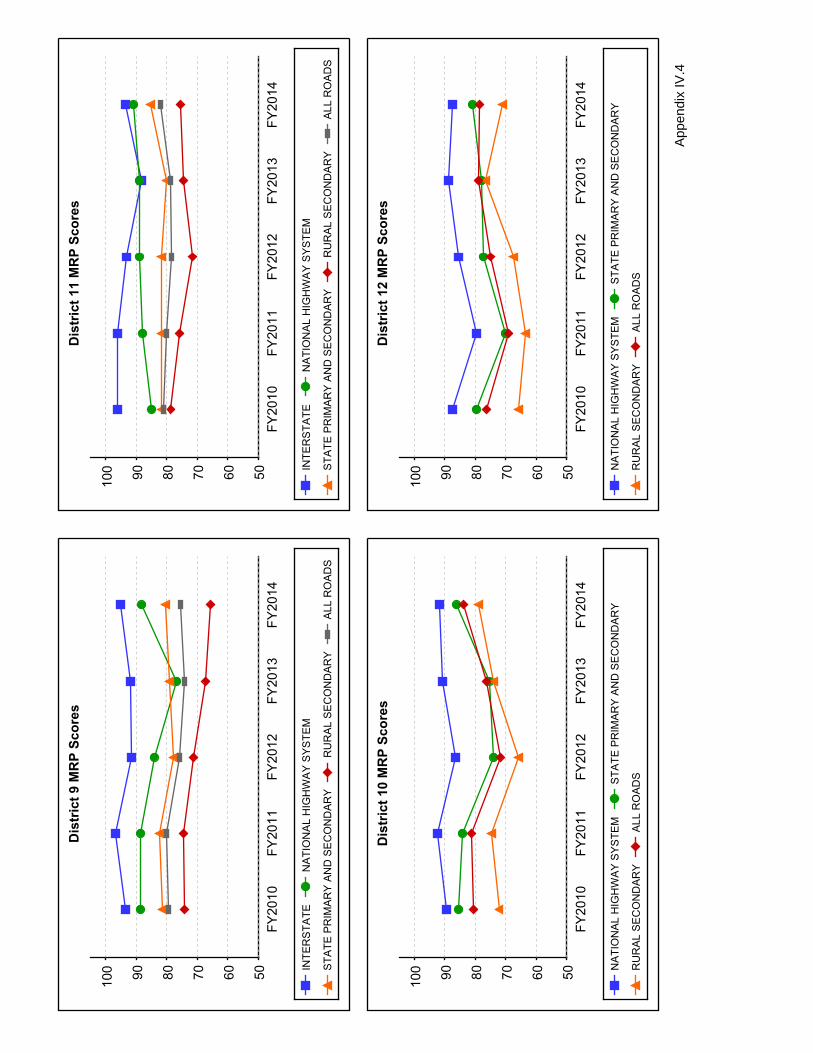
The graphs in Appendix IV illustrate the total MRP scores for each district and statewide. These are the combined scores for all roadway features. Included are the most recent MRP data and historical data for all previous four years. As in previous graphs, the four road types are represented by colored lines, while the overall weighted average is shown as a gray shaded area.
App
endi
x IV
.1
App
endi
x IV
.2
App
endi
x IV
.3
App
endi
x IV
.4
2014 Maintenance Rating Program Report
Kentucky Transportation Cabinet
APPENDIX V
Activity Spending
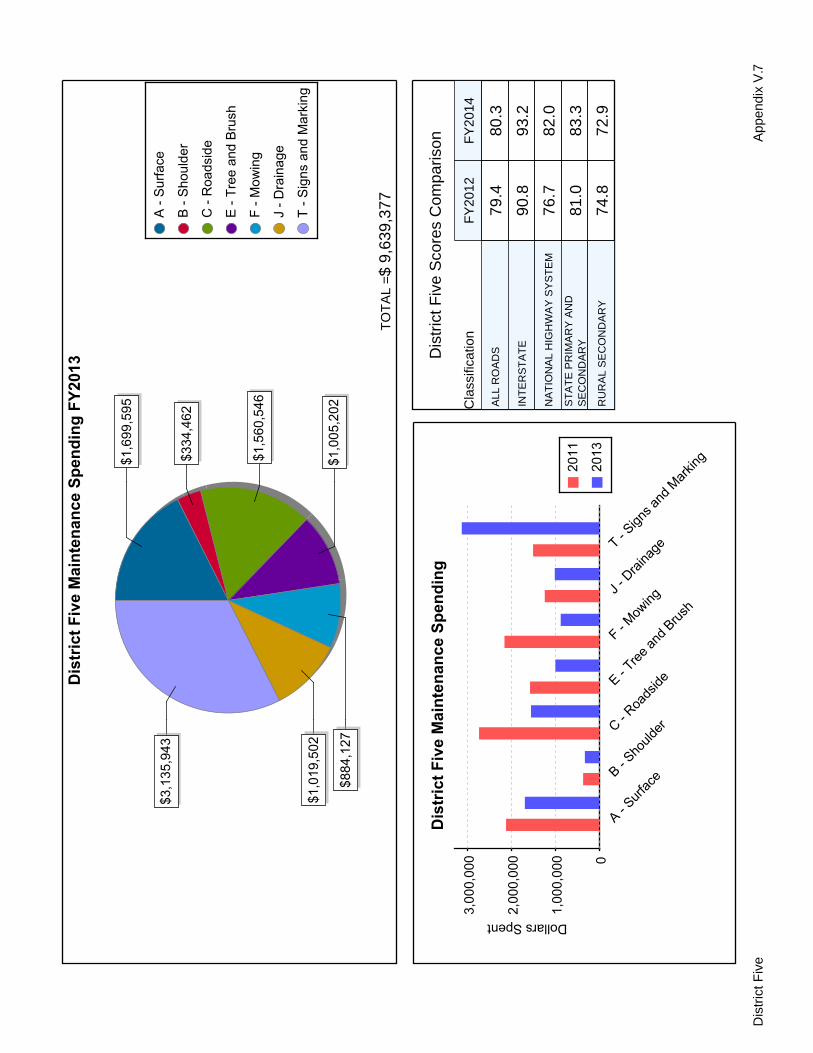
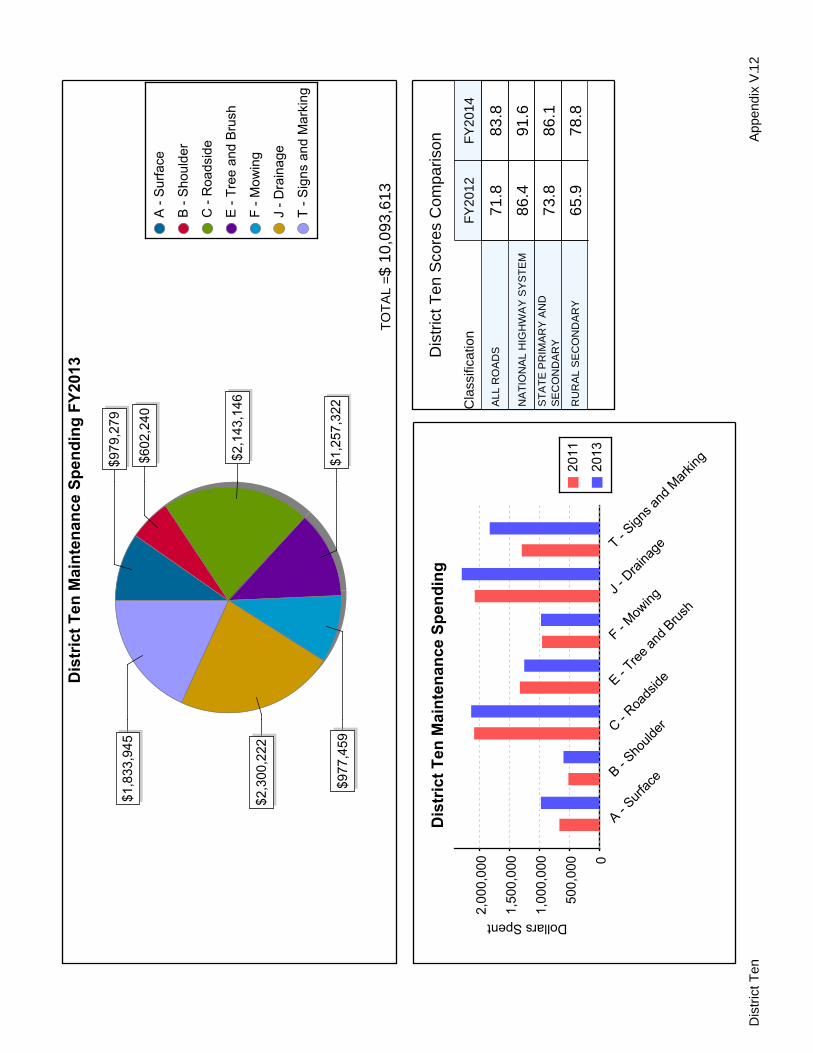
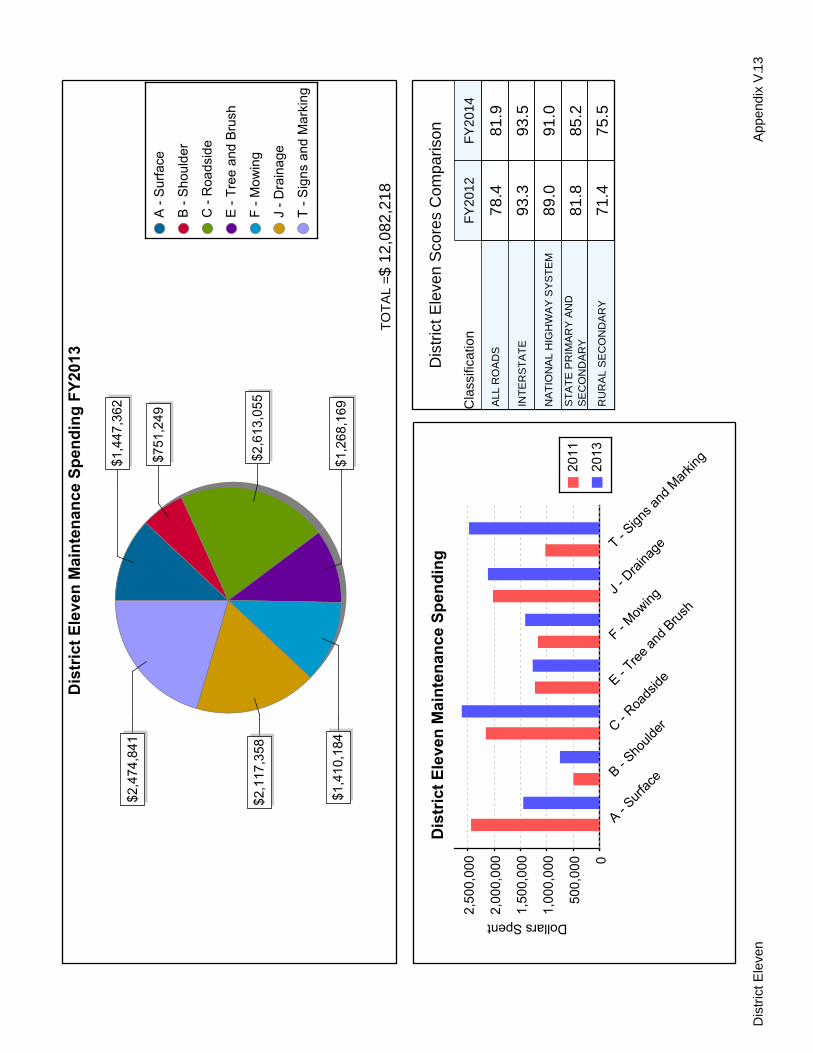
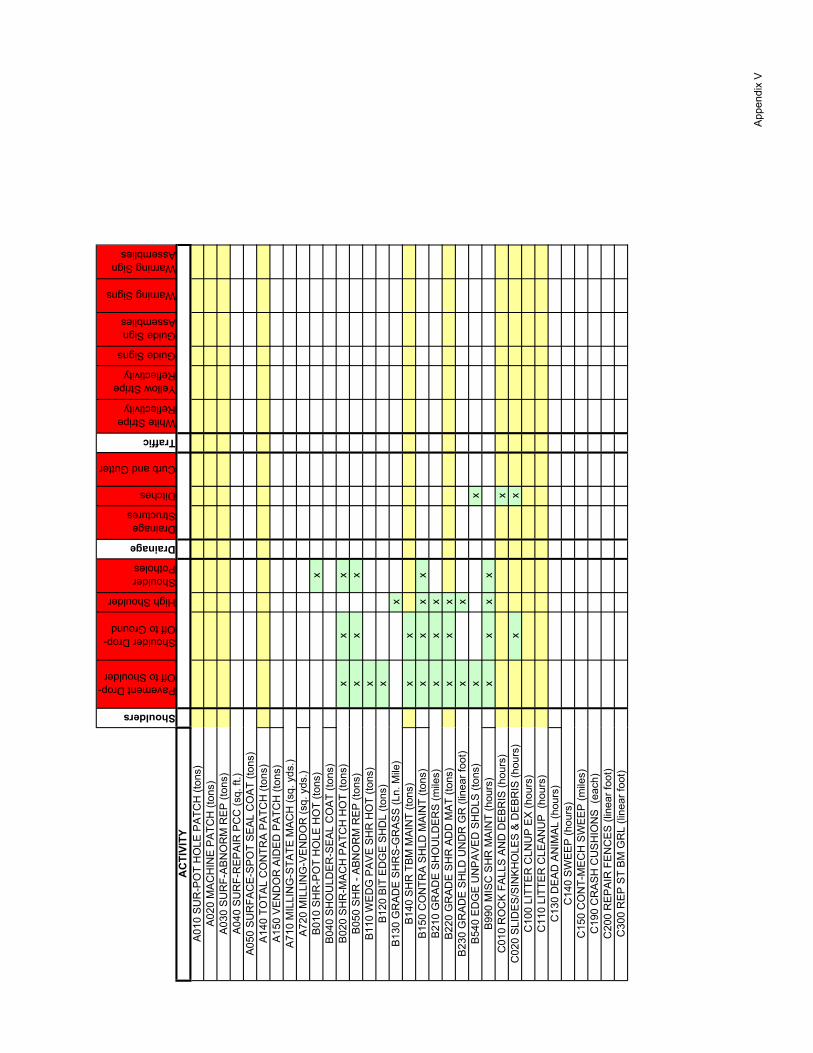
Appendix V tables and graphs are a summary of previous fiscal year district spending impacting current MRP scores. Spending is pulled from a combination of OMS and EMARS reports in order to include state force and contract spending. Appendix V also contains a complete list of activities that impact features inspected by the MRP.
TO
TA
L =$
138,
242,
758
Cla
ssifi
catio
nF
Y20
12F
Y20
14
ALL
RO
AD
S80
.182
.5
INT
ER
ST
AT
E90
.591
.9
NA
TIO
NA
L H
IGH
WA
Y S
YS
TE
M87
.790
.5S
TA
TE
PR
IMA
RY
AN
DS
EC
ON
DA
RY
80.5
84.3
RU
RA
L S
EC
ON
DA
RY
77.0
76.6
Sta
tew
ide
Sco
res
Com
paris
on
App
endi
x V
.2S
tate
wid
e
TO
TA
L =$
10,3
87,4
26
Cla
ssifi
catio
nF
Y20
12F
Y20
14
ALL
RO
AD
S76
.983
.4
INT
ER
ST
AT
E81
.882
.6
NA
TIO
NA
L H
IGH
WA
Y S
YS
TE
M87
.091
.3S
TA
TE
PR
IMA
RY
AN
DS
EC
ON
DA
RY
76.4
85.4
RU
RA
L S
EC
ON
DA
RY
75.6
80.2
Dis
tric
t One
Sco
res
Com
paris
on App
endi
x V
.3D
istr
ict O
ne
TO
TA
L =$
16,3
88,4
59
Cla
ssifi
catio
nF
Y20
12F
Y20
14
ALL
RO
AD
S82
.884
.7
INT
ER
ST
AT
E85
.989
.6
NA
TIO
NA
L H
IGH
WA
Y S
YS
TE
M86
.089
.8S
TA
TE
PR
IMA
RY
AN
DS
EC
ON
DA
RY
81.8
86.5
RU
RA
L S
EC
ON
DA
RY
83.0
80.7
Dis
tric
t Tw
o S
core
s C
ompa
rison A
ppen
dix
V.4
Dis
tric
t Tw
o
TO
TA
L =$
10,8
55,6
04
Cla
ssifi
catio
nF
Y20
12F
Y20
14
ALL
RO
AD
S72
.577
.6
INT
ER
ST
AT
E94
.696
.4
NA
TIO
NA
L H
IGH
WA
Y S
YS
TE
M89
.789
.4S
TA
TE
PR
IMA
RY
AN
DS
EC
ON
DA
RY
73.2
80.9
RU
RA
L S
EC
ON
DA
RY
68.9
72.4
Dis
tric
t Thr
ee S
core
s C
ompa
rison A
ppen
dix
V.5
Dis
tric
t Thr
ee
TO
TA
L =$
13,7
40,5
27
Cla
ssifi
catio
nF
Y20
12F
Y20
14
ALL
RO
AD
S77
.381
.5
INT
ER
ST
AT
E90
.793
.5
NA
TIO
NA
L H
IGH
WA
Y S
YS
TE
M82
.993
.8S
TA
TE
PR
IMA
RY
AN
DS
EC
ON
DA
RY
79.5
84.0
RU
RA
L S
EC
ON
DA
RY
73.8
77.5
Dis
tric
t Fou
r S
core
s C
ompa
rison A
ppen
dix
V.6
Dis
tric
t Fou
r
TO
TA
L =$
9,63
9,37
7
Cla
ssifi
catio
nF
Y20
12F
Y20
14
ALL
RO
AD
S79
.480
.3
INT
ER
ST
AT
E90
.893
.2
NA
TIO
NA
L H
IGH
WA
Y S
YS
TE
M76
.782
.0S
TA
TE
PR
IMA
RY
AN
DS
EC
ON
DA
RY
81.0
83.3
RU
RA
L S
EC
ON
DA
RY
74.8
72.9
Dis
tric
t Fiv
e S
core
s C
ompa
rison A
ppen
dix
V.7
Dis
tric
t Fiv
e
TO
TA
L =$
10,9
00,6
77
Cla
ssifi
catio
nF
Y20
12F
Y20
14
ALL
RO
AD
S80
.183
.8
INT
ER
ST
AT
E85
.895
.2
NA
TIO
NA
L H
IGH
WA
Y S
YS
TE
M87
.690
.0S
TA
TE
PR
IMA
RY
AN
DS
EC
ON
DA
RY
81.2
85.8
RU
RA
L S
EC
ON
DA
RY
76.4
77.7
Dis
tric
t Six
Sco
res
Com
paris
on
App
endi
x V
.8D
istr
ict S
ix
TO
TA
L =$
7,36
3,24
8
Cla
ssifi
catio
nF
Y20
12F
Y20
14
ALL
RO
AD
S83
.977
.4
INT
ER
ST
AT
E87
.689
.5
NA
TIO
NA
L H
IGH
WA
Y S
YS
TE
M92
.692
.2S
TA
TE
PR
IMA
RY
AN
DS
EC
ON
DA
RY
84.9
78.8
RU
RA
L S
EC
ON
DA
RY
80.0
69.1
Dis
tric
t Sev
en S
core
s C
ompa
rison A
ppen
dix
V.9
Dis
tric
t Sev
en
TO
TA
L =$
12,7
75,9
12
Cla
ssifi
catio
nF
Y20
12F
Y20
14
ALL
RO
AD
S86
.988
.4
INT
ER
ST
AT
E89
.892
.0
NA
TIO
NA
L H
IGH
WA
Y S
YS
TE
M92
.293
.0S
TA
TE
PR
IMA
RY
AN
DS
EC
ON
DA
RY
88.3
90.4
RU
RA
L S
EC
ON
DA
RY
85.1
86.6
Dis
tric
t Eig
ht S
core
s C
ompa
rison A
ppen
dix
V.1
0D
istr
ict E
ight
TO
TA
L =$
11,4
89,6
81
Cla
ssifi
catio
nF
Y20
12F
Y20
14
ALL
RO
AD
S75
.975
.3
INT
ER
ST
AT
E91
.495
.3
NA
TIO
NA
L H
IGH
WA
Y S
YS
TE
M84
.188
.2S
TA
TE
PR
IMA
RY
AN
DS
EC
ON
DA
RY
77.7
80.4
RU
RA
L S
EC
ON
DA
RY
71.2
65.5
Dis
tric
t Nin
e S
core
s C
ompa
rison A
ppen
dix
V.1
1D
istr
ict N
ine
TO
TA
L =$
10,0
93,6
13
Cla
ssifi
catio
nF
Y20
12F
Y20
14
ALL
RO
AD
S71
.883
.8
NA
TIO
NA
L H
IGH
WA
Y S
YS
TE
M86
.491
.6S
TA
TE
PR
IMA
RY
AN
DS
EC
ON
DA
RY
73.8
86.1
RU
RA
L S
EC
ON
DA
RY
65.9
78.8
Dis
tric
t Ten
Sco
res
Com
paris
on App
endi
x V
.12
Dis
tric
t Ten
TO
TA
L =$
12,0
82,2
18
Cla
ssifi
catio
nF
Y20
12F
Y20
14
ALL
RO
AD
S78
.481
.9
INT
ER
ST
AT
E93
.393
.5
NA
TIO
NA
L H
IGH
WA
Y S
YS
TE
M89
.091
.0S
TA
TE
PR
IMA
RY
AN
DS
EC
ON
DA
RY
81.8
85.2
RU
RA
L S
EC
ON
DA
RY
71.4
75.5
Dis
tric
t Ele
ven
Sco
res
Com
paris
on App
endi
x V
.13
Dis
tric
t Ele
ven
TO
TA
L =$
12,5
26,0
16
Cla
ssifi
catio
nF
Y20
12F
Y20
14
ALL
RO
AD
S74
.978
.5
NA
TIO
NA
L H
IGH
WA
Y S
YS
TE
M85
.487
.3S
TA
TE
PR
IMA
RY
AN
DS
EC
ON
DA
RY
77.4
80.9
RU
RA
L S
EC
ON
DA
RY
67.6
71.0
Dis
tric
t Tw
elve
Sco
res
Com
paris
on App
endi
x V
.14
Dis
tric
t Tw
elve
Roadway General
Rideability
Appearance
Vertical Clearance
Visual Obstructions
Fencing
Guardrail Out of Specifications
Guardrail Damage
Attenuators/Rail Ends
Pavement
Potholes
Rutting
AC
TIVI
TYA
010
SU
R-P
OT
HO
LE P
ATC
H (t
ons)
xx
xA
020
MA
CH
INE
PA
TCH
(ton
s)x
xx
xA
030
SU
RF-
AB
NO
RM
RE
P (t
ons)
xx
xx
A04
0 S
UR
F-R
EP
AIR
PC
C (s
q. ft
.)x
xx
A05
0 S
UR
FAC
E-S
PO
T S
EA
L C
OA
T (to
ns)
xx
A14
0 TO
TAL
CO
NTR
A P
ATC
H (t
ons)
xx
xA
150
VE
ND
OR
AID
ED
PA
TCH
(ton
s)x
xx
A71
0 M
ILLI
NG
-STA
TE M
AC
H (s
q. y
ds.)
xx
xA
720
MIL
LIN
G-V
EN
DO
R (s
q. y
ds.)
xx
xB
010
SH
R-P
OT
HO
LE H
OT
(tons
)x
B04
0 S
HO
ULD
ER
-SE
AL
CO
AT
(tons
)x
B02
0 S
HR
-MA
CH
PA
TCH
HO
T (to
ns)
xB
050
SH
R -
AB
NO
RM
RE
P (t
ons)
xB
110
WE
DG
PA
VE
SH
R H
OT
(tons
)B
120
BIT
ED
GE
SH
DL
(tons
)B
130
GR
AD
E S
HR
S-G
RA
SS
(Ln.
Mile
)B
140
SH
R T
BM
MA
INT
(tons
)x
B15
0 C
ON
TRA
SH
LD M
AIN
T (to
ns)
xB
210
GR
AD
E S
HO
ULD
ER
S (m
iles)
B22
0 G
RA
DE
SH
R A
DD
MA
T (to
ns)
B23
0 G
RA
DE
SH
LD U
ND
R G
R (l
inea
r foo
t)B
540
ED
GE
UN
PA
VE
D S
HD
LS (t
ons)
B99
0 M
ISC
SH
R M
AIN
T (h
ours
)C
010
RO
CK
FA
LLS
AN
D D
EB
RIS
(hou
rs)
xC
020
SLI
DE
S/S
INK
HO
LES
& D
EB
RIS
(hou
rs)
xx
C10
0 LI
TTE
R C
LNU
P E
X (h
ours
)x
C11
0 LI
TTE
R C
LEA
NU
P (
hour
s)x
C13
0 D
EA
D A
NIM
AL
(hou
rs)
xC
140
SW
EE
P (h
ours
)x
C15
0 C
ON
T-M
EC
H S
WE
EP
(mile
s)x
C19
0 C
RA
SH
CU
SH
ION
S (
each
)x
C20
0 R
EP
AIR
FE
NC
ES
(lin
ear f
oot)
xC
300
RE
P S
T B
M G
RL
(line
ar fo
ot)
xx
App
endi
x V
Roadway General
Rideability
Appearance
Vertical Clearance
Visual Obstructions
Fencing
Guardrail Out of Specifications
Guardrail Damage
Attenuators/Rail Ends
Pavement
Potholes
Rutting
AC
TIVI
TYC
330
RE
P G
R E
ND
TR
(e
ach)
xC
390
CN
TRC
T G
RA
IL (h
ours
)x
xx
C40
0 C
NTR
CT
GR
AIL
EN
(hou
rs)
xx
xE
010
TRE
E&
BR
US
H R
MV
L (h
ours
)x
xx
E02
0 G
RA
DE
R
xx
xE
030
CO
NTR
TR
EE
-BR
SH
(hou
rs)
xx
xE
110
TRE
E&
SH
RU
B M
NT
(hou
rs)
xx
xE
290
HE
RB
GR
AIL
(mile
s)x
xE
300
SP
OT
SP
RA
Y H
ER
B (a
cres
)x
xE
310
ME
CH
SP
RA
Y O
F H
(acr
es)
xx
F050
SLO
PE
MO
WIN
G
(hou
rs)
xx
xF0
80 M
OW
ER
SU
PP
OR
T (
hour
s)F0
90 H
AN
D T
RIM
/LA
WN
MO
W (h
ours
)x
xF3
10 M
OW
-STA
TE F
OR
CE
(acr
es)
xx
F320
MO
W-C
ON
TRA
CT
(h
ours
)x
xJ0
10 H
AN
D C
LN C
ULV
RT
(eac
h)J0
20 M
AC
H C
LN C
ULV
RT
(eac
h)J0
30 R
PR
CU
LV/P
IPE
(eac
h)J0
70 P
VT
EN
T M
AIN
T (e
ach)
J110
SLO
PE
PR
OTE
CT
(tons
)J1
50 C
ON
TRA
CT
DR
NG
E (h
ours
)J2
10 D
ITC
H W
/ GR
AD
E (m
iles)
J230
SP
T D
CH
BO
OM
EQ
(mile
s)J3
10 P
AV
/ RO
CK
DTC
H (l
inea
r foo
t)J3
20 C
LN D
RA
IN C
HN
L (h
ours
)T0
10 C
ON
TRA
CT
4" Y
ELL
OW
STR
IP (l
inea
r foo
t)x
T020
S.F
. 4" Y
ELL
OW
STR
IPIN
G (l
inea
r foo
t)x
T030
S.F
. 4" W
HIT
E S
TRIP
ING
(lin
ear f
oot)
xT0
40 H
AN
D P
VM
T M
AR
K (h
ours
)x
T050
HA
ND
PV
MT
PA
INT
(hou
rs)
xT0
60 R
AIS
ED
PV
MT
MR
K (e
ach)
xT1
10 P
NT
LNE
&E
DG
LN
E (m
iles)
xT2
00 P
LCM
NT
SH
T S
IG (e
ach)
xT2
10 R
PLC
SIG
N &
DE
L (e
ach)
xT2
40 S
IGN
MN
T (e
ach)
xT2
50 M
NT
PA
NE
L S
IGN
S (e
ach)
x
App
endi
x V
AC
TIVI
TYA
010
SU
R-P
OT
HO
LE P
ATC
H (t
ons)
A02
0 M
AC
HIN
E P
ATC
H (t
ons)
A03
0 S
UR
F-A
BN
OR
M R
EP
(ton
s)A
040
SU
RF-
RE
PA
IR P
CC
(sq.
ft.)
A05
0 S
UR
FAC
E-S
PO
T S
EA
L C
OA
T (to
ns)
A14
0 TO
TAL
CO
NTR
A P
ATC
H (t
ons)
A15
0 V
EN
DO
R A
IDE
D P
ATC
H (t
ons)
A71
0 M
ILLI
NG
-STA
TE M
AC
H (s
q. y
ds.)
A72
0 M
ILLI
NG
-VE
ND
OR
(sq.
yds
.)B
010
SH
R-P
OT
HO
LE H
OT
(tons
)B
040
SH
OU
LDE
R-S
EA
L C
OA
T (to
ns)
B02
0 S
HR
-MA
CH
PA
TCH
HO
T (to
ns)
B05
0 S
HR
- A
BN
OR
M R
EP
(ton
s)B
110
WE
DG
PA
VE
SH
R H
OT
(tons
)B
120
BIT
ED
GE
SH
DL
(tons
)B
130
GR
AD
E S
HR
S-G
RA
SS
(Ln.
Mile
)B
140
SH
R T
BM
MA
INT
(tons
)B
150
CO
NTR
A S
HLD
MA
INT
(tons
)B
210
GR
AD
E S
HO
ULD
ER
S (m
iles)
B22
0 G
RA
DE
SH
R A
DD
MA
T (to
ns)
B23
0 G
RA
DE
SH
LD U
ND
R G
R (l
inea
r foo
t)B
540
ED
GE
UN
PA
VE
D S
HD
LS (t
ons)
B99
0 M
ISC
SH
R M
AIN
T (h
ours
)C
010
RO
CK
FA
LLS
AN
D D
EB
RIS
(hou
rs)
C02
0 S
LID
ES
/SIN
KH
OLE
S &
DE
BR
IS (h
ours
)C
100
LITT
ER
CLN
UP
EX
(hou
rs)
C11
0 LI
TTE
R C
LEA
NU
P (
hour
s)C
130
DE
AD
AN
IMA
L (h
ours
)C
140
SW
EE
P (h
ours
)C
150
CO
NT-
ME
CH
SW
EE
P (m
iles)
C19
0 C
RA
SH
CU
SH
ION
S (
each
)C
200
RE
PA
IR F
EN
CE
S (l
inea
r foo
t)C
300
RE
P S
T B
M G
RL
(line
ar fo
ot)
Shoulders
Pavement Drop-Off to Shoulder
Shoulder Drop-Off to Ground
High Shoulder
Shoulder Potholes
Drainage
Drainage Structures
Ditches
Curb and Gutter
Traffic
White Stripe Reflectivity
Yellow Stripe Reflectivity
Guide Signs
Guide Sign Assemblies
Warning Signs
Warning Sign Assemblies
x
xx
xx
xx
x xx
xx
xx
xx
xx
xx
xx
xx
xx
xx
xx
xx
x
App
endi
x V
AC
TIVI
TYC
330
RE
P G
R E
ND
TR
(e
ach)
C39
0 C
NTR
CT
GR
AIL
(hou
rs)
C40
0 C
NTR
CT
GR
AIL
EN
(hou
rs)
E01
0 TR
EE
&B
RU
SH
RM
VL
(hou
rs)
E02
0 G
RA
DE
R
E03
0 C
ON
TR T
RE
E-B
RS
H (h
ours
)E
110
TRE
E&
SH
RU
B M
NT
(hou
rs)
E29
0 H
ER
B G
RA
IL (m
iles)
E30
0 S
PO
T S
PR
AY
HE
RB
(acr
es)
E31
0 M
EC
H S
PR
AY
OF
H (a
cres
)F0
50 S
LOP
E M
OW
ING
(h
ours
)F0
80 M
OW
ER
SU
PP
OR
T (
hour
s)F0
90 H
AN
D T
RIM
/LA
WN
MO
W (h
ours
)F3
10 M
OW
-STA
TE F
OR
CE
(acr
es)
F320
MO
W-C
ON
TRA
CT
(h
ours
)J0
10 H
AN
D C
LN C
ULV
RT
(eac
h)J0
20 M
AC
H C
LN C
ULV
RT
(eac
h)J0
30 R
PR
CU
LV/P
IPE
(eac
h)J0
70 P
VT
EN
T M
AIN
T (e
ach)
J110
SLO
PE
PR
OTE
CT
(tons
)J1
50 C
ON
TRA
CT
DR
NG
E (h
ours
)J2
10 D
ITC
H W
/ GR
AD
E (m
iles)
J230
SP
T D
CH
BO
OM
EQ
(mile
s)J3
10 P
AV
/ RO
CK
DTC
H (l
inea
r foo
t)J3
20 C
LN D
RA
IN C
HN
L (h
ours
)T0
10 C
ON
TRA
CT
4" Y
ELL
OW
STR
IP (l
inea
r foo
t)T0
20 S
.F. 4
" YE
LLO
W S
TRIP
ING
(lin
ear f
oot)
T030
S.F
. 4" W
HIT
E S
TRIP
ING
(lin
ear f
oot)
T040
HA
ND
PV
MT
MA
RK
(hou
rs)
T050
HA
ND
PV
MT
PA
INT
(hou
rs)
T060
RA
ISE
D P
VM
T M
RK
(eac
h)T1
10 P
NT
LNE
&E
DG
LN
E (m
iles)
T200
PLC
MN
T S
HT
SIG
(eac
h)T2
10 R
PLC
SIG
N &
DE
L (e
ach)
T240
SIG
N M
NT
(eac
h)T2
50 M
NT
PA
NE
L S
IGN
S (e
ach)
Shoulders
Pavement Drop-Off to Shoulder
Shoulder Drop-Off to Ground
High Shoulder
Shoulder Potholes
Drainage
Drainage Structures
Ditches
Curb and Gutter
Traffic
White Stripe Reflectivity
Yellow Stripe Reflectivity
Guide Signs
Guide Sign Assemblies
Warning Signs
Warning Sign Assemblies
xx
xx
xx
xx x
xx
xx
xx x
xx
x xx x
xx
xx
xx
xx
xx
xx
xx
xx
xx
xx
x
App
endi
x V
2014 Maintenance Rating Program Report
Kentucky Transportation Cabinet
APPENDIX VI
Inspection Features
Appendix VI includes an example of the current inspection form used in data collection. The table in Appendix VI explains the data collection of each inspection feature of the Maintenance Rating Program and how that data is converted into scoring for the report.
Maintenance Inspection Date: _____________ Rating Program Evaluation Team: ______________
Inspection Form
01-0001 Wave 19 Summer 2009District 01 County:
LIVINGSTON Route: I -24
Mile Point: 030.563
Dir: E
Number of Lanes: 4 Surface: AC AADT: 28500 Median: Earth Shoulder:AC Lane Width: 12 Category: Interstates/Expressways Median Width: 48 Shoulder Width: 10
r2 – Is there roadway or shoulder with less than 15' vertical clearance? (2) Y Nr3 – Are there visual obstructions of intersections, curves or signs, etc.? (3) Y N
r4 – Is there right-of-way fencing? (4) Y Nr5 – Is there fence not providing a positive barrier? (5) Y N
r6 – Is there guardrail? (6) Y Nr7 – Is there guardrail outside height specifications (25" to 29")? (7) Y Nr8 – Is there guardrail with post or accident damage? (8) Y Nr9 - Number of guardrail attenuators/rail ends (9)
r10 - Number of attenuators/rail ends damaged (10)
p1 - Number of pavement potholes 6" long, 6" wide and 1" deep or larger (maximum = 20) (11)
p2 - Rutting - Outside wheel path at 0 feet (circle one) Greater than ¼” Less than or equal to ¼”
p3 - Rutting - Outside wheel path at 100 feet (circle one) Greater than ¼” Less than or equal to ¼”
s1 – Is there pavement dropoff to shoulder greater than or equal to 1.5"? (14) Y Ns2 – Is there shoulder dropoff to ground greater than or equal to 3.0"? (15) Y Ns3 – Is there high shoulder? (16) Y Ns4 - Number of shoulder potholes 6" x 6" x 1" or larger (maximum = 20) (17)
d1 - Number of drainage structures (do not include entrance pipes) (18)
d2 – Number of drainage structures with 25% or greater flow inhibited (19)
d3 – Are there ditches? (20) Y Nd4 – Are there ditches with flow inhibited? (include any blocked entrance pipes here) (21) Y Nd5 – Are there curbs and gutters? (22) Y Nd6 – Are there curbs and gutters with flow inhibited? (23) Y N
t8 - Number of guide signs not conforming with sign face specifications (damaged sign face, faded, vandalized, etc) (31)
t9 - Number of guide sign assemblies (32)
t10 - Number of guide sign assemblies not conforming with specifications (33)
t11 - Number of warning and regulatory signs (34)
t12 - Number of warning and regulatory signs not conforming with sign face specifications (damaged sign face, faded, vandalized, etc.) (35)
t13 - Number of warning and regulatory sign assemblies (36)
t14 - Number of warning and regulatory sign assemblies not conforming with specifications (37)
Comments:
Appendix VI
Explanation and Score Equivalence of Inspection Features Inspection Features Explanation Score MRP Score
International Roughness Index A measure that indicates smoothness and ride quality for the highway user. Note: Weighting used in sampling scheme may create variances between the MRP rideability indices and those reported for the entire population.
51 or less
52 - 90
91-129
130 – 167
168+
90 +
80 – 89.9
70 – 79.9
60 – 69.9
59.9 and below Appearance The general visual character
(height of grass, litter, unsightly patching, etc.) of the roadway and roadside as it would be seen by the public.
100% acceptable
80%
60%
100
80
60 Vertical Clearance Roadways and shoulders are free
of any canopy (trees or other vegetation) or other obstructions for a minimum height of 15 feet.
etc. cause horizontal or vertical visual obstructions of intersections, curves, signs, oncoming lanes, etc.
0% obstructed
20%
40%
100
80
60
Fencing Providing Effective Barriers
Fencing provides an effective barrier on limited access highways (Interstate, Parkways, or other highways) to deny access to people or animals. Segments with no fencing are not included in the sample.
100% effective
80%
60%
100
80
60
Guardrail Within Height Specifications
The height is at least 25 inches and not more than 29 inches.
100% in spec
80%
60%
100
80
60
Guardrail Fully Functional
Guardrails have not been damaged due to vehicular hits or other factors.
100% in spec
80%
60%
100
80
60
Appendix VI
Inspection Features Explanation Score MRP Score Attenuators/End Treatments Undamaged
Attenuators / End Treatments have not been damaged due to vehicular hits or other factors.
100% undamaged
80%
60%
100
80
60 Pavement Potholes A bowl shaped hole of various
sizes in the pavement surface. The surface may have broken into small pieces due to cracking or localized disintegration and the material removed by traffic. A pothole has a minimum size of 6”x6”x1”.
0 failed sections
10%
20%
40%
100
75
50
0
Rutting A surface depression of pavement in the wheel paths. Ruts may be more noticeable after a rainfall when wheel paths are full with water.
0% have ruts larger than ¼”
20%
40%
100
80
60
Pavement Drop-off to Shoulder
Occurs whenever there is a decrease in elevation between the traffic lane and the shoulder. It may be due to consolidation, displacement or settlement of underlying material.
0% have drop-off larger than 1.5”
20%
40%
100
80
60
Shoulder Drop-off to Ground An elevation difference between the improved shoulder and adjacent ground at the outside edge of the shoulder. It could be due to consolidation of material, erosion, run off or other factors.
0% have drop-off larger than 3”
20%
40%
100
80
60
High Shoulder The opposite of pavement drop-off to shoulder. Frost heave, swelling soils or other factors can cause it. High shoulder creates ponding of water on pavement.
0% unacceptable
20%
40%
100
80
60
Shoulder Potholes A bowl shaped hole or depression in the shoulder surface. The surface may have broken into small pieces due to the cracking or localized disintegration and the material removed by traffic. A shoulder pothole has a minimum size of 6”x6”x1”.
0% failed sections
10%
20%
40%
100
75
50
0
Appendix VI
Inspection Features Explanation Score MRP Score Drainage Structures Drainage structures like pipes and
culverts that are free of any degree of obstruction and are in good working order. Drainage structures obstructed more than 25% fail.
100% acceptable
80%
60%
100
80
60
Ditches Ditches on the side of the road with water flow not obstructed by dirt, rock, debris, or other items or by structural damage.
0% blockage
20%
40%
100
80
60
Curbs and Gutters Curbs and gutters with water flow not obstructed by blockage or damage.
0% blockage
20%
40%
100
80
60
White Striping Reflectivity Measures night reflectivity of striping that provides positive guidance to motorists. Measurements equal to or exceeding 125 from retro-reflectometer pass.
100% acceptable
80%
60%
100
80
60
Yellow Striping Reflectivity Measures night reflectivity of striping that provides positive guidance to motorists. Measurements equal to or exceeding 80 from retro-reflectometer pass.
100% acceptable
80%
60%
100
80
60
Guide Sign Faces Includes route markers (cardinal directions, route numbers, arrows), distance/destination signs, and directions signs. (Green, brown or blue backgrounds). The standard is no visible defects that detract from effectiveness under nighttime conditions.
100% in spec
90%
80%
100
80
60
Guide Sign Assemblies Guide signs mounted according to specifications including: not leaning more than 22.5 degrees in either direction, no bolts or rivets missing, not turned more than 45 degrees from the line of sight, etc.
100% in spec
90%
80%
100
80
60
Appendix VI
Inspection Features Explanation Score MRP Score Warning and Regulatory Sign Faces Meeting Specifications
No visible defects that detract from sign face effectiveness under nighttime conditions. Includes red and white backgrounds (STOP, WRONG WAY, DO NOT ENTER, speed limit, etc.) and yellow backgrounds (STOP AHEAD, curve warning signs, chevrons, etc).
100% in spec
90%
80%
100
80
60
Warning and Regulatory Sign Assemblies
Warning and regulatory signs mounted according to specifications, including: not leaning more than 22.5 degrees in any direction, no bolts or rivets missing, not turned more than 45 degrees from the line of sight, etc.
100% in spec
90%
80%
100
80
60
Note: Scores for features were calculated only in segments where features were present at least nineteen times to give statistically valid results. If the feature occurred less than nineteen times, “N/A” was entered. However, it was still used for calculating weighted totals such as District Totals (including all road types), Road Type Totals (including all districts), and State Totals (including all road types and all districts).