TARGETING POLICIES TO RESPOND TO FOOD INSECURITY SHOCK SUDARNO SUMARTO NATIONAL TEAM FOR THE ACCELERATION OF POVERTY REDUCTION (TNP2K) AND SMERU OECD-ASEAN Regional Conference on Policies for Food Security Bogor, 11 November 2014
Transcript
TARGETING POLICIES TO RESPOND TO FOOD INSECURITY SHOCK
SUDARNO SUMARTO
NATIONAL TEAM FOR THE ACCELERATION OF POVERTY REDUCTION (TNP2K)
AND SMERU
OECD-ASEAN Regional Conference on Policies for Food SecurityBogor, 11 November 2014
Outline
Food Security in Indonesia : Situation and its Challenges
Impact of Food Insecurity Shocks Targeting Policy to Address Food Insecurity Shocks
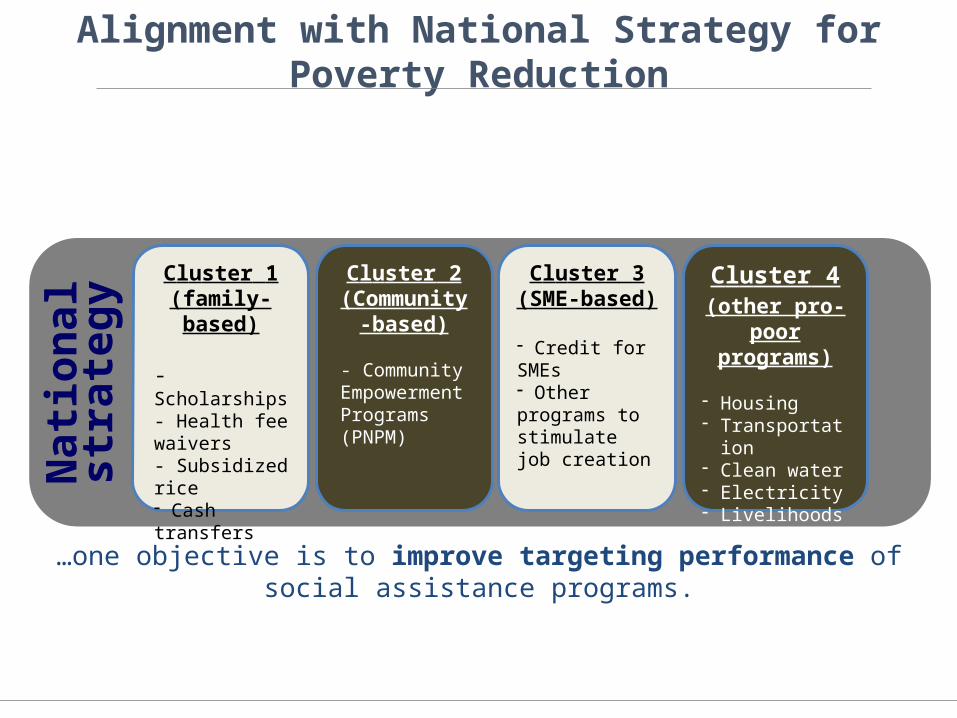
Food Security in Indonesia : Situation and Challenges
Food Availability
• Out of four (4) strategic food commodities, self-sufficiency only in rice production (sometimes imported to sustain seasonal shocks)
• Others still need to be supported by imports
• Still categorized as “serious” in 2014 Global Hunger Index
• Land conversion continues to increase
• Low agricultural productivity
• Decreasing agricultural labor force
2010 2011 2012 20130
20
40
60
80
100
120
Productivity: Agricultural Vs Other Sectors
Agriculture Sector Other Sectors
Rp M
illio
n/Pe
rson
Source: BPS, 2010-2013
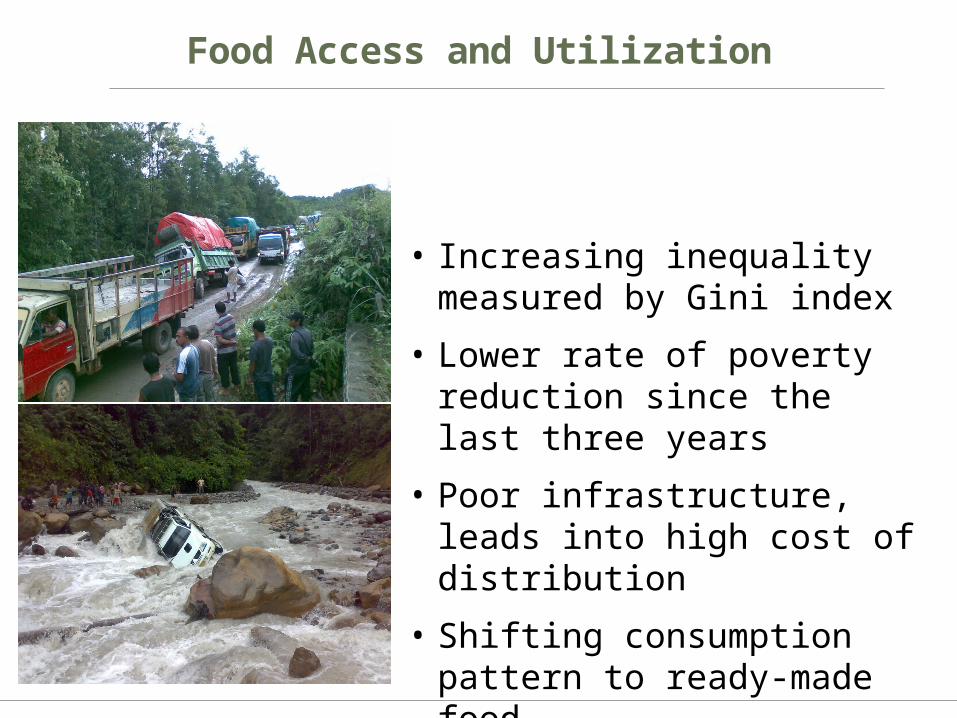
Food Access and Utilization
• Increasing inequality measured by Gini index
• Lower rate of poverty reduction since the last three years
• Poor infrastructure, leads into high cost of distribution
• Shifting consumption pattern to ready-made food
• Food price volatility
Impact of Food Insecurity Shocks
Indonesia: 3 Large Food Price Shocks in Last 6 Years
• 74% of their expenditure goes toward food
• A 10% increase in price of rice leads to a 0.4 percentage point increase in CPI inflation (direct) and a total impact (direct and indirect) of a 0.9 percentage points increase on CPI inflation.
• A 10% increase in the price of rice is estimated to lead to a 1.3 percentage point increase in poverty rates.
Source: BPS, SUSENAS MARCH 2014
Food price increases directly impact poor and vulnerable households
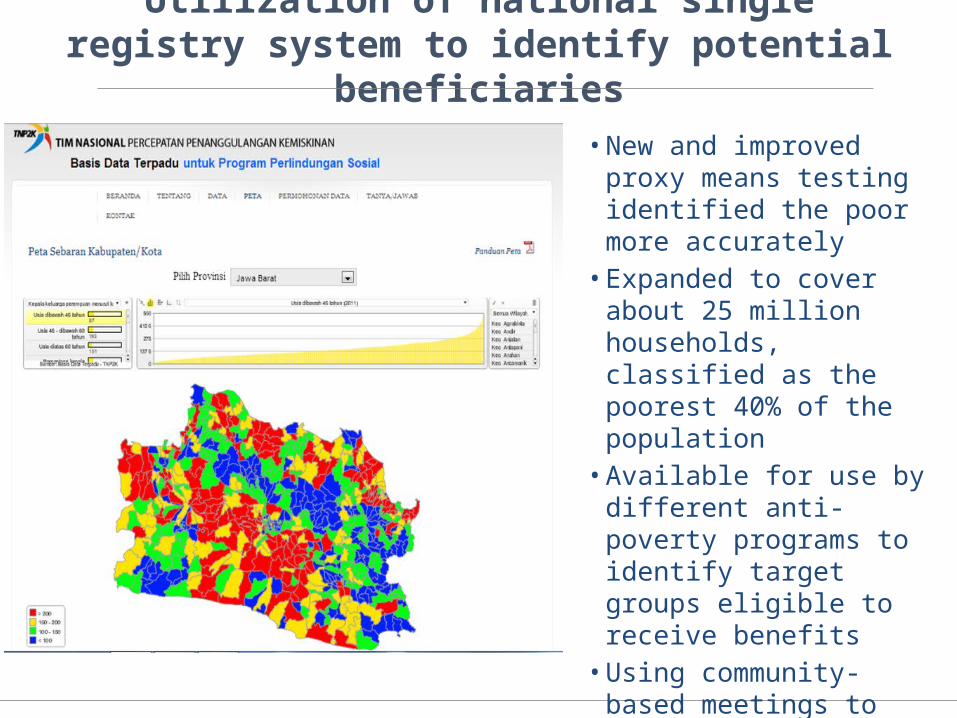
Utilization of national single registry system to identify potential beneficiaries
• New and improved proxy means testing identified the poor more accurately
• Expanded to cover about 25 million households, classified as the poorest 40% of the population
• Available for use by different anti-poverty programs to identify target groups eligible to receive benefits
• Using community-based meetings to update targeting lists to address exclusion errors
• In June 2013 the Government of Indonesia issued the Social Protection Card (KPS) to grant access to social assistance programs.
• Cards were delivered to the poorest 25% households in Indonesia (based on the national registry which covers about 65 million individuals)
• Cards give access to: Subsidized rice allocations (Raskin) Scholarships for the poor (BSM) Unconditional cash transfers
…which has been strengthened by Issuing Social Protection Card (KPS)
and it has an updating mechanism
PT. Pos
HouseholdsVillage LevelDeliberation
Recapitalization
TNP2K’s Unified Database
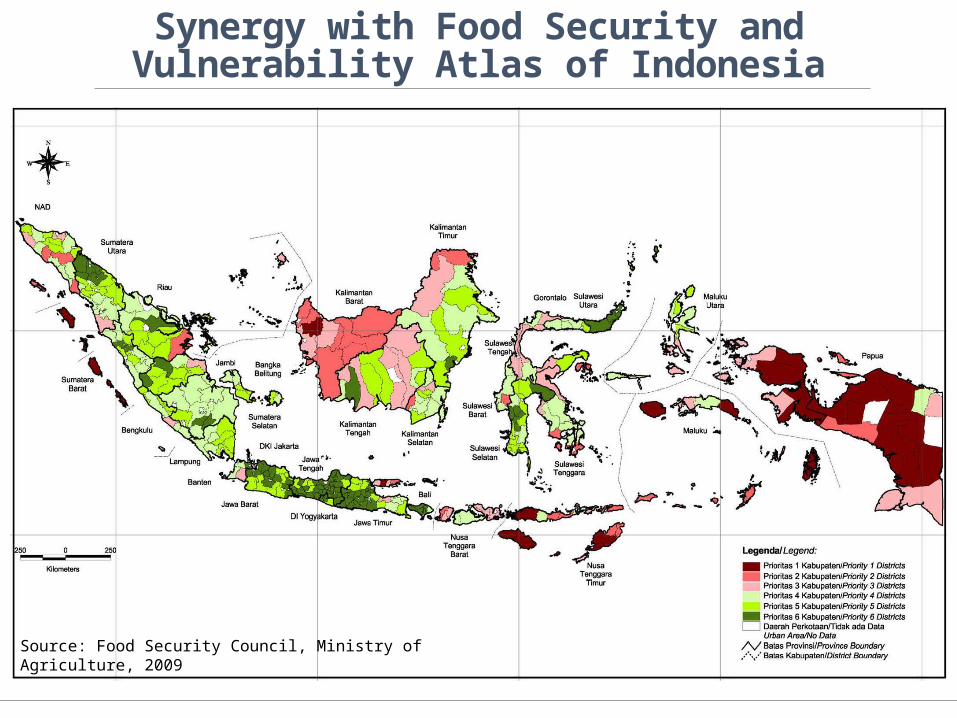
Synergy with Food Security and Vulnerability Atlas of Indonesia
Source: Food Security Council, Ministry of Agriculture, 2009
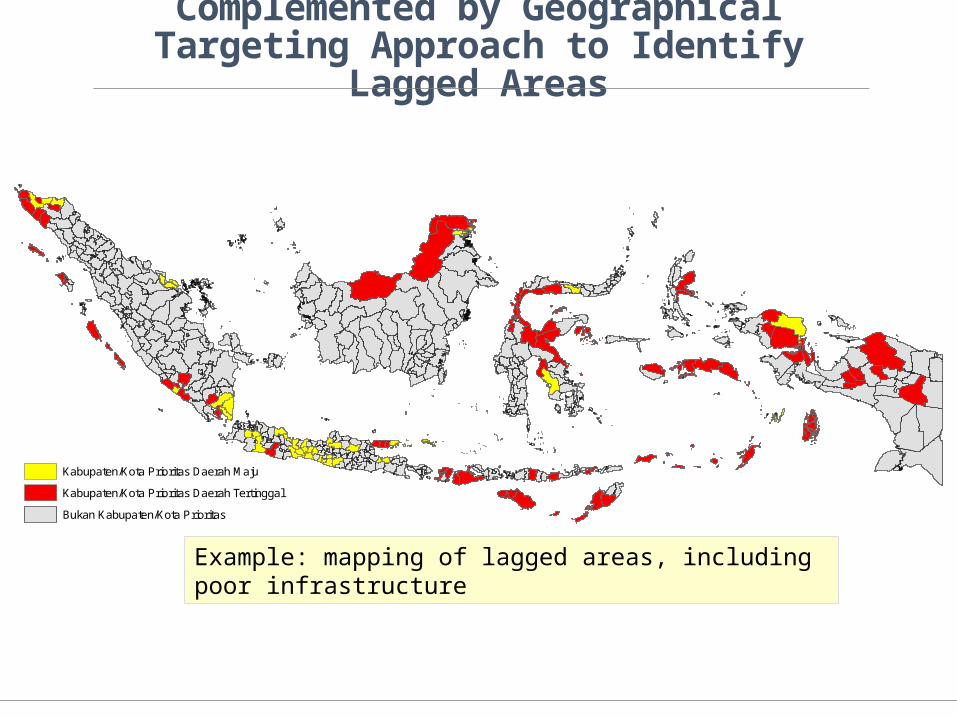
Complemented by Geographical Targeting Approach to Identify Lagged Areas
Kabupaten/Kota Prioritas Daerah Maju
Kabupaten/Kota Prioritas Daerah Tertinggal
Bukan Kabupaten/Kota Prioritas
Example: mapping of lagged areas, including poor infrastructure
…And Other Indicators, Such as Nutrition
Example of targeting prioritization based on stunting levels (>40%) and poverty level (>11.47%)
Source: SMERU, 2014
Conclusion and the Way Forward
The National Single Registry is the main and best available source for identifying poor and vulnerable households.
It has to be maintained to ensure it reflects the most current socio-economic status of the households
Synergy and combination with other targeting approaches will result in optimal outcomes for any budget constraints
Targeting is only part of comprehensive response to food insecurity shocks. There are other components which need to be taken into account, such as;
• Development of pre-determined triggers• Development of a real-time reliable information system• Development of a well-designed monitoring system• Designing effective public communication, information dissemination and
policy coordination• Improving and expanding social assistance programs• Improving supply-side service delivery