- 7 - TATA STEEL (THAILAND) PUBLIC COMPANY LIMITED AND ITS SUBSIDIARIES NOTES TO THE FINANCIAL STATEMENTS FOR THE YEAR ENDED MARCH 31, 2016 1. GENERAL INFORMATION AND THE OPERATION OF THE COMPANY Tata Steel (Thailand) Public Company Limited (“the Company” or “the parent company”) is incorporated in Thailand and has its registered office at Rasa Tower 2, 20th Floor, 555 Phaholyothin Road, Chatuchak Sub district, Chatuchak District, Bangkok with the objective to invest in other companies and provide management services and the Company has been listed on the Stock Exchange of Thailand since November 2002. The major shareholder (hold 67.90%) is T S Global Holdings Pte. Ltd. (Formerly Tata Steel Global Holdings Pte. Ltd.) which is incorporated in Singapore and is an affiliate of Tata Steel Limited, a listed company incorporated under the law of India and is one of the largest integrated steel manufacturers in India with a strong global customer base. The Company has three subsidiaries (“the Group”) which were incorporated in Thailand, that manufacture, render a manufacturing service, distribute and trading of steel bars, wire rods and small section products. Sales of the subsidiaries are mainly local sales contributing 90% and 93% of the total sales for the years ended March 31, 2016 and 2015, respectively. Details of the Company’s subsidiaries are as follows: Type of business Shareholding (%) As at As at March 31, March 31, 2016 2015 The Siam Iron and Steel (2001) Company Limited Manufacture wire rods 99.99 99.99 and small section products The Siam Construction Steel Company Limited Manufacture steel bars 99.99 99.99 N.T.S. Steel Group Public Company Limited Manufacture, render a manufacturing service, 99.76 99.76 distribution and trading of steel bars, wire rods and small section products The Company has extensive transactions and relationships with the major shareholder and related parties. Accordingly, the financial statements may not necessarily be indicative of the conditions that would have existed or the results of operations that would have occurred if the Company had operated without such affiliations. As at March 31, 2016 and 2015, N.T.S. Steel Group Public Company Limited (“N.T.S.”) has total current liabilities exceeding total current assets by Baht 3,010 million and Baht 3,021 million, respectively. However, the amount of current liabilities included the short-term borrowing from the parent company of Baht 2,166 million and Baht 2,478 million, respectively. The parent company will continue its financial support to N.T.S. to enable N.T.S. to continue its operations satisfactorily at least for the next 12 months from the statement of financial position date and the Group’s management has prepared the business plan including initiatives to improve operation and financial results of N.T.S.
Transcript
- 7 -
TATA STEEL (THAILAND) PUBLIC COMPANY LIMITED AND ITS SUBSIDIARIES
NOTES TO THE FINANCIAL STATEMENTS
FOR THE YEAR ENDED MARCH 31, 2016
1. GENERAL INFORMATION AND THE OPERATION OF THE COMPANY
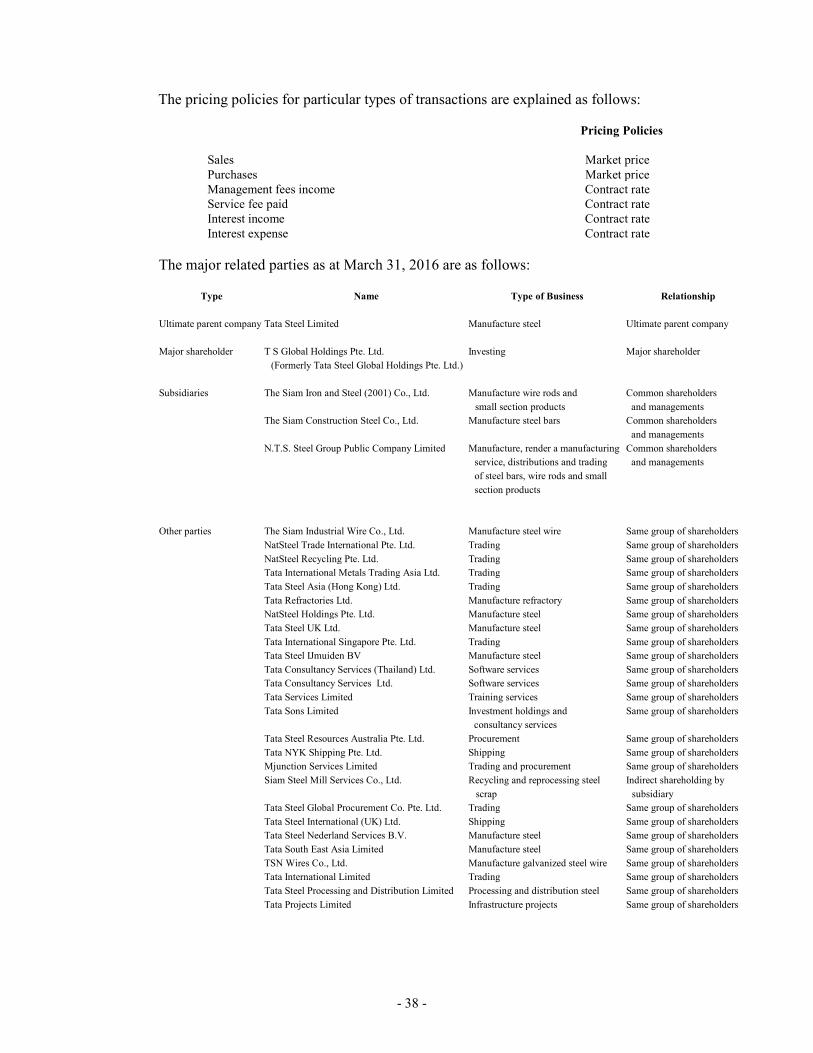
Tata Steel (Thailand) Public Company Limited (“the Company” or “the parent company”)
is incorporated in Thailand and has its registered office at Rasa Tower 2, 20th Floor, 555
Phaholyothin Road, Chatuchak Sub district, Chatuchak District, Bangkok with the objective
to invest in other companies and provide management services and the Company has been
listed on the Stock Exchange of Thailand since November 2002. The major shareholder
(hold 67.90%) is T S Global Holdings Pte. Ltd. (Formerly Tata Steel Global Holdings
Pte. Ltd.) which is incorporated in Singapore and is an affiliate of Tata Steel Limited, a
listed company incorporated under the law of India and is one of the largest integrated
steel manufacturers in India with a strong global customer base.
The Company has three subsidiaries (“the Group”) which were incorporated in Thailand, that
manufacture, render a manufacturing service, distribute and trading of steel bars, wire
rods and small section products. Sales of the subsidiaries are mainly local sales contributing
90% and 93% of the total sales for the years ended March 31, 2016 and 2015, respectively.
Details of the Company’s subsidiaries are as follows:
Type of business Shareholding
(%)
As at As at
March 31, March 31,
2016 2015
The Siam Iron and Steel (2001) Company Limited Manufacture wire rods 99.99 99.99
and small section products
The Siam Construction Steel Company Limited Manufacture steel bars 99.99 99.99
N.T.S. Steel Group Public Company Limited Manufacture, render a manufacturing service, 99.76 99.76
distribution and trading of steel bars,
wire rods and small section products
The Company has extensive transactions and relationships with the major shareholder and
related parties. Accordingly, the financial statements may not necessarily be indicative of
the conditions that would have existed or the results of operations that would have
occurred if the Company had operated without such affiliations.
As at March 31, 2016 and 2015, N.T.S. Steel Group Public Company Limited (“N.T.S.”)
has total current liabilities exceeding total current assets by Baht 3,010 million and Baht 3,021
million, respectively. However, the amount of current liabilities included the short-term
borrowing from the parent company of Baht 2,166 million and Baht 2,478 million, respectively.
The parent company will continue its financial support to N.T.S. to enable N.T.S. to continue
its operations satisfactorily at least for the next 12 months from the statement of financial
position date and the Group’s management has prepared the business plan including initiatives
to improve operation and financial results of N.T.S.
- 8 -
2. BASIS FOR PREPARATION AND PRESENTATION OF THE CONSOLIDATED AND
THE SEPARATE FINANCIAL STATEMENTS
2.1 The Company and its subsidiaries maintain its accounting records in Thai Baht
and prepare its statutory financial statements in the Thai language in conformity
with Thai Financial Reporting Standards and accounting practices generally
accepted in Thailand.
2.2 The Company’s financial statements have been prepared in accordance with the
Thai Accounting Standard (TAS) No. 1 (Revised 2014) “Presentation of Financial
Statements”, and the Regulation of The Stock Exchange of Thailand (SET) dated
January 22, 2001, regarding the preparation and submission of financial statements
and reports for the financial position and results of operations of the listed companies
B.E. 2544 and the Notification of the Department of Business Development dated
September 28, 2011 regarding “The Brief Particulars in the Financial Statements
B.E. 2554”.
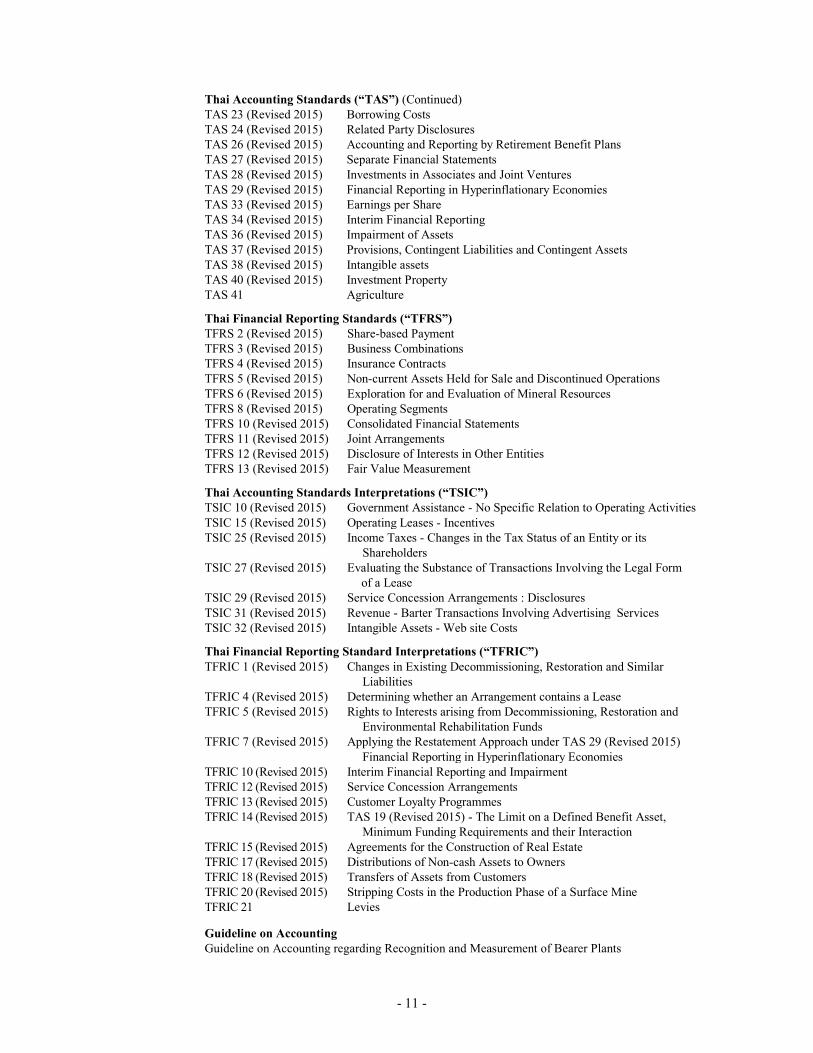
2.3 Since April 1, 2015, the Group adopted the new and revised Thai Financial Reporting
Standards (“TFRSs”) issued by the Federation of Accounting Professions, which are
effective for the financial statements for the accounting periods beginning on or after
January 1, 2015 onwards, in the preparation and presentation of the financial
statements as follows:
Thai Accounting Standards (“TAS”)
TAS 1 (Revised 2014) Presentation of Financial Statements
TAS 2 (Revised 2014) Inventories
TAS 7 (Revised 2014) Statement of Cash Flows
TAS 8 (Revised 2014) Accounting Policies, Changes in Accounting Estimates and Errors
TAS 10 (Revised 2014) Events after the Reporting Period
TAS 11 (Revised 2014) Construction Contracts
TAS 12 (Revised 2014) Income Taxes
TAS 16 (Revised 2014) Property, Plant and Equipment
TAS 17 (Revised 2014) Leases
TAS 18 (Revised 2014) Revenue
TAS 19 (Revised 2014) Employee Benefits
TAS 20 (Revised 2014) Accounting for Government Grants and Disclosure of Government Assistance
TAS 21 (Revised 2014) The Effects of Changes in Foreign Exchange Rates
TAS 23 (Revised 2014) Borrowing Costs
TAS 24 (Revised 2014) Related Party Disclosures
TAS 26 (Revised 2014) Accounting and Reporting by Retirement Benefit Plans
TAS 27 (Revised 2014) Separate Financial Statements
TAS 28 (Revised 2014) Investments in Associates and Joint Ventures
TAS 29 (Revised 2014) Financial Reporting in Hyperinflationary Economies
TAS 33 (Revised 2014) Earnings per Share
TAS 34 (Revised 2014) Interim Financial Reporting
TAS 36 (Revised 2014) Impairment of Assets
TAS 37 (Revised 2014) Provisions, Contingent Liabilities and Contingent Assets
TAS 38 (Revised 2014) Intangible assets
TAS 40 (Revised 2014) Investment Property
Thai Financial Reporting Standards (“TFRS”)
TFRS 2 (Revised 2014) Share-based Payments
TFRS 3 (Revised 2014) Business Combinations
TFRS 5 (Revised 2014) Non-current Assets Held for Sale and Discontinued Operations
TFRS 6 (Revised 2014) Exploration for and Evaluation of Mineral Assets
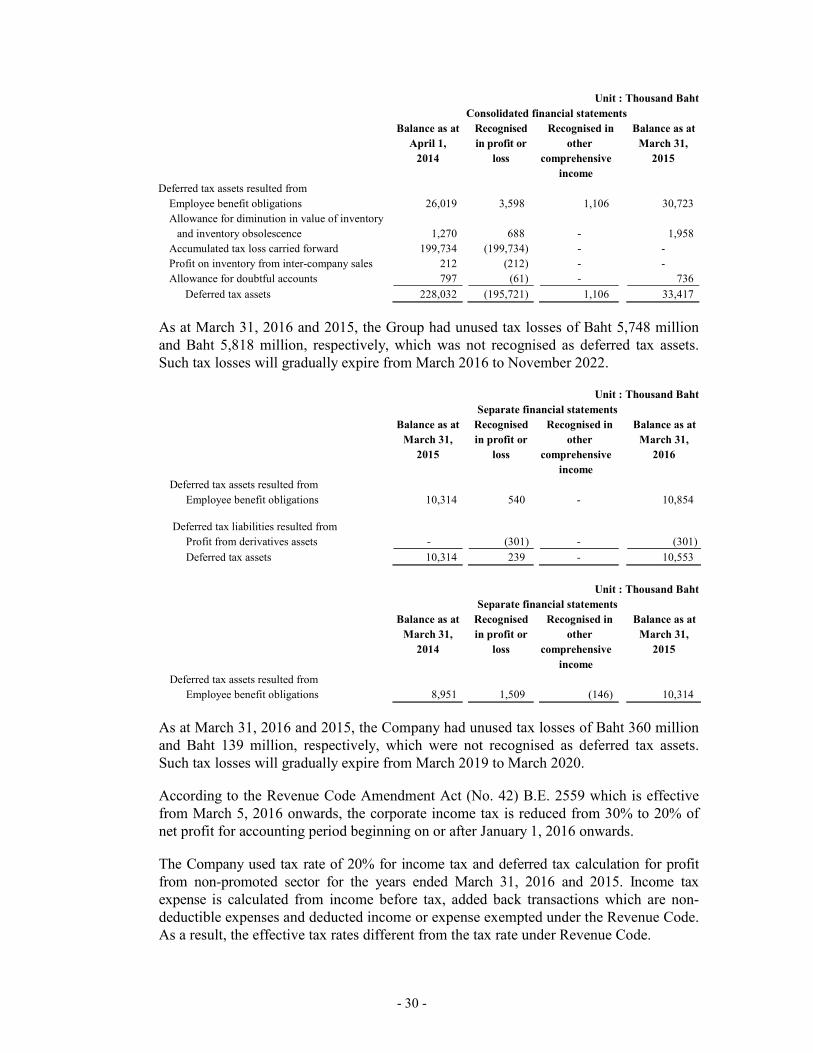
As at March 31, 2016 and 2015, the Company had unused tax losses of Baht 360 million
and Baht 139 million, respectively, which were not recognised as deferred tax assets.
Such tax losses will gradually expire from March 2019 to March 2020.
According to the Revenue Code Amendment Act (No. 42) B.E. 2559 which is effective
from March 5, 2016 onwards, the corporate income tax is reduced from 30% to 20% of
net profit for accounting period beginning on or after January 1, 2016 onwards.
The Company used tax rate of 20% for income tax and deferred tax calculation for profit
from non-promoted sector for the years ended March 31, 2016 and 2015. Income tax
expense is calculated from income before tax, added back transactions which are non-
deductible expenses and deducted income or expense exempted under the Revenue Code.
As a result, the effective tax rates different from the tax rate under Revenue Code.
- 31 -
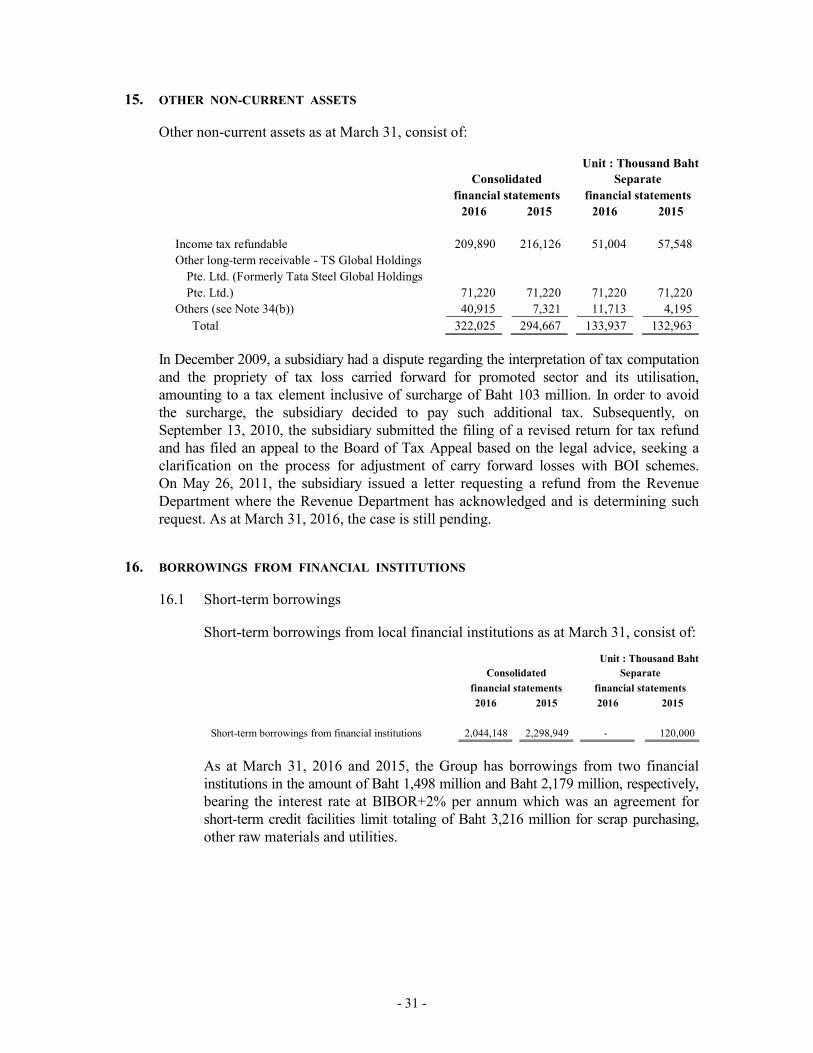
15. OTHER NON-CURRENT ASSETS
Other non-current assets as at March 31, consist of:
Unit : Thousand Baht
Consolidated Separate
financial statements financial statements
2016 2015 2016 2015
Income tax refundable 209,890 216,126 51,004 57,548
Other long-term receivable - TS Global Holdings
Pte. Ltd. (Formerly Tata Steel Global Holdings
Pte. Ltd.) 71,220 71,220 71,220 71,220
Others (see Note 34(b)) 40,915 7,321 11,713 4,195
Total 322,025 294,667 133,937 132,963
In December 2009, a subsidiary had a dispute regarding the interpretation of tax computation
and the propriety of tax loss carried forward for promoted sector and its utilisation,
amounting to a tax element inclusive of surcharge of Baht 103 million. In order to avoid
the surcharge, the subsidiary decided to pay such additional tax. Subsequently, on
September 13, 2010, the subsidiary submitted the filing of a revised return for tax refund
and has filed an appeal to the Board of Tax Appeal based on the legal advice, seeking a
clarification on the process for adjustment of carry forward losses with BOI schemes.
On May 26, 2011, the subsidiary issued a letter requesting a refund from the Revenue
Department where the Revenue Department has acknowledged and is determining such
request. As at March 31, 2016, the case is still pending.
16. BORROWINGS FROM FINANCIAL INSTITUTIONS
16.1 Short-term borrowings
Short-term borrowings from local financial institutions as at March 31, consist of:
Unit : Thousand Baht
Consolidated Separate
financial statements financial statements
2016 2015 2016 2015
Short-term borrowings from financial institutions 2,044,148 2,298,949 - 120,000
As at March 31, 2016 and 2015, the Group has borrowings from two financial
institutions in the amount of Baht 1,498 million and Baht 2,179 million, respectively,
bearing the interest rate at BIBOR+2% per annum which was an agreement for
short-term credit facilities limit totaling of Baht 3,216 million for scrap purchasing,
other raw materials and utilities.
- 32 -
As at March 31, 2015, the Company has borrowing from a financial institution in
the amount of Baht 120 million, bearing the interest rate at 4.81% - 4.82% per
annum for working capital. (2016 : nil)
As at March 31, 2016, the Group has borrowings from financial institutions in the
amount of Baht 546 million for the trust receipt for billet purchasing, bearing the
interest rate at LIBOR per annum (2015 : nil)
As at March 31, 2016 and 2015, the Group has agreements with 8 local financial
institutions to obtain credit facilities limit of Baht 5,484 million and Baht 6,723
million for working capital. The interest rates of these credit facilities are as
follows:
Credit Line Interest rate
1) Bank Overdraft Minimum Overdraft Rate (MOR)
2) Trust receipts (Baht) Money Market Rate (MMR)
3) Promissory note Money Market Rate (MMR)
As at March 31, 2016 and 2015, the Group has withdrawn the loans including letters
of credit totaling Baht 1,534 million and Baht 824 million, respectively.
16.2 Long-term borrowings
The period to maturity of long-term borrowings (denominated in Thai Baht) as at
March 31, are as follows:
Unit : Thousand Baht
Consolidated Separate
financial statements financial statements
2016 2015 2016 2015
Within one year 200,000 865,000 200,000 865,000
After one year but not over five years - 200,000 - 200,000
Total 200,000 1,065,000 200,000 1,065,000
The long term borrowings comprising of 2 loan agreements, the first dated
November 29, 2006 for Baht 5,000 million with interest rate at MLR-1.25% p.a.,
and the second dated November 9, 2007 for Baht 3,500 million with interest rate at
MLR-2.00% p.a. and their amendments thereto. The loans are secured by the
property, plant and equipment of all subsidiaries as mentioned in Note 11. The loans
contain restrictions on financial ratios and shareholders’ structure which is in
accordance with requirements in loan agreements from financial institutions.
As at March 31, 2016 and 2015, the Company had a debt service coverage ratio
(“DSCR”) lower than the required ratio specified in the loan agreements with two
financial institutions. Waivers for non-compliance of DSCR specified in the loan
agreements of both lenders were obtained.
- 33 -
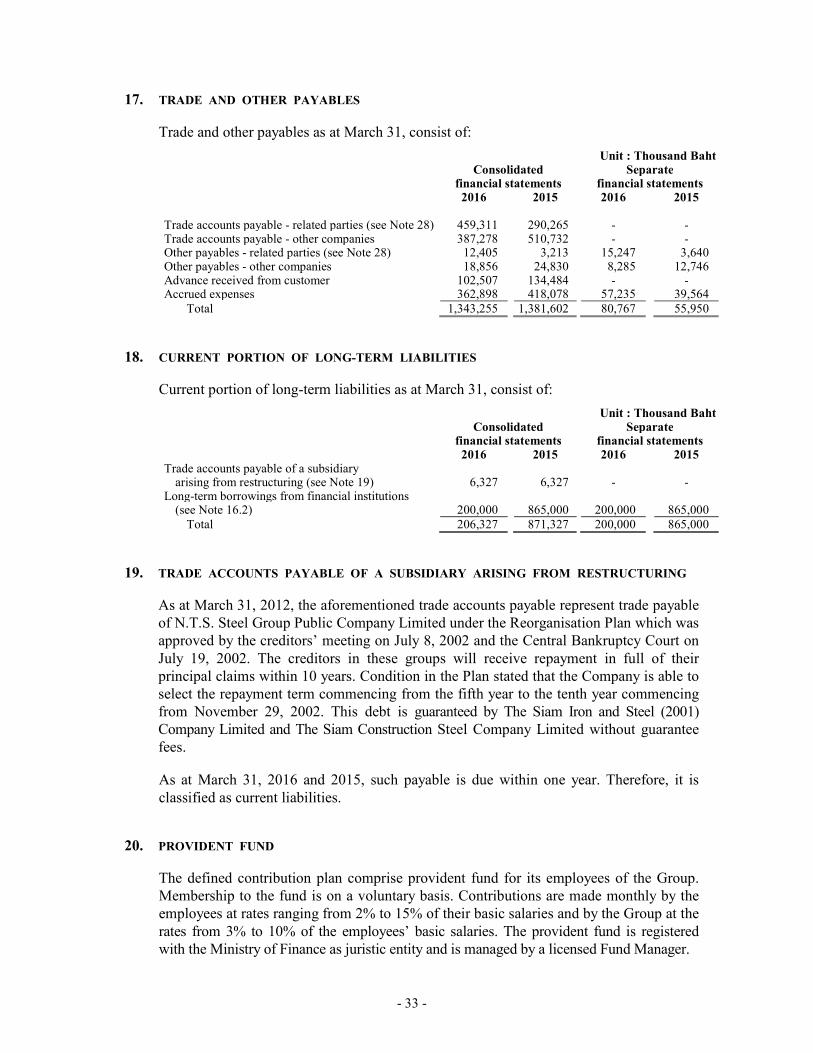
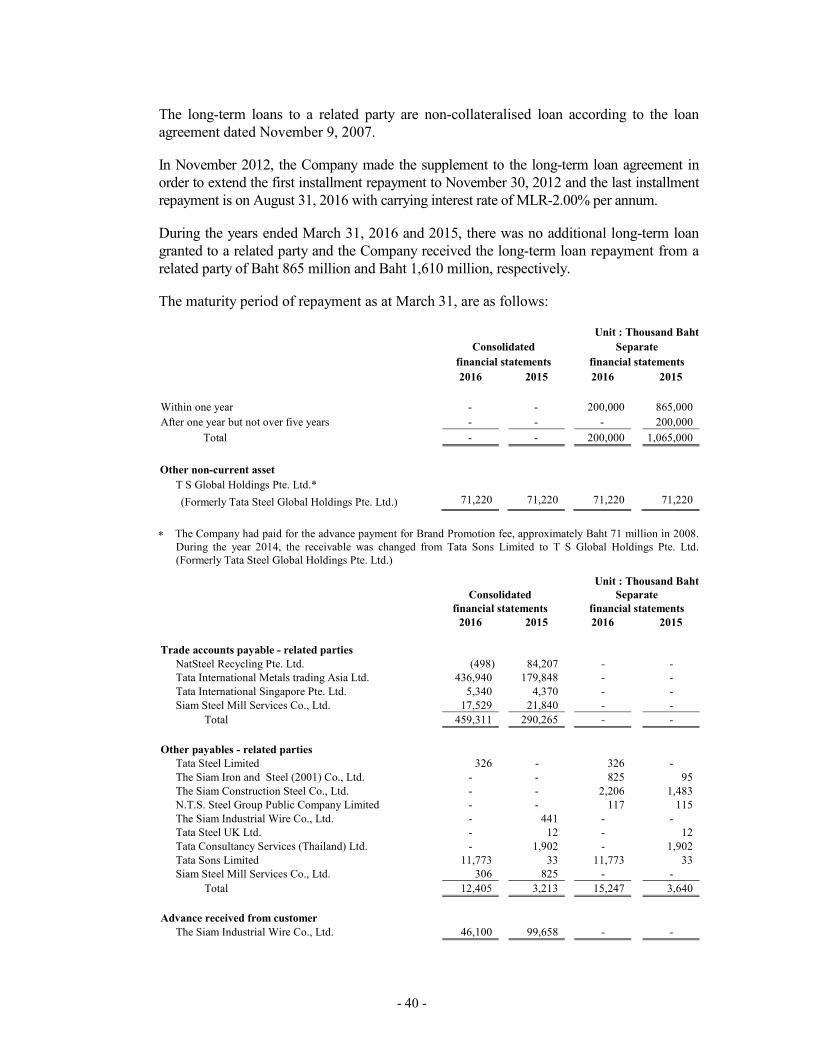
17. TRADE AND OTHER PAYABLES
Trade and other payables as at March 31, consist of:
Unit : Thousand Baht Consolidated Separate financial statements financial statements 2016 2015 2016 2015 Trade accounts payable - related parties (see Note 28) 459,311 290,265 - - Trade accounts payable - other companies 387,278 510,732 - - Other payables - related parties (see Note 28) 12,405 3,213 15,247 3,640 Other payables - other companies 18,856 24,830 8,285 12,746 Advance received from customer 102,507 134,484 - - Accrued expenses 362,898 418,078 57,235 39,564
Total 1,343,255 1,381,602 80,767 55,950
18. CURRENT PORTION OF LONG-TERM LIABILITIES
Current portion of long-term liabilities as at March 31, consist of:
Unit : Thousand Baht Consolidated Separate financial statements financial statements 2016 2015 2016 2015 Trade accounts payable of a subsidiary arising from restructuring (see Note 19) 6,327 6,327 - -
Long-term borrowings from financial institutions (see Note 16.2) 200,000 865,000 200,000 865,000
Total 206,327 871,327 200,000 865,000
19. TRADE ACCOUNTS PAYABLE OF A SUBSIDIARY ARISING FROM RESTRUCTURING
As at March 31, 2012, the aforementioned trade accounts payable represent trade payable
of N.T.S. Steel Group Public Company Limited under the Reorganisation Plan which was
approved by the creditors’ meeting on July 8, 2002 and the Central Bankruptcy Court on
July 19, 2002. The creditors in these groups will receive repayment in full of their
principal claims within 10 years. Condition in the Plan stated that the Company is able to
select the repayment term commencing from the fifth year to the tenth year commencing
from November 29, 2002. This debt is guaranteed by The Siam Iron and Steel (2001)
Company Limited and The Siam Construction Steel Company Limited without guarantee
fees.
As at March 31, 2016 and 2015, such payable is due within one year. Therefore, it is
classified as current liabilities.
20. PROVIDENT FUND
The defined contribution plan comprise provident fund for its employees of the Group.
Membership to the fund is on a voluntary basis. Contributions are made monthly by the
employees at rates ranging from 2% to 15% of their basic salaries and by the Group at the
rates from 3% to 10% of the employees’ basic salaries. The provident fund is registered
with the Ministry of Finance as juristic entity and is managed by a licensed Fund Manager.
- 34 -
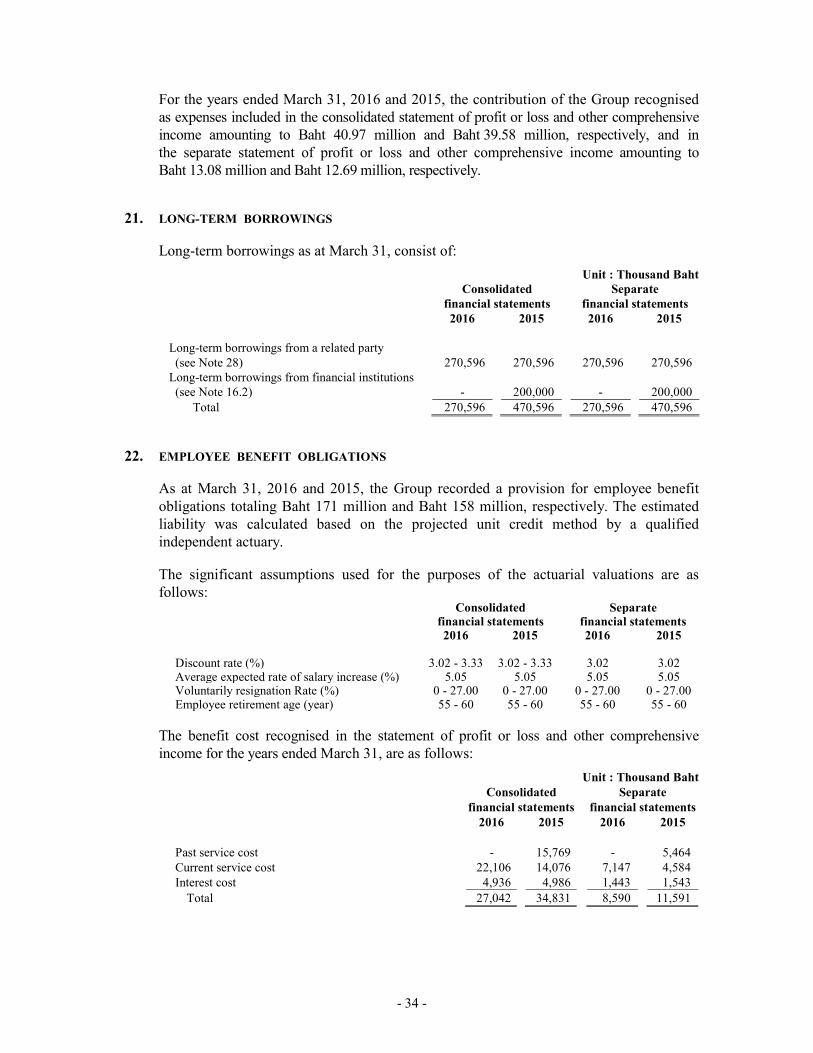
For the years ended March 31, 2016 and 2015, the contribution of the Group recognised
as expenses included in the consolidated statement of profit or loss and other comprehensive
income amounting to Baht 40.97 million and Baht 39.58 million, respectively, and in
the separate statement of profit or loss and other comprehensive income amounting to
Baht 13.08 million and Baht 12.69 million, respectively.
21. LONG-TERM BORROWINGS
Long-term borrowings as at March 31, consist of:
Unit : Thousand Baht
Consolidated Separate
financial statements financial statements
2016 2015 2016 2015
Long-term borrowings from a related party
(see Note 28) 270,596 270,596 270,596 270,596
Long-term borrowings from financial institutions
(see Note 16.2) - 200,000 - 200,000
Total 270,596 470,596 270,596 470,596
22. EMPLOYEE BENEFIT OBLIGATIONS
As at March 31, 2016 and 2015, the Group recorded a provision for employee benefit
obligations totaling Baht 171 million and Baht 158 million, respectively. The estimated
liability was calculated based on the projected unit credit method by a qualified
independent actuary.
The significant assumptions used for the purposes of the actuarial valuations are as
The benefit cost recognised in the statement of profit or loss and other comprehensive
income for the years ended March 31, are as follows:
Unit : Thousand Baht
Consolidated Separate
financial statements financial statements
2016 2015 2016 2015
Past service cost - 15,769 - 5,464
Current service cost 22,106 14,076 7,147 4,584
Interest cost 4,936 4,986 1,443 1,543
Total 27,042 34,831 8,590 11,591
- 35 -
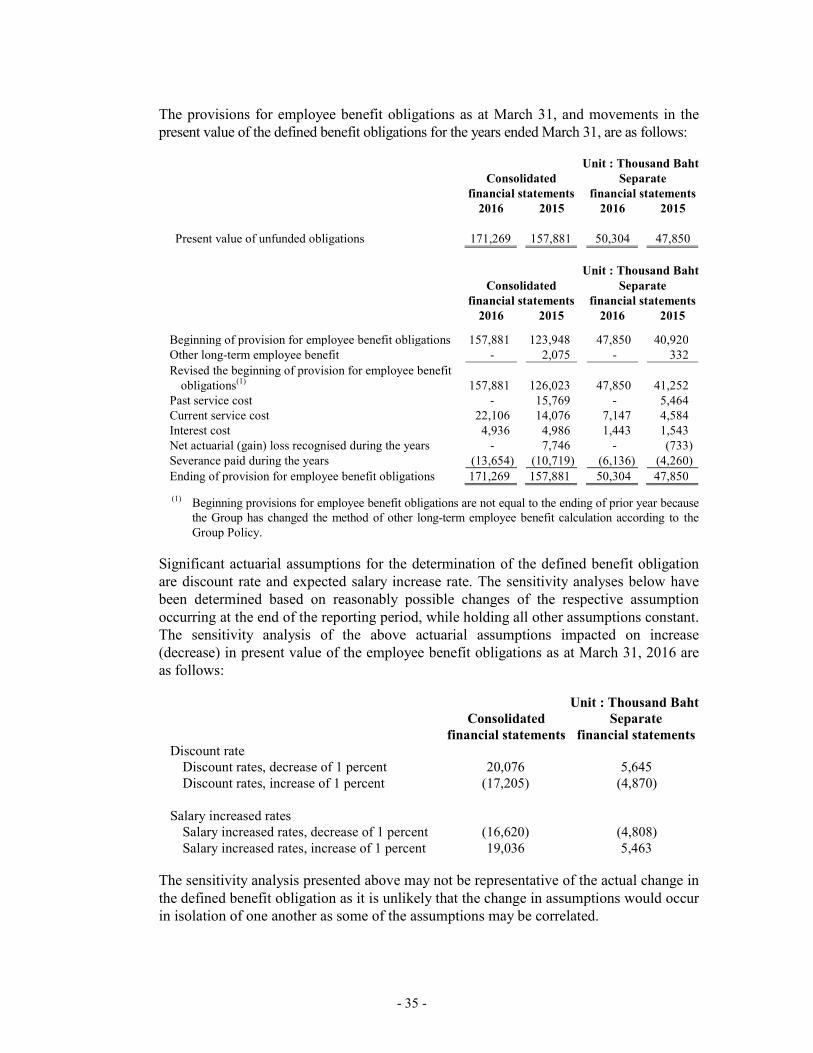
The provisions for employee benefit obligations as at March 31, and movements in the
present value of the defined benefit obligations for the years ended March 31, are as follows:
Unit : Thousand Baht
Consolidated Separate
financial statements financial statements
2016 2015 2016 2015
Present value of unfunded obligations 171,269 157,881 50,304 47,850
Unit : Thousand Baht
Consolidated Separate
financial statements financial statements
2016 2015 2016 2015
Beginning of provision for employee benefit obligations 157,881 123,948 47,850 40,920
Other long-term employee benefit - 2,075 - 332
Revised the beginning of provision for employee benefit
obligations(1) 157,881 126,023 47,850 41,252
Past service cost - 15,769 - 5,464
Current service cost 22,106 14,076 7,147 4,584
Interest cost 4,936 4,986 1,443 1,543
Net actuarial (gain) loss recognised during the years - 7,746 - (733)
Severance paid during the years (13,654) (10,719) (6,136) (4,260)
Ending of provision for employee benefit obligations 171,269 157,881 50,304 47,850
(1) Beginning provisions for employee benefit obligations are not equal to the ending of prior year because the Group has changed the method of other long-term employee benefit calculation according to the
Group Policy.
Significant actuarial assumptions for the determination of the defined benefit obligation
are discount rate and expected salary increase rate. The sensitivity analyses below have
been determined based on reasonably possible changes of the respective assumption
occurring at the end of the reporting period, while holding all other assumptions constant.
The sensitivity analysis of the above actuarial assumptions impacted on increase
(decrease) in present value of the employee benefit obligations as at March 31, 2016 are
as follows:
Unit : Thousand Baht
Consolidated
financial statements
Separate
financial statements
Discount rate
Discount rates, decrease of 1 percent 20,076 5,645
Discount rates, increase of 1 percent (17,205) (4,870)
Salary increased rates
Salary increased rates, decrease of 1 percent (16,620) (4,808)
Salary increased rates, increase of 1 percent 19,036 5,463
The sensitivity analysis presented above may not be representative of the actual change in
the defined benefit obligation as it is unlikely that the change in assumptions would occur
in isolation of one another as some of the assumptions may be correlated.
- 36 -
23. LEGAL RESERVE
According to the Public Companies Act B.E. 2535 requires that the Company and its
subsidiary which is a public limited company shall allocate not less than 5% of their annual
net profit, less any accumulated losses brought forward, if any, to a reserve account (“legal
reserve”), until this account reaches an amount not less than 10% of the authorised shares
capital. The legal reserve is not allowable for dividend distribution.
According to the Civil and Commercial Code, subsidiary companies which are limited company
must appropriate to a reserve fund at each distribution of dividend at least one-twentieth of the
profit arising from the business of that companies until the reserve fund reaches one-tenth
part of capital of subsidiary companies. Such reserve is not allowable for distribution as
dividends.
24. CAPITAL MANAGEMENT
The Group’s objective in managing capital is to safeguard the Group’s ability to continue as a
going concern in order to provide returns for shareholders and benefits for other stakeholders.
The management sets strategies to support the Group’s business operations to be more
efficiency including setting dividend and capital management policies to maintain the
optimal capital structure and cost of capital and to comply with the Debt Covenant Ratios.
25. OTHER INCOME
Other income for the years ended March 31, consist of:
Unit : Thousand Baht
Consolidated Separate
financial statements Financial statements
2016 2015 2016 2015
Gain on exchange rate - net 15,080 15,200 - -
Dividend income from a subsidiary - - 276,999 105,000
Dividend income from other long-term investment 52,560 16,800 - -
Interest income 3,700 8,576 49,007 114,804
Compensation from insurance company 34,689 - - -
Others 33,436 14,788 748 1,200
Total 139,465 55,364 326,754 221,004
- 37 -
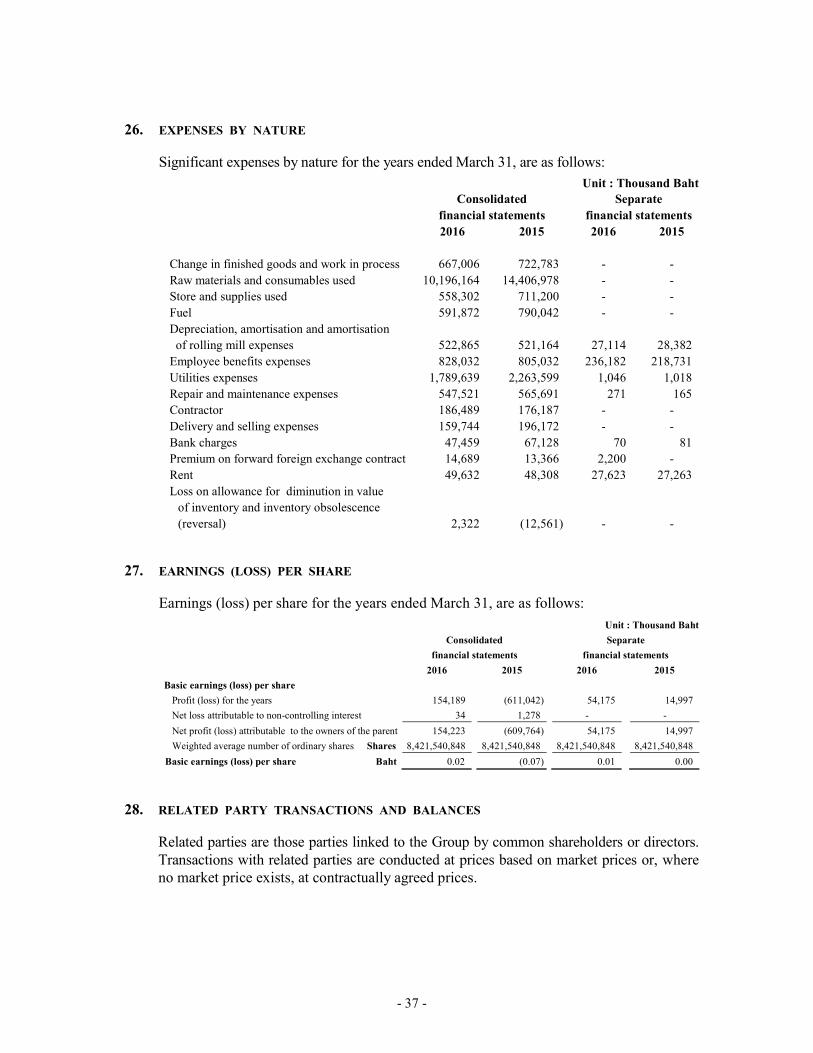
26. EXPENSES BY NATURE
Significant expenses by nature for the years ended March 31, are as follows:
Unit : Thousand Baht
Consolidated Separate
financial statements financial statements
2016 2015 2016 2015
Change in finished goods and work in process 667,006 722,783 - -
Raw materials and consumables used 10,196,164 14,406,978 - -
Store and supplies used 558,302 711,200 - -
Fuel 591,872 790,042 - -
Depreciation, amortisation and amortisation
of rolling mill expenses 522,865 521,164 27,114 28,382
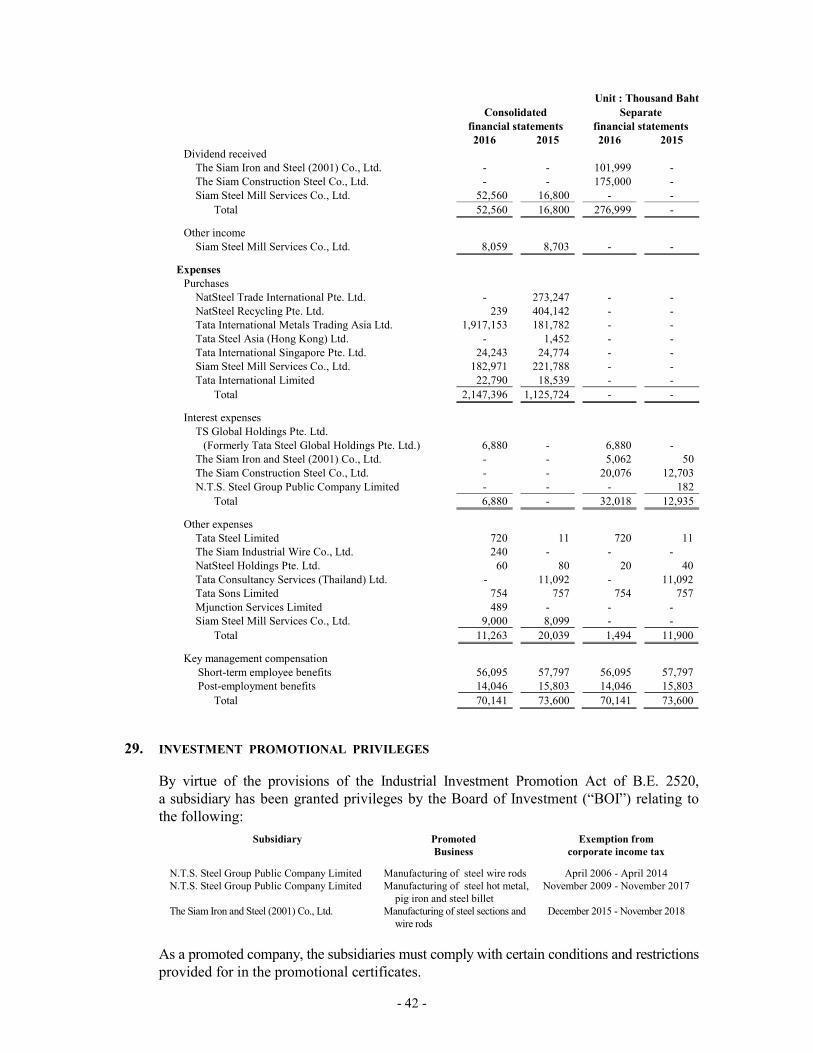
By virtue of the provisions of the Industrial Investment Promotion Act of B.E. 2520,
a subsidiary has been granted privileges by the Board of Investment (“BOI”) relating to
the following:
Subsidiary Promoted Exemption from
Business corporate income tax
N.T.S. Steel Group Public Company Limited Manufacturing of steel wire rods April 2006 - April 2014
N.T.S. Steel Group Public Company Limited Manufacturing of steel hot metal,
pig iron and steel billet
November 2009 - November 2017
The Siam Iron and Steel (2001) Co., Ltd. Manufacturing of steel sections and
wire rods
December 2015 - November 2018
As a promoted company, the subsidiaries must comply with certain conditions and restrictions
provided for in the promotional certificates.
- 43 -
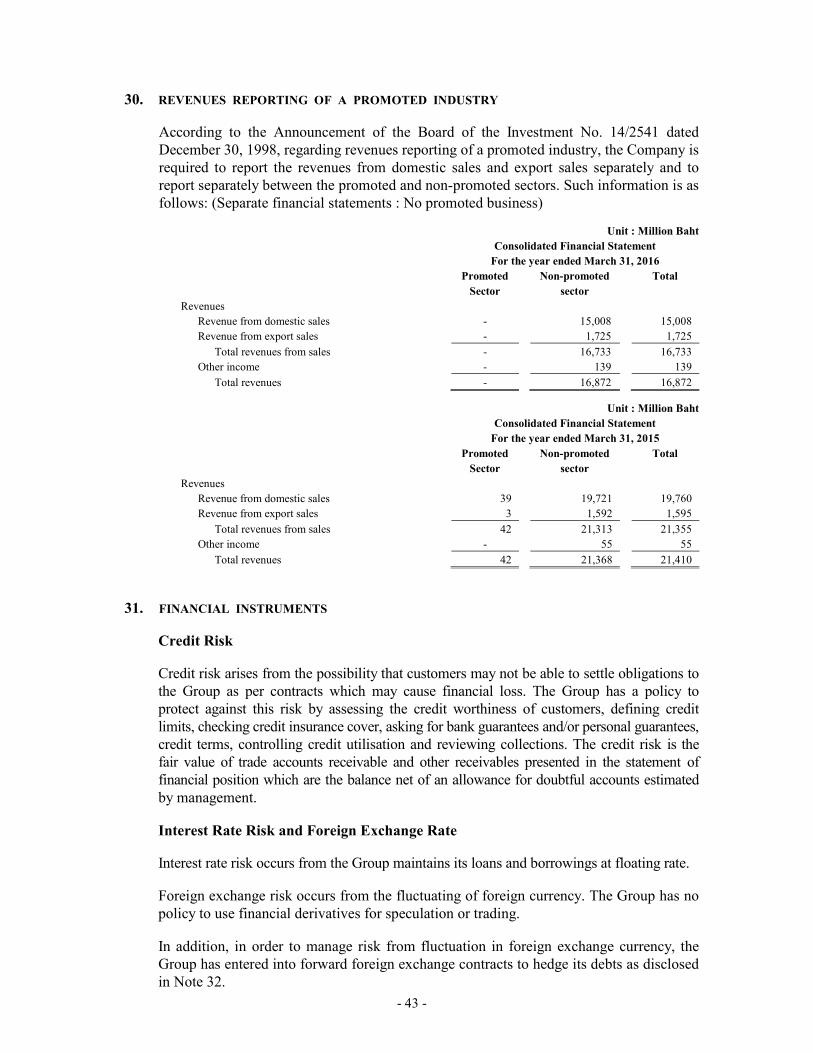
30. REVENUES REPORTING OF A PROMOTED INDUSTRY
According to the Announcement of the Board of the Investment No. 14/2541 dated
December 30, 1998, regarding revenues reporting of a promoted industry, the Company is
required to report the revenues from domestic sales and export sales separately and to
report separately between the promoted and non-promoted sectors. Such information is as
follows: (Separate financial statements : No promoted business)
Unit : Million Baht
Consolidated Financial Statement
For the year ended March 31, 2016
Promoted Non-promoted Total
Sector sector
Revenues
Revenue from domestic sales - 15,008 15,008
Revenue from export sales - 1,725 1,725
Total revenues from sales - 16,733 16,733
Other income - 139 139
Total revenues - 16,872 16,872
Unit : Million Baht
Consolidated Financial Statement
For the year ended March 31, 2015
Promoted Non-promoted Total
Sector sector
Revenues
Revenue from domestic sales 39 19,721 19,760
Revenue from export sales 3 1,592 1,595
Total revenues from sales 42 21,313 21,355
Other income - 55 55
Total revenues 42 21,368 21,410
31. FINANCIAL INSTRUMENTS
Credit Risk
Credit risk arises from the possibility that customers may not be able to settle obligations to
the Group as per contracts which may cause financial loss. The Group has a policy to
protect against this risk by assessing the credit worthiness of customers, defining credit
limits, checking credit insurance cover, asking for bank guarantees and/or personal guarantees,
credit terms, controlling credit utilisation and reviewing collections. The credit risk is the
fair value of trade accounts receivable and other receivables presented in the statement of
financial position which are the balance net of an allowance for doubtful accounts estimated
by management.
Interest Rate Risk and Foreign Exchange Rate
Interest rate risk occurs from the Group maintains its loans and borrowings at floating rate.
Foreign exchange risk occurs from the fluctuating of foreign currency. The Group has no
policy to use financial derivatives for speculation or trading.
In addition, in order to manage risk from fluctuation in foreign exchange currency, the
Group has entered into forward foreign exchange contracts to hedge its debts as disclosed
in Note 32.
- 44 -
Liquidity Risk
The Group monitors its liquidity risk and maintains a level of cash and cash equivalents
deemed adequate by management to finance the Group’s operations and to mitigate the
effects of fluctuations in cash flows.
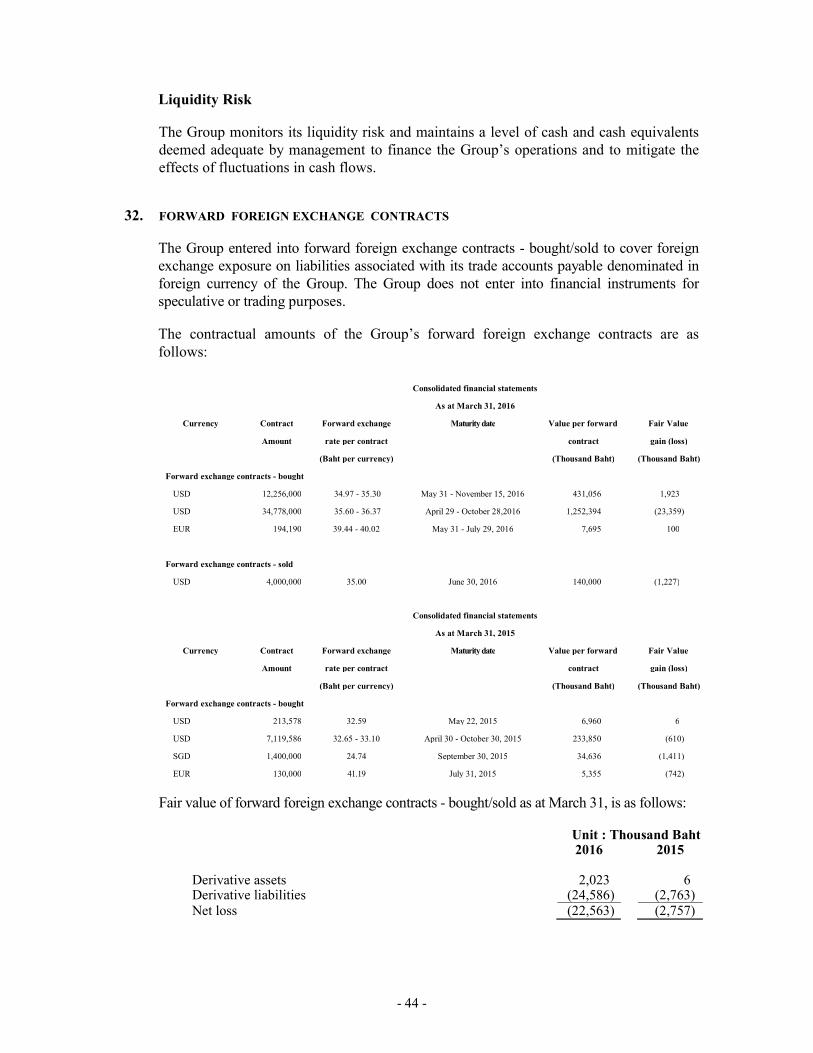
32. FORWARD FOREIGN EXCHANGE CONTRACTS
The Group entered into forward foreign exchange contracts - bought/sold to cover foreign
exchange exposure on liabilities associated with its trade accounts payable denominated in
foreign currency of the Group. The Group does not enter into financial instruments for
speculative or trading purposes.
The contractual amounts of the Group’s forward foreign exchange contracts are as
follows:
Consolidated financial statements
As at March 31, 2016
Currency Contract Forward exchange Maturity date Value per forward Fair Value
Amount rate per contract contract gain (loss)
(Baht per currency) (Thousand Baht) (Thousand Baht)
Forward exchange contracts - bought
USD 12,256,000 34.97 - 35.30 May 31 - November 15, 2016 431,056 1,923
USD 34,778,000 35.60 - 36.37 April 29 - October 28,2016 1,252,394 (23,359)
EUR 194,190 39.44 - 40.02 May 31 - July 29, 2016 7,695 100
Forward exchange contracts - sold
USD 4,000,000 35.00 June 30, 2016 140,000 (1,227)
Consolidated financial statements
As at March 31, 2015
Currency Contract Forward exchange Maturity date Value per forward Fair Value
Amount rate per contract contract gain (loss)
(Baht per currency) (Thousand Baht) (Thousand Baht)
Forward exchange contracts - bought
USD 213,578 32.59 May 22, 2015 6,960 6
USD 7,119,586 32.65 - 33.10 April 30 - October 30, 2015 233,850 (610)
SGD 1,400,000 24.74 September 30, 2015 34,636 (1,411)
EUR 130,000 41.19 July 31, 2015 5,355 (742)
Fair value of forward foreign exchange contracts - bought/sold as at March 31, is as follows:
Unit : Thousand Baht 2016 2015
Derivative assets 2,023 6 Derivative liabilities (24,586) (2,763) Net loss (22,563) (2,757)
- 45 -
33. DETERMINATION OF FAIR VALUES
A number of the Group’s accounting policies and disclosures require the determination of
fair value, for both financial and non-financial assets and liabilities. The fair value is the
amount for which an asset could be exchanged, or a liability settled, between knowledgeable,
willing parties in an arm’s length transaction. Fair values have been determined for
measurement and/or disclosure purposes based on the following methods. When applicable,
further information about the assumptions made in determining fair values is disclosed in
the notes specific to that asset or liability.
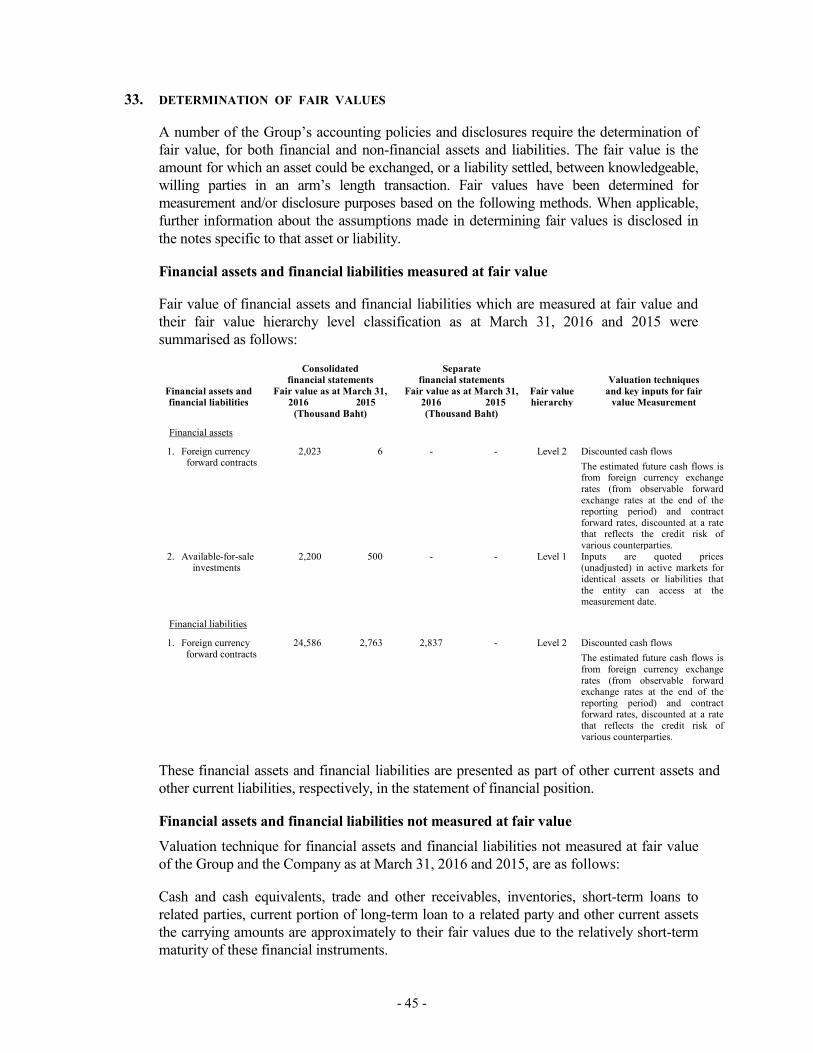
Financial assets and financial liabilities measured at fair value
Fair value of financial assets and financial liabilities which are measured at fair value and
their fair value hierarchy level classification as at March 31, 2016 and 2015 were
summarised as follows:
Consolidated
financial statements Separate
financial statements Valuation techniques Financial assets and Fair value as at March 31, Fair value as at March 31, Fair value and key inputs for fair financial liabilities 2016 2015 2016 2015 hierarchy value Measurement
(Thousand Baht) (Thousand Baht)
Financial assets
1.
Foreign currency forward contracts
2,023 6 - - Level 2 Discounted cash flows
The estimated future cash flows is from foreign currency exchange rates (from observable forward exchange rates at the end of the reporting period) and contract forward rates, discounted at a rate that reflects the credit risk of various counterparties.
2. Available-for-sale investments
2,200 500 - - Level 1 Inputs are quoted prices (unadjusted) in active markets for identical assets or liabilities that the entity can access at the measurement date.
Financial liabilities
1. Foreign currency forward contracts
24,586 2,763
2,837 - Level 2
Discounted cash flows
The estimated future cash flows is from foreign currency exchange rates (from observable forward exchange rates at the end of the reporting period) and contract forward rates, discounted at a rate that reflects the credit risk of various counterparties.
These financial assets and financial liabilities are presented as part of other current assets and
other current liabilities, respectively, in the statement of financial position.
Financial assets and financial liabilities not measured at fair value
Valuation technique for financial assets and financial liabilities not measured at fair value
of the Group and the Company as at March 31, 2016 and 2015, are as follows:
Cash and cash equivalents, trade and other receivables, inventories, short-term loans to
related parties, current portion of long-term loan to a related party and other current assets
the carrying amounts are approximately to their fair values due to the relatively short-term
maturity of these financial instruments.
- 46 -
The Group and the Company cannot disclose the fair value of other long-term investment
which its cost of Baht 1,241 (see Note 2.6) because of time and cost limitation to determine
the sufficiently reliable fair value.
Short-term loans from financial institutions, trade and other payables, short-term borrowing
from related parties, current portion of long-term borrowings from financial institutions
and other current liabilities - the carrying amounts are approximately to their fair values due
to the relatively short-term maturity of these financial instruments.
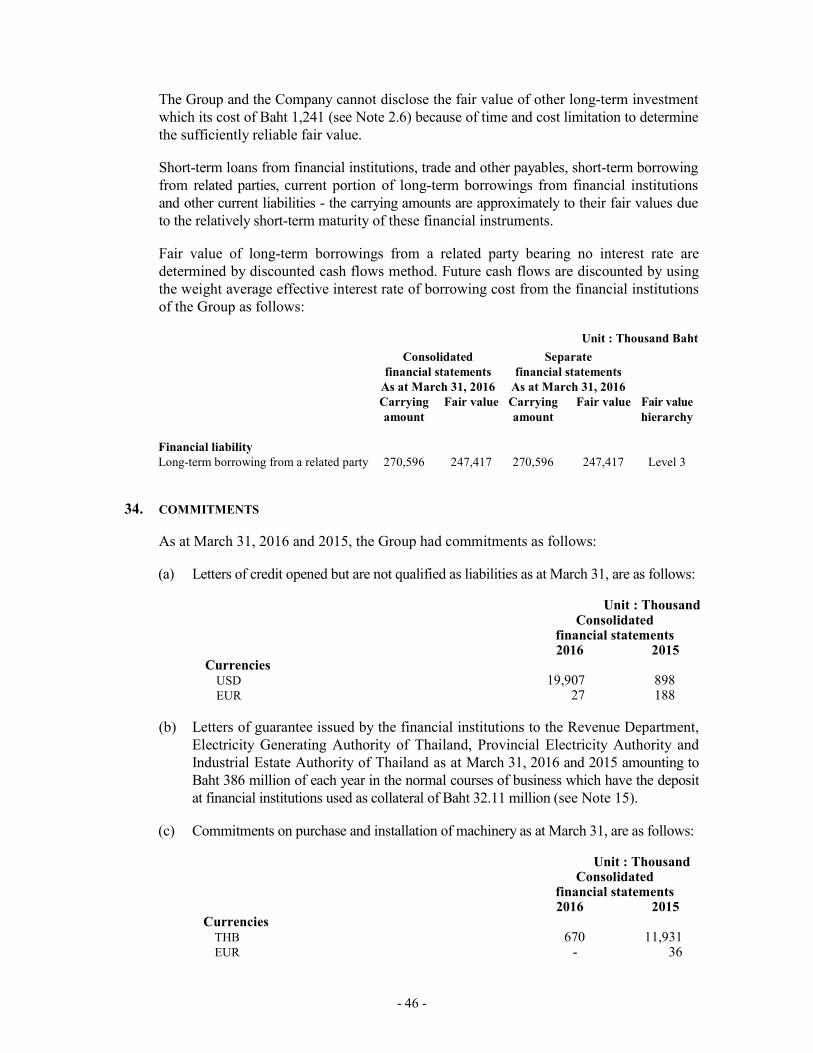
Fair value of long-term borrowings from a related party bearing no interest rate are
determined by discounted cash flows method. Future cash flows are discounted by using
the weight average effective interest rate of borrowing cost from the financial institutions
of the Group as follows:
Unit : Thousand Baht
Consolidated
financial statements
Separate
financial statements
As at March 31, 2016 As at March 31, 2016
Carrying
amount
Fair value Carrying
amount
Fair value Fair value
hierarchy
Financial liability
Long-term borrowing from a related party 270,596 247,417 270,596 247,417 Level 3
34. COMMITMENTS
As at March 31, 2016 and 2015, the Group had commitments as follows:
(a) Letters of credit opened but are not qualified as liabilities as at March 31, are as follows: