55
REPORT Tauranga Harbour Coastal Hazards Study Coastal Erosion Assessment Prepared for Bay of Plenty Regional Council Prepared by Tonkin & Taylor Ltd Date July 2019 Job Number 1001628.v5
Tonkin & Taylor Ltd Tauranga Harbour Coastal Hazards Study - Coastal Erosion Assessment Bay of Plenty Regional Council
July 2019 Job No: 1001628.v5
REPORT
Tauranga Harbour Coastal Hazards Study
Coastal Erosion Assessment
Prepared for
Bay of Plenty Regional Council
Prepared by
Tonkin & Taylor Ltd
Date
July 2019
Job Number
1001628.v5
Document Control
Title: Tauranga Harbour Coastal Hazards Study: Coastal Erosion Assessment
Date Version Description Prepared by:
Reviewed by:
Authorised by:
14/03/2018 V1 Draft methodology for external peer review
Rebekah Haughey
Tom Shand
18/06/2018 V2 Full draft report for external peer review
Rebekah Haughey
Tom Shand
16/10/2018 V3 Final draft report updated with external peer review comments
Rebekah Haughey
Tom Shand R. Reinen-Hamill
10/12/2018 V4 Final report with additional sites included
Rebekah Haughey
Tom Shand R. Reinen-Hamill
01/07/2019 V5 Final report with updated terminology following public feedback
Rebekah Haughey
Tom Shand R. Reinen-Hamill
Distribution:
Bay of Plenty Regional Council PDF copy
Western Bay of Plenty District Council PDF copy
Tauranga City Council PDF copy
Bay of Plenty Civil Defence and Emergency Management PDF copy
Tonkin & Taylor Ltd (FILE) 1 copy
Tonkin & Taylor Ltd Tauranga Harbour Coastal Hazards Study - Coastal Erosion Assessment Bay of Plenty Regional Council
July 2019 Job No: 1001628.v5
Table of contents
1 Introduction 1 1.1 Study scope 1 1.2 Report layout 3 1.3 Datums and coordinates 3
2 Coastal setting 4 2.1 General characteristics 4 2.2 Geology 5 2.3 Sediments 7 2.4 Vertical land movement 7 2.5 Water levels 7
2.5.1 Astronomical tide 8 2.5.2 Storm surge 8 2.5.3 Long term sea levels 9
2.6 Winds 10 2.7 Waves 11
3 Data sources 13 3.1 Previous studies 13 3.2 Site inspections 14 3.3 Aerial photographs 14 3.4 Topography and bathymetry 15
4 Methodology 16 4.1 Statutory considerations 16
4.1.1 New Zealand Coastal Policy Statement 16 4.1.2 Regional Policy Statement 16 4.1.3 Proposed Regional Coastal Environment Plan 17
4.2 Risk-based approach 17 4.3 Stochastic forecast approach 17 4.4 Defining coastal behaviour cells 18 4.5 Baseline derivation 18 4.6 Coastal erosion methodologies 18
4.6.1 Unconsolidated shorelines 18 4.6.2 Consolidated cliffs and banks 19 4.6.3 Low-lying estuarine areas 20 4.6.4 Erosion protection and land stability structures 20
5 Component derivation 23 5.1 Planning timeframe (T) 23 5.2 Short term erosion (ST) 23
5.2.1 Semi-process based methods 23 5.3 Slope stability (SS) 26
5.3.1 Unconsolidated shorelines 26 5.3.2 Consolidated banks and cliffs 26
5.4 Long term trends (LT) 27 5.5 Effects of sea level rise (SLR) 29
5.5.1 Adopted SLR values 29 5.5.2 Unconsolidated shoreline response to SLR 30 5.5.3 Consolidated shoreline response to SLR 30 5.5.4 Low-lying estuarine response due to inundation 33
6 Coastal erosion assessment 34
Tonkin & Taylor Ltd Tauranga Harbour Coastal Hazards Study - Coastal Erosion Assessment Bay of Plenty Regional Council
July 2019 Job No: 1001628.v5
6.1 Combination of parameter components to derive CEIHA 34 6.2 Results 34 6.3 Mapping of the CEIHA 36 6.4 Discussion 37
6.4.1 Consolidated cliff CEIHA 37 6.4.2 Unconsolidated shoreline CEIHA 39 6.4.3 Low-lying estuarine hazard areas 39 6.4.4 Anthropogenic effects 40
6.5 Uncertainties and limitations 40
7 Summary and recommendations 42
8 Applicability 44
9 References 45
Appendix A : Site assessments
Appendix B : CEIHA probabilistic model outputs

Tonkin & Taylor Ltd Tauranga Harbour Coastal Hazards Study - Coastal Erosion Assessment Bay of Plenty Regional Council
July 2019 Job No: 1001628.v5

Tonkin & Taylor Ltd Tauranga Harbour Coastal Hazards Study - Coastal Erosion Assessment Bay of Plenty Regional Council
July 2019 Job No: 1001628.v5
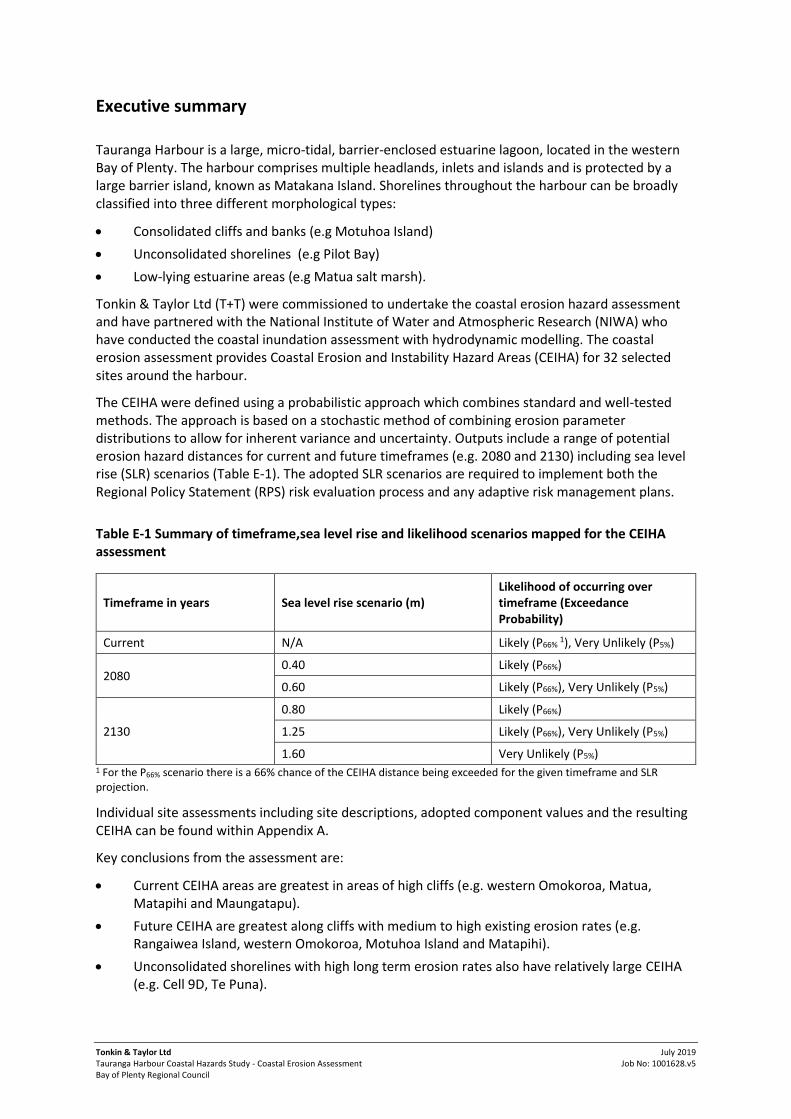
Executive summary
Tauranga Harbour is a large, micro-tidal, barrier-enclosed estuarine lagoon, located in the western Bay of Plenty. The harbour comprises multiple headlands, inlets and islands and is protected by a large barrier island, known as Matakana Island. Shorelines throughout the harbour can be broadly classified into three different morphological types:
Consolidated cliffs and banks (e.g Motuhoa Island)
Unconsolidated shorelines (e.g Pilot Bay)
Low-lying estuarine areas (e.g Matua salt marsh).
Tonkin & Taylor Ltd (T+T) were commissioned to undertake the coastal erosion hazard assessment and have partnered with the National Institute of Water and Atmospheric Research (NIWA) who have conducted the coastal inundation assessment with hydrodynamic modelling. The coastal erosion assessment provides Coastal Erosion and Instability Hazard Areas (CEIHA) for 32 selected sites around the harbour.
The CEIHA were defined using a probabilistic approach which combines standard and well-tested methods. The approach is based on a stochastic method of combining erosion parameter distributions to allow for inherent variance and uncertainty. Outputs include a range of potential erosion hazard distances for current and future timeframes (e.g. 2080 and 2130) including sea level rise (SLR) scenarios (Table E-1). The adopted SLR scenarios are required to implement both the Regional Policy Statement (RPS) risk evaluation process and any adaptive risk management plans.
Table E-1 Summary of timeframe,sea level rise and likelihood scenarios mapped for the CEIHA assessment
Timeframe in years Sea level rise scenario (m) Likelihood of occurring over timeframe (Exceedance Probability)
Current N/A Likely (P66% 1), Very Unlikely (P5%)
2080 0.40 Likely (P66%)
0.60 Likely (P66%), Very Unlikely (P5%)
2130
0.80 Likely (P66%)
1.25 Likely (P66%), Very Unlikely (P5%)
1.60 Very Unlikely (P5%) 1 For the P66% scenario there is a 66% chance of the CEIHA distance being exceeded for the given timeframe and SLR projection.
Individual site assessments including site descriptions, adopted component values and the resulting CEIHA can be found within Appendix A.
Key conclusions from the assessment are:
Current CEIHA areas are greatest in areas of high cliffs (e.g. western Omokoroa, Matua, Matapihi and Maungatapu).
Future CEIHA are greatest along cliffs with medium to high existing erosion rates (e.g. Rangaiwea Island, western Omokoroa, Motuhoa Island and Matapihi).
Unconsolidated shorelines with high long term erosion rates also have relatively large CEIHA (e.g. Cell 9D, Te Puna).
Tonkin & Taylor Ltd Tauranga Harbour Coastal Hazards Study - Coastal Erosion Assessment Bay of Plenty Regional Council
July 2019 Job No: 1001628.v5
The largest future CEIHA was identified along the south-facing unconsolidated shoreline of Rangaiwea Island (Cell 10C) where historic erosion rates have been highest.
Low-lying estuarine areas are not specifically at risk of shoreline erosion but instead there is potential for such areas to become permanently inundated with future SLR with the shoreline position migrating landward in response.
Overall this study has assessed coastal erosion hazard areas at a local scale and may be superseded by detailed, site-specific assessment undertaken by qualified and experienced practitioners using improved or higher resolution data than presented in this report. This could include site-specific geotechnical information to confirm stable angles of repose, as well as site-specific consideration and analysis of erosion rates.
Summary of Terms
Term Definition
Coastal erosion Landward movement of the shoreline which may include both long term retreat over several years or decades and short term loss of sediment due to storms.
Coastal inundation Flooding of the land by the sea. Causes can include large tides, storm surges and wave effects during storm events.
Consolidated cliffs Cliffs or banks that do not re-build following erosion
Holocene The present day geological time period.
Hydrodynamics Water movement (e.g. waves, tide, currents).
Slope Instability State where cliff face has potential to slump/give way. Coastal cliffs can be unstable due to combined effect of several factors, such as geological type, weathering profile, local bedding and faulting characteristics, groundwater level, overland flow paths and vegetation cover
Low-lying estuarine areas Land at low elevation with mangroves and/or salt marsh vegetation along the seaward edge.
Probabilistic A model where there are multiple possible outcomes, each having varying degrees of certainty or uncertainty of its occurrence.
Sea level rise Trend of annual mean sea level over timescales of at least three or more decades. Must be tied to one of the following two types: global – overall rise in absolute sea level in the world’s oceans; or relative – net rise relative to the local landmass (that may be subsiding or being uplifted).
Sea level rise scenarios Sea level rise scenarios based on a range of climate change predictions.
Sedimentation The process of sediment settling or being deposited.
Short term changes Changes in horizontal shoreline position over short timeframes (<1 year), Only applicable to unconsolidated shorelines. A typical example is where sand is removed during storm events and gradually returns to the shoreline during prolonged calm weather.
Slope stability allowance Horizontal distance landward from the base of the cliff to the position of crest where the cliff face sits at a stable angle.
Storm surge The temporary excess above the level expected from the tidal variation alone at a given time and place. The temporary increase in the height of the sea is caused by extreme meteorological conditions such as low atmospheric pressure and/or strong winds.
Unconsolidated shorelines Shorelines with sandy sediment and/or weak backshore material (typically low elevation).
1
Tonkin & Taylor Ltd Tauranga Harbour Coastal Hazards Study - Coastal Erosion Assessment Bay of Plenty Regional Council
July 2019 Job No: 1001628.v5
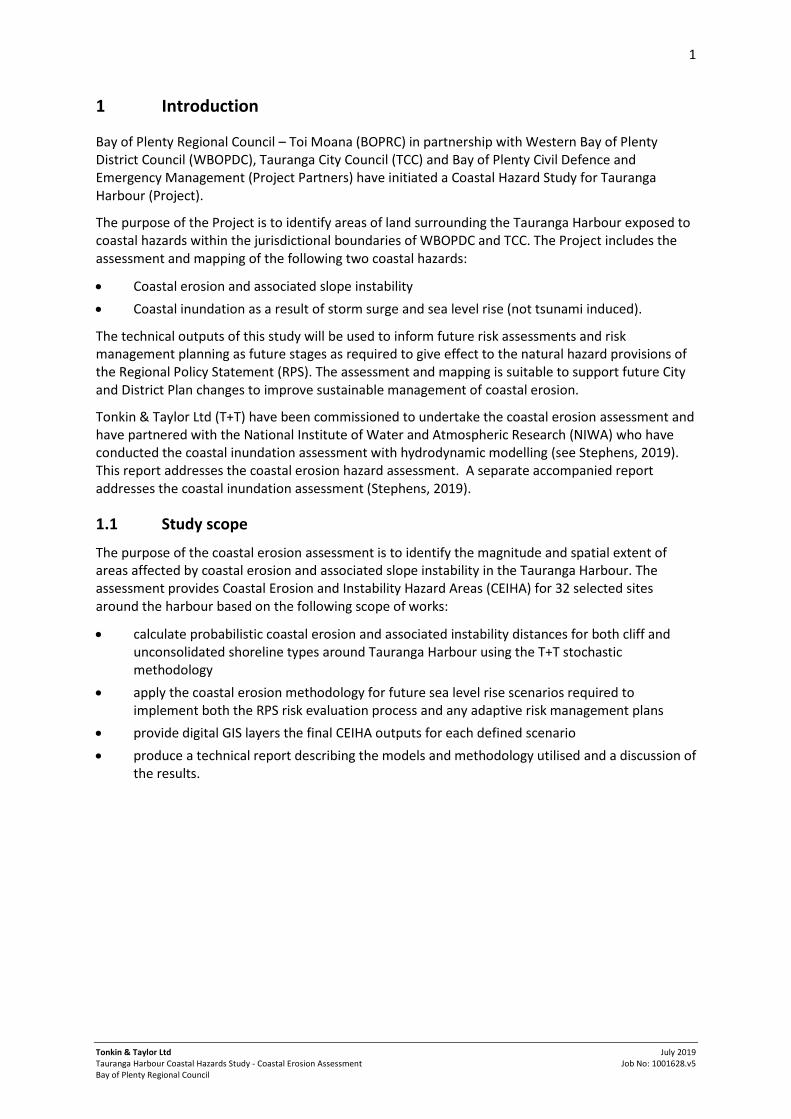
1 Introduction
Bay of Plenty Regional Council – Toi Moana (BOPRC) in partnership with Western Bay of Plenty District Council (WBOPDC), Tauranga City Council (TCC) and Bay of Plenty Civil Defence and Emergency Management (Project Partners) have initiated a Coastal Hazard Study for Tauranga Harbour (Project).
The purpose of the Project is to identify areas of land surrounding the Tauranga Harbour exposed to coastal hazards within the jurisdictional boundaries of WBOPDC and TCC. The Project includes the assessment and mapping of the following two coastal hazards:
Coastal erosion and associated slope instability
Coastal inundation as a result of storm surge and sea level rise (not tsunami induced).
The technical outputs of this study will be used to inform future risk assessments and risk management planning as future stages as required to give effect to the natural hazard provisions of the Regional Policy Statement (RPS). The assessment and mapping is suitable to support future City and District Plan changes to improve sustainable management of coastal erosion.
Tonkin & Taylor Ltd (T+T) have been commissioned to undertake the coastal erosion assessment and have partnered with the National Institute of Water and Atmospheric Research (NIWA) who have conducted the coastal inundation assessment with hydrodynamic modelling (see Stephens, 2019). This report addresses the coastal erosion hazard assessment. A separate accompanied report addresses the coastal inundation assessment (Stephens, 2019).
1.1 Study scope
The purpose of the coastal erosion assessment is to identify the magnitude and spatial extent of areas affected by coastal erosion and associated slope instability in the Tauranga Harbour. The assessment provides Coastal Erosion and Instability Hazard Areas (CEIHA) for 32 selected sites around the harbour based on the following scope of works:
calculate probabilistic coastal erosion and associated instability distances for both cliff and unconsolidated shoreline types around Tauranga Harbour using the T+T stochastic methodology
apply the coastal erosion methodology for future sea level rise scenarios required to implement both the RPS risk evaluation process and any adaptive risk management plans
provide digital GIS layers the final CEIHA outputs for each defined scenario
produce a technical report describing the models and methodology utilised and a discussion of the results.
32
1
2
30
3
31
Path:
P:\10
0162
8\Work
ingMa
terial
\GIS\
Figure
1.mxd
Date
: 6/11
/2018
Time
: 12:5
4:45 P
M
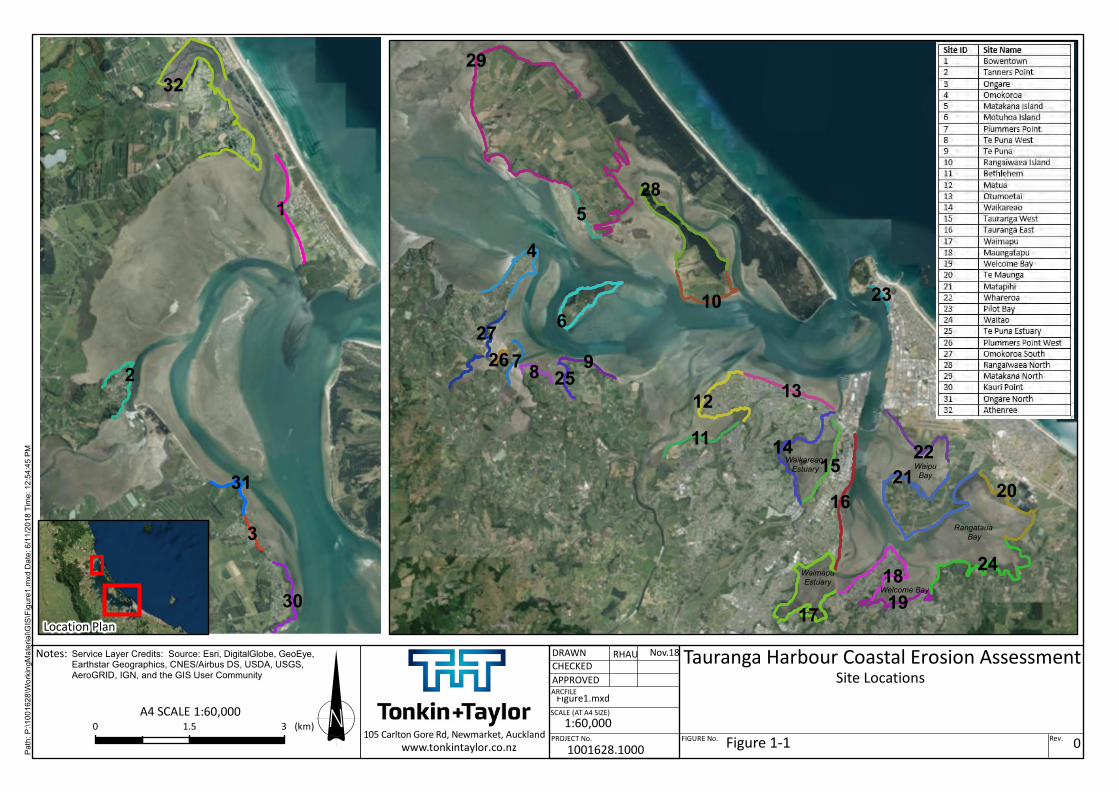
! 0Figure 1-1
Tauranga Harbour Coastal Erosion AssessmentSite Locations
Location Plan
1:60,0001001628.1000
Figure1.mxd
RHAU Nov.18
0 1.5 3 (km)A4 SCALE 1:60,000
Notes:
105 Carlton Gore Rd, Newmarket, Aucklandwww.tonkintaylor.co.nz Rev.
SCALE (AT A4 SIZE)
PROJECT No.
ARCFILE
DRAWNCHECKEDAPPROVED
FIGURE No.
6
4
29
28
24
2114
16
8 9
1917
10
7
5
13
1511 22
20
18
27
1225
23
26
Service Layer Credits: Source: Esri, DigitalGlobe, GeoEye,Earthstar Geographics, CNES/Airbus DS, USDA, USGS,AeroGRID, IGN, and the GIS User Community
Rangataua Bay
WaimapuEstuary
WaipuBay
Welcome Bay
Waikareao Estuary
3
Tonkin & Taylor Ltd Tauranga Harbour Coastal Hazards Study - Coastal Erosion Assessment Bay of Plenty Regional Council
July 2019 Job No: 1001628.v5
1.2 Report layout
The report is structured as follows:
Coastal settings are described in Section 2
Data sources are outlined in Section 3
Methodology for deriving coastal erosion hazard in Section 4
Derivation of components of coastal erosion in Section 5
Assessment results, mapping and discussion in Section 6
Summary and recommendations in Section 7.
1.3 Datums and coordinates
All elevations (levels) within this report are presented in terms of Moturiki Vertical Datum 1953 (MVD53 or Reduced Level, RL). Coordinates are presented in terms of New Zealand Transverse Mercator (NZTM).
4
Tonkin & Taylor Ltd Tauranga Harbour Coastal Hazards Study - Coastal Erosion Assessment Bay of Plenty Regional Council
July 2019 Job No: 1001628.v5
2 Coastal setting
2.1 General characteristics
Tauranga Harbour is a large, micro-tidal, barrier-enclosed estuarine lagoon, located in the western Bay of Plenty. The harbour comprises multiple headlands, inlets and islands and is protected by a large barrier island, known as Matakana Island. To the north-west and south-east of Matakana Island are the two tidal inlets into the harbour. These are impounded by two Holocene barrier tombolos, Mount Maunganui for the Tauranga basin (southern) and Bowentown for the Katikati basin (northern). The two basins are divided by a large area of intertidal flats. Bathymetry is predominantly shallow in the upper reaches of the harbour, with approximately 66% of the harbour characterised by intertidal flats (de Lange and Healy, 1990).
Shorelines throughout the harbour can be broadly classified into three different morphological types:
Consolidated cliffs and banks
Unconsolidated shorelines (beach ridges)
Low-lying estuarine areas.
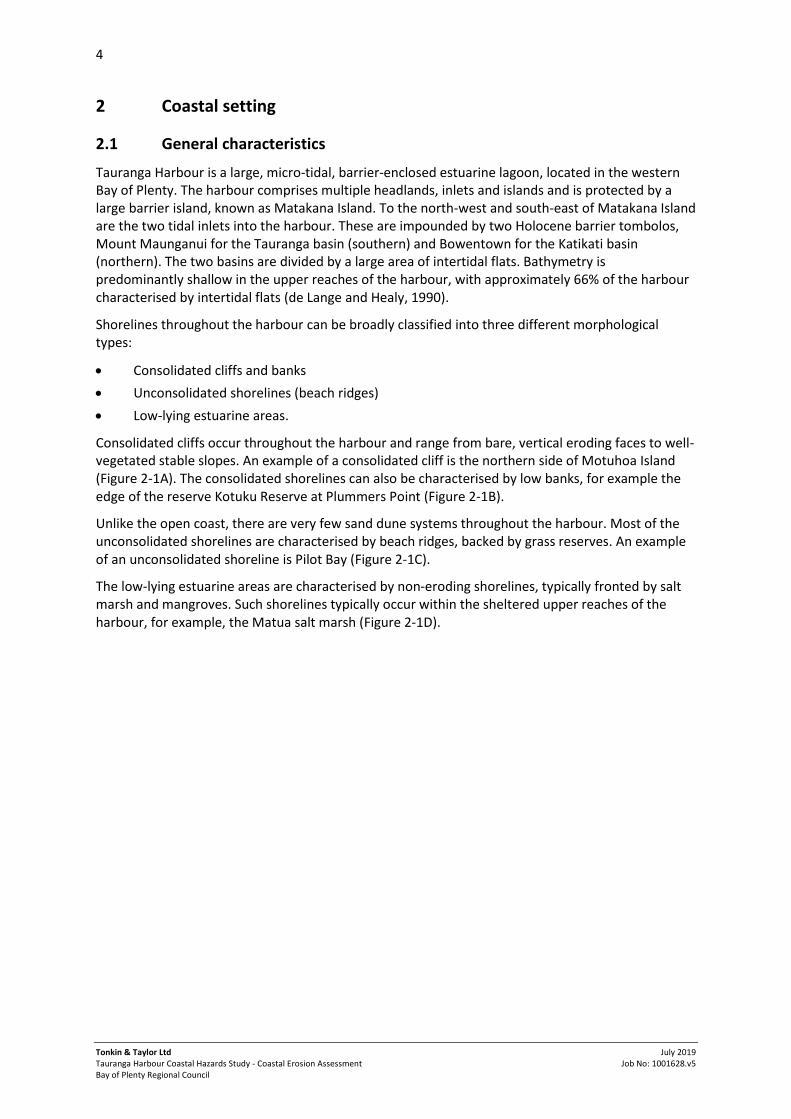
Consolidated cliffs occur throughout the harbour and range from bare, vertical eroding faces to well-vegetated stable slopes. An example of a consolidated cliff is the northern side of Motuhoa Island (Figure 2-1A). The consolidated shorelines can also be characterised by low banks, for example the edge of the reserve Kotuku Reserve at Plummers Point (Figure 2-1B).
Unlike the open coast, there are very few sand dune systems throughout the harbour. Most of the unconsolidated shorelines are characterised by beach ridges, backed by grass reserves. An example of an unconsolidated shoreline is Pilot Bay (Figure 2-1C).
The low-lying estuarine areas are characterised by non-eroding shorelines, typically fronted by salt marsh and mangroves. Such shorelines typically occur within the sheltered upper reaches of the harbour, for example, the Matua salt marsh (Figure 2-1D).
5
Tonkin & Taylor Ltd Tauranga Harbour Coastal Hazards Study - Coastal Erosion Assessment Bay of Plenty Regional Council
July 2019 Job No: 1001628.v5
Figure 2-1 Examples of different shoreline morphology around Tauranga Harbour. (A) Consolidated cliffs, (B) consolidated bank, (C) unconsolidated beach ridge, (D) low-lying estuarine area.
Hydrodynamics within the harbour are dominated by tidal currents and wind-generated waves. A number of freshwater streams discharge into the harbour, although their overall input is low. Sediment runoff from the surrounding catchment is estimated to be 120,000 tonnes/yr of fine-grained sediment (McKenzie, 2014). There is also some marine sediment input into the harbour from littoral drift and tidal currents at entrances.
2.2 Geology
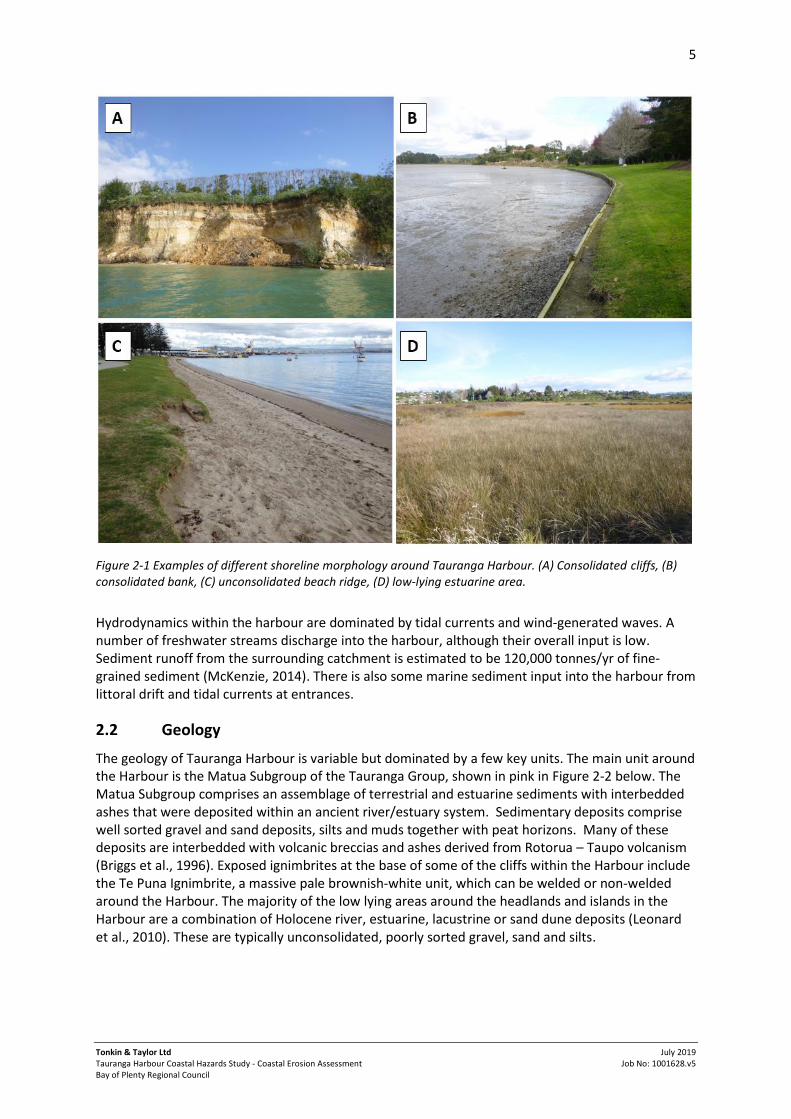
The geology of Tauranga Harbour is variable but dominated by a few key units. The main unit around the Harbour is the Matua Subgroup of the Tauranga Group, shown in pink in Figure 2-2 below. The Matua Subgroup comprises an assemblage of terrestrial and estuarine sediments with interbedded ashes that were deposited within an ancient river/estuary system. Sedimentary deposits comprise well sorted gravel and sand deposits, silts and muds together with peat horizons. Many of these deposits are interbedded with volcanic breccias and ashes derived from Rotorua – Taupo volcanism (Briggs et al., 1996). Exposed ignimbrites at the base of some of the cliffs within the Harbour include the Te Puna Ignimbrite, a massive pale brownish-white unit, which can be welded or non-welded around the Harbour. The majority of the low lying areas around the headlands and islands in the Harbour are a combination of Holocene river, estuarine, lacustrine or sand dune deposits (Leonard et al., 2010). These are typically unconsolidated, poorly sorted gravel, sand and silts.
Sourced from the LINZ Data Service and licensed for re-use under the
Path:
P:\10
0162
8\Work
ingMa
terial
\GIS\
Figure
2_2.m
xd D
ate: 6
/11/20
18 Ti
me: 1
:27:04
PM
!
Location Plan0 4 8 (km)A4 SCALE 1:140,000
0Figure 1.Sheet:
Tauranga Harbour Erosion AssessmentSimplified Geological Map
1:140,0001001628.1000
Figure2_2.mxd
RHAU Nov.18
105 Carlton Gore Rd, Newmarket, Aucklandwww.tonkintaylor.co.nz Rev.
SCALE (AT A4 SIZE)
PROJECT No.
ARCFILE
DRAWNCHECKEDAPPROVED
FIGURE No.Figure 2-2
7
Tonkin & Taylor Ltd Tauranga Harbour Coastal Hazards Study - Coastal Erosion Assessment Bay of Plenty Regional Council
July 2019 Job No: 1001628.v5
The geology of some areas within the Tauranga Harbour has been well studied. One of the main areas of study is Omokoroa, where sensitive silts within the Matua Subgroup (loosely classified as the Pahoia Tephras; Moon et al., 2013) are associated with landslips and instability after periods of extreme rainfall.
Sensitivity of soils is a measure of the loss of strength when a soil is disturbed or remoulded (NZGS, 2005). In Omokoroa, Moon et al. (2013) states that the sensitivity is developed in the sequences of rhyolitic pyroclastic materials, including primary pyroclastic fall deposits (tephra), pyroclastic flow deposits (ignimbrite), and a wide variety of reworked pyroclastics (Moon et al., 2013). The Pahoia Tephra sequence is an example of these primary and reworked rhyolitic volcaniclastic materials.
Moon et al. (2013) analysed the different materials in a large landslip at Bramley Drive in Omokoroa, and have described how the sensitive material is affected by rainfall leading to instability, as follows:
“The materials at the top of the profile are highly permeable, allowing rapid infiltration of surface water. Deeper layers have lower permeability, meaning that water transport from the profile is low, and water tables remain high year-round, creating consistently high saturation levels. Consequently, pore water pressures can rise quickly and easily, triggering failure; the very high porosity and high liquidity indexes result in sensitive soils that generate extensive debris flows.”
Similar sensitive materials are found in other areas of Tauranga Harbour in the Moon et al. (2013) study such as Te Puna, Matua and Maungatapu.
Further information on site-specific geology is provided within Appendix A.
2.3 Sediments
Sedimentation rates in the southern harbour are low compared to other New Zealand estuaries. Annual-average sedimentation rates of 0.75 to 1.57 mm/yr on intertidal flats have been documented over the last 50 to 100 years (Hancock et al., 2009). Model results indicate that current sedimentation rates are highest where sediment is trapped along the fringes of embayments (e.g. Welcome Bay; Green, 2010). The largest freshwater discharge into Tauranga Harbour is from the Wairoa River. However, Green (2010) states that close to 95% of the fine sediment discharged from the Wairoa River is lost to the ocean and hence the intertidal flats within the harbour are not a long term sink for fine terrigenous sediments.
2.4 Vertical land movement
Beavan and Litchfield (2012) have assessed vertical land movement (VLM) around New Zealand’s coastline. They found the land around Tauranga relatively stable or slightly uplifting, with the rate of VLM in the Papamoa hills being +0.5 mm/yr, measured over approximately 9 years. Rates of VLM can change significantly over 10’s of kilometres, so the rate measured in the Papamoa hills may not be accurate for Tauranga Harbour. We recommend installing more VLM gauges around Tauranga Harbour to improve the spatial coverage and understanding of VLM rates within the region. For the sea level rise (SLR) values within this assessment, there has been no additional allowance for VLM.
2.5 Water levels
Water levels play an important role in determining coastal erosion hazard. Water levels control the amount of wave energy reaching the backshore, causing erosion during storm events and by controlling the mean shoreline position on longer time scales.
A full description of the water level components is given in the accompanied Stephens (2019) report. Key components that determine water level are:
Astronomical tides
8
Tonkin & Taylor Ltd Tauranga Harbour Coastal Hazards Study - Coastal Erosion Assessment Bay of Plenty Regional Council
July 2019 Job No: 1001628.v5
Barometric and wind effects, generally referred to as storm surge
Medium term fluctuations, including ENSO and IPO effects
Long term changes in sea level
Wave transformation processes through wave setup and run-up.
2.5.1 Astronomical tide
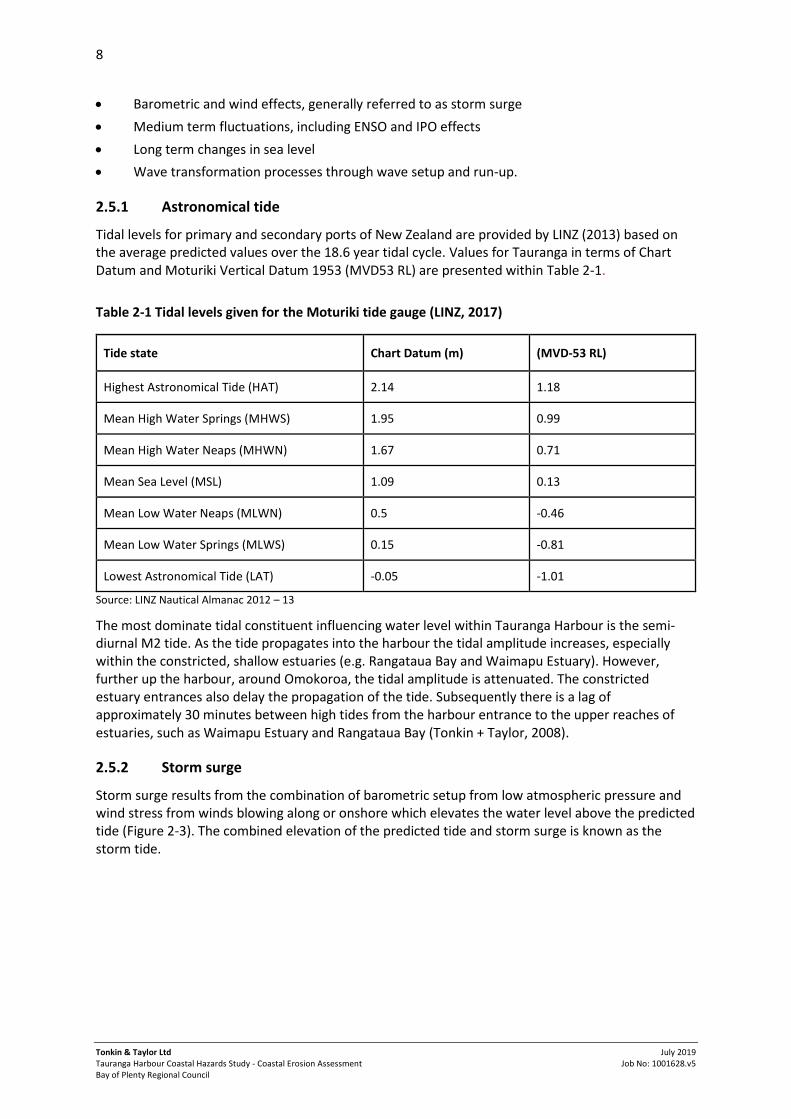
Tidal levels for primary and secondary ports of New Zealand are provided by LINZ (2013) based on the average predicted values over the 18.6 year tidal cycle. Values for Tauranga in terms of Chart Datum and Moturiki Vertical Datum 1953 (MVD53 RL) are presented within Table 2-1.
Table 2-1 Tidal levels given for the Moturiki tide gauge (LINZ, 2017)
Tide state Chart Datum (m) (MVD-53 RL)
Highest Astronomical Tide (HAT) 2.14 1.18
Mean High Water Springs (MHWS) 1.95 0.99
Mean High Water Neaps (MHWN) 1.67 0.71
Mean Sea Level (MSL) 1.09 0.13
Mean Low Water Neaps (MLWN) 0.5 -0.46
Mean Low Water Springs (MLWS) 0.15 -0.81
Lowest Astronomical Tide (LAT) -0.05 -1.01
Source: LINZ Nautical Almanac 2012 – 13
The most dominate tidal constituent influencing water level within Tauranga Harbour is the semi-diurnal M2 tide. As the tide propagates into the harbour the tidal amplitude increases, especially within the constricted, shallow estuaries (e.g. Rangataua Bay and Waimapu Estuary). However, further up the harbour, around Omokoroa, the tidal amplitude is attenuated. The constricted estuary entrances also delay the propagation of the tide. Subsequently there is a lag of approximately 30 minutes between high tides from the harbour entrance to the upper reaches of estuaries, such as Waimapu Estuary and Rangataua Bay (Tonkin + Taylor, 2008).
2.5.2 Storm surge
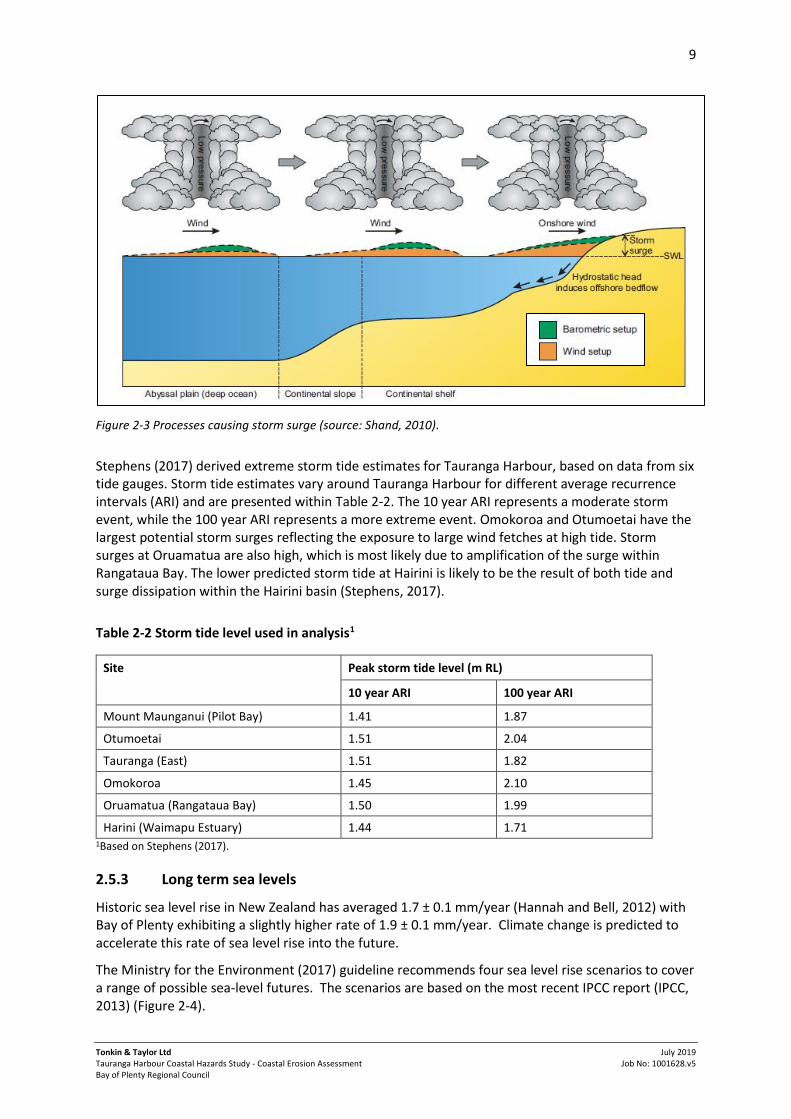
Storm surge results from the combination of barometric setup from low atmospheric pressure and wind stress from winds blowing along or onshore which elevates the water level above the predicted tide (Figure 2-3). The combined elevation of the predicted tide and storm surge is known as the storm tide.
9
Tonkin & Taylor Ltd Tauranga Harbour Coastal Hazards Study - Coastal Erosion Assessment Bay of Plenty Regional Council
July 2019 Job No: 1001628.v5
Figure 2-3 Processes causing storm surge (source: Shand, 2010).
Stephens (2017) derived extreme storm tide estimates for Tauranga Harbour, based on data from six tide gauges. Storm tide estimates vary around Tauranga Harbour for different average recurrence intervals (ARI) and are presented within Table 2-2. The 10 year ARI represents a moderate storm event, while the 100 year ARI represents a more extreme event. Omokoroa and Otumoetai have the largest potential storm surges reflecting the exposure to large wind fetches at high tide. Storm surges at Oruamatua are also high, which is most likely due to amplification of the surge within Rangataua Bay. The lower predicted storm tide at Hairini is likely to be the result of both tide and surge dissipation within the Hairini basin (Stephens, 2017).
Table 2-2 Storm tide level used in analysis1
Site Peak storm tide level (m RL)
10 year ARI 100 year ARI
Mount Maunganui (Pilot Bay) 1.41 1.87
Otumoetai 1.51 2.04
Tauranga (East) 1.51 1.82
Omokoroa 1.45 2.10
Oruamatua (Rangataua Bay) 1.50 1.99
Harini (Waimapu Estuary) 1.44 1.71 1Based on Stephens (2017).
2.5.3 Long term sea levels
Historic sea level rise in New Zealand has averaged 1.7 ± 0.1 mm/year (Hannah and Bell, 2012) with Bay of Plenty exhibiting a slightly higher rate of 1.9 ± 0.1 mm/year. Climate change is predicted to accelerate this rate of sea level rise into the future.
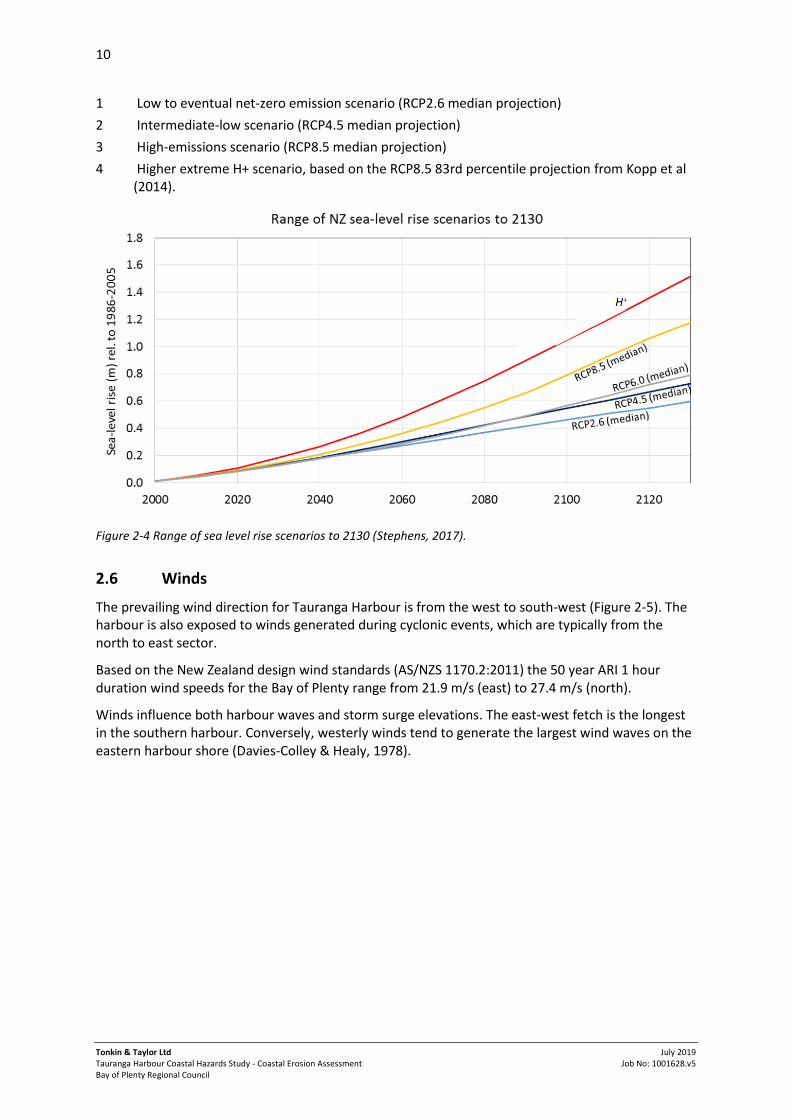
The Ministry for the Environment (2017) guideline recommends four sea level rise scenarios to cover a range of possible sea-level futures. The scenarios are based on the most recent IPCC report (IPCC, 2013) (Figure 2-4).
10
Tonkin & Taylor Ltd Tauranga Harbour Coastal Hazards Study - Coastal Erosion Assessment Bay of Plenty Regional Council
July 2019 Job No: 1001628.v5
1 Low to eventual net-zero emission scenario (RCP2.6 median projection)
2 Intermediate-low scenario (RCP4.5 median projection)
3 High-emissions scenario (RCP8.5 median projection)
4 Higher extreme H+ scenario, based on the RCP8.5 83rd percentile projection from Kopp et al (2014).
Figure 2-4 Range of sea level rise scenarios to 2130 (Stephens, 2017).
2.6 Winds
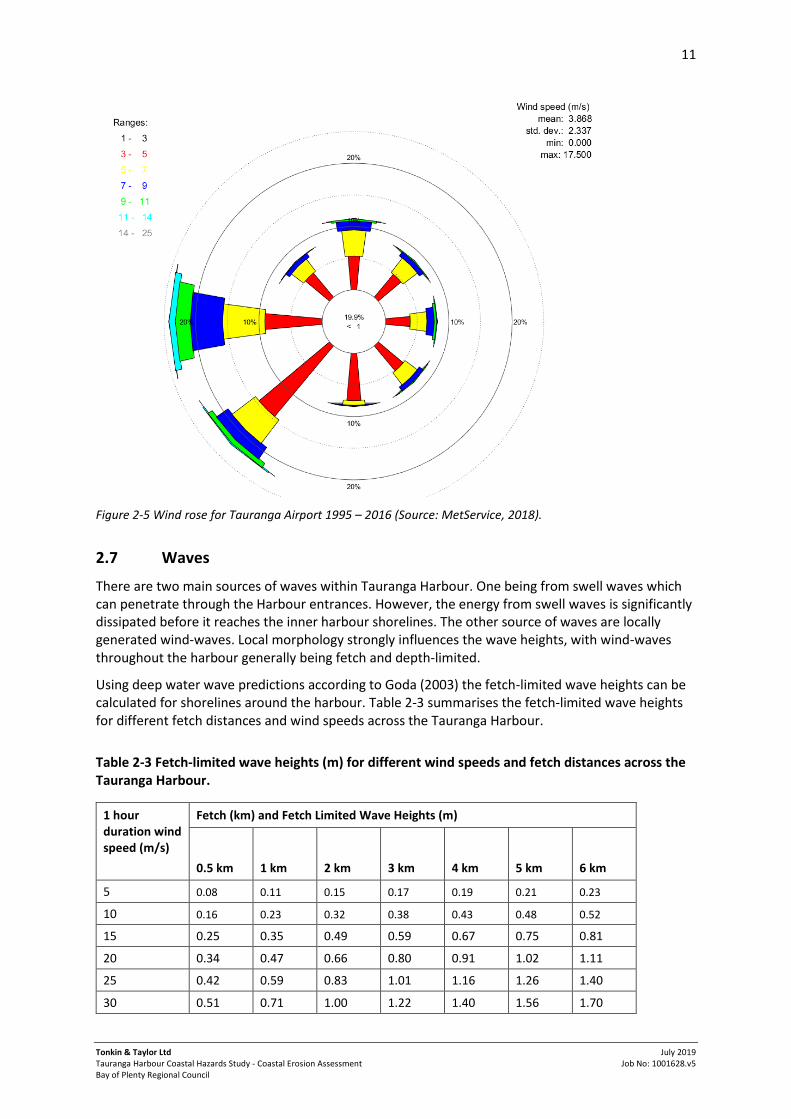
The prevailing wind direction for Tauranga Harbour is from the west to south-west (Figure 2-5). The harbour is also exposed to winds generated during cyclonic events, which are typically from the north to east sector.
Based on the New Zealand design wind standards (AS/NZS 1170.2:2011) the 50 year ARI 1 hour duration wind speeds for the Bay of Plenty range from 21.9 m/s (east) to 27.4 m/s (north).
Winds influence both harbour waves and storm surge elevations. The east-west fetch is the longest in the southern harbour. Conversely, westerly winds tend to generate the largest wind waves on the eastern harbour shore (Davies-Colley & Healy, 1978).
11
Tonkin & Taylor Ltd Tauranga Harbour Coastal Hazards Study - Coastal Erosion Assessment Bay of Plenty Regional Council
July 2019 Job No: 1001628.v5
Figure 2-5 Wind rose for Tauranga Airport 1995 – 2016 (Source: MetService, 2018).
2.7 Waves
There are two main sources of waves within Tauranga Harbour. One being from swell waves which can penetrate through the Harbour entrances. However, the energy from swell waves is significantly dissipated before it reaches the inner harbour shorelines. The other source of waves are locally generated wind-waves. Local morphology strongly influences the wave heights, with wind-waves throughout the harbour generally being fetch and depth-limited.
Using deep water wave predictions according to Goda (2003) the fetch-limited wave heights can be calculated for shorelines around the harbour. Table 2-3 summarises the fetch-limited wave heights for different fetch distances and wind speeds across the Tauranga Harbour.
Table 2-3 Fetch-limited wave heights (m) for different wind speeds and fetch distances across the Tauranga Harbour.
1 hour duration wind speed (m/s)
Fetch (km) and Fetch Limited Wave Heights (m)
0.5 km 1 km 2 km 3 km 4 km 5 km 6 km
5 0.08 0.11 0.15 0.17 0.19 0.21 0.23
10 0.16 0.23 0.32 0.38 0.43 0.48 0.52
15 0.25 0.35 0.49 0.59 0.67 0.75 0.81
20 0.34 0.47 0.66 0.80 0.91 1.02 1.11
25 0.42 0.59 0.83 1.01 1.16 1.26 1.40
30 0.51 0.71 1.00 1.22 1.40 1.56 1.70
12
Tonkin & Taylor Ltd Tauranga Harbour Coastal Hazards Study - Coastal Erosion Assessment Bay of Plenty Regional Council
July 2019 Job No: 1001628.v5
Based on fetch-limited wave heights the shorelines can broadly be classified into high (1 to 1.3 m Hs), moderate (0.7 to 1 m Hs), low (0.5 to 0.7 m Hs) and very low (less than 0.5 m Hs) wave exposure. Examples of shorelines with high wave exposure included Otumoetai, Pilot Bay and northern Omokoroa. Examples of shorelines with very low wave exposure include Welcome Bay, Waimapu and southern Plummers Point. Fetch distances are greatest at high tide, with most wave impact to shorelines occurring only over high tide. In many locations shallow intertidal flats front the shoreline and hence the wave heights reaching the shoreline are likely to be further reduced due to depth-limiting conditions.
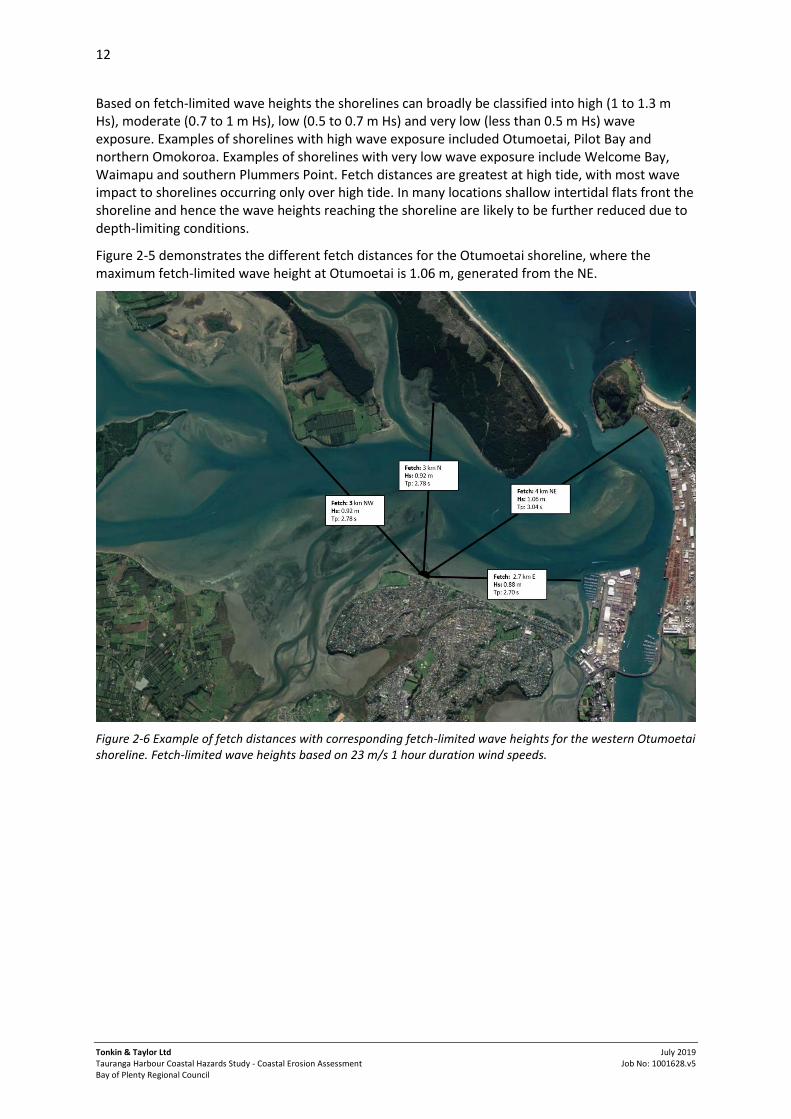
Figure 2-5 demonstrates the different fetch distances for the Otumoetai shoreline, where the maximum fetch-limited wave height at Otumoetai is 1.06 m, generated from the NE.
Figure 2-6 Example of fetch distances with corresponding fetch-limited wave heights for the western Otumoetai shoreline. Fetch-limited wave heights based on 23 m/s 1 hour duration wind speeds.
13
Tonkin & Taylor Ltd Tauranga Harbour Coastal Hazards Study - Coastal Erosion Assessment Bay of Plenty Regional Council
July 2019 Job No: 1001628.v5
3 Data sources
3.1 Previous studies
Previous studies related to coastal erosion within Tauranga Harbour include Healy (1994), Healy et al. (2010), Opus (2015), Garae (2015), Environment Bay of Plenty (2000) and Boston et al. (2008).
Garae (2015) investigated the patterns of coastal cliff retreat at nine regions within Tauranga Harbour, including Omokoroa, Plummers Point and Matakana Island. Long term shoreline changes between 1943, 1982 and 2011 were analysed using the Digital Shoreline Analysis System (DSAS).The maximum rate of shoreline retreat was measured at the southwestern end of Matakana Island where it is was estimated up to -1.12 m/yr. High erosion rates were also measured along the western side of Omokoroa (up to -0.26 m/yr). A comparison of erosion rates with the underlying geological units, indicates that the Matua Subgroup had the highest rate of erosion (average rate of -0.2 m/yr). Garae (2015) accounts for the average geo-referencing error for each of the aerial photographs. However, it is noted that geo-referencing is the greatest source of error in the analysis.
Opus (2015) includes a high level coastal erosion assessment for 28 sites around Tauranga Harbour. The erosion rates are quantified from aerial photographs from 1943, 1959, 1964, 1977 and 2011. Transect lines were created at 10 m intervals through the shorelines to calculate the difference between the earliest available shoreline and the most recent shoreline. Long term erosion rates range from 0 to -0.3 m/yr. -
Similarly to Garae (2015), Opus (2015) highlight the error associated with georeferencing and the difficulty of digitizing cliff shorelines where trees obscure the cliffline. Where cliffs showed ‘accretion’ (due to geo-referencing error) the erosion estimate was modified by adding the mean of the accretion to the erosion statistics to correct for this error, thus giving a lower erosion value.
Healy et al. (2010) completes a historic erosion assessment for three regions throughout Tauranga Harbour, including Te Puna, Motuhoa Island and Rangaiwea Island. The assessment involved calculating erosion rates for three periods based on shoreline position in historic aerial photographs from 1943, 1982 1996 and 2002. Erosion rates were determined from selected points along the shoreline. The study identified a maximum erosion rate of -1.73 m/yr from 1943 to 1982 at Te Puna Beach. However, there is uncertainty in the erosion rates due to the large error associated with geo-referencing of the historic aerials.
Healy (1994) looks specifically at erosion along the Whareroa shoreline, where causes and potential solutions for the erosion are discussed.
Environment Bay of Plenty (2000) includes an assessment of the effects of coastal protection works on geomorphic processes within the harbour. The study investigates bed levels around structures at a variety of sites including Welcome Bay, Rotary Park and Anchorage Reserve (Maungatapu), Waimapu Estuary, Otumoetai, Fergusson Park (Matua) and Omokoroa.
Boston et al. (2008) includes a vegetation survey along the Tauranga Harbour margin, linking vegetation type with areas which appear more prone to coastal erosion. The study concludes that regions with exotic vegetation tend to be prone to erosion whereas slopes comprising undisturbed native vegetation, especially pohutukawa, were significantly more stable.
14
Tonkin & Taylor Ltd Tauranga Harbour Coastal Hazards Study - Coastal Erosion Assessment Bay of Plenty Regional Council
July 2019 Job No: 1001628.v5
3.2 Site inspections
Site inspections were undertaken for all sites between August and November 2017. Individual site characteristics are described within the site assessments (Appendix A). In addition to shoreline observations and photographs, laser scan profiles were taken in several cliff locations where there was evidence of a stable slope. The profiles have been used as a component for determining the range of stable cliff angles at each site.
3.3 Aerial photographs
The historical shoreline data was processed from aerial images using standard geo-referencing and digitising GIS methods using ArcGIS and Global Mapper software. Available aerial photographs were sourced from BOPRC, TCC and Retrolens. Refer to Table 3-1 for a summary of the historic aerial photographs sourced for this study.
When using aerial photographs, the harbour vegetation edge is used as the shoreline proxy for unconsolidated shorelines, and the cliff toe for consolidated shorelines.
There are three main sources of potential error when estimating the shoreline position. These sources of error include:
1 Geo-referencing error
2 Shoreline proxy error
3 Digitising error.
Based on the resolution of the aerial photographs the overall error associated with the shoreline position has been estimated. The overall error tends to be greatest for the oldest aerial photographs (Table 3-1).
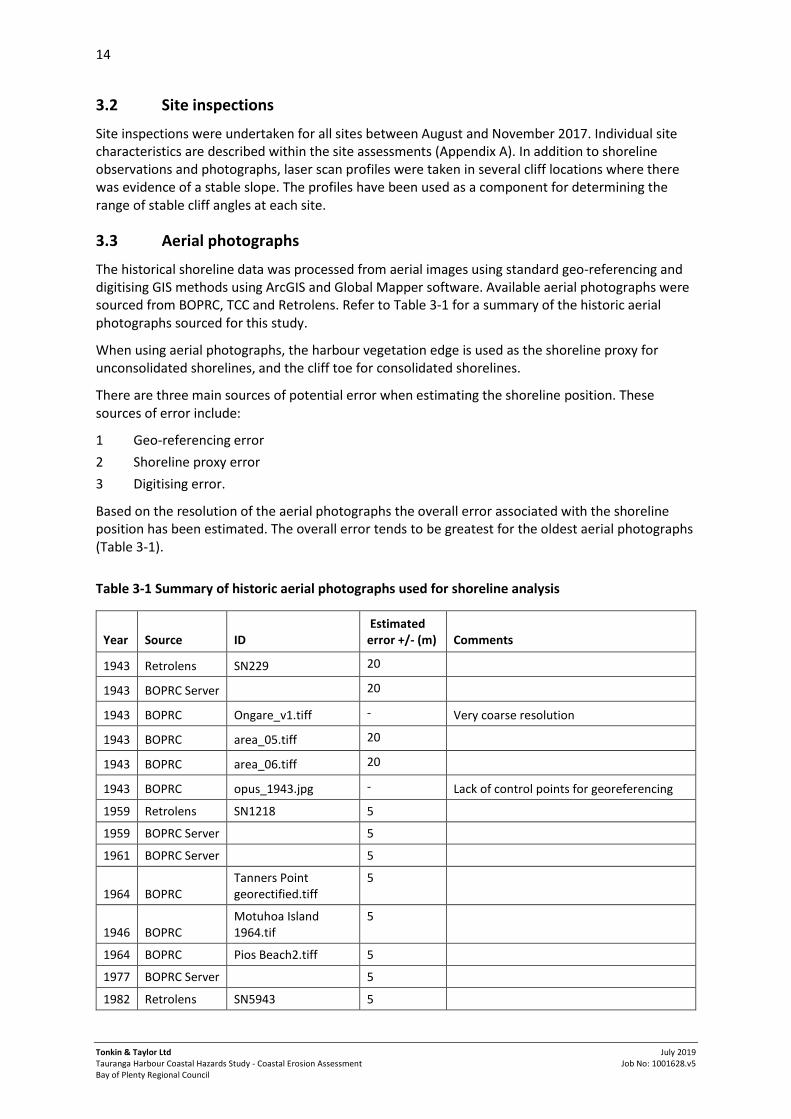
Table 3-1 Summary of historic aerial photographs used for shoreline analysis
Year Source ID Estimated error +/- (m) Comments
1943 Retrolens SN229 20
1943 BOPRC Server 20
1943 BOPRC Ongare_v1.tiff - Very coarse resolution
1943 BOPRC area_05.tiff 20
1943 BOPRC area_06.tiff 20
1943 BOPRC opus_1943.jpg - Lack of control points for georeferencing
1959 Retrolens SN1218 5 1959 BOPRC Server 5 1961 BOPRC Server 5
1964 BOPRC Tanners Point georectified.tiff
5
1946 BOPRC Motuhoa Island 1964.tif
5
1964 BOPRC Pios Beach2.tiff 5 1977 BOPRC Server 5 1982 Retrolens SN5943 5
15
Tonkin & Taylor Ltd Tauranga Harbour Coastal Hazards Study - Coastal Erosion Assessment Bay of Plenty Regional Council
July 2019 Job No: 1001628.v5
Year Source ID Estimated error +/- (m) Comments
1982 Retrolens SN5944 5 1986 Retrolens SN8626 5 1986 Retrolens SN8627 5 1992 BOPRC Server 5 1994 BOPRC Server 5 1996 BOPRC Server 5 2007 BOPRC Server 5 2011 BOPRC Server 2 2014 BOPRC Server 2
2017 BOPRC Server 1
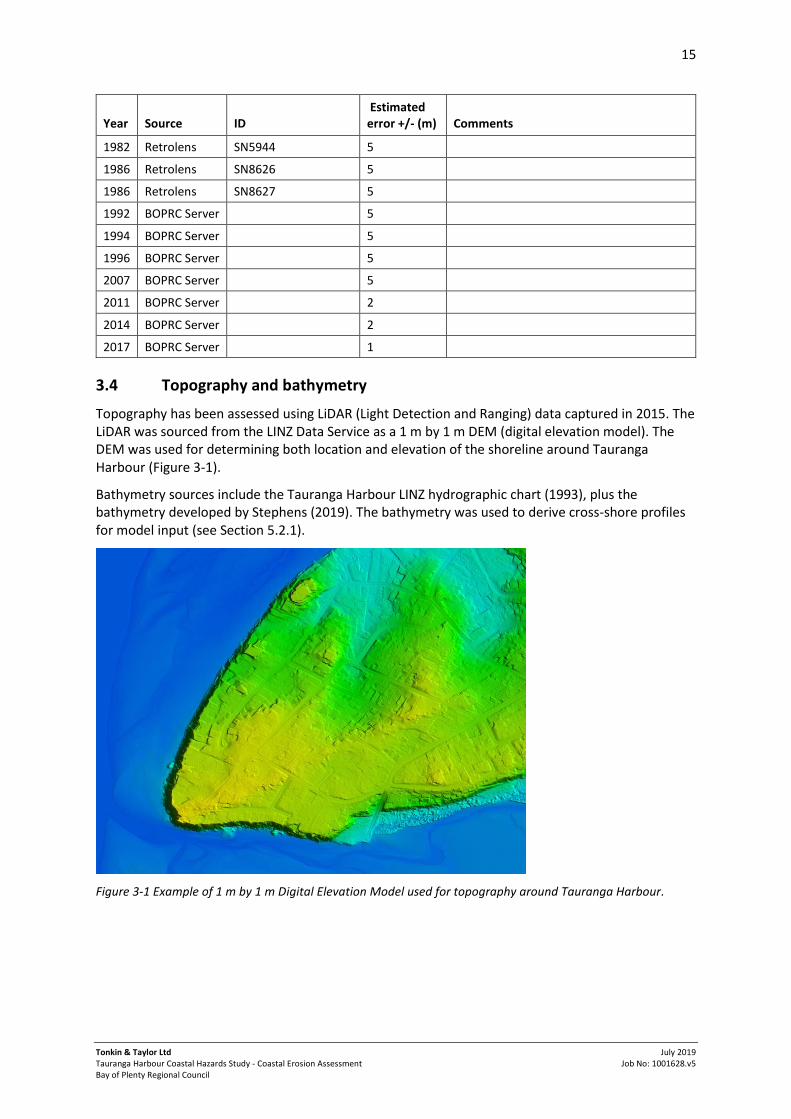
3.4 Topography and bathymetry
Topography has been assessed using LiDAR (Light Detection and Ranging) data captured in 2015. The LiDAR was sourced from the LINZ Data Service as a 1 m by 1 m DEM (digital elevation model). The DEM was used for determining both location and elevation of the shoreline around Tauranga Harbour (Figure 3-1).
Bathymetry sources include the Tauranga Harbour LINZ hydrographic chart (1993), plus the bathymetry developed by Stephens (2019). The bathymetry was used to derive cross-shore profiles for model input (see Section 5.2.1).
Figure 3-1 Example of 1 m by 1 m Digital Elevation Model used for topography around Tauranga Harbour.
16
Tonkin & Taylor Ltd Tauranga Harbour Coastal Hazards Study - Coastal Erosion Assessment Bay of Plenty Regional Council
July 2019 Job No: 1001628.v5
4 Methodology
4.1 Statutory considerations
4.1.1 New Zealand Coastal Policy Statement
The New Zealand Coastal Policy Statement (NZCPS) is a national policy statement under the Resource Management Act 1991. The NZCPS states policies in order to achieve the purpose of the Act in relation to the coastal environments of New Zealand. Regional policy statements and plans must give effect to (be consistent with) the NZCPS.
A number of the Objectives and Policies of the NZCPS are directly relevant to the assessment of coastal erosion hazard. Relevant policies include:
Policy 3 - requires a precautionary approach in the use and management of coastal resources
potentially vulnerable to effects from climate change so that avoidable social and economic
loss and harm to communities does not occur.
Policy 24 - requires identification of areas in the coastal environment that are potentially
affected by coastal hazards (including Tsunami) giving priority to the identification of areas at
high risk of being affected. Hazard risks, over at least 100 years, should be assessed having
regard to:
physical drivers and processes that cause coastal change including sea level rise
short term and long term natural dynamic fluctuations of erosion and accretion
geomorphological character
cumulative effects of sea level rise, storm surge and wave height under storm
conditions
anthropogenic influences
extent and permanence of built development
effects of climate change on the above matters, on storm frequency and intensity and
on natural sediment dynamics.
These should take into account national guidance and the best available information on the likely effects of climate change for each region.
Policy 25 - promotes avoiding increasing the risk of social, environmental and economic to
erosion hazard in areas potentially affected by coastal hazards over at least the next 100
years.
Policy 27 - promotes reducing hazard risk in areas of significant existing development likely to
be affected by coastal hazards.
4.1.2 Regional Policy Statement
The Bay of Plenty Regional Policy Statement (RPS) outlines the Natural Hazard Policies for the region. The following Policy is relevant to this assessment:
Policy NH 7A – Identify areas susceptible to natural hazards. Map hazard susceptibility areas (HSA) for the following natural hazards:
c) Coastal and marine processes
i) coastal erosion
ii) coastal inundation
17
Tonkin & Taylor Ltd Tauranga Harbour Coastal Hazards Study - Coastal Erosion Assessment Bay of Plenty Regional Council
July 2019 Job No: 1001628.v5
Policy NH 11B - Incorporate the effects of climate change in natural hazard risk assessment and use the following projections as minimum values when undertaking coastal hazard assessments:
a a 100 year timeframe;
b a projection of a base sea level rise of at least 0.6 m (above the 1980–1999 average) for activities/developments which are relocatable;
c a projection of a base sea level rise of 0.9 m (above 1980–1999 average) for activities where future adaptation options are limited, such as regionally significant infrastructure and developments which cannot be relocated.
d an additional sea level rise of 10 mm/annum for activities with life spans beyond 2112.
4.1.3 Proposed Regional Coastal Environment Plan
The Bay of Plenty Regional Proposed Coastal Environment Plan (PRCEP) was publicly notified on 24 June 2014. The PRCEP manages the natural and physical resources of the Bay of Plenty coastal environment. This is a review of the operative Bay of Plenty Regional Coastal Environment Plan.
Chapter 5 of the PRCEP covers coastal hazards and section 5.1.3 specifically details the following policies on coastal hazard for sandy coasts and river mouth shorelines.
Policy CH 11 - Identify and map erosion and inundation zones over a 100 year timeframe in high priority areas
Policy CH 12 – apply an appropriate method to identify the erosion extent taking into account best practice guidelines, scientific guidance and relevant components including shoreline response to sea level rise.
This study maps erosion in accordance with the RRCEP policy above and also the RPS requirements for hazard susceptibility areas.
4.2 Risk-based approach
A risk-based approach to managing coastal hazard is advocated by the NZCPS and endorsed by BOPRC’s RPS, with both the likelihood and consequence of hazard occurrence requiring consideration. For example, the NZCPS suggests consideration of areas both ‘likely’ to be affected by hazard and areas ‘potentially’ affected by hazard. The term likely may be related to a likelihood over a defined timeframe based on guidance provided by MfE (2017). This assessment aims to derive a range of hazard zones corresponding to differing likelihoods which may be applied to a risk assessment.
4.3 Stochastic forecast approach
The methodology used in this study combines standard and well-tested approaches for defining coastal erosion hazard zones by addition of component parameters (Gibb, 1978; T+T, 2004; 2006; 2012; CSL, 2008; 2012) over a selected timeframe. However, in this report, rather than including single values for each component and a factor for uncertainty, parameter bounds are specified for each parameter and combined by stochastic simulation. The resulting distribution is a probabilistic forecast of potential hazard zone width over a selected timeframe.
The method is based on the premise that uncertainty is inherent in individual components due to an imprecise understanding of the natural processes and due to alongshore variability within individual study cells. Stochastic simulation allows the effect of these uncertainties to be explored simultaneously providing estimates of the combined hazard extent (i.e. the central tendency) and information on potential ranges and upper limit values. This contrasts with deterministic models
18
Tonkin & Taylor Ltd Tauranga Harbour Coastal Hazards Study - Coastal Erosion Assessment Bay of Plenty Regional Council
July 2019 Job No: 1001628.v5
where the combination of individual conservative parameters with additional factors for uncertainty often result in very conservative products and limited understanding of potential uncertainty range.
The stochastic method is described in Cowell et al. (2006). The methods used to define probability distribution functions (pdfs) for each parameter are described within the parameter descriptions below. Where pdfs are not defined empirically (i.e. based on data or model results), simple triangular distributions have been assumed with bounding (minimum and maximum) and modal parameters. These triangular distributions can be constructed with very little information yet approximate a normal distribution and permit flexibility in defining range and skewed asymmetry.
4.4 Defining coastal behaviour cells
Each site (designated sites 1 to 32) has been divided into coastal cells based on shoreline composition and behaviour which can influence the resultant hazard. Factors which may influence the behaviour of a cell include:
cell morphology and lithology
exposure to waves
profile geometry
backshore elevation
historical shoreline trends.
4.5 Baseline derivation
For each site a baseline has been defined and used to offset the coastal erosion hazard. The baselines are equivalent to the shoreline identified within the most recent aerial photographs. For the Western Bay of Plenty sites the baseline has been derived from the 2014/2015 aerial photograph, whereas for the Tauranga City shorelines the baseline has been derived from the 2017 (January-April) aerial photograph.
4.6 Coastal erosion methodologies
Tauranga Harbour contains a range of coastal types. The processes controlling erosion along these different coastal types vary. Therefore the methods used to determine coastal erosion hazard zone distances must also vary to account for these differing processes. The expressions used to define Coastal Erosion and Instability Hazard Areas (CEIHAs) for the three major coastal types are presented below.
4.6.1 Unconsolidated shorelines
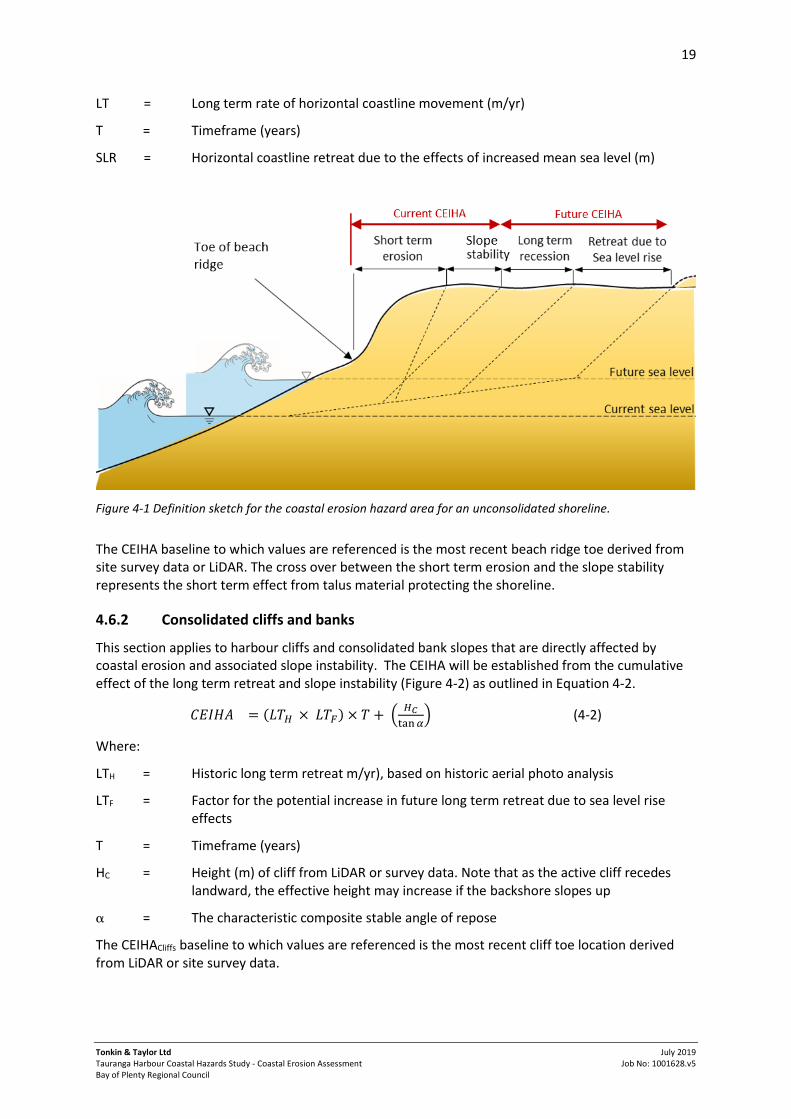
The method for unconsolidated shorelines is expressed in Equation 4-1. The CEIHA will be established from the cumulative effect of four main parameters (Figure 4-1):
𝐶𝐸𝐼𝐻𝐴 = 𝑆𝑇 + 𝑆𝑆 + (𝐿𝑇 × 𝑇) + 𝑆𝐿𝑅 (4-1)
Where:
ST = Short term changes in horizontal shoreline position related to storm erosion due to singular or a cluster of storms events or fluctuations in sediment supply and demand, beach rotation and cyclical changes in wave climate (m)
SS = Slope stability allowance. This is the horizontal distance from the base of the eroded slope to the crest at a stable angle of repose (m)
19
Tonkin & Taylor Ltd Tauranga Harbour Coastal Hazards Study - Coastal Erosion Assessment Bay of Plenty Regional Council
July 2019 Job No: 1001628.v5
LT = Long term rate of horizontal coastline movement (m/yr)
T = Timeframe (years)
SLR = Horizontal coastline retreat due to the effects of increased mean sea level (m)
Figure 4-1 Definition sketch for the coastal erosion hazard area for an unconsolidated shoreline.
The CEIHA baseline to which values are referenced is the most recent beach ridge toe derived from site survey data or LiDAR. The cross over between the short term erosion and the slope stability represents the short term effect from talus material protecting the shoreline.
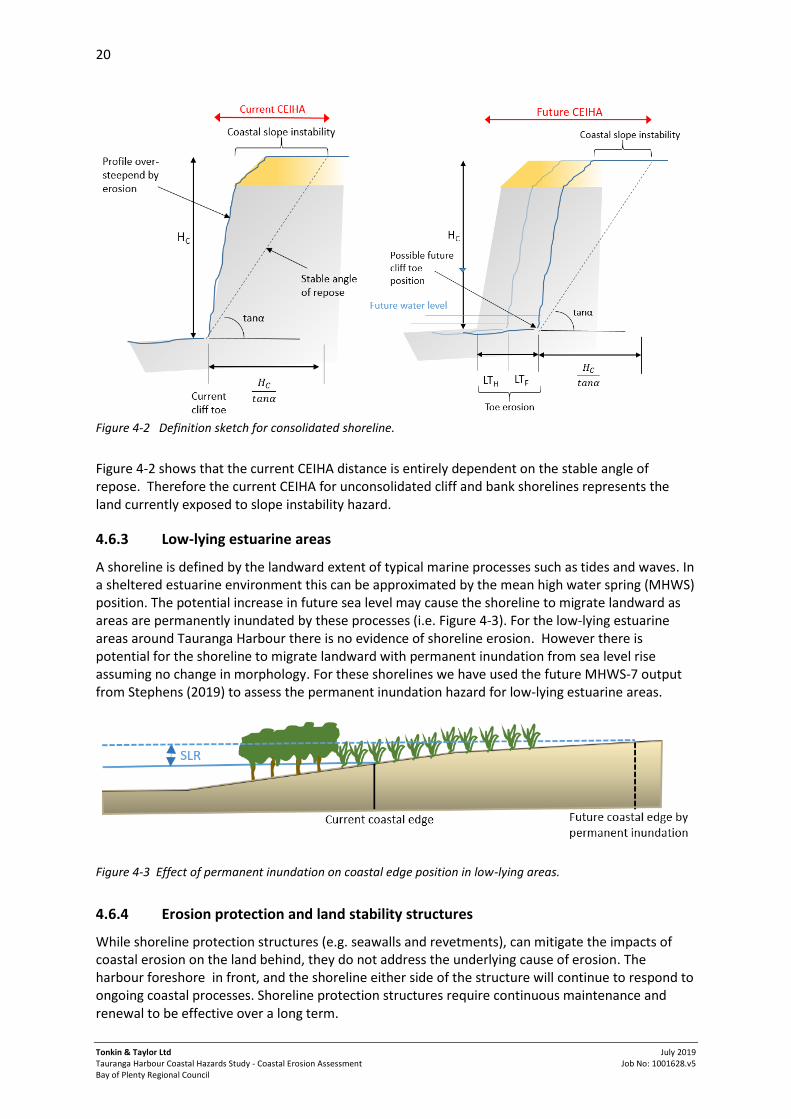
4.6.2 Consolidated cliffs and banks
This section applies to harbour cliffs and consolidated bank slopes that are directly affected by coastal erosion and associated slope instability. The CEIHA will be established from the cumulative effect of the long term retreat and slope instability (Figure 4-2) as outlined in Equation 4-2.
𝐶𝐸𝐼𝐻𝐴 = (𝐿𝑇𝐻 × 𝐿𝑇𝐹) × 𝑇 + (𝐻𝐶
tan 𝛼) (4-2)
Where:
LTH = Historic long term retreat m/yr), based on historic aerial photo analysis
LTF = Factor for the potential increase in future long term retreat due to sea level rise effects
T = Timeframe (years)
HC = Height (m) of cliff from LiDAR or survey data. Note that as the active cliff recedes landward, the effective height may increase if the backshore slopes up
= The characteristic composite stable angle of repose
The CEIHACliffs baseline to which values are referenced is the most recent cliff toe location derived from LiDAR or site survey data.
20
Tonkin & Taylor Ltd Tauranga Harbour Coastal Hazards Study - Coastal Erosion Assessment Bay of Plenty Regional Council
July 2019 Job No: 1001628.v5
Figure 4-2 Definition sketch for consolidated shoreline.
Figure 4-2 shows that the current CEIHA distance is entirely dependent on the stable angle of repose. Therefore the current CEIHA for unconsolidated cliff and bank shorelines represents the land currently exposed to slope instability hazard.
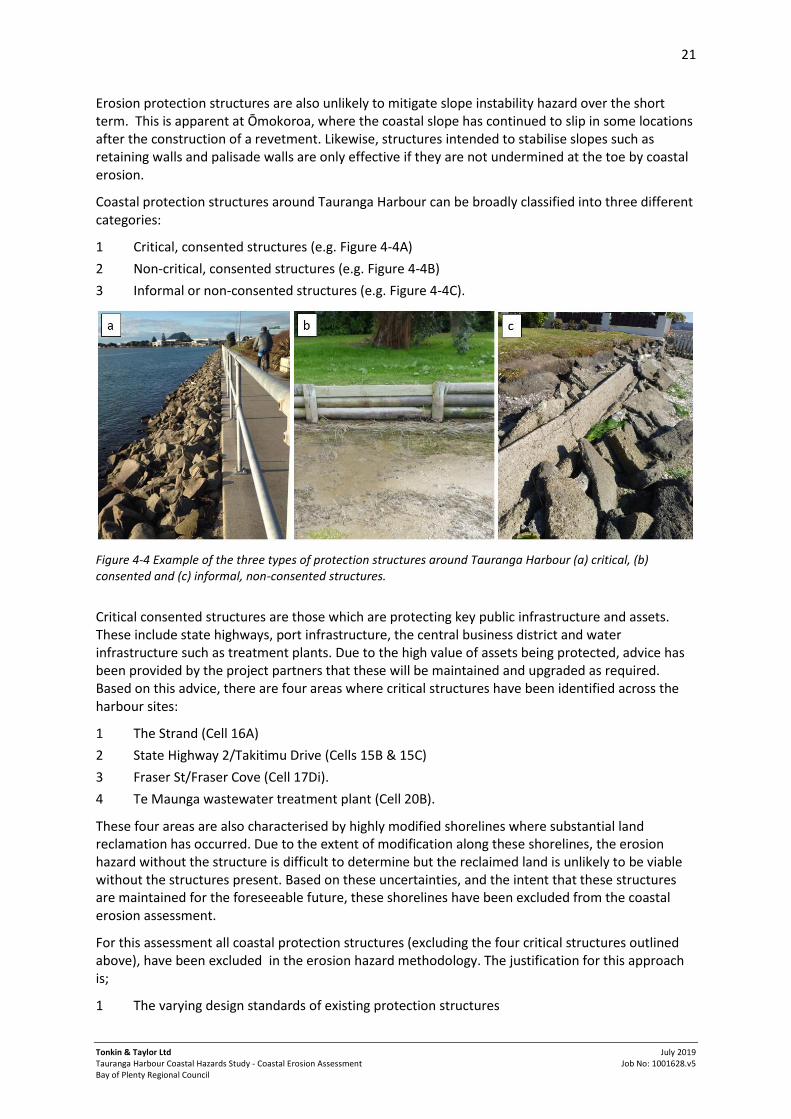
4.6.3 Low-lying estuarine areas
A shoreline is defined by the landward extent of typical marine processes such as tides and waves. In a sheltered estuarine environment this can be approximated by the mean high water spring (MHWS) position. The potential increase in future sea level may cause the shoreline to migrate landward as areas are permanently inundated by these processes (i.e. Figure 4-3). For the low-lying estuarine areas around Tauranga Harbour there is no evidence of shoreline erosion. However there is potential for the shoreline to migrate landward with permanent inundation from sea level rise assuming no change in morphology. For these shorelines we have used the future MHWS-7 output from Stephens (2019) to assess the permanent inundation hazard for low-lying estuarine areas.
Figure 4-3 Effect of permanent inundation on coastal edge position in low-lying areas.
4.6.4 Erosion protection and land stability structures
While shoreline protection structures (e.g. seawalls and revetments), can mitigate the impacts of coastal erosion on the land behind, they do not address the underlying cause of erosion. The harbour foreshore in front, and the shoreline either side of the structure will continue to respond to ongoing coastal processes. Shoreline protection structures require continuous maintenance and renewal to be effective over a long term.
21
Tonkin & Taylor Ltd Tauranga Harbour Coastal Hazards Study - Coastal Erosion Assessment Bay of Plenty Regional Council
July 2019 Job No: 1001628.v5
Erosion protection structures are also unlikely to mitigate slope instability hazard over the short term. This is apparent at Ōmokoroa, where the coastal slope has continued to slip in some locations after the construction of a revetment. Likewise, structures intended to stabilise slopes such as retaining walls and palisade walls are only effective if they are not undermined at the toe by coastal erosion.
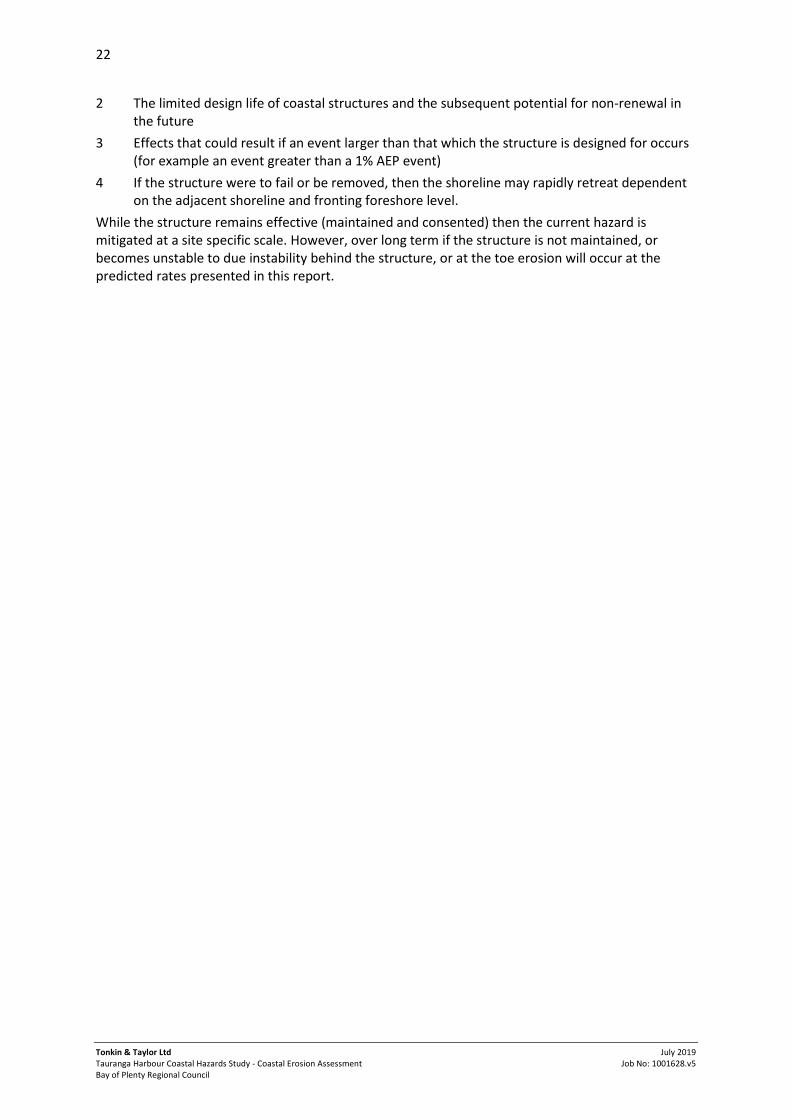
Coastal protection structures around Tauranga Harbour can be broadly classified into three different categories:
1 Critical, consented structures (e.g. Figure 4-4A)
2 Non-critical, consented structures (e.g. Figure 4-4B)
3 Informal or non-consented structures (e.g. Figure 4-4C).
Figure 4-4 Example of the three types of protection structures around Tauranga Harbour (a) critical, (b) consented and (c) informal, non-consented structures.
Critical consented structures are those which are protecting key public infrastructure and assets. These include state highways, port infrastructure, the central business district and water infrastructure such as treatment plants. Due to the high value of assets being protected, advice has been provided by the project partners that these will be maintained and upgraded as required. Based on this advice, there are four areas where critical structures have been identified across the harbour sites:
1 The Strand (Cell 16A)
2 State Highway 2/Takitimu Drive (Cells 15B & 15C)
3 Fraser St/Fraser Cove (Cell 17Di).
4 Te Maunga wastewater treatment plant (Cell 20B).
These four areas are also characterised by highly modified shorelines where substantial land reclamation has occurred. Due to the extent of modification along these shorelines, the erosion hazard without the structure is difficult to determine but the reclaimed land is unlikely to be viable without the structures present. Based on these uncertainties, and the intent that these structures are maintained for the foreseeable future, these shorelines have been excluded from the coastal erosion assessment.
For this assessment all coastal protection structures (excluding the four critical structures outlined above), have been excluded in the erosion hazard methodology. The justification for this approach is;
1 The varying design standards of existing protection structures
22
Tonkin & Taylor Ltd Tauranga Harbour Coastal Hazards Study - Coastal Erosion Assessment Bay of Plenty Regional Council
July 2019 Job No: 1001628.v5
2 The limited design life of coastal structures and the subsequent potential for non-renewal in the future
3 Effects that could result if an event larger than that which the structure is designed for occurs (for example an event greater than a 1% AEP event)
4 If the structure were to fail or be removed, then the shoreline may rapidly retreat dependent on the adjacent shoreline and fronting foreshore level.
While the structure remains effective (maintained and consented) then the current hazard is mitigated at a site specific scale. However, over long term if the structure is not maintained, or becomes unstable to due instability behind the structure, or at the toe erosion will occur at the predicted rates presented in this report.
23
Tonkin & Taylor Ltd Tauranga Harbour Coastal Hazards Study - Coastal Erosion Assessment Bay of Plenty Regional Council
July 2019 Job No: 1001628.v5
5 Component derivation
5.1 Planning timeframe (T)
Three planning timeframes (Table 5-1) were applied to provide information on current hazards and information at sufficient time scales for planning and accommodating future development:
Table 5-1 Planning timeframes and equivalent Coastal Erosion Hazard Area (CEIHA) scenarios used within the assessment
Planning timeframe (year) Timeframe scenario
Current Current CEIHA
50 years (2080) 2080 CEIHA
100 years (2130) 2130 CEIHA
The future planning timeframes were selected by the Project Partners to best align with the potential city and district plan change requirements in accordance with the NZCPS, RPS and PRCEP. For example the 2130 CEIHA is a 100 year planning timeframe which includes a 10 year intended life of the city or district plan from the approximate date a change is likely to become operative (i.e. 2020).
5.2 Short term erosion (ST)
Short term effects apply to unconsolidated beach and estuary coastlines where natural recovery follows periods of erosion. These effects include changes in horizontal shoreline position due to storm erosion caused by singular or clusters of storms events, or seasonal fluctuations in wave climate or sediment supply and demand.
The short term coastline movements can be assessed from analysis of:
1 Existing information sources such as previous reports and anecdotal evidence
2 Statistical analysis of shoreline position obtained from aerial photographs or beach profile analysis
3 Numerical assessment of storm erosion potential using semi-process based methods.
Due to lack of previous short term erosion assessments and beach profile data around Tauranga Harbour, the short term component is mostly derived from semi-process based methods.
5.2.1 Semi-process based methods
Erosion of the upper beach is dependent on the energy able to reach the backshore, the duration of exposure to that energy and the erodibility of the upper beach material. The energy able to reach the backshore is dependent on water level and the offshore profile which controls wave breaking and energy dissipation. Both of these parameters change over the duration of a storm event.
Semi-process based model description
The numerical cross-shore sediment transport and profile change model SBEACH (Storm Induced BEAch CHange) (Larson and Kraus, 1989) has been used to define storm cut volumes and horizontal movement of the dune toe. SBEACH considers sand grain size, the pre-storm beach profile and dune height, plus time series of wave height, wave period and water level in calculating a post-storm beach profile. Model development involved extensive calibration against both large scale wave tank laboratory data and field data. SBEACH has been verified for measured storm erosion on the Australian east coast (Carley, 1992; Carley et al. 1998). Although this study involves an estuary
24
Tonkin & Taylor Ltd Tauranga Harbour Coastal Hazards Study - Coastal Erosion Assessment Bay of Plenty Regional Council
July 2019 Job No: 1001628.v5
environment instead of the open coast, the overall processes and input for SBEACH are still applicable.
Model input
The SBEACH model requires the following inputs:
Representative crosshore profile
Design storm time series
Representative grain size.
A representative cross-shore profile from the beach ridge crest to 400 m offshore was assessed for four unconsolidated shorelines within the harbour which are each representative of the different wave exposure levels (section 2.7. Profile information was obtained from Stephens (2019).
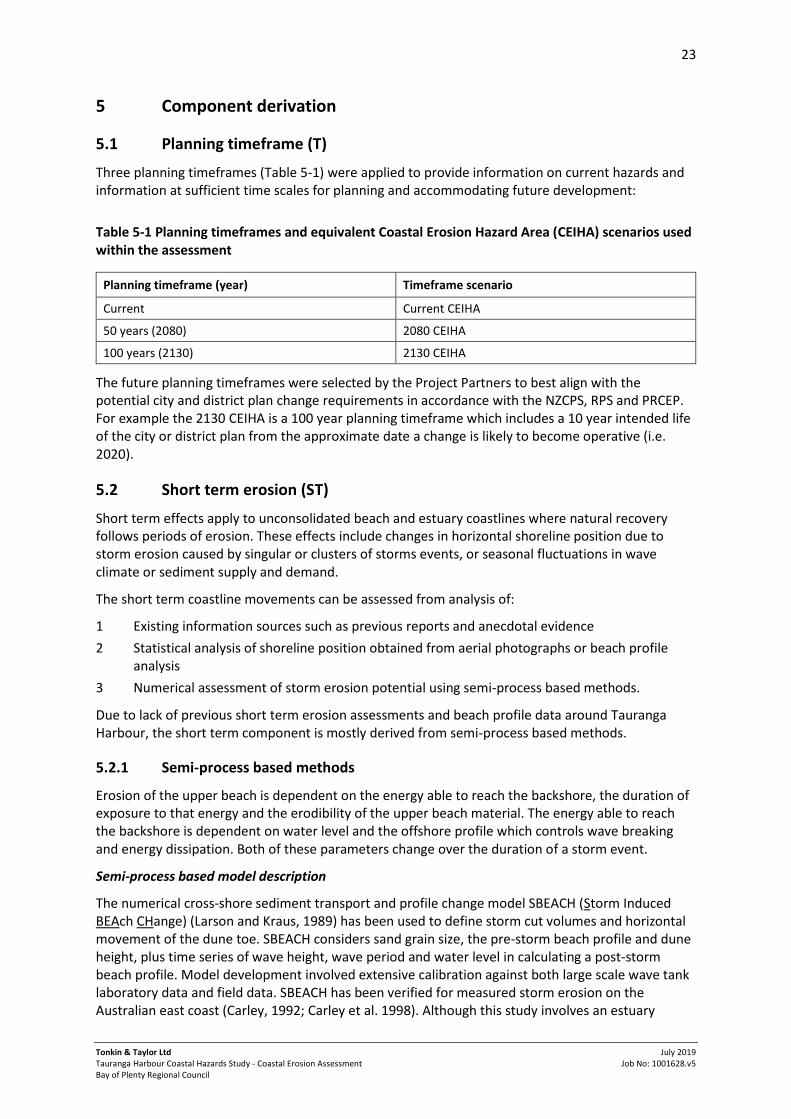
Design storm tide water level time series with a uniform wave height and period are applied at the outer profile boundary (i.e. Figure 5-1 for Pilot Bay). Design wave heights are derived based on wind speeds from the New Zealand design wind standards (AS/NZS 1170.2:2011). Storm tide levels are based on the extreme sea level estimates from Stephens (2017) (see section 2.5.2).
Design storms for 10 year, 100 year and 2x100 year Average Recurrence Interval (ARI) events are simulated with the later allowing for potential clustering of storms. Such clustering may result in greater erosion. Although as the first event removes sediment from the system and lowers the beach height, the profile becomes more dissipative and erosion from subsequent events is likely to be less than the first storm event.
Grain size characteristics are included for each profile based on field observations and previous studies (de Lange & Healy, 1990; Hancock et al. 2009).
Figure 5-1 Example synthetic 100yr ARI design storm input for Pilot Bay.
Model results
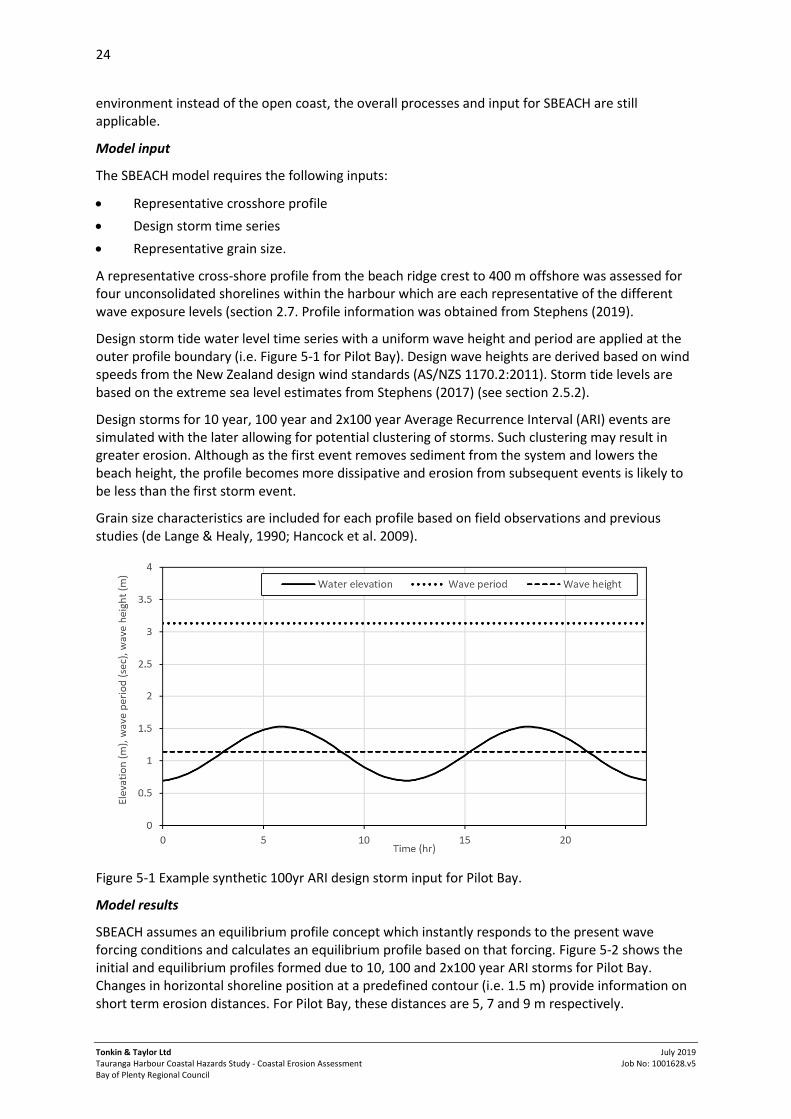
SBEACH assumes an equilibrium profile concept which instantly responds to the present wave forcing conditions and calculates an equilibrium profile based on that forcing. Figure 5-2 shows the initial and equilibrium profiles formed due to 10, 100 and 2x100 year ARI storms for Pilot Bay. Changes in horizontal shoreline position at a predefined contour (i.e. 1.5 m) provide information on short term erosion distances. For Pilot Bay, these distances are 5, 7 and 9 m respectively.
25
Tonkin & Taylor Ltd Tauranga Harbour Coastal Hazards Study - Coastal Erosion Assessment Bay of Plenty Regional Council
July 2019 Job No: 1001628.v5
Figure 5-2 Example SBEACH results for Pilot Bay. The horizontal distance between the initial profile and the 2x100 yr ARI profile at the 1.5m CONTOUR is shown as 9 m.
The range of shoreline excursion distances calculated by SBEACH for the four estuary beaches is shown in Table 5-2. Results show average shoreline excursion from the different storm magnitudes ranges from 5 to 9 m on the highly exposed beaches, 2 to 5 m on low exposure beaches and 1 to 2 m on very sheltered beaches.
Table 5-2 Storm excursion distances calculated by SBEACH for estuary beaches with different exposure
Site Cell Exposure Fetch
Excursion distance (m)
10 yr ARI 100 yr ARI 2 x 100 yr ARI
Pilot Bay 23B High 4 km 5 7 9
Matua 12B Moderate 3 km 3 6 8
Whareroa 22B Low 2 km 2 3 5
Bowentown 1A Very low 0.5 km 1 1.5 2
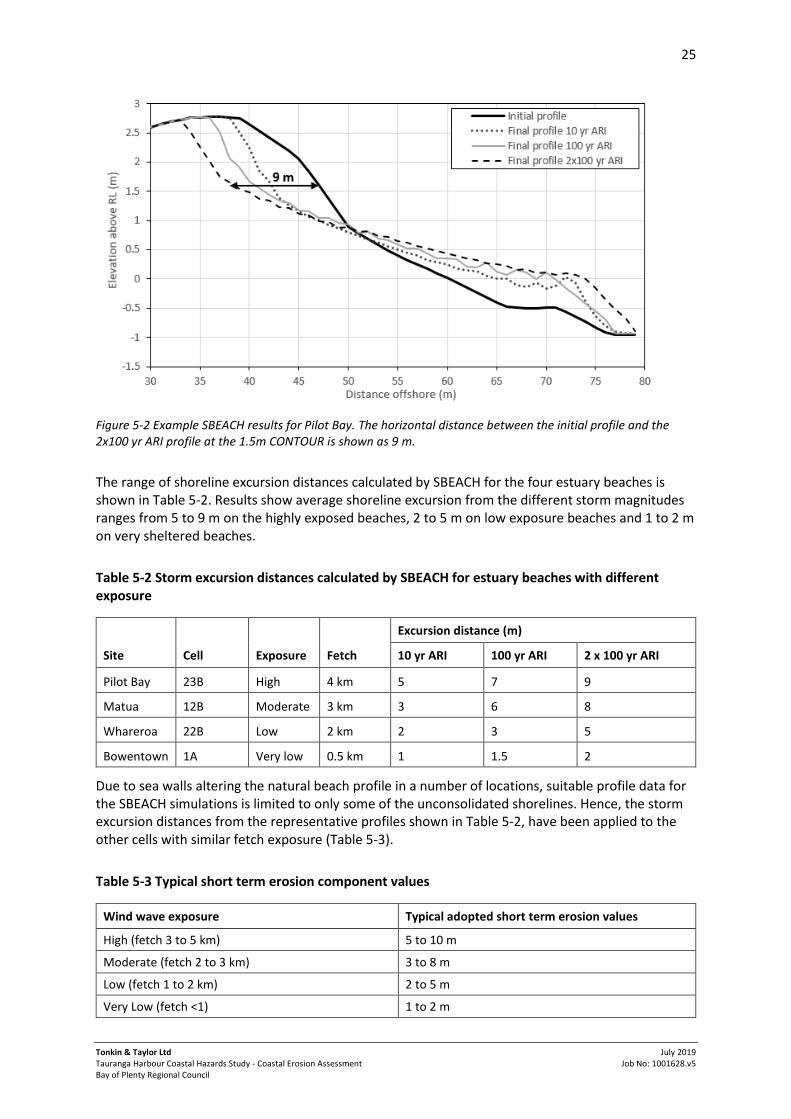
Due to sea walls altering the natural beach profile in a number of locations, suitable profile data for the SBEACH simulations is limited to only some of the unconsolidated shorelines. Hence, the storm excursion distances from the representative profiles shown in Table 5-2, have been applied to the other cells with similar fetch exposure (Table 5-3).
Table 5-3 Typical short term erosion component values
Wind wave exposure Typical adopted short term erosion values
High (fetch 3 to 5 km) 5 to 10 m
Moderate (fetch 2 to 3 km) 3 to 8 m
Low (fetch 1 to 2 km) 2 to 5 m
Very Low (fetch <1) 1 to 2 m
26
Tonkin & Taylor Ltd Tauranga Harbour Coastal Hazards Study - Coastal Erosion Assessment Bay of Plenty Regional Council
July 2019 Job No: 1001628.v5
5.3 Slope stability (SS)
5.3.1 Unconsolidated shorelines
The slope stability factor delineates the area potentially susceptible to instability landward of the erosion scarp. The parameter assumes that storm erosion results in an over-steepened scarp which must adjust to a stable angle of repose for loose sand. The slope stability width is dependent on the height of the existing backshore and the angle of repose for loose sand. These two inputs were obtained from an examination of historic reports, a review of the beach profile data and our assessment of the beach sediments obtained in this study. The slope stability factor is outlined below:
)(tan2 sand
HSS
(5-1)
Where H is the slope height from the eroded base to the crest and αsand is the stable angle of repose for beach sand (ranging from 30 to 34 degrees). In reality, the formation of a talus slope at the toe will allow the scarp to stand at steeper slopes (unless subsequently removed), hence the slope height is divided by 2. Parameter bounds are defined based on the variation in crest height along the coastal behaviour cell and potential range in stable angle of repose.
5.3.2 Consolidated banks and cliffs
For consolidated cliffs and banks the slope stability component is based on the stable slope angle. The stable slope angle is dependent on a range of factors such as geological type, weathering profile, local bedding and faulting characteristics, groundwater level, overland flow paths and vegetation cover.
The majority of the cliff materials observed around Tauranga Harbour are Matua Subgroup and Holocene river and estuarine deposits, typically comprising sands and silts. Several ignimbrites are also evident around the Harbour, however in most locations the ignimbrites only occur as a minor layer.
The Tauranga City Council Infrastructure Development Code (TCC IDC, 2017) outlines limits for building platform setbacks related to slope failures around Tauranga. They state a limit of 3H: 1V as ‘the limit beyond which slope failures do not usually occur’ and 2H: 1V as ‘the limit of a high proportion of slips’. These slope ratios equate to slope angles of 18° and 26° respectively. T+T assessed land stability around Omokoroa, where instability typically occurs in the Matua Subgroup. The report states a failure limit of landslips between 1.8H: 1V and 2.2H: 1V (Tonkin + Taylor, 1980). These slope ratios equate to slope angles of 29° and 24° respectively. The 2H: 1V angle of 26° from the TCC IDC (2017) is in line with the results of the Tonkin + Taylor (1980) report for sand and silt deposits around Tauranga Harbour.
A more recent study on the sensitive materials in Tauranga Harbour, including Omokoroa, Te Puna and Otumoetai, undertook triaxial tests on samples to determine geotechnical properties of the soils. The results of this study provided a range of internal friction angles for these sensitive materials within the Matua Subgroup from 27° to 41° (Moon et al., 2013).
Similar research on geotechnical properties of ignimbrite rock indicates that angles of internal friction can range from 27o to 38o in Tauranga (Moon, 1993). Most of the ignimbrite observed around Tauranga Harbour is non-welded to sintered and exhibits soil behaviours.
For this assessment we have adopted generic stable slope angle values based on the ranges discussed in previous literature. The range of existing slope angles for the typical lithologies observed around Tauranga Harbour are shown in Table 5-4. For areas with the Matua Subgroup, we
27
Tonkin & Taylor Ltd Tauranga Harbour Coastal Hazards Study - Coastal Erosion Assessment Bay of Plenty Regional Council
July 2019 Job No: 1001628.v5
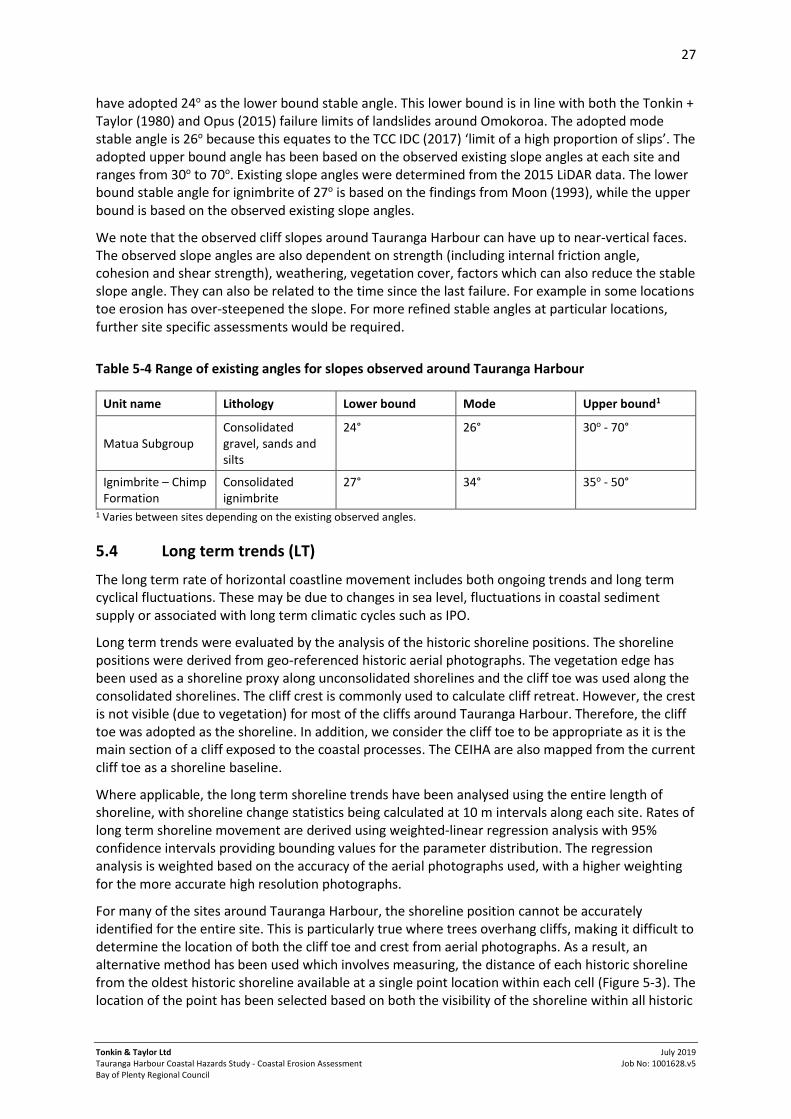
have adopted 24o as the lower bound stable angle. This lower bound is in line with both the Tonkin + Taylor (1980) and Opus (2015) failure limits of landslides around Omokoroa. The adopted mode stable angle is 26o because this equates to the TCC IDC (2017) ‘limit of a high proportion of slips’. The adopted upper bound angle has been based on the observed existing slope angles at each site and ranges from 30o to 70o. Existing slope angles were determined from the 2015 LiDAR data. The lower bound stable angle for ignimbrite of 27o is based on the findings from Moon (1993), while the upper bound is based on the observed existing slope angles.
We note that the observed cliff slopes around Tauranga Harbour can have up to near-vertical faces. The observed slope angles are also dependent on strength (including internal friction angle, cohesion and shear strength), weathering, vegetation cover, factors which can also reduce the stable slope angle. They can also be related to the time since the last failure. For example in some locations toe erosion has over-steepened the slope. For more refined stable angles at particular locations, further site specific assessments would be required.
Table 5-4 Range of existing angles for slopes observed around Tauranga Harbour
Unit name Lithology Lower bound Mode Upper bound1
Matua Subgroup Consolidated gravel, sands and silts
24° 26° 30o - 70°
Ignimbrite – Chimp Formation
Consolidated ignimbrite
27° 34° 35o - 50°
1 Varies between sites depending on the existing observed angles.
5.4 Long term trends (LT)
The long term rate of horizontal coastline movement includes both ongoing trends and long term cyclical fluctuations. These may be due to changes in sea level, fluctuations in coastal sediment supply or associated with long term climatic cycles such as IPO.
Long term trends were evaluated by the analysis of the historic shoreline positions. The shoreline positions were derived from geo-referenced historic aerial photographs. The vegetation edge has been used as a shoreline proxy along unconsolidated shorelines and the cliff toe was used along the consolidated shorelines. The cliff crest is commonly used to calculate cliff retreat. However, the crest is not visible (due to vegetation) for most of the cliffs around Tauranga Harbour. Therefore, the cliff toe was adopted as the shoreline. In addition, we consider the cliff toe to be appropriate as it is the main section of a cliff exposed to the coastal processes. The CEIHA are also mapped from the current cliff toe as a shoreline baseline.
Where applicable, the long term shoreline trends have been analysed using the entire length of shoreline, with shoreline change statistics being calculated at 10 m intervals along each site. Rates of long term shoreline movement are derived using weighted-linear regression analysis with 95% confidence intervals providing bounding values for the parameter distribution. The regression analysis is weighted based on the accuracy of the aerial photographs used, with a higher weighting for the more accurate high resolution photographs.
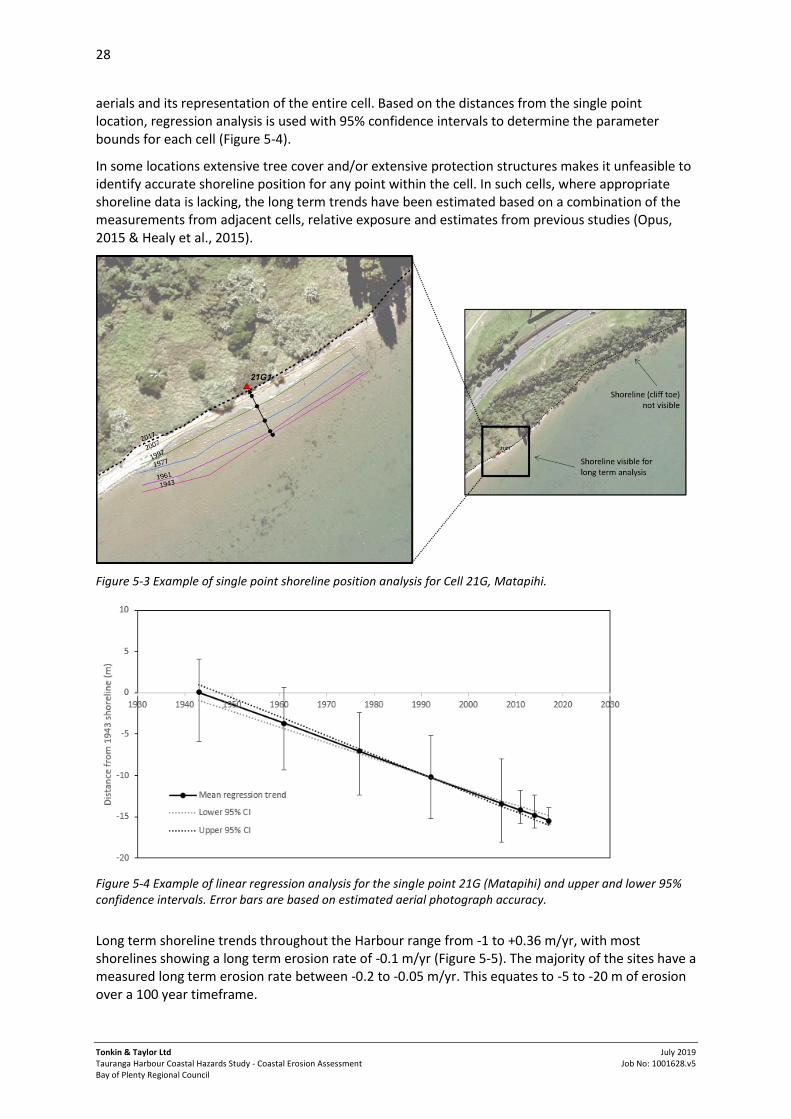
For many of the sites around Tauranga Harbour, the shoreline position cannot be accurately identified for the entire site. This is particularly true where trees overhang cliffs, making it difficult to determine the location of both the cliff toe and crest from aerial photographs. As a result, an alternative method has been used which involves measuring, the distance of each historic shoreline from the oldest historic shoreline available at a single point location within each cell (Figure 5-3). The location of the point has been selected based on both the visibility of the shoreline within all historic
28
Tonkin & Taylor Ltd Tauranga Harbour Coastal Hazards Study - Coastal Erosion Assessment Bay of Plenty Regional Council
July 2019 Job No: 1001628.v5
aerials and its representation of the entire cell. Based on the distances from the single point location, regression analysis is used with 95% confidence intervals to determine the parameter bounds for each cell (Figure 5-4).
In some locations extensive tree cover and/or extensive protection structures makes it unfeasible to identify accurate shoreline position for any point within the cell. In such cells, where appropriate shoreline data is lacking, the long term trends have been estimated based on a combination of the measurements from adjacent cells, relative exposure and estimates from previous studies (Opus, 2015 & Healy et al., 2015).
Figure 5-3 Example of single point shoreline position analysis for Cell 21G, Matapihi.
Figure 5-4 Example of linear regression analysis for the single point 21G (Matapihi) and upper and lower 95% confidence intervals. Error bars are based on estimated aerial photograph accuracy.
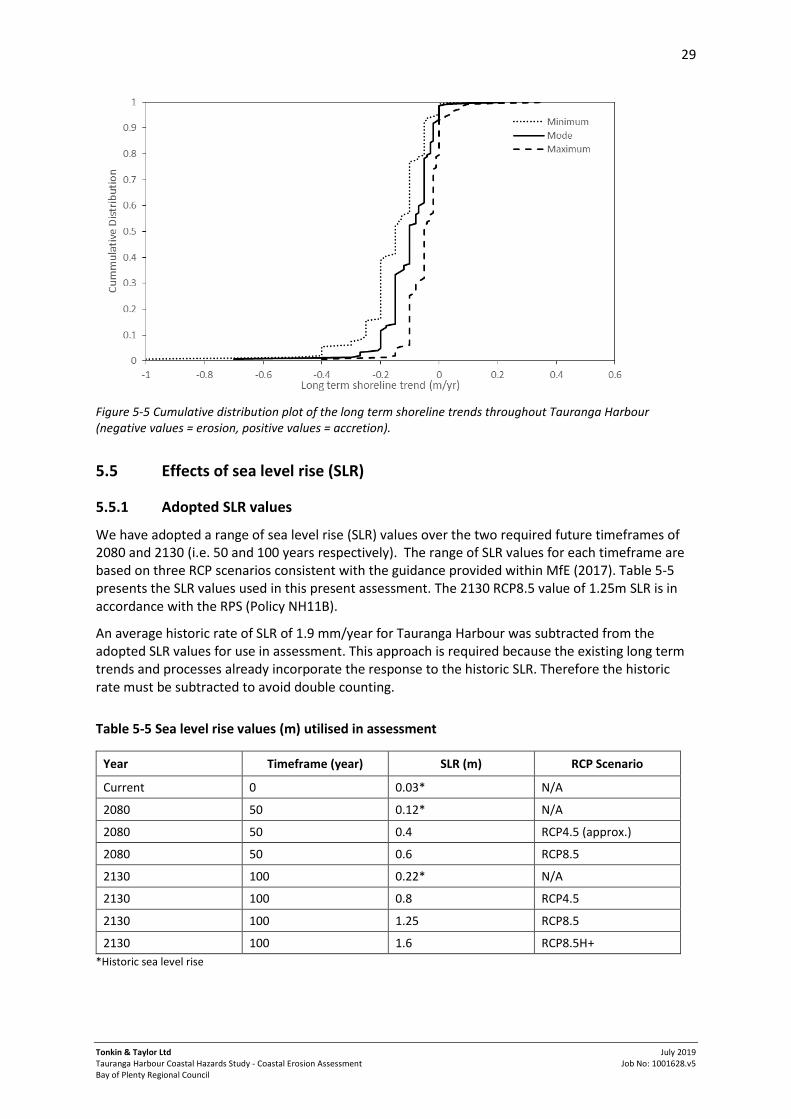
Long term shoreline trends throughout the Harbour range from -1 to +0.36 m/yr, with most shorelines showing a long term erosion rate of -0.1 m/yr (Figure 5-5). The majority of the sites have a measured long term erosion rate between -0.2 to -0.05 m/yr. This equates to -5 to -20 m of erosion over a 100 year timeframe.
29
Tonkin & Taylor Ltd Tauranga Harbour Coastal Hazards Study - Coastal Erosion Assessment Bay of Plenty Regional Council
July 2019 Job No: 1001628.v5
Figure 5-5 Cumulative distribution plot of the long term shoreline trends throughout Tauranga Harbour (negative values = erosion, positive values = accretion).
5.5 Effects of sea level rise (SLR)
5.5.1 Adopted SLR values
We have adopted a range of sea level rise (SLR) values over the two required future timeframes of 2080 and 2130 (i.e. 50 and 100 years respectively). The range of SLR values for each timeframe are based on three RCP scenarios consistent with the guidance provided within MfE (2017). Table 5-5 presents the SLR values used in this present assessment. The 2130 RCP8.5 value of 1.25m SLR is in accordance with the RPS (Policy NH11B).
An average historic rate of SLR of 1.9 mm/year for Tauranga Harbour was subtracted from the adopted SLR values for use in assessment. This approach is required because the existing long term trends and processes already incorporate the response to the historic SLR. Therefore the historic rate must be subtracted to avoid double counting.
Table 5-5 Sea level rise values (m) utilised in assessment
Year Timeframe (year) SLR (m) RCP Scenario
Current 0 0.03* N/A
2080 50 0.12* N/A
2080 50 0.4 RCP4.5 (approx.)
2080 50 0.6 RCP8.5
2130 100 0.22* N/A
2130 100 0.8 RCP4.5
2130 100 1.25 RCP8.5
2130 100 1.6 RCP8.5H+
*Historic sea level rise
30
Tonkin & Taylor Ltd Tauranga Harbour Coastal Hazards Study - Coastal Erosion Assessment Bay of Plenty Regional Council
July 2019 Job No: 1001628.v5
5.5.2 Unconsolidated shoreline response to SLR
Geometric response models propose that as sea level is raised, the equilibrium profile is moved upward and landward conserving mass and original shape. The most well-known of these geometric response models is that of Bruun (Bruun, 1962, 1988). Brunn proposes that with increased sea level, material is eroded from the upper beach and deposited offshore to a maximum depth, termed closure depth. The increase in sea bed level is equivalent to the rise in sea level and results in landward recession of the shoreline.
The rule is governed by simple, two-dimensional conservation of mass principles and assumes no offshore or onshore losses or gains and an instantaneous profile response following sea-level change. The rule assumes an equilibrium beach profile where the beach may fluctuate under seasonal and storm-influences but returns to a statistically average profile (i.e. the profile is not undergoing long term steepening or flattening). Losses or gains to the system and changes to the equilibrium profile are likely accounted for within the long term change parameter and therefore are not likely to introduce additional uncertainty. The definition of a closure depth (maximum seaward extent of sediment exchange) and the lag in response of natural systems represent significant limitations in the method (Hands, 1983). Likewise, large spatial or temporal variation in sediment supply, wave conditions, and geological factors all represent significant limitations (Cooper and Pilkey, 2004).
For unconsolidated shorelines within estuaries the generalised Brunn Rule is not applicable. Within estuaries sediment lost from the upper beach does not settle on the basin nearshore or bathymetric profile, but is instead lost from the system. In this case, the profile is translated by a modified Bruun principle using the foreshore or beach face slope (β) (Equation 5-2). This is consistent with the principles described in the eShorance estuary shoreline response model, which is considered to be best practice (Stevens and Giles, 2010).
𝑆𝐿 = 𝑡𝑎𝑛𝛽 (5-2)
5.5.3 Consolidated shoreline response to SLR
Erosion of consolidated coastlines is a one-way process which typically has two components:
1 Gradual recession caused by weathering and coastal processes
2 Episodic failures due to cliff lithology and geologic structure and process triggers (e.g. extreme rainfall).
Gradual recession due to weathering is a function of climatic conditions, exposure and cliff material. Marine hydraulic processes affect cliffs either by wave action causing erosion at the toe, or by removing slope debris deposited at the toe following subsequent cliff-face collapse. Sea level rise increases the amount of wave energy able to propagate over a fronting platform or beach to reach a cliff toe, removing talus more effectively and increasing the potential for hydraulic processes to affect erosion and recession. However, in some locations, the existence of a talus will provide self-armouring, and may slow cliff recession due to waves.
DEFRA (2002) propose a simple method to evaluate recession in soft-cliff environments by assuming that future recession (LTF) will be proportional to historic rates (LTH) multiplied by the ratio of future (SF) to historic sea-level rise (SH). The model shown in Equation 5-3 below assumes, however, that the profile will respond instantaneously and that all recession that has occurred historically was a function of historic sea-level rise (i.e. marine processes).
H
FHF
S
SLTLT (5-3)
31
Tonkin & Taylor Ltd Tauranga Harbour Coastal Hazards Study - Coastal Erosion Assessment Bay of Plenty Regional Council
July 2019 Job No: 1001628.v5
Walkden and Dickson (2006) use process-based mathematical models to simulate the sensitivity of shore profile response to SLR over timescales of decades to centuries. The models incorporate factors for rock strength, cliff height, wave and tide characteristics, beach volume at the cliff toe, profile slope, the variation in tidal elevation and the distribution of erosion under a breaking wave field. They find that recession rates become independent of toe beach volume below approximately 20 m3/m. For example, below this volume the beach does not influence recession rates but above it the beach offers some protection to the toe). In the absence of beach protection, they find that for the soft cliff tested (historic rates of recession of -0.8 to -1 m/yr), an equilibrium recession rate could be described by the following equation.
H
FHF
S
SLTLT (5-4)
It was noted, however, that equilibrium conditions take some time to develop, with the case tested taking nearly 1,000 years to adjust from a past SLR rate of 2 mm/yr to a future rate of 6 mm/yr, although the majority of the increase occurred in the first century.
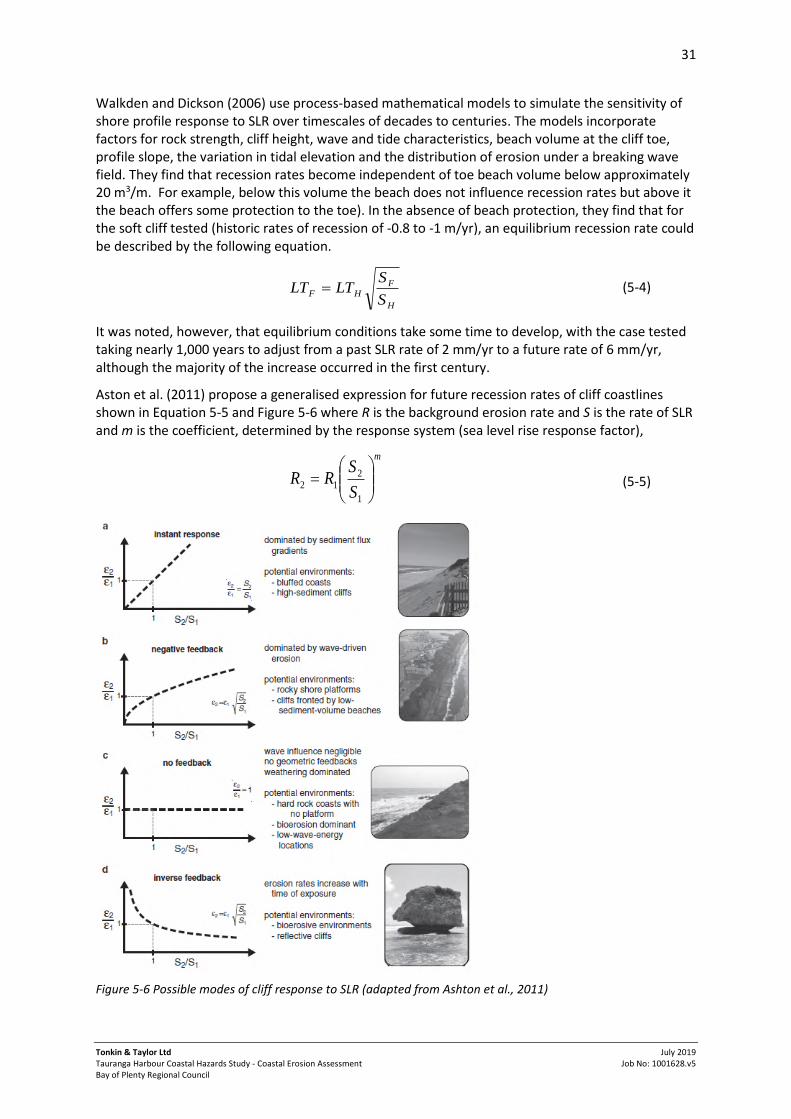
Aston et al. (2011) propose a generalised expression for future recession rates of cliff coastlines shown in Equation 5-5 and Figure 5-6 where R is the background erosion rate and S is the rate of SLR and m is the coefficient, determined by the response system (sea level rise response factor),
m
S
SRR
1
212 (5-5)
Figure 5-6 Possible modes of cliff response to SLR (adapted from Ashton et al., 2011)
32
Tonkin & Taylor Ltd Tauranga Harbour Coastal Hazards Study - Coastal Erosion Assessment Bay of Plenty Regional Council
July 2019 Job No: 1001628.v5
An instantaneous response (m = 1) is where the rate of future recession is proportional to the increase in SLR. An instant response is typical of unconsolidated or weakly consolidated shorelines. No feedback (m = 0) indicates that wave influence is negligible and weathering dominates. The most likely response of consolidated shorelines is a negative/damped feedback system (m = 0.5), where rates of recession are slowed by development of a shore platform or fronting beach; i.e. Equation 5-5. Aston et al. (2011) also suggest an additional case of inverse feedback when m < 0 indicating a reduction in recession with increasing sea levels. They suggest this could occur when erosion is controlled by bio-erosion which may reduce with additional submergence. The approach suggested by Ashton et al. (2011) is conceptually plausible and has the potential to predict recession rates on a wide variety of rock types with further analysis.
Based on site observations, the cliffs around Tauranga Harbour lack fronting beaches (i.e. the fronting beach volume is less than 20 m3/m) and hence, Equation 5-5 has been adopted for the present assessment. Given the uncertainties in deriving response type without detailed site-specific modelling and analysis, a range of response types have been adopted as parameter bounds.
Material erosion susceptibility (i.e. hardness) and wave exposure are the two main factors which contribute to cliff shoreline response. Given that most of Tauranga’s cliff geology (i.e. Matua Subgroup) has a similar susceptibility, the wave exposure has the largest influence on shoreline response. Table 5-6 outlines the range of response factors (m) for the different materials and wave exposures around Tauranga Harbour. The sea level rise response factors used within this study range from a lower bound of 0.1 for sheltered shorelines to 0.5 for an upper bound on the exposure shorelines. Figure 5-7 demonstrates how with greater sea level rise, there is a larger difference in erosion rate depending on the sea level rise response factor (m).
Table 5-6 Assumed consolidated shoreline response to sea level rise
Geological unit Relative material susceptibility1
Exposure2 Shoreline response factor (m)
Min Mode Max
Ignimbrite Low Med 0.1 0.2 0.3
Matua Subgroup Moderate
High 0.3 0.4 0.5
Med 0.2 0.3 0.4
Low 0.1 0.2 0.3 1Relative material susceptibility to erosion is equivalent to material hardness. 2Exposure is based on fetch distance.
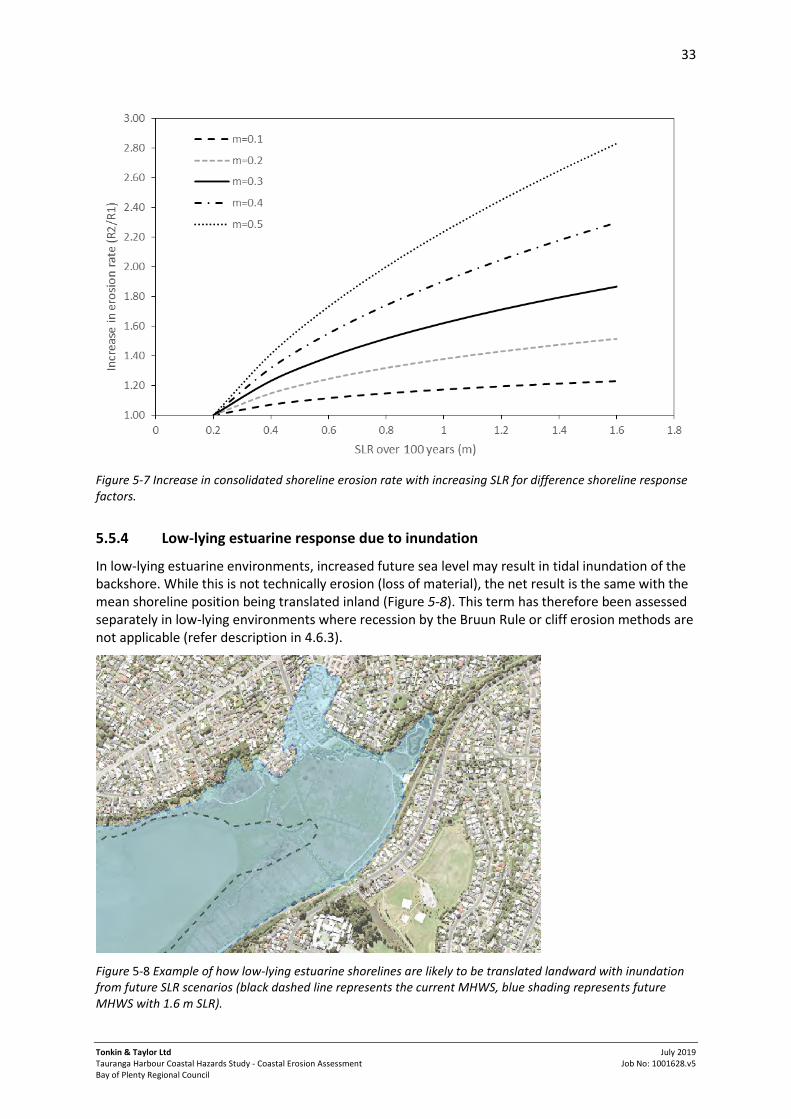
33
Tonkin & Taylor Ltd Tauranga Harbour Coastal Hazards Study - Coastal Erosion Assessment Bay of Plenty Regional Council
July 2019 Job No: 1001628.v5
Figure 5-7 Increase in consolidated shoreline erosion rate with increasing SLR for difference shoreline response factors.
5.5.4 Low-lying estuarine response due to inundation
In low-lying estuarine environments, increased future sea level may result in tidal inundation of the backshore. While this is not technically erosion (loss of material), the net result is the same with the mean shoreline position being translated inland (Figure 5-8). This term has therefore been assessed separately in low-lying environments where recession by the Bruun Rule or cliff erosion methods are not applicable (refer description in 4.6.3).
Figure 5-8 Example of how low-lying estuarine shorelines are likely to be translated landward with inundation from future SLR scenarios (black dashed line represents the current MHWS, blue shading represents future MHWS with 1.6 m SLR).
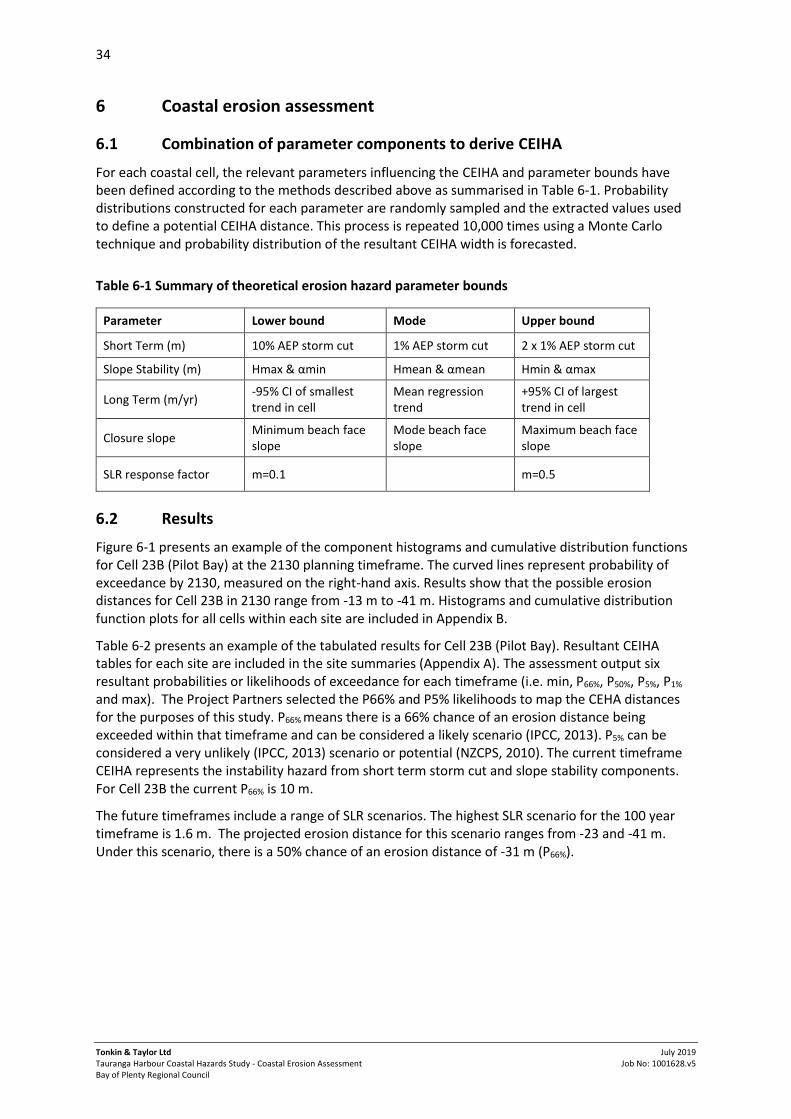
34
Tonkin & Taylor Ltd Tauranga Harbour Coastal Hazards Study - Coastal Erosion Assessment Bay of Plenty Regional Council
July 2019 Job No: 1001628.v5
6 Coastal erosion assessment
6.1 Combination of parameter components to derive CEIHA
For each coastal cell, the relevant parameters influencing the CEIHA and parameter bounds have been defined according to the methods described above as summarised in Table 6-1. Probability distributions constructed for each parameter are randomly sampled and the extracted values used to define a potential CEIHA distance. This process is repeated 10,000 times using a Monte Carlo technique and probability distribution of the resultant CEIHA width is forecasted.
Table 6-1 Summary of theoretical erosion hazard parameter bounds
Parameter Lower bound Mode Upper bound
Short Term (m) 10% AEP storm cut 1% AEP storm cut 2 x 1% AEP storm cut
Slope Stability (m) Hmax & αmin Hmean & αmean Hmin & αmax
Long Term (m/yr) -95% CI of smallest trend in cell
Mean regression trend
+95% CI of largest trend in cell
Closure slope Minimum beach face slope
Mode beach face slope
Maximum beach face slope
SLR response factor m=0.1 m=0.5
6.2 Results
Figure 6-1 presents an example of the component histograms and cumulative distribution functions for Cell 23B (Pilot Bay) at the 2130 planning timeframe. The curved lines represent probability of exceedance by 2130, measured on the right-hand axis. Results show that the possible erosion distances for Cell 23B in 2130 range from -13 m to -41 m. Histograms and cumulative distribution function plots for all cells within each site are included in Appendix B.
Table 6-2 presents an example of the tabulated results for Cell 23B (Pilot Bay). Resultant CEIHA tables for each site are included in the site summaries (Appendix A). The assessment output six resultant probabilities or likelihoods of exceedance for each timeframe (i.e. min, P66%, P50%, P5%, P1% and max). The Project Partners selected the P66% and P5% likelihoods to map the CEHA distances for the purposes of this study. P66% means there is a 66% chance of an erosion distance being exceeded within that timeframe and can be considered a likely scenario (IPCC, 2013). P5% can be considered a very unlikely (IPCC, 2013) scenario or potential (NZCPS, 2010). The current timeframe CEIHA represents the instability hazard from short term storm cut and slope stability components. For Cell 23B the current P66% is 10 m.
The future timeframes include a range of SLR scenarios. The highest SLR scenario for the 100 year timeframe is 1.6 m. The projected erosion distance for this scenario ranges from -23 and -41 m. Under this scenario, there is a 50% chance of an erosion distance of -31 m (P66%).
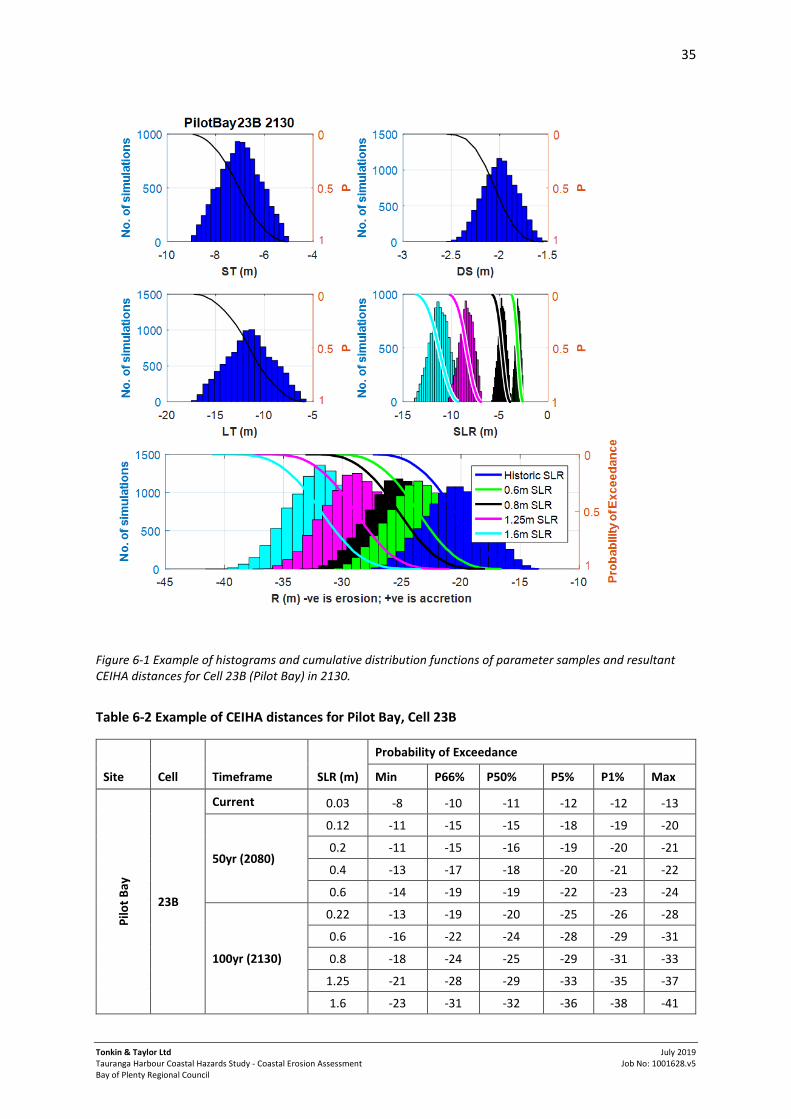
35
Tonkin & Taylor Ltd Tauranga Harbour Coastal Hazards Study - Coastal Erosion Assessment Bay of Plenty Regional Council
July 2019 Job No: 1001628.v5
Figure 6-1 Example of histograms and cumulative distribution functions of parameter samples and resultant CEIHA distances for Cell 23B (Pilot Bay) in 2130.
Table 6-2 Example of CEIHA distances for Pilot Bay, Cell 23B
Site Cell Timeframe SLR (m)
Probability of Exceedance
Min P66% P50% P5% P1% Max
Pilo
t B
ay
23B
Current 0.03 -8 -10 -11 -12 -12 -13
50yr (2080)
0.12 -11 -15 -15 -18 -19 -20
0.2 -11 -15 -16 -19 -20 -21
0.4 -13 -17 -18 -20 -21 -22
0.6 -14 -19 -19 -22 -23 -24
100yr (2130)
0.22 -13 -19 -20 -25 -26 -28
0.6 -16 -22 -24 -28 -29 -31
0.8 -18 -24 -25 -29 -31 -33
1.25 -21 -28 -29 -33 -35 -37
1.6 -23 -31 -32 -36 -38 -41
36
Tonkin & Taylor Ltd Tauranga Harbour Coastal Hazards Study - Coastal Erosion Assessment Bay of Plenty Regional Council
July 2019 Job No: 1001628.v5
6.3 Mapping of the CEIHA
Following discussion with BOPRC, WBOPDC and TCC, it was agreed that nine erosion hazard scenarios should be mapped corresponding to various likelihood of hazard related to timeframe and probability (Table 6-3). The premise for the nine scenarios is based on the key requirements of the New Zealand Coastal Policy Statement (NZCPS), Bay of Plenty Regional Policy Statement (RPS) and the recent guidance provided by the Ministry for the Environment (MfE, 2017) for dynamic adaptation pathway planning.
Table 6-3 Timeframes, likelihood and SLR combinations for the adopted CEIHA mapping scenarios
Scenario Timeframe in years Likelihood of occurring over timeframe (Exceedance Probability)
SLR (m) Equivalent RCP Scenario2
1 Current 66% n/a n/a
2 Current 5% n/a n/a
3 50 (2080) 66% 0.4 RCP4.5
4 50 (2080) 66% 0.6 RCP8.5
5 50 (2080) 5% 0.6 RCP8.5
61 100 (2130) 66% 0.8 RCP4.5
71 100 (2130) 66% 1.25 RCP8.5
81 100 (2130) 5% 1.25 RCP8.5
91 100 (2130) 5% 1.6 RCP8.5 H+
1Regional Policy Statement requirements 2Approximate RCP scenario
The nine scenarios were selected for mapping purposes to support the following local government decision making processes:
Plan Change/Adaption Planning
RPS Primary and Secondary Risk Assessments
Regional Policy Statement requirements including, hazard susceptibility area and potentially affected areas
Building Act
RMA (subdivision)
CEIHAs are mapped as offsets to the existing baseline. Where the hazard values differ between adjacent coastal cells, the mapped CEIHA is merged over a distance of at least 10 times the difference between values providing smooth transitions or along contours or material discontinuities where these are present. For example, transitioning from a cliff to a beach ridge morphology would generally follow the contour line. In accretion dominated areas where the future CEIHA is seaward of the current CEIHA, the future CEIHA has been mapped equivalent to the current CEIHA.
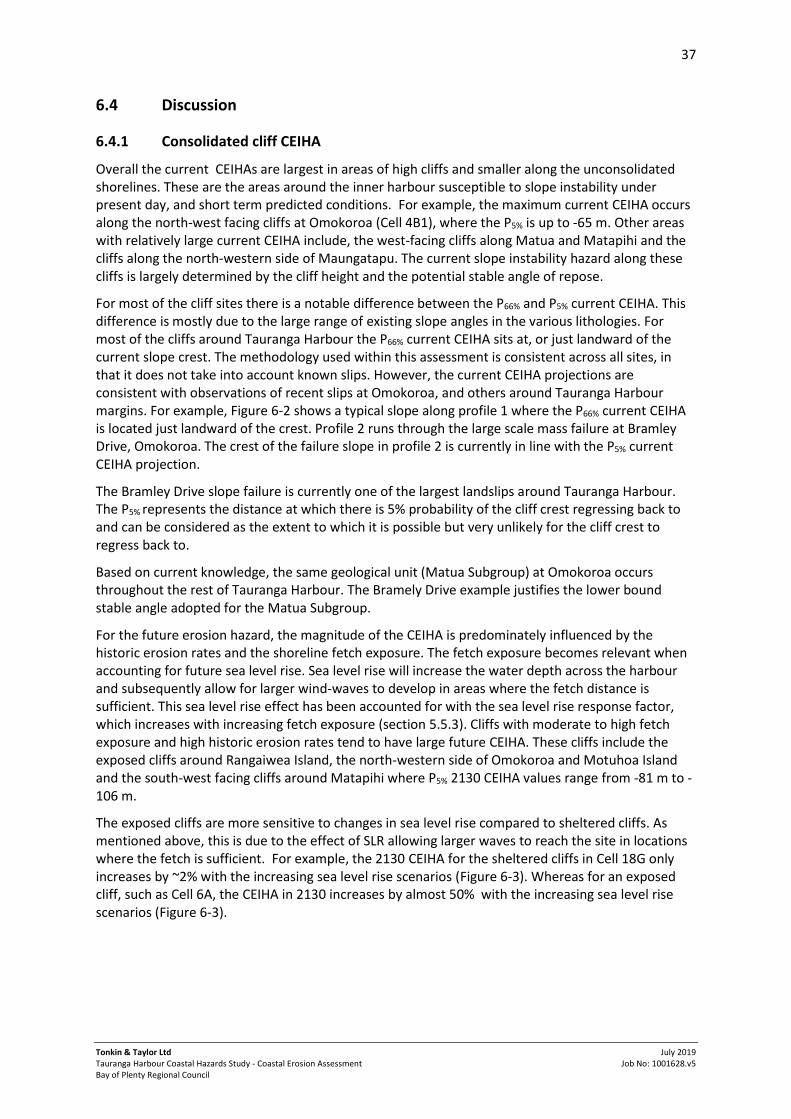
37
Tonkin & Taylor Ltd Tauranga Harbour Coastal Hazards Study - Coastal Erosion Assessment Bay of Plenty Regional Council
July 2019 Job No: 1001628.v5
6.4 Discussion
6.4.1 Consolidated cliff CEIHA
Overall the current CEIHAs are largest in areas of high cliffs and smaller along the unconsolidated shorelines. These are the areas around the inner harbour susceptible to slope instability under present day, and short term predicted conditions. For example, the maximum current CEIHA occurs along the north-west facing cliffs at Omokoroa (Cell 4B1), where the P5% is up to -65 m. Other areas with relatively large current CEIHA include, the west-facing cliffs along Matua and Matapihi and the cliffs along the north-western side of Maungatapu. The current slope instability hazard along these cliffs is largely determined by the cliff height and the potential stable angle of repose.
For most of the cliff sites there is a notable difference between the P66% and P5% current CEIHA. This difference is mostly due to the large range of existing slope angles in the various lithologies. For most of the cliffs around Tauranga Harbour the P66% current CEIHA sits at, or just landward of the current slope crest. The methodology used within this assessment is consistent across all sites, in that it does not take into account known slips. However, the current CEIHA projections are consistent with observations of recent slips at Omokoroa, and others around Tauranga Harbour margins. For example, Figure 6-2 shows a typical slope along profile 1 where the P66% current CEIHA is located just landward of the crest. Profile 2 runs through the large scale mass failure at Bramley Drive, Omokoroa. The crest of the failure slope in profile 2 is currently in line with the P5% current CEIHA projection.
The Bramley Drive slope failure is currently one of the largest landslips around Tauranga Harbour. The P5% represents the distance at which there is 5% probability of the cliff crest regressing back to and can be considered as the extent to which it is possible but very unlikely for the cliff crest to regress back to.
Based on current knowledge, the same geological unit (Matua Subgroup) at Omokoroa occurs throughout the rest of Tauranga Harbour. The Bramely Drive example justifies the lower bound stable angle adopted for the Matua Subgroup.
For the future erosion hazard, the magnitude of the CEIHA is predominately influenced by the historic erosion rates and the shoreline fetch exposure. The fetch exposure becomes relevant when accounting for future sea level rise. Sea level rise will increase the water depth across the harbour and subsequently allow for larger wind-waves to develop in areas where the fetch distance is sufficient. This sea level rise effect has been accounted for with the sea level rise response factor, which increases with increasing fetch exposure (section 5.5.3). Cliffs with moderate to high fetch exposure and high historic erosion rates tend to have large future CEIHA. These cliffs include the exposed cliffs around Rangaiwea Island, the north-western side of Omokoroa and Motuhoa Island and the south-west facing cliffs around Matapihi where P5% 2130 CEIHA values range from -81 m to -106 m.
The exposed cliffs are more sensitive to changes in sea level rise compared to sheltered cliffs. As mentioned above, this is due to the effect of SLR allowing larger waves to reach the site in locations where the fetch is sufficient. For example, the 2130 CEIHA for the sheltered cliffs in Cell 18G only increases by ~2% with the increasing sea level rise scenarios (Figure 6-3). Whereas for an exposed cliff, such as Cell 6A, the CEIHA in 2130 increases by almost 50% with the increasing sea level rise scenarios (Figure 6-3).
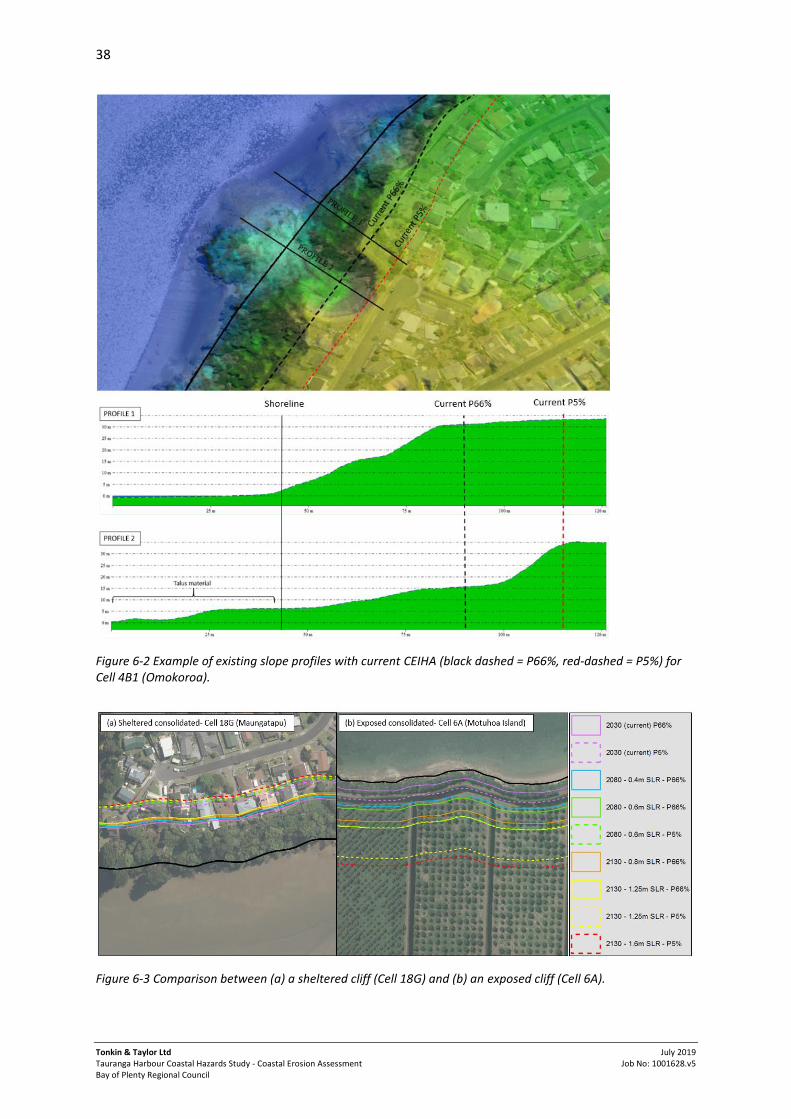
38
Tonkin & Taylor Ltd Tauranga Harbour Coastal Hazards Study - Coastal Erosion Assessment Bay of Plenty Regional Council
July 2019 Job No: 1001628.v5
Figure 6-2 Example of existing slope profiles with current CEIHA (black dashed = P66%, red-dashed = P5%) for Cell 4B1 (Omokoroa).
Figure 6-3 Comparison between (a) a sheltered cliff (Cell 18G) and (b) an exposed cliff (Cell 6A).
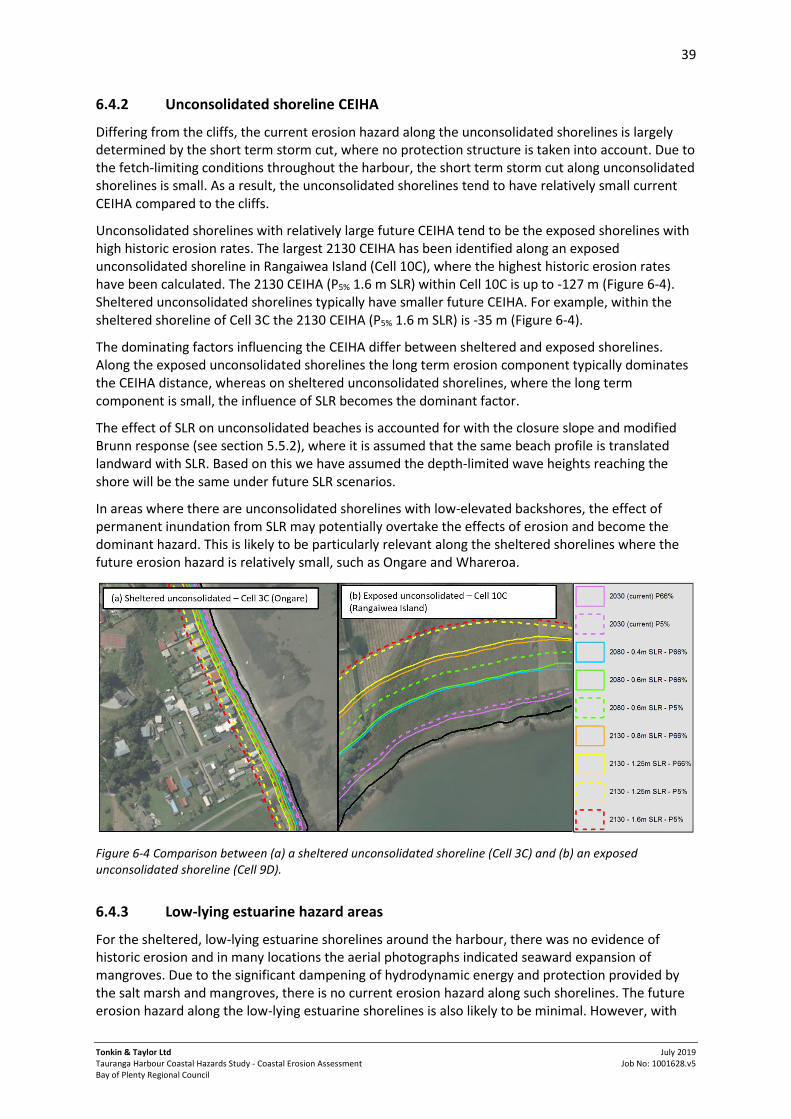
39
Tonkin & Taylor Ltd Tauranga Harbour Coastal Hazards Study - Coastal Erosion Assessment Bay of Plenty Regional Council
July 2019 Job No: 1001628.v5
6.4.2 Unconsolidated shoreline CEIHA
Differing from the cliffs, the current erosion hazard along the unconsolidated shorelines is largely determined by the short term storm cut, where no protection structure is taken into account. Due to the fetch-limiting conditions throughout the harbour, the short term storm cut along unconsolidated shorelines is small. As a result, the unconsolidated shorelines tend to have relatively small current CEIHA compared to the cliffs.
Unconsolidated shorelines with relatively large future CEIHA tend to be the exposed shorelines with high historic erosion rates. The largest 2130 CEIHA has been identified along an exposed unconsolidated shoreline in Rangaiwea Island (Cell 10C), where the highest historic erosion rates have been calculated. The 2130 CEIHA (P5% 1.6 m SLR) within Cell 10C is up to -127 m (Figure 6-4). Sheltered unconsolidated shorelines typically have smaller future CEIHA. For example, within the sheltered shoreline of Cell 3C the 2130 CEIHA (P5% 1.6 m SLR) is -35 m (Figure 6-4).
The dominating factors influencing the CEIHA differ between sheltered and exposed shorelines. Along the exposed unconsolidated shorelines the long term erosion component typically dominates the CEIHA distance, whereas on sheltered unconsolidated shorelines, where the long term component is small, the influence of SLR becomes the dominant factor.
The effect of SLR on unconsolidated beaches is accounted for with the closure slope and modified Brunn response (see section 5.5.2), where it is assumed that the same beach profile is translated landward with SLR. Based on this we have assumed the depth-limited wave heights reaching the shore will be the same under future SLR scenarios.
In areas where there are unconsolidated shorelines with low-elevated backshores, the effect of permanent inundation from SLR may potentially overtake the effects of erosion and become the dominant hazard. This is likely to be particularly relevant along the sheltered shorelines where the future erosion hazard is relatively small, such as Ongare and Whareroa.
Figure 6-4 Comparison between (a) a sheltered unconsolidated shoreline (Cell 3C) and (b) an exposed unconsolidated shoreline (Cell 9D).
6.4.3 Low-lying estuarine hazard areas
For the sheltered, low-lying estuarine shorelines around the harbour, there was no evidence of historic erosion and in many locations the aerial photographs indicated seaward expansion of mangroves. Due to the significant dampening of hydrodynamic energy and protection provided by the salt marsh and mangroves, there is no current erosion hazard along such shorelines. The future erosion hazard along the low-lying estuarine shorelines is also likely to be minimal. However, with
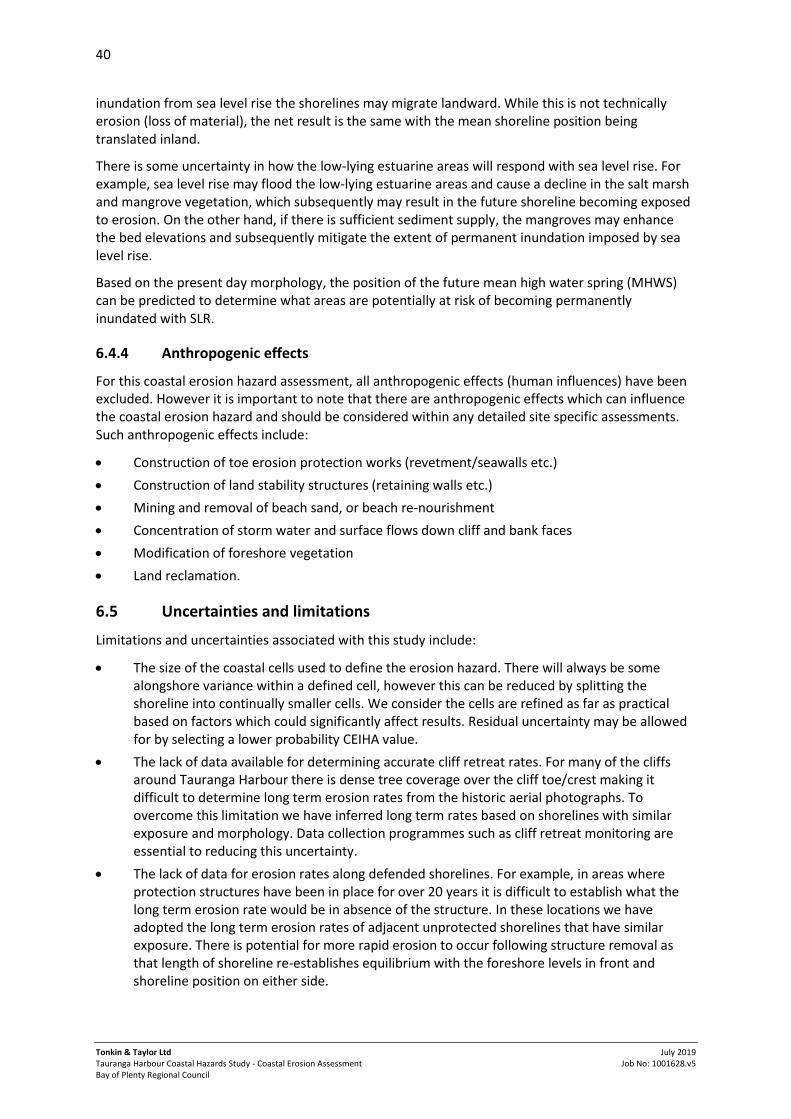
40
Tonkin & Taylor Ltd Tauranga Harbour Coastal Hazards Study - Coastal Erosion Assessment Bay of Plenty Regional Council
July 2019 Job No: 1001628.v5
inundation from sea level rise the shorelines may migrate landward. While this is not technically erosion (loss of material), the net result is the same with the mean shoreline position being translated inland.
There is some uncertainty in how the low-lying estuarine areas will respond with sea level rise. For example, sea level rise may flood the low-lying estuarine areas and cause a decline in the salt marsh and mangrove vegetation, which subsequently may result in the future shoreline becoming exposed to erosion. On the other hand, if there is sufficient sediment supply, the mangroves may enhance the bed elevations and subsequently mitigate the extent of permanent inundation imposed by sea level rise.
Based on the present day morphology, the position of the future mean high water spring (MHWS) can be predicted to determine what areas are potentially at risk of becoming permanently inundated with SLR.
6.4.4 Anthropogenic effects
For this coastal erosion hazard assessment, all anthropogenic effects (human influences) have been excluded. However it is important to note that there are anthropogenic effects which can influence the coastal erosion hazard and should be considered within any detailed site specific assessments. Such anthropogenic effects include:
Construction of toe erosion protection works (revetment/seawalls etc.)
Construction of land stability structures (retaining walls etc.)
Mining and removal of beach sand, or beach re-nourishment
Concentration of storm water and surface flows down cliff and bank faces
Modification of foreshore vegetation
Land reclamation.
6.5 Uncertainties and limitations
Limitations and uncertainties associated with this study include:
The size of the coastal cells used to define the erosion hazard. There will always be some alongshore variance within a defined cell, however this can be reduced by splitting the shoreline into continually smaller cells. We consider the cells are refined as far as practical based on factors which could significantly affect results. Residual uncertainty may be allowed for by selecting a lower probability CEIHA value.
The lack of data available for determining accurate cliff retreat rates. For many of the cliffs around Tauranga Harbour there is dense tree coverage over the cliff toe/crest making it difficult to determine long term erosion rates from the historic aerial photographs. To overcome this limitation we have inferred long term rates based on shorelines with similar exposure and morphology. Data collection programmes such as cliff retreat monitoring are essential to reducing this uncertainty.
The lack of data for erosion rates along defended shorelines. For example, in areas where protection structures have been in place for over 20 years it is difficult to establish what the long term erosion rate would be in absence of the structure. In these locations we have adopted the long term erosion rates of adjacent unprotected shorelines that have similar exposure. There is potential for more rapid erosion to occur following structure removal as that length of shoreline re-establishes equilibrium with the foreshore levels in front and shoreline position on either side.
41
Tonkin & Taylor Ltd Tauranga Harbour Coastal Hazards Study - Coastal Erosion Assessment Bay of Plenty Regional Council
July 2019 Job No: 1001628.v5
In some locations there may be a land instability hazard along the upper slope which is unrelated to the coastal processes. This study only assesses erosion and instability along the coastal edge and does not include additional land instability which may occur near the coastal margin.
Overall this study has assessed coastal erosion hazard areas at a local scale and may be superseded by detailed, site-specific assessment undertaken by qualified and experienced practitioners using improved or higher resolution data than presented in this report. This could include site-specific geotechnical information to confirm stable angles of repose, as well as site-specific consideration and analysis of erosion rates.
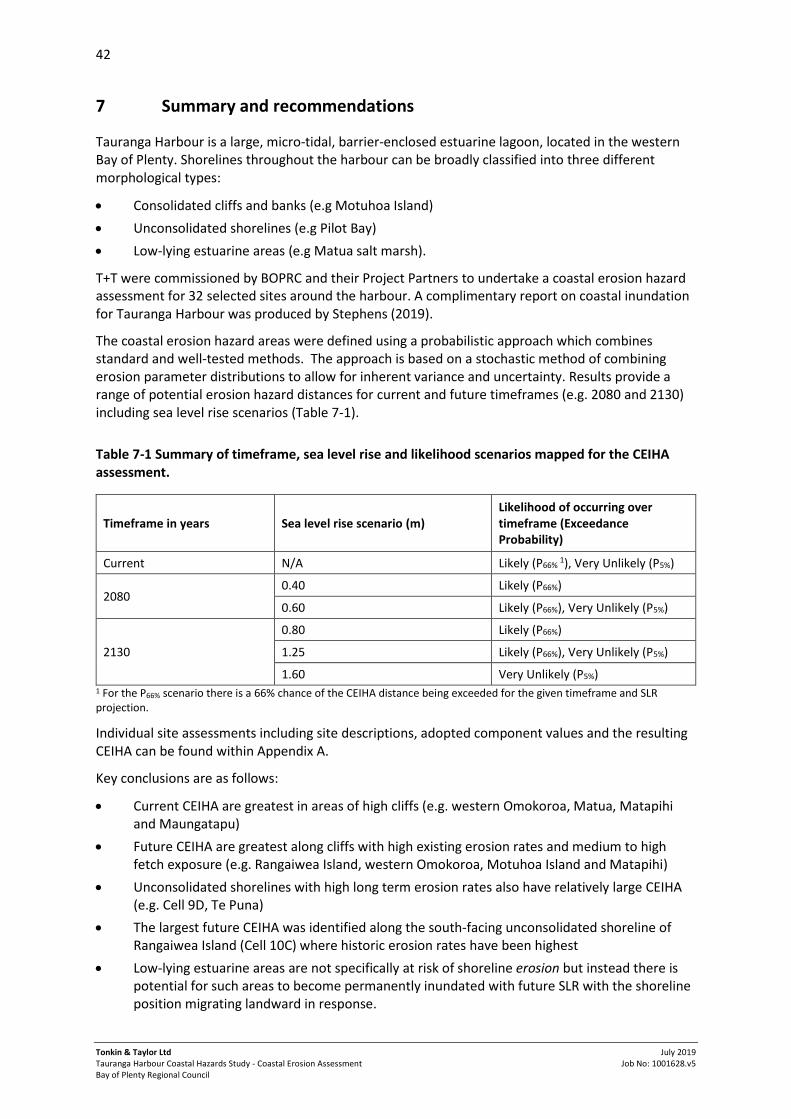
42
Tonkin & Taylor Ltd Tauranga Harbour Coastal Hazards Study - Coastal Erosion Assessment Bay of Plenty Regional Council
July 2019 Job No: 1001628.v5
7 Summary and recommendations
Tauranga Harbour is a large, micro-tidal, barrier-enclosed estuarine lagoon, located in the western Bay of Plenty. Shorelines throughout the harbour can be broadly classified into three different morphological types:
Consolidated cliffs and banks (e.g Motuhoa Island)
Unconsolidated shorelines (e.g Pilot Bay)
Low-lying estuarine areas (e.g Matua salt marsh).
T+T were commissioned by BOPRC and their Project Partners to undertake a coastal erosion hazard assessment for 32 selected sites around the harbour. A complimentary report on coastal inundation for Tauranga Harbour was produced by Stephens (2019).
The coastal erosion hazard areas were defined using a probabilistic approach which combines standard and well-tested methods. The approach is based on a stochastic method of combining erosion parameter distributions to allow for inherent variance and uncertainty. Results provide a range of potential erosion hazard distances for current and future timeframes (e.g. 2080 and 2130) including sea level rise scenarios (Table 7-1).
Table 7-1 Summary of timeframe, sea level rise and likelihood scenarios mapped for the CEIHA assessment.
Timeframe in years Sea level rise scenario (m) Likelihood of occurring over timeframe (Exceedance Probability)
Current N/A Likely (P66% 1), Very Unlikely (P5%)
2080 0.40 Likely (P66%)
0.60 Likely (P66%), Very Unlikely (P5%)
2130
0.80 Likely (P66%)
1.25 Likely (P66%), Very Unlikely (P5%)
1.60 Very Unlikely (P5%) 1 For the P66% scenario there is a 66% chance of the CEIHA distance being exceeded for the given timeframe and SLR projection.
Individual site assessments including site descriptions, adopted component values and the resulting CEIHA can be found within Appendix A.
Key conclusions are as follows:
Current CEIHA are greatest in areas of high cliffs (e.g. western Omokoroa, Matua, Matapihi and Maungatapu)
Future CEIHA are greatest along cliffs with high existing erosion rates and medium to high fetch exposure (e.g. Rangaiwea Island, western Omokoroa, Motuhoa Island and Matapihi)
Unconsolidated shorelines with high long term erosion rates also have relatively large CEIHA (e.g. Cell 9D, Te Puna)
The largest future CEIHA was identified along the south-facing unconsolidated shoreline of Rangaiwea Island (Cell 10C) where historic erosion rates have been highest
Low-lying estuarine areas are not specifically at risk of shoreline erosion but instead there is potential for such areas to become permanently inundated with future SLR with the shoreline position migrating landward in response.
43
Tonkin & Taylor Ltd Tauranga Harbour Coastal Hazards Study - Coastal Erosion Assessment Bay of Plenty Regional Council
July 2019 Job No: 1001628.v5
Recommendations
For improved understanding of the coastal erosion hazard around Tauranga Harbour we recommend the following:
Implementing a cliff retreat monitoring programme to help establish more accurate cliff erosion rates. Laser scanning from a fixed ground control and/or UAV (Unmanned Aerial Vehicle) surveys can be useful for both measuring retreat rates and understanding the failure mechanisms. At a minimum, any slips should be surveyed following the failure. Key sites which should be considered for cliff retreat monitoring include Omokoroa, Matua, Maungatapu and Matakana Island.
Assessment of short- and long-term beach profile response along the unconsolidated shorelines such as Bowentown, Ongare, Pilot Bay, Matua (Fergusson Park) and Whareroa is recommended. This assessment can be completed with beach profile monitoring and/or UAV surveys.
Establishing more Vertical Land Movement (VLM) recording sites to improve the understanding and spatial coverage of VLM rates around Tauranga Harbour. There is limited data for VLM around Tauranga. The closest station which was used for this study was in the Papamoa Hills. It would be beneficial to have an additional site within the city and/or near the harbour.
A risk assessment to identify where assets are at risk of coastal erosion both now and into the future. We recommend the risk assessment is used to prioritise areas that would benefit from the development of a coastal hazard risk management strategy.
Update of this hazard assessment at intervals of no more than 10 years or following significant changes in data availability, or best practice guidance or methods.
This study has assessed coastal erosion hazard areas at a local and may be superseded by detailed site-specific assessment undertaken by qualified and experienced practitioner using improved or higher resolution data than presented in this report.
44
Tonkin & Taylor Ltd Tauranga Harbour Coastal Hazards Study - Coastal Erosion Assessment Bay of Plenty Regional Council
July 2019 Job No: 1001628.v5
8 Applicability
This report has been prepared for the exclusive use of our client Bay of Plenty Regional Council, with respect to the particular brief given to us and it may not be relied upon in other contexts or for any other purpose, or by any person other than our client, without our prior written agreement.
Tonkin & Taylor Ltd
Report prepared by: Authorised for Tonkin & Taylor Ltd by:
.......................................................... ...........................….......…...............
Rebekah Haughey Richard Reinen-Hamill Coastal Scientist Project Director
Hannah Udell Engineering Geologist
Jonathan Clarke Senior Coastal Engineer
Report Reviewed by:
..........................................................
Dr Tom Shand Senior Coastal Engineer Dr David Milner Senior Geotechnical Engineer
This report has been externally peer reviewed by Mark Dickson (Associate Professor, Auckland University) and Mark Ivamy (Natural Hazards Advisor, Bay of Plenty Regional Council).
1-Jul-19 p:\1001628\workingmaterial\report\final v5\r20190522.taurangaharbourerosionhazardassessmentfinal.docx
45
Tonkin & Taylor Ltd Tauranga Harbour Coastal Hazards Study - Coastal Erosion Assessment Bay of Plenty Regional Council
July 2019 Job No: 1001628.v5
9 References
Ashton, A.D., Walkden, M.J. and Dickson, M.E. (2011) Equilibrium responses of cliffed coasts to changes in the rate of SLR. Marine Geology. 284 (2011) 217-229.
Beavan R.J. and Litchfield, N.J. (2012) Vertical land movement around the New Zealand coastline: implications for sea-level rise, GNS Science Report 2012/29. 41p.
Boston, D., Clements, K., Greenshields, P., Kriel, A. (2008). Tauranga Harbour margin survey: examining the link between vegetation and coastal erosion.
Briggs, R.M. et al. (1996). Geology of the Tauranga Area. Occasional Report No. 22. Department of Earth Sciences. University of Waikato, Hamilton, New Zealand.
Bruun P (1962) Sea-level rise as a cause of shore erosion. J. Waterways Harbors Div 88:117–130.
Bruun, P., (1988) The Bruun Rule of erosion by sea level rise: a discussion on large-scale two- and three-dimensional usages. JCR, 4, 627–648.
Carley J T (1992), "Analysis of SBEACH Numerical Beach Erosion Model", MEngSc Thesis, University of New South Wales.
Carley, J.T., Couriel, E.D. and Cox, D.R., 1998. Numerical modelling sand nourishment profiles/quantities and beach erosion due to storms and sea level rise. WRL Tech. Rep. 98/04. University of New South Wales. Australia.
Cooper, J. A. G., & Pilkey, O. H. (2004). Sea-level rise and shoreline retreat: time to abandon the Bruun Rule. Global and planetary change, 43(3-4), 157-171.
Cowell, P.J., Thom, B.G., Jones, R.A., Everts, C.H. and Simanovic, D. (2006) Management of Uncertainty in Predicting Climate-Change Impacts on Beaches. JCR 22(1)232-245.
Davies‐Colley, R. J., & Healy, T. R. (1978). Sediment and hydrodynamics of the Tauranga Entrance to Tauranga Harbour. New Zealand Journal of Marine and Freshwater Research, 12(3), 225-236.
DEFRA (2002) Soft Cliffs Prediction of Recession Rates and Erosion.
de Lange, W. P., & Healy, T. R. (1990). Renourishment of a flood-tidal delta adjacent beach, Tauranga Harbour, New Zealand. Journal of coastal research, 627-640.
Environment Bay of Plenty (2002). Erosion protection works: guidelines for Tauranga Harbour.
Garae, C. (2015). Estimating patterns and rates of coastal cliff retreat around Tauranga Harbour. Masters thesis. University of Waikato.
Goda, Y. (2003). Revisiting Wilson's Formulas for Simplified Wind-Wave Prediction. Technical Notes. Journal of Waterway, Port, Coastal and Ocean Engineering. ASCE March/April 2003. pp. 93-95.
Green, M. O. (2009). Tauranga Harbour Sediment Study: Predictions of harbour sedimentation under future scenarios. NIWA.
Hancock, N., Hume, T. M., & Swales, A. (2009). Tauranga Harbour sediment study: Harbour bed sediments. NIWA.
Hands, E.B., 1983. The Great Lakes as a test model for profile response to SL changes. In: Komar, P.D. (ed.), Handbook of Coastal Processes and Erosion.
Hannah, J. and Bell, R.G. (2012) Regional sea level trends in New Zealand. Journal of Geophysical Research 117: C01004.
46
Tonkin & Taylor Ltd Tauranga Harbour Coastal Hazards Study - Coastal Erosion Assessment Bay of Plenty Regional Council
July 2019 Job No: 1001628.v5
Healy, T. (1994). Harbour shoreline erosion fronting Whareroa Marae; causes and possible remedies. Report prepared for Tauranga District Council.
Healy, T., Scarfe, B. and Schimel, A. (2010). Eastern Tauranga Harbour historical erosion assessment. University of Waikato.
IPCC (2013). Working Group I contribution to the IPCC 5th Assessment Report "Climate Change 2013: The Physical Science Basis". DRAFT report by Intergovernmental Panel on Climate Change. June, 2013.
Kopp RE, Horton RM, Little CM, Mitrovica JX, Oppenheimer M, Rasmussen DJ, Strauss BH, Tebaldi C. 2014. Probabilistic 21st and 22nd century sea-level projections at a global network of tide-gauge sites. Earth’s Future 2(8): 383–406.
Larson, M and Kraus, N C (1989), “SBEACH: Numerical Model for Simulating Storm-Induced Beach Change, Report 1: Theory and Model Foundation”. Technical Report CERC-89-9, US Army Engineer Waterways Experiment Station, Coastal Engineering Research Center, Vicksburg USA.
Leonard, G.S.; Begg, J.G.; Wilson, C.J.N. (compilers) 2010: Geology of the Rotorua area. Institute of Geological & Nuclear Sciences 1:250,000 geological map 5. 1 sheet + 102 p. Lower Hutt, New Zealand. GNS Science.
McKenzie, J. (2014). Predicted hydrodynamic and sediment transport impacts of breakwater construction in Tauranga Harbour, New Zealand. Master of Science thesis. University of Waikato.
Ministry for the Environment (2017). Coastal hazards and climate change: guidance for local government.
Moon, V. G. (1993). Geotechnical characteristics of ignimbrite: A soft pyroclastic rock type. Engineering Geology, 35. Elsevier Science Publishers, BV, Amsterdam, p.33-48.
Moon, V.G., Cunningham, M.J., Wyatt, J.B., Lowe, D.J., Mörz, T., Jorat, M.E. (2013). Landslides in sensitive soils, Tauranga, New Zealand. Proc. 19th NZGS Geotechnical Symposium. Ed. CY Chin, Queenstown.
New Zealand Coastal Policy Statement (2010). New Zealand Department of Conservation.
NZGS, (2005). Field Description of Soil and Rock. Guideline for the field classification and description of soil and rock for engineering purposes. New Zealand Geotechnical Society Incorporated.
Opus (2015). High level coastal erosion study: coastal erosion risk, cost benefit analysis and site prioritisation.
Shand, T D, Goodwin, I D, Mole, M A, Carley, J T, Harley, M D and Peirson, W L (2010), NSW Coastal Inundation Hazard Study: Coastal Storms and Extreme Waves, WRL TR2010/16.
Stephens, S. (2017). Tauranga Harbour extreme sea level analysis. NIWA, Hamilton.
Stephens, S. (2019). Tauranga Harbour inundation modelling. Report prepared for Bay of Plenty Regional Council. NIWA, Hamilton.
Stevens, H. and Giles, G. (2010) eShorance: an online methodology for estimating the response of estuarine shores from SLR. 19th NSW Coast Conf.
Tauranga City Council Infrastructure Development Code (TCC IDC) (2017), Design Standards-10 Natural Hazards & Earthworks, DS-10.3 Performance Criteria
Tonkin + Taylor (1980). Omokoroa Point Land Instability Investigation. Report prepared for Tauranga City Council. T+T Reference: 4487.
47
Tonkin & Taylor Ltd Tauranga Harbour Coastal Hazards Study - Coastal Erosion Assessment Bay of Plenty Regional Council
July 2019 Job No: 1001628.v5
Tonkin + Taylor (2004) Hawkes Bay Regional Coastal Hazard Assessment. Report prepared for Hawkes Bay Regional Council.
Tonkin + Taylor (2006) Regional assessment of areas susceptible to coastal erosion. Technical report prepared for Auckland Regional Council.
Tonkin + Taylor (2008). Reassessment of the Tauranga District inundation levels. Report prepared for Tauranga City Council.
Tonkin + Taylor (2012) Coastal Hazard Assessment: Waikawa to Waitarere. Technical report prepared for Horizons Regional Council.
Walkden, M. and Dickson, M. (2006). The response of soft rock shore profiles to increased sea-level rise. Tyndall Centre Working Paper No. 105. 22p.
![Tauranga Boys’ College Newsletter - tbc.ibcdn.nz · TBC 664 Cameron Road, Tauranga 3112 New Zealand: [64] (07) 578 4029: Principal R W Mangan: TAURANGABOYSCOLLEGE Tauranga Boys’](https://static.documents.pub/doc/80x56/5cd254b988c993a34d8c636a/tauranga-boys-college-newsletter-tbcibcdnnz-tbc-664-cameron-road-tauranga.jpg)


