12
T A U R U S T IM E S A Quarterly Update APRIL - JUNE 2008 The Taurus High 5 gain from it!

TAURUS TIMESA Quarterly UpdateAPRIL - JUNE 2008
The Taurus
High 5
gain from it!

HOUSE OF TAURUS
INDEX Page No.
1 TAURUS THE STARSHARE
AN OPEN-END EQUITY GROWTH SCHEME
2 DISCOVERY STOCK FUND ......................................................................................................................................................................5
AN OPEN-END EQUITY GROWTH SCHEME
3 BONANZA EXCLUSIVE GROWTH SCHEME ............................................................................................................................................. 6
AN OPEN-END EQUITY GROWTH SCHEME
4 LIBRA TAX SHIELD.................................................................................................................................................................................. 7
AN EQUITY LINKED SAVING SCHEME (ELSS)
5 TAURUS INFRA-TIPS ..............................................................................................................................................................................8
AN OPEN-END EQUITY THEMATIC FUND
6 TAURUS LIQUID FUND ........................................................................................................................................................................... 9
AN OPEN-END LIQUID SCHEME
7 LIBRA BOND FUND ............................................................................................................................................................................... 10
AN OPEN-END BOND SCHEME
8 LIBRA GILT FUND ..................................................................................................................................................................................10
AN OPEN-END GILT SCHEME
.................................................................................................................................................................... 4

FROM THE CEO'S DESK
Dear Investor,
The last quarter that ended on the 30th of June 2008 continued the trend started by the preceding quarter. The macro economic scenario and global geo-polity kept on providing mixed cues. These were less skewed towards positive than desired.
Crude prices worldwide have risen thanks to speculation, Iran-Israel tension and the conflict in Nigeria. On the domestic front, the government tried its best to contain the effect of spiraling crude prices, unsuccessfully. They had to bite the bullet finally. This resulted in a double digit inflation rate hurting every one of us.
The equity markets also took a beating a la global counterparts. We saw share prices plunging and mid caps took a bigger hit than large caps. All the above mentioned factors played an important role in this slide. To add up to the cup of woes, the left front withdrew support to the UPA government at the centre.
Foreign Institutional Investors (FIIs) have partially withdrawn their investments from India. With the commodity cycle at an all time high, prices of Indian stocks do not seem to be in a hurry to go up. Despite this, we reiterate that the overall outlook for Indian equities is strong for the long term. We are pleased to inform you that our equity scheme, Libra Tax Shield has done really well. Returns wise, it figured in the top two over a one year horizon for the period ended 30th June 2008. Libra Tax Shield was among the very few schemes that gave a double digit positive return and it is heartening.
The fixed income markets may see some liquidity being sucked out in the short term. RBI has already intervened using a 25 bps CRR hike to rein in inflation towards the end of June. Another hike announced for the second half of July 2008 clearly points out to the central bank's stance over inflation.
Under this backdrop, we at Taurus have been expanding our geographical reach and hiring quality people across all functions. We are happy to announce three important additions to our team. One, Kumar Nathani, a seasoned professional with 15 years experience joined us as Fixed Income Fund Manager from SBI Funds Management. Two, Nazish Ahmed, an MBA with approximately 10 years experience joined us as Head of Marketing. His previous stints were with Reliance Money, ICICI Prudential Life Insurance and Ogilvy One. And three, Ravi Khanna joined us to head the HR function from HDFC Ergo General Insurance. He is an alumnus of the prestigious Tata Institute of Social Sciences (TISS) with nearly a decade's experience.
We have also added competent professionals in approximately 7 new locations in the country last quarter, increasing our physical presence to 14 locations in the country. With your unending support, we intend to continue on this strengthening spree. This, we feel will result in a win- win for all of us.
Warm Regards,
Waqar NaqviChief Executive
PE
RF
OR
MA
NC
E
RISK FACTOR: Mutual fund investments are subject to market risks, please read offer document of the scheme carefully before Investing.
Standard Deviation: 10.03%Portfolio Beta: 1.09Sharpe Ratio*: 0.68R Squared: 0.79Total Expense Ratio^: 1.89%Annual Portfolio Turnover Ratio**: 0.20 timesThe above measures have been calculated by taking month end NAV for a 3 year period. from 30 June, 05 to 30 June, 08. *Risk-Free rate based on last three month T-Bill cut-off 8.81%^Averages calculated based on monthly expense ratios.**Portfolio turnover ratio has been computed as the ratio of the lower of purchase or sales divided by average AUM for the last rolling 12 months.
Date of Allotment: Jan 29, 1994Net Asset Value (NAV): Rs. 41.96 per Unit.Assets Under Management: Rs.155.72 Cr.Minimum Application Amount: Rs. 1000/- & multiples of Re. 1/- thereofNAV Calculation: All business days.Fund Manager: R.K. Gupta Managing this fund since 1999 with over 16 years experience in fund management, equity research & operations.Registrar & Transfer Agent: M/S Karvy Computershare Private Ltd.
Amount in Rs Crores Entry Load Exit Load as % Period in months0 - 6 > 6 < 12
Less than 2 Cr 2.25% 1.00% 0.50%2 Cr and above but 0.00% 0.50% 0.00%less than 5 Cr5 Cr and above 0.00% 0.00% 0.00%Any amount by SIP 2.25% 1.00% 1.00%
Switch: Equity to Equity / ELSS - Entry / Exit Load NIL and Equity to Liquid / Debt - Entry / Exit Load as per Load structure of the scheme.
QUANTITATIVE INDICATORS
FUND DATA As on June 30, 2008
LOAD STRUCTURE w.e.f. July 15, 2008
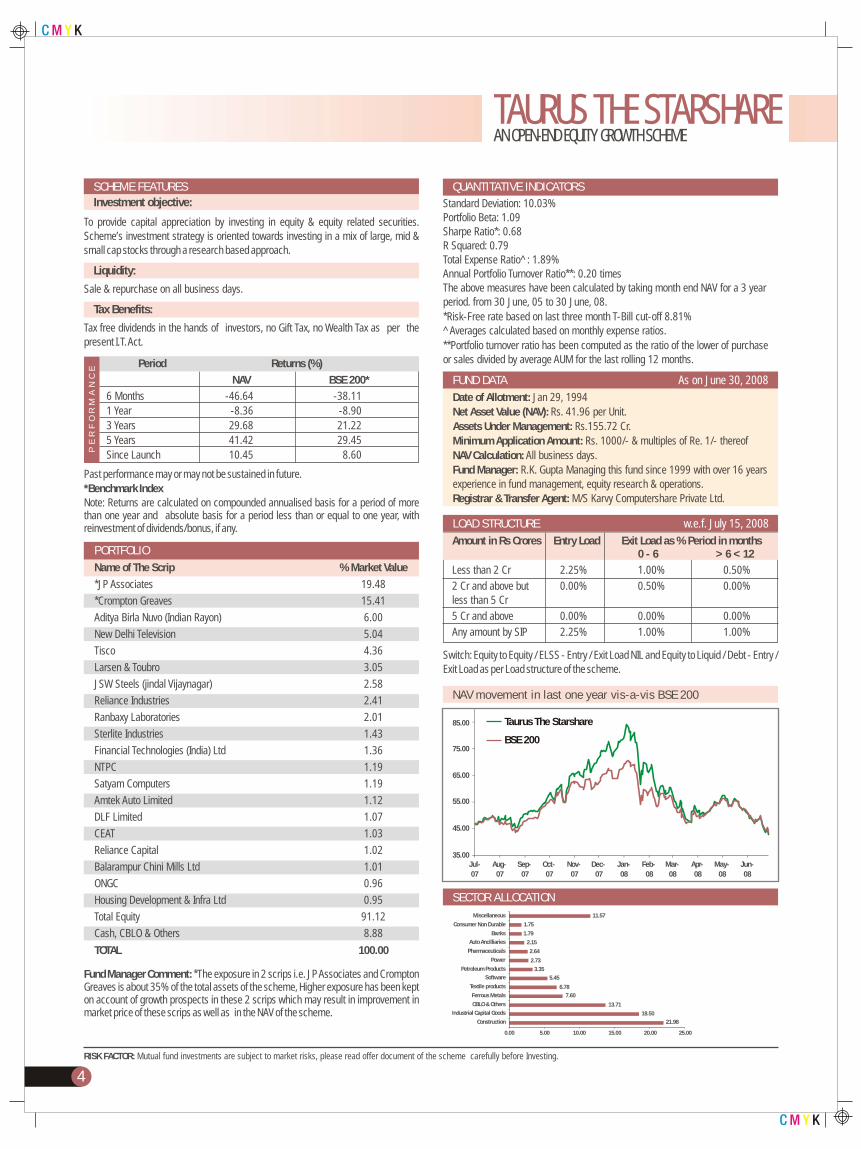
SECTOR ALLOCATION
TAURUS THE STARSHAREAN OPEN-END EQUITY GROWTH SCHEME
35.00
45.00
55.00
65.00
75.00
85.00
Jul-07
Aug-07
Sep-07
Oct-07
Nov-07
Dec-07
Jan-08
Feb-08
Mar-08
Apr-08
May-08
Jun-08
NAV movement in last one year vis-a-vis BSE 200
Taurus The Starshare
BSE 200
Construction
Industrial Capital Goods
CBLO & Others
Ferrous Metals
Textile products
Software
Petroleum Products
Power
Pharmaceuticals
Auto Ancilliaries
Banks
Consumer Non Durable
Miscellaneous
21.9818.50
13.71
7.606.78
5.45
3.35
2.73
2.64
2.15
1.79
1.75
11.57
0.00 5.00 10.00 15.00 20.00 25.00
Investment objective:
To provide capital appreciation by investing in equity & equity related securities. Scheme’s investment strategy is oriented towards investing in a mix of large, mid & small cap stocks through a research based approach.
Liquidity:
Sale & repurchase on all business days.
Tax Benefits:
Tax free dividends in the hands of investors, no Gift Tax, no Wealth Tax as per the present I.T. Act.
Period Returns (%)
NAV BSE 200*6 Months -46.64 -38.111 Year -8.36 -8.903 Years 29.68 21.225 Years 41.42 29.45Since Launch 10.45 8.60
Past performance may or may not be sustained in future.*Benchmark IndexNote: Returns are calculated on compounded annualised basis for a period of more than one year and absolute basis for a period less than or equal to one year, with reinvestment of dividends/bonus, if any.
Name of The Scrip % Market Value
*JP Associates 19.48
*Crompton Greaves 15.41
Aditya Birla Nuvo (Indian Rayon) 6.00
New Delhi Television 5.04
Tisco 4.36
Larsen & Toubro 3.05
JSW Steels (jindal Vijaynagar) 2.58
Reliance Industries 2.41
Ranbaxy Laboratories 2.01
Sterlite Industries 1.43
Financial Technologies (India) Ltd 1.36
NTPC 1.19
Satyam Computers 1.19
Amtek Auto Limited 1.12
DLF Limited 1.07
CEAT 1.03
Reliance Capital 1.02
Balarampur Chini Mills Ltd 1.01
ONGC 0.96
Housing Development & Infra Ltd 0.95
Total Equity 91.12
Cash, CBLO & Others 8.88
TOTAL 100.00
Fund Manager Comment: *The exposure in 2 scrips i.e. JP Associates and Crompton Greaves is about 35% of the total assets of the scheme, Higher exposure has been kept on account of growth prospects in these 2 scrips which may result in improvement in market price of these scrips as well as in the NAV of the scheme.
SCHEME FEATURES
PORTFOLIO
4

PE
RF
OR
MA
NC
E
Jul-07
Aug-07
Sep-07
Oct-07
Nov-07
Dec-07
Jan-08
Feb-08
Mar-08
Apr-08
May-08
Jun-08
Discovery Stock Fund
BSE 200
10.00
15.00
20.00
25.00
30.00
35.00
NAV movement in last one year vis-a-vis BSE 200
RISK FACTOR: Mutual fund investments are subject to market risks, please read offer document of the scheme carefully before Investing.
DISCOVERY STOCK FUNDAN OPEN-END EQUITY GROWTH SCHEME
SECTOR ALLOCATION
Investment objective:
To provide capital appreciation by identification of low priced stocks through price discovery mechanism. Scheme’s investment strategy is mainly oriented towards mid cap stocks.
Liquidity:
Sale & repurchase on all business days.
Tax Benefits:
Tax free dividends in the hands of investors, no Gift Tax, no Wealth Tax as per the present I.T. Act.
Period Returns (%)
NAV BSE 200*
6 Months -46.31 -38.111 Year -8.10 -8.903 Years 13.54 21.225 Years 31.05 29.45Since Launch 3.76 8.70
Past performance may or may not be sustained in future.
*Benchmark IndexNote: Returns are calculated on compounded annualised basis for a period of more than one year and absolute basis for a period less than or equal to one year, with reinvestment of dividends/bonus, if any.
Name Of The Scrip % Market Value
*ABG Shipyard Limited 6.79
*Great Offshore Ltd 6.06
Idea Cellular 5.72
Shiv-Vani Oil & Gas Expl. Serv. Ltd 4.94
Marg Construction 4.91
Nakoda Textiles Ltd 4.84
Webel Sl Energy Systems 4.24
Welspun Gujarat Stahl Rohren Ltd 4.23
Entertainment Network Ltd 4.14
Hindustan Oil Explorations 3.60
Housing Development & Infra Ltd 3.54
EMCO Ltd 3.07
Gayatri Projects Ltd 2.49
Sujana Towers Ltd 2.38
Uflex Ltd 2.35
Bharat Forge 2.18
Deccan Chronicle Holdings Ltd 2.15
Apar Industries Ltd 2.12
Usha Martin Ltd 1.93
Gujarat Nre Coke Ltd 1.86
Total Equity 79.29
Cash, CBLO & Others 20.71
TOTAL 100.00
Fund Manager Comment : Discovery Stock Fund is a capital appreciation fund that invests in companies that show high earnings and revenue growth compared to industry peers and are available at low to reasonable PEG ratios and attractive returns on equity. Also invest in low P/E and P/BV stocks.
SCHEME FEATURES
PORTFOLIO
Standard Deviation: 10.88%Portfolio Beta: 1.16Sharpe Ratio*: 0.65R Squared: 0.76Total Expense Ratio^: 2.50Annual Portfolio Turnover Ratio**: 0.86 timesThe above measures have been calculated by taking month end NAV for a 3 year period. from 30 June, 05 to 30 June, 08. *Risk-Free rate based on last three month T-Bill cut-off 8.81% ^Averages calculated based on monthly expense ratios.**Portfolio turnover ratio has been computed as the ratio of the lower of purchase or sales divided by average AUM for the last rolling 12 months.
Date of Allotment: Sep 5, 1994Net Asset Value (NAV): Rs. 16.67 per Unit.Assets Under Management: Rs. 34.99 Cr.Minimum Application Amount: Rs. 1000/- & multiples of Re. 1/- thereofNAV Calculation: All business days.Fund Manager: Nitish Ojha Managing this fund since April 2007 10years experience in equities and equity research.Registrar & Transfer Agent: M/S Karvy Computershare Private Ltd.
QUANTITATIVE INDICATORS
FUND DATA As on June 30, 2008
with over
20.7114.60
12.799.85
7.296.62
6.165.72
4.844.53
2.121.861.84
1.07
0 5 10 15 20 25
CBLO & OthersOil
ConstructionIndustrial Capital GoodsMedia & Entertainment
PowerFerrous Metals
Telecom - ServicesTextiles - SyntheticIndustrial Products
Petroleum ProductsMinerals / Mining
Consumer Non-DurableGas
LOAD STRUCTURE w.e.f. July 15, 2008Amount in Rs Crores Entry Load Exit Load as % Period in months
0 - 6 > 6 < 12Less than 2 Cr 2.25% 1.00% 0.50%2 Cr and above but 0.00% 0.50% 0.00%less than 5 Cr5 Cr and above 0.00% 0.00% 0.00%Any amount by SIP 2.25% 1.00% 1.00%
Switch: Equity to Equity / ELSS - Entry / Exit Load NIL and Equity to Liquid / Debt - Entry / Exit Load as per Load structure of the scheme.
5

RISK FACTOR: Mutual fund investments are subject to market risks, please read offer document of the scheme carefully before Investing.
SECTOR ALLOCATION
PE
RF
OR
MA
NC
E
Standard Deviation #: 9.10%Portfolio Beta: 1.04Sharpe Ratio*#: 0.45R Squared: 0.88Total Expense Ratio^: 1.70%Annual Portfolio Turnover Ratio**: 0.16 timesThe above measures have been calculated by taking month end NAV for a 3 year period. from 30 June, 05 to 30 June, 08. *Risk-Free rate based on last three month T-Bill cut-off 8.81%^Averages calculated based on monthly expense ratios.**Portfolio turnover ratio has been computed as the ratio of the lower of purchase or sales divided by average AUM for the last rolling 12 months
Date of Allotment: Feb 28, 1995Net Asset Value (NAV): Rs. 33.51(D), 33.51(G) per unitAssets Under Management: Rs. 36.02 Cr.Minimum Application Amount: Rs. 1000/- & multiples of Re. 1/- thereofNAV Calculation: All business days.Fund Manager: R.K. Gupta Managing this fund since 2002 16 years experience in fund management, equity research & operations.Registrar & Transfer Agent: M/S Karvy Computershare Private Ltd.
QUANTITATIVE INDICATORS
FUND DATA As on June 30, 2008
with over
BONANZA EXCLUSIVE GROWTH SCHEME AN OPEN-END EQUITY GROWTH SCHEME
NAV movement in last one year vis-a-vis BSE 200
30.00
35.00
40.00
45.00
50.00
55.00
60.00
Jul-07
Aug-07
Sep-07
Oct-07
Nov-07
Dec-07
Jan-08
Feb-08
Mar-08
Apr-08
May-08
Jun-08
Bonanza Exclusive Growth Scheme - OpenBSE 200
Industrial Capital GoodsFerrous metals
ConstructionCBLO & Others
Petroleum ProductsBanks & FI
AutoPharmaceuticals
Telecom - ServicesCement
SoftwarePower
Miscellaneous
18.6413.28
11.8710.31
9.887.99
5.194.594.51
4.312.842.72
3.88
0.00 5.00 10.00 15.00 20.00
Investment objective:
To provide capital appreciation by investing in equity & equity related instruments mainly of large cap stocks.
Liquidity:
Sale & repurchase on all business days.
Tax Benefits:
Tax free dividends in the hands of investors, no Gift Tax, no Wealth Tax as per the present I.T. Act.
Period Returns (%)
NAV BSE 200*
6 Months -42.95 -38.111 Year -11.63 -8.903 Years 22.89 21.225 Years 30.28 29.45Since Launch 12.57 11.63
Past performance may or may not be sustained in future.
*Benchmark IndexBonus in the ratio of 1:3 In October 2003Dividend - 25% in July, 2006Note: Returns are calculated on compounded annualised basis for a period of more than one year and absolute basis for a period less than or equal to one year, with reinvestment of dividends/bonus, if any.
Name Of The Scrip % Market Value
*Tisco 11.91*Crompton Greaves 11.33*Reliance Industries 9.88*JP Associates 8.08*State Bank Of India 7.99Mahindra & Mahindra 5.00Bharat Earth Movers 4.67Punj Lloyed Limited 3.14Grasim Industries 2.90BHEL 2.64Reliance Energy 2.59Cipla 2.58Reliance Communication 2.57Wipro 2.45Wockhardt 2.01MTNL 1.94ACC 1.40Tata Steel Limited (CCPS) 1.38Indian Hotels 1.23Hindustan Unilever 1.16Total Equity 89.69Cash, CBLO & Others 10.31TOTAL 100.00
Fund Manager Comment : The exposure in top 5 scrips is more than 49% of the total assets of the scheme, Higher exposure has been kept in these scrips on account of better growth prospects which may result in improvement in market price of these scrips as well as in the NAV of the scheme.
SCHEME FEATURES
PORTFOLIO
LOAD STRUCTURE w.e.f. July 15, 2008Amount in Rs Crores Entry Load Exit Load as % Period in months
0 - 6 > 6 < 12Less than 2 Cr 2.25% 1.00% 0.50%2 Cr and above but 0.00% 0.50% 0.00%less than 5 Cr5 Cr and above 0.00% 0.00% 0.00%Any amount by SIP 2.25% 1.00% 1.00%
Switch: Equity to Equity / ELSS - Entry / Exit Load NIL and Equity to Liquid / Debt - Entry / Exit Load as per Load structure of the scheme.
6

PE
RF
OR
MA
NC
E
RISK FACTOR: Mutual fund investments are subject to market risks, please read offer document of the scheme carefully before Investing.
SECTOR ALLOCATION
Standard Deviation: 10.44%Portfolio Beta: 1.07Sharpe Ratio*#: 0.18R Squared: 0.64Total Expense Ratio^: 2.50%Annual Portfolio Turnover Ratio**: 0.48 timesThe above measures have been calculated by taking month end NAV for a 3 year period from 30 June, 05 to 30 June, 08. **Risk-Free rate based on last three month T-Bill cut-off 8.81%^Averages calculated based on monthly expense ratios.**Portfolio turnover ratio has been computed as the ratio of the lower of purchase or sales divided by average AUM for the last rolling 12 months
Date of Allotment: Mar 31, 1996Net Asset Value (NAV): Rs. 22.44(D), 22.44(G) per UnitAssets Under Management: Rs. 13.18 Cr.Minimum Application Amount: Rs. 500/- & multiples of Rs. 500/- thereofNAV Calculation: All business days.Fund Manager: R.K. Gupta Managing this fund since 1999 16 years experience in fund management, equity research & operations.Registrar & Transfer Agent: M/S Karvy Computershare Private Ltd.
Entry Load* Exit Load2.25% Nil(Including Systematic * In direct application, there is noInvestment Plan) entry load.
Switch: Libra Tax Shield to other scheme after lock in period, Entry / Exit load willbe applicable
QUANTITATIVE INDICATORS
FUND DATA As on June 30, 2008
LOAD STRUCTURE w.e.f. July 15, 2008
with over
Investment objective:To provide long term capital appreciation, besides tax benefits, by investing pre- dominantly in a portfolio of equity and equity related securities.
Liquidity:Sale on all business days. As per Income Tax Laws, redemption facility available after lock-in period of 3 years from the date of investment.
Tax Benefits:As per Section 80C of IT Act, an individual or a HUF is allowed deduction from income an amount upto a maximum of Rs. 1 Lakh by investment in the scheme. Tax free dividends in the hands of investors.
Personal Accident Death Insurance Cover:
Available to individual/HUF investors upto five times of investment subject to maximum of Rs. 5 Lakhs.
Period Returns (%)
NAV BSE 200*6 Months -37.75 -38.111 Year 12.03 -8.903 Years 11.98 21.225 Years 27.19 29.45Since Launch 10.52 13.57
Past performance may or may not be sustained in future.11% dividend in September, 2003. 16% dividend in February, 2004.35% dividend in December, 2005.
*Benchmark IndexNote: Returns are calculated on compounded annualised basis for a period of more than one year and absolute basis for a period less than or equal to one year, with reinvestment of dividends/bonus, if any.
Name Of The Scrip % Market Value
*Bihar Tubes Ltd 12.13*Orchid Chemicals 8.83*3I-Infotech 7.04*Reliance Capital 6.71Net 4 India 4.42JSW Steels (Jindal Vijaynagar) 4.41IDFC 4.15JP Hydro 3.90MRPL 3.75JP Associates 3.71PVR Limited 3.27Electrosteel Castings Ltd 3.11JK Cements 2.98Gujarat Nre Coke 2.61JAI ENGG Works 2.09IFCI 1.98Idea Cellular 1.77Siemens Ltd 1.21Tata Teleservices Mah. Ltd. 1.19Reliance Power Ltd 0.93Total Equity 81.49Cash, CBLO & Others 18.51TOTAL 100.00
Fund Manager Comment: The exposure in top 4 scrips is more than 35% of the total assets of the scheme, Higher exposure has been kept in these scrips on account of better growth prospects which may result in improvement in market price of these scrips as well as in the NAV of the scheme.
SCHEME FEATURES
PORTFOLIO
LIBRA TAX SHIELDAN EQUITY LINKED SAVING SCHEME (ELSS)
NAV movement in last one year vis-a-vis BSE 200
15.00
20.00
25.00
30.00
35.00
40.00
Jul-07
Aug-07
Sep-07
Oct-07
Nov-07
Dec-07
Jan-08
Feb-08
Mar-08
Apr-08
May-08
Jun-08
Libra Tax ShieldBSE 200
CBLO & OthersFerrous Metals
FinanceSoftware
PharmaceuticalsPower
Petroleum Products
ConstructionMedia & Entertainment
Industrial Products
CementTelecom - Services
Mineral / MiningIndustrial Capital Goods
20.60
17.14
13.54
11.47
8.83
4.84
3.75
3.71
3.27
3.11
2.98
2.95
2.61
1.21
0.00 5.00 10.00 15.00 20.00 25.00
7

TAURUS INFRA-TIPSAN OPEN-END EQUITY THEMATIC FUND
FUND DATA As on June 30, 2008Date of Allotment: Mar 5, 2007Net Asset Value (NAV): Rs. 8.85 (D), 8.85 (G) per unit.Assets Under Management: Rs. 12.70 Cr.Minimum Application Amount: Rs. 1000/- & multiples of Re. 1/- thereofNAV Calculation: All business days.Fund Manager: R.K. Gupta Managing this fund since 2007 (Inception) 16 years experience in fund management, equity research & operationsRegistrar & Transfer Agent: M/S Karvy Computershare Private Ltd.
with over
QUANTITATIVE INDICATORSStandard Deviation: 11.49%Portfolio Beta: 1.06Sharpe Ratio*: -0.10R Squared: 0.90Total Expense Ratio^: 1.73%Annual Portfolio Turnover Ratio**: 0.51 timesThe above measures have been calculated by taking month end NAV from 2 Apr,07 to 30 June, 08.*Risk-Free rate based on last three month T-Bill cut-off 8.81%^Averages calculated based on monthly expense ratios.**Portfolio turnover ratio has been computed as the ratio of the lower of purchase or sales divided by average AUM for the last rolling 12 months.
RISK FACTOR: Mutual fund investments are subject to market risks, please read offer document of the scheme carefully before Investing.
PE
RF
OR
MA
NC
E
Investment objective:
To provide capital appreciation and income distribution to unit holders by investing only in identified sectors associated with infrastructure theme like transport, telecom, power, petroleum, steel etc, with some investment in debt and money instrument.
Liquidity:
Sale and repurchase on all business days.
Tax Benefits:
Tax free dividends in the hands of investors, no Gift Tax, no Wealth Tax as per the present I. T. Act.
Period Returns (%)NAV BSE 200*
3 Months -23.51 -14.926 Months -49.14 -38.119 Months -19.69 -8.90Since Launch -8.82 8.74
Past performance may or may not be sustained in future.*Benchmark IndexNote: Returns are calculated on compounded annualised basis for a period of more than one year and absolute basis for a period less than or equal to one year, with reinvestment of dividends/bonus, if any.(2) Scheme became open-end wef April 2, 2007..
Name Of The Scrip % Market Value
Reliance Energy 6.47
Man Industries (India) 5.86
Reliance Industries 5.77
Bharti Shipyard Limited 5.73
Mahindra & Mahindra 5.73
Voltamp Transformers Ltd 4.52
Reliance Petroleum 4.39
GMR Infrastructure 4.37
NTPC 4.12
J P Associates 3.96
Total Equity 83.69
Cash, CBLO & Others 16.31
TOTAL 100.00
Amortization of initial issue expenses: The New Fund Offer expenses were met out of entry load and expenses over and above entry load were met by the AMC.
SCHEME FEATURES
PORTFOLIO
LOAD STRUCTURE w.e.f. July 15, 2008Amount in Rs Crores Entry Load Exit Load as % Period in months
0 - 6 > 6 < 12Less than 2 Cr 2.25% 1.00% 0.50%2 Cr and above but 0.00% 0.50% 0.00%less than 5 Cr5 Cr and above 0.00% 0.00% 0.00%Any amount by SIP 2.25% 1.00% 1.00%
Switch: Equity to Equity / ELSS - Entry / Exit Load NIL and Equity to Liquid / Debt - Entry / Exit Load as per Load structure of the scheme.
8
DI
VI
DE
ND
H
IS
TO
RY
PE
RF
OR
MA
NC
E
TAURUS LIQUID FUNDAN OPEN-END LIQUID SCHEME
FUND DATA As on June 30, 2008
LOAD STRUCTURE
PORTFOLIO
QUANTITATIVE INDICATORS
Date of Allotment: Aug 31, 2006Net Asset Value (NAV): Rs. 11.1125 (G), 10.0082 (D) per unit.Assets Under Management: Rs. 6.06 Cr.Minimum Application Amount: Rs. 1000/- & multiples of Re. 1/- thereofFund Manager: Kumar Nathani Recently joined as Fund Manager. He is having over all 12 years of experience in fund management of income scheme.
Entry Load Exit LoadNil Nil
Switch over load from Taurus Liquid Fund to other schemes of the Fund: Applicable Entry/Exit loads of the schemes.
Name Of The Scrip % Market Value
Short Term Money Market Instruments 100
Average Maturity: NAModified Duration: NATotal Expense Ratio^: 0.56%^Average calculation based on monthly expense ratio since April 2007.
Investment objective:
To generate steady and reasonable income, with low risk and high level liquidity from a portfolio of money market securities and high quality debt.
Liquidity:
Sale & repurchase on all business days.
Tax Benefits:
Tax free dividends in the hands of investors, no Gift Tax, no Wealth Tax as per the present I.T. Act.
Period Returns (%)NAV Crisil Liquid Fund Index*
3 Months 1.41 1.776 Months 2.78 3.521 Year 5.42 6.77Since Launch 5.92 7.15
The past performance may or may not be sustained in future.
*Benchmark Index:Note: (1) Returns are calculated on compounded annualised basis for a period of more than one year and absolute basis for a period less than or equal to one year,with reinvestment of dividends/bonus, if any. (2) Scheme became open-end w.e.f September 4, 2006
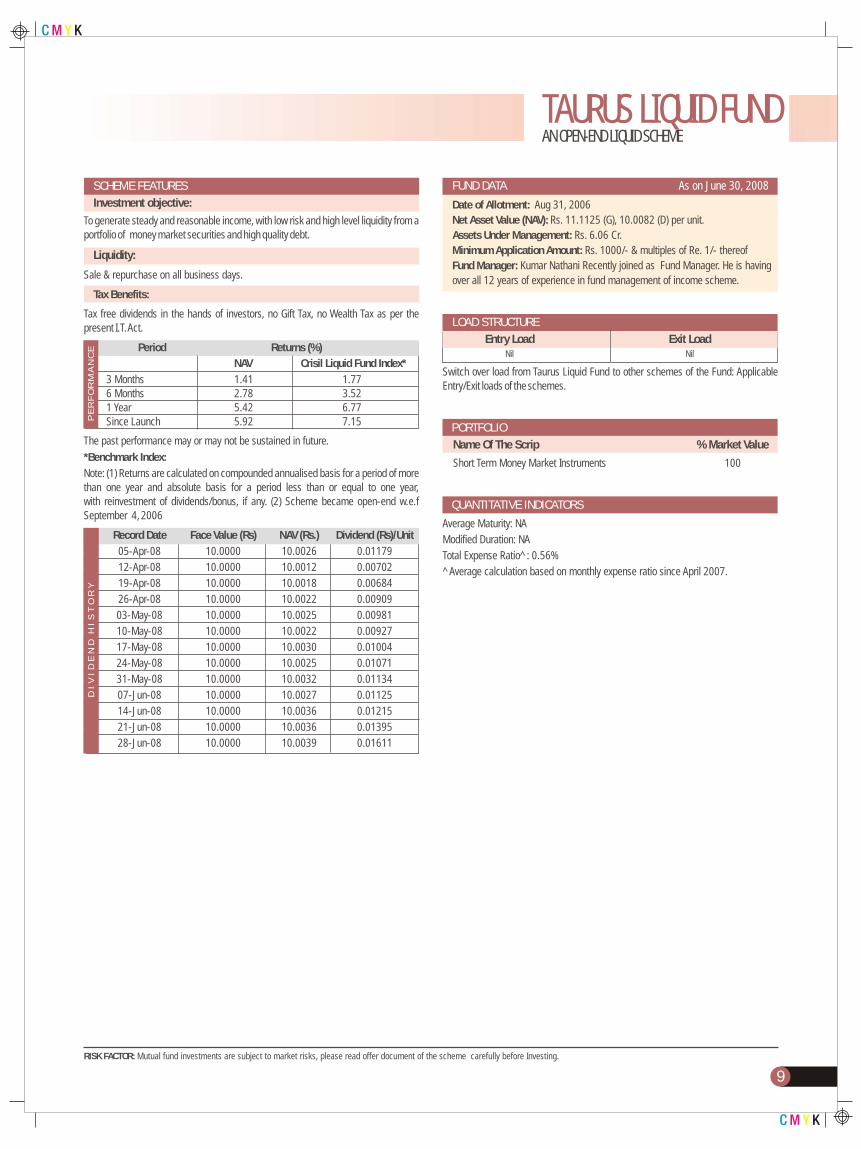
Record Date Face Value (Rs) NAV (Rs.) Dividend (Rs)/Unit05-Apr-08 10.0000 10.0026 0.0117912-Apr-08 10.0000 10.0012 0.0070219-Apr-08 10.0000 10.0018 0.0068426-Apr-08 10.0000 10.0022 0.0090903-May-08 10.0000 10.0025 0.0098110-May-08 10.0000 10.0022 0.0092717-May-08 10.0000 10.0030 0.0100424-May-08 10.0000 10.0025 0.0107131-May-08 10.0000 10.0032 0.0113407-Jun-08 10.0000 10.0027 0.0112514-Jun-08 10.0000 10.0036 0.0121521-Jun-08 10.0000 10.0036 0.0139528-Jun-08 10.0000 10.0039 0.01611
SCHEME FEATURES
RISK FACTOR: Mutual fund investments are subject to market risks, please read offer document of the scheme carefully before Investing.
9

LIBRA BOND FUNDAN OPEN-END BOND SCHEME
FUND DATA As on June 30, 2008
LOAD STRUCTURE
PORTFOLIO
QUANTITATIVE INDICATORS
Date of Allotment: Aug 18, 2001Net Asset Value (NAV): Rs. 14.9572 (G), 14.5090 (D) per unitAssets Under Management: Rs. 2.01 Cr.Minimum Application Amount: Rs. 1000/- & multiples of Re. 1/- thereofFund Manager: Kumar Nathani recently joined as a Fund Manager. He is having over 12 years of experience in fund management of income scheme.Registrar & Transfer Agent: M/S Karvy Computershare Private Ltd.
Entry Load Exit LoadNil 0-3 months -0.25% >3 months Nil
Switch Debt to other schemes, applicable Entry/ Exit load of the scheme.
Name of the Scrip % Market Value
Short Term Money Market Instruments 100.00
Average Maturity: NAModified Duration: NATotal Expense Ratio^: 0.85%^Average calculation based on monthly expense ratio since April 2007.
PE
RF
OR
MA
NC
E
Investment objective:
The objective of the scheme is to maximize income through investment in a basket of debts, bonds, debentures, government securities and money market instruments etc. of varying maturities while maintaining safety and liquidity.
Liquidity:
Sale & repurchase on all business days.
Tax Benefits:
Tax free dividends in the hands of investors, no Gift Tax, no Wealth Tax as per the present I. T. Act.
Period Returns (%)
NAV Crisil Composite Bond Fund Index*1 Year 4.29 5.09
3 Years 3.85 4.165 Years 5.31 3.81Since Launch 6.03 5.36
Past performance may or may not be sustained in future.Rs. 0.30 per unit dividend declared in the scheme in February 2002.
*Benchmark Index from April 1, 2002Note: Returns are calculated on compounded annualised basis for a period of more than one year and absolute basis for a period less than or equal to one year, with reinvestment of dividends/bonus, if any.
SCHEME FEATURES
PE
RF
OR
MA
NC
E
RISK FACTOR: Mutual fund investments are subject to market risks, please read offer document of the scheme carefully before Investing.
LIBRA GILT FUNDAN OPEN-END GILT SCHEME
FUND DATA As on June 30, 2008
LOAD STRUCTURE
PORTFOLIO
QUANTITATIVE INDICATORS
Date of Allotment: Aug 18, 2001Net Asset Value (NAV): Rs. 13.3730 (G), 13.1222 (D) per unitAssets Under Management: Rs. 0.01 Cr.Minimum Application Amount: Rs. 1000/- & multiples of Re. 1/- thereofFund Manager: Kumar Nathani recently joined as a Fund Manager. He is having over 12 years of experience in fund management of income scheme.
Entry Load Exit LoadNil 0-3 months -0.25% >3 months Nil
Switch: Debt to other schemes, applicable Entry / Exit load of the scheme.
Name Of The Scrip % Market ValueShort Term Money Market Instruments 100
Average Maturity: NAModified Duration: NATotal Expense Ratio^: 1.09%^Average calculation based on monthly expense ratio since April 2007.
Investment objective:
To provide risk free returns to investors even for a shorter duration thru investment in central or state government securities unconditionally guaranteed by the government of India. Investment will also be made in repo and reverse repo.
Liquidity:
Sale & repurchase on all business days.
Tax Benefits:
Tax free dividends in the hands of investors, no Gift Tax, no Wealth Tax as per the present I.T. Act.
Period Returns (%)
NAV I-Sec Composite Index1 Year 3.11 4.403 Years 1.21 4.805 Years 2.56 4.55Since Launch 4.32 6.40
Past performance may or may not be sustained in future.Rs. 0.30 per unit dividend declared in the scheme in February 2002.
*Benchmark Index from April 1, 2002Note: Returns are calculated on compounded annualised basis for a period of more than one year and absolute basis for a period less than or equal to one year, with reinvestment of dividends/bonus, if any.
SCHEME FEATURES
10

Award winning performance…year on year!!
The stage is set…the performance, excellent. Make the most of it. Now!
Lipper Fund AwardsIndia 2008
for Taurus the Starshare- Best Fund over
Three Years Equity India
Not just Lip Service
Asian Investor Award 2008India Equities
One Year Performanceand India Equities
Three Years Performance - Taurus Asset Management Co. Ltd.
Three cheers

*condit
ions
apply
LIG
HT
HO
US
E
• New Delhi: 3rd Floor, DCM Building, 16, Barakhamba Road, New Delhi-110001 Tel.: 011-23717593, 23321756, 23321631 Fax: 011-23738664, 23324677 • Mumbai: 305, Regent Chambers, 208 Jamnalal Bajaj Marg, Nariman Point, Mumbai-400021. Tel.: 022-22826847, 22826488 Fax: 022-66308519, 22831018 • Chennai: Flat No. -5, Block-A, 1st Floor, 29/1, Old No.15, Saena Circle, Duraiswamy Road, T. Nagar, Chennai-600017 Tel.: 044-24310061 Fax: 044-24310062 • Bangalore: S-118, 1st Floor, South Block, Manipal Centre, 47, Dickenson Road, 78th Municipal Division, Bangalore-560042 Tel.: 080-41135646 • Chandigarh: Chamber No. 2, 2nd Floor, Chandigarh Business Centre, SCO 2441-42, Sector 22C, Chandigarh-160022. Tel.: 0172-5024818 • Madurai: KVR Arcade/AR Plaza, 16/17, North Veli Street,Madurai-625001. Tel.: 0452 - 4230061 • Kolkata: B -12, Shantiniketan, 8, Camac Street, Kolkata - 700017. Tel.: 033-40030919E-mail: [email protected]
Statutory Details: Taurus Mutual Fund has been constituted as a Trust under the Indian Trust Act, 1882 Sponsor : HB Portfolio Ltd. Trustee : Taurus Investment Trust Company Ltd.,Investment Manager: Taurus Asset Management Company LtdRisk Factors: All investments in mutual funds and securities are subject to market risks and the NAV of the schemes may go up or down depending upon the factors and forces affecting the securities market. There can be no assurance that the schemes’ investment objectives will be achieved. The past performance of the mutual fund is not indicative of the future performance of the schemes. The sponsor is not responsible or liable for any loss resulting from the operation of the schemes beyond the initial contribution of Rs. 2 Lacs made towards setting up of the mutual fund. Taurus The Starshare, Discovery Stock Fund, Bonanza Exclusive Growth Scheme-Open, Libra Tax Shield, Libra Bond Fund, Libra Gilt Fund, Taurus Liquid Fund and Taurus Infra-Tips are only the names of the schemes and do not any manner indicate the quality of the schemes, their future prospects and returns. There is no guarantee or assurance as to any returns on investments of the unit holders. All dividend distributions are subject to the investment performance of the schemes. The investments made by the schemes are subject to external risks on transferring, pricing, trading volumes, settlement risks etc of securities. Please read offer documents of the schemes carefully before Investing.


