Tax Reform in an Era of Hyper- Deficits by Jon Forman Professor in Residence IRS Office of Chief Counsel (Room 3501; 622-7639) & Alfred P. Murrah Professor of Law University of Oklahoma Norman, Oklahoma
Transcript
Tax Reform in an Era of Hyper-Deficits
by Jon FormanProfessor in Residence
IRS Office of Chief Counsel(Room 3501; 622-7639)
&Alfred P. Murrah Professor of Law
University of OklahomaNorman, Oklahoma
2
Overview• The Budget Outlook
– Short-term• 2010 Federal Budget
– Long-term• Congressional Budget Office• Government Accountability Office
• Fiscal Gap
• Taxes,Tax Expenditures, and Tax Reform
Projected Budget Totals
Budget Totals, $billions 2010 2010-2019
Receipts $2,381 $35,250
Outlays $3,552 $42,219
Deficit $1,171 $ 6,969
Budget Totals, % GDP
Receipts 16.2% 18.7%
Outlays 24.1% 22.6%
Deficit 8.0% 3.9%
3Office of Management and the Budget, A New Era of Responsibility: Renewing America’s Promise (2009), at 114 (table S-1).
4U.S. Department of the Treasury, Financial Management Service, A Citizen’s Guide to the Financial Report of the United States Government (2008), at 4.
Where Does the Money Go?
5U.S. Department of the Treasury, Financial Management Service, A Citizen’s Guide to the Financial Report of the United States Government (2008), at 3.
Proposed Budget Receipts
Receipts, $billions 2010 2011
Individual income taxes 1,061 1,243
Corporation income taxes 222 302
Payroll taxes 940 995
Excise taxes 77 75
Estate and gift taxes 20 23
Custom duties and other receipts 58 67
Total receipts 2,381 2,713
Total outlays 3,552 3,623
Deficit, $billions 1,171 912
Deficit, % GDP 8.0% 5.9%
6Office of Management and the Budget, A New Era of Responsibility: Renewing America’s Promise (2009), at 119 (table S-4).
Deficits and Public Debt
7Office of Management and the Budget, A New Era of Responsibility: Renewing America’s Promise (2009), at 114 (table S-1).
Deficit 2008 2009 2010 2011 2012 2019
$billions 459 1,752 1,171 912 581 712
% GDP 3.2% 12.3% 8.0% 5.9% 3.5% 3.1%
Public Debt
$billions 5,803 8,364 9,509 10,436 10,985 15,370
% GDP 40.8% 58.7% 64.6% 67.3% 66.7% 67.2%
Congressional Budget Office, The Economic and Budget Outlook (November 24 2009), at 7.
Congressional Budget Office, Presentation to The Group of Thirty “Exit Strategy” for Fiscal Policy (December 4, 2009), at 9.
13U.S. Department of the Treasury, Financial Management Service, A Citizen’s Guide to the Financial Report of the United States Government (2008), at 7.
U.S. Government Accountability Office, The Federal Government’s Long-Term Fiscal Outlook: Fall 2009 Update (GAO-10-137SP, 2009), at 5.
15Congressional Budget Office, The Budget and Economic Outlook: Fiscal Years 2008 to 2018 (January 23, 2008), Charts at 13.
16U.S. Government Accountability Office, Saving Our Future Requires Tough Choices Today (GAO-08-465CG, January 14, 2008), at 5
17U.S. Government Accountability Office, Saving Our Future Requires Tough Choices Today (GAO-08-465CG, January 14, 2008), at 6
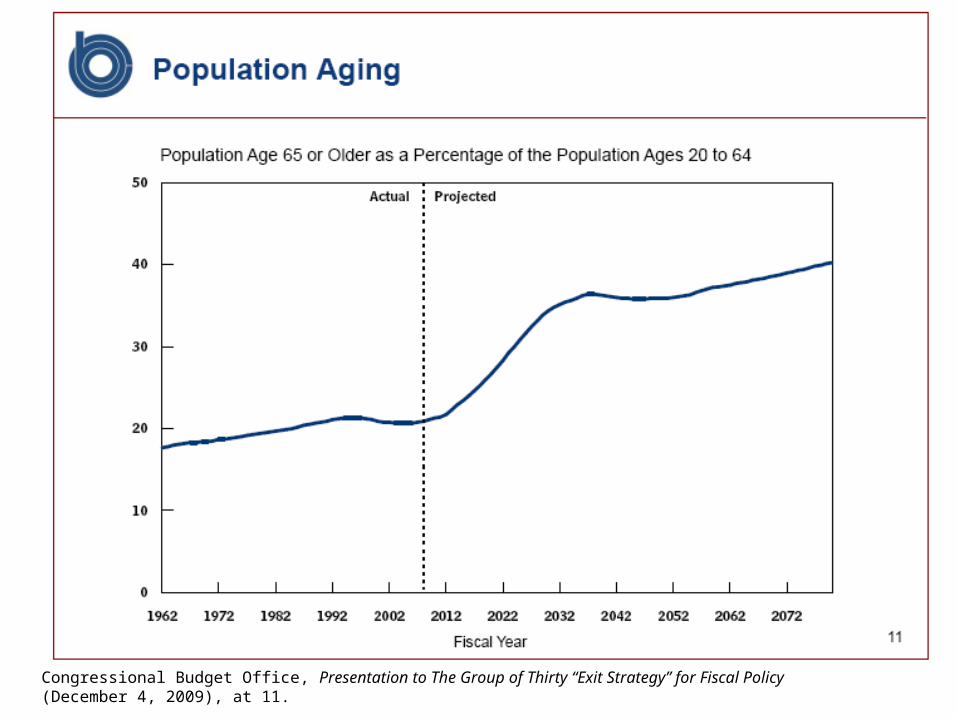
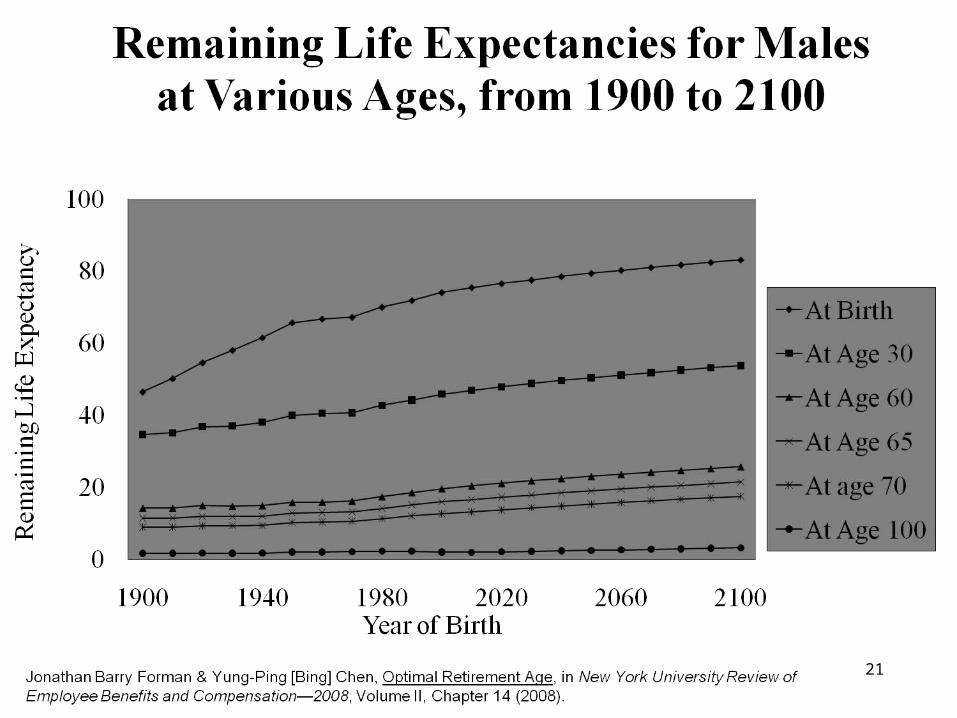
Why the Fiscal Gap?• Aging of American
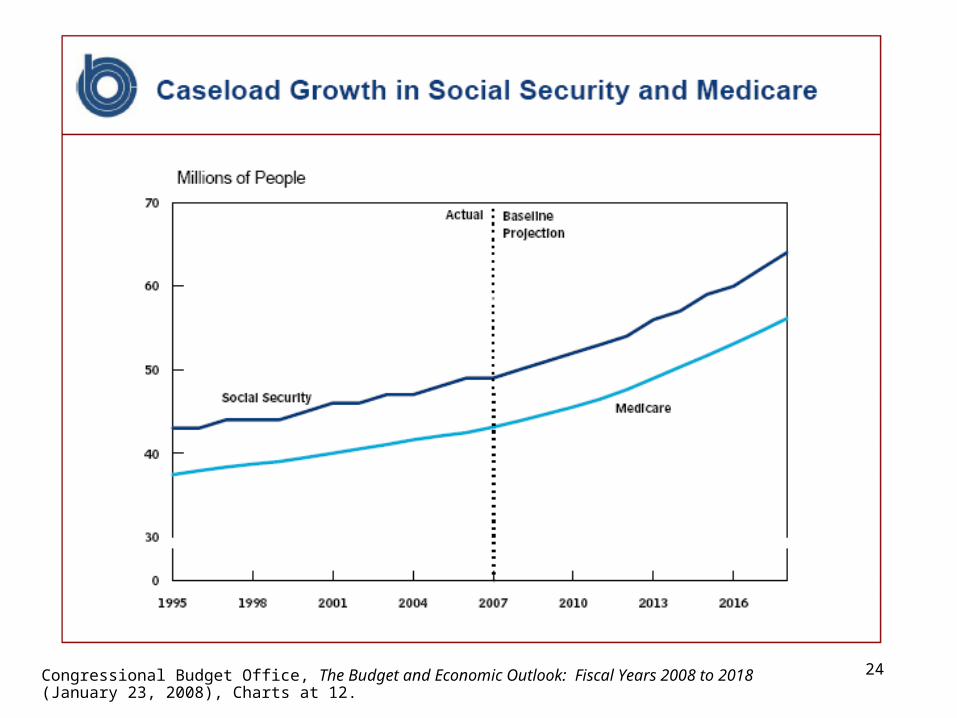
• Health Expenditures
18
Congressional Budget Office, Presentation to The Group of Thirty “Exit Strategy” for Fiscal Policy (December 4, 2009), at 11.
20Jonathan Barry Forman & Yung-Ping [Bing] Chen, Optimal Retirement Age, in New York University Review of Employee Benefits and Compensation—2008, Volume II, Chapter 14 (2008).
21
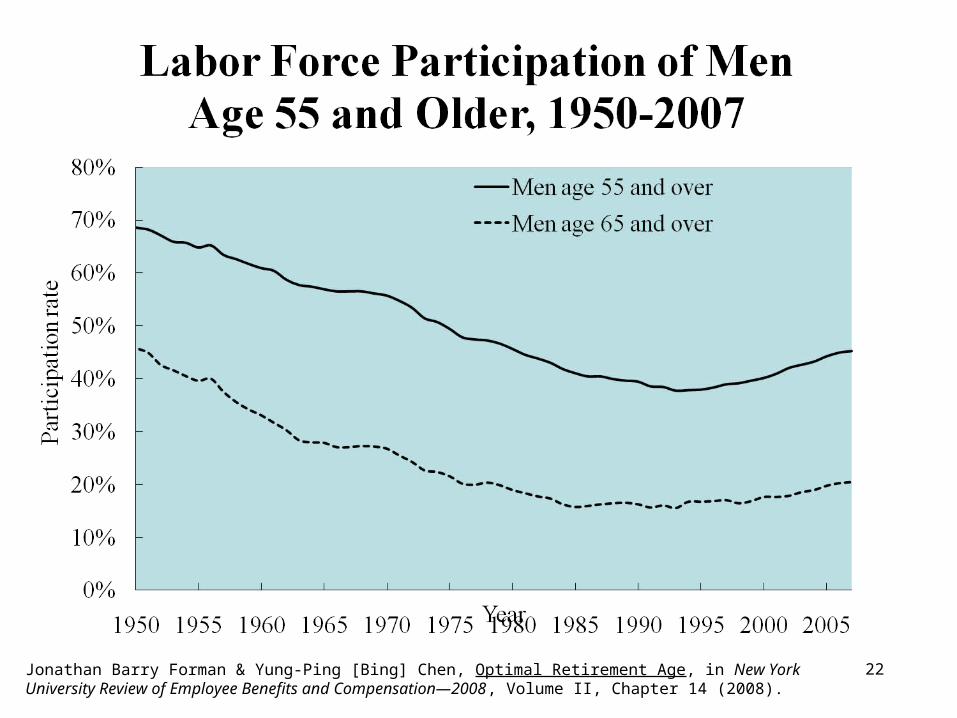
22Jonathan Barry Forman & Yung-Ping [Bing] Chen, Optimal Retirement Age, in New York University Review of Employee Benefits and Compensation—2008, Volume II, Chapter 14 (2008).
23U.S. Department of the Treasury, Financial Management Service, Financial Report of the United States Government (2008), at 122.
24Congressional Budget Office, The Budget and Economic Outlook: Fiscal Years 2008 to 2018 (January 23, 2008), Charts at 12.
25Congressional Budget Office, Growth in Health Care Costs (January 31, 2008), Charts at 8.
Factors Explaining Future Federal Spending on Medicare, Medicaid, and Social Security
(percentage of GDP)
Congressional Budget Office, The Long-Term Budget Outlook (June 2009), at 12 (Box 1-2).
27
SS Unfunded Obligations(Present values as of January 1, 2008; trillions of
dollars)
Present value
As a % of future payroll
As a % of GDP
Over the infinite horizon
$13.6 3.2 1.1
Over the next 75 years
4.3 1.6 .6
2008 Annual Report of the Board of Trustees of the Federal Old-Age and Survivors Insurance and Disability Insurance Trust Funds, Table IV.B6.
28
Medicare Unfunded Obligations(Present values as of January 1, 2008; trillions of
dollars)
Present value
As a % of HI taxable payroll
As a % of GDP
Over the infinite horizon
$34.4 6.1 2.6
Over the next 75 years
12.4 3.4 1.6
2008 Annual Report of the Boards of Trustees of the Federal Hospital Insurance and Federal Supplementary Medical Insurance Trust Funds, Table III.B10.
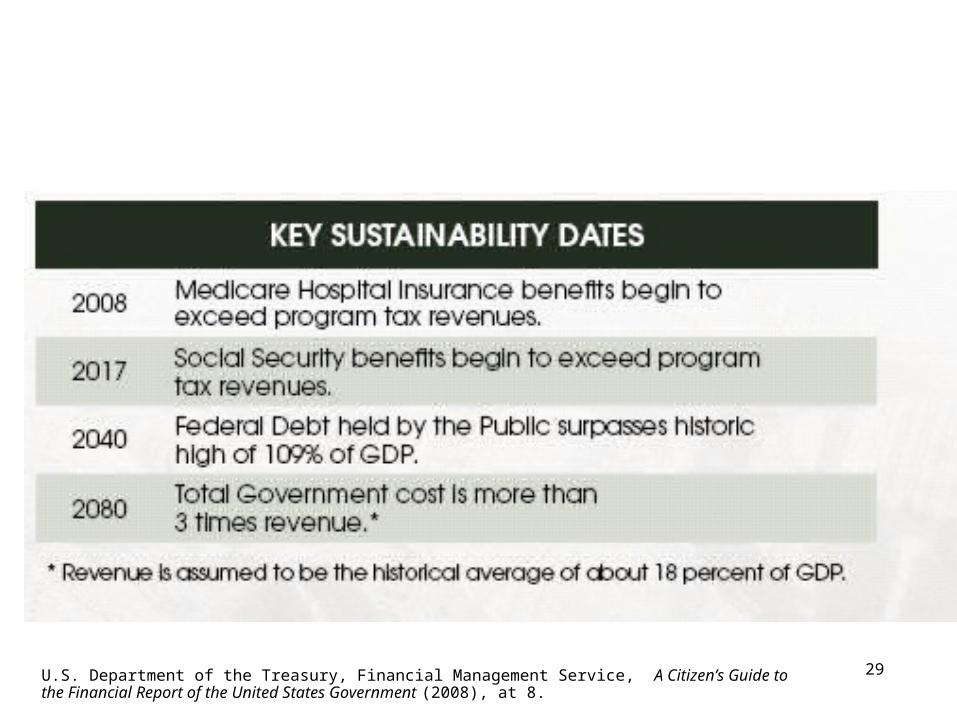
29U.S. Department of the Treasury, Financial Management Service, A Citizen’s Guide to the Financial Report of the United States Government (2008), at 8.
30
Clearly Revenues Will Be Needed in the Future
• Tax Expenditures• What Is the Best Tax Base?
Federal Revenues by Source, 1940-2014 (Millions of dollars)
Office of Management and the Budget, A New Era of Responsibility: Renewing America’s Promise (2009), at Historical Tables (table 2.1) .
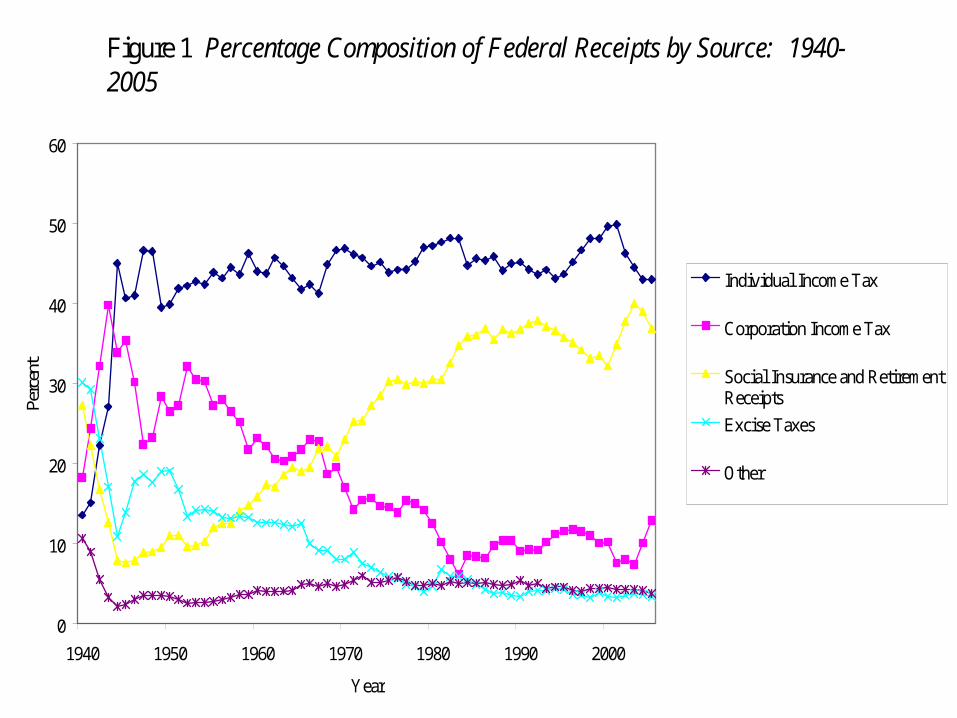
Figure 1 Percentage Composition of Federal Receipts by Source: 1940-2005
0
10
20
30
40
50
60
1940 1950 1960 1970 1980 1990 2000
Year
Perc
ent
Individual Income Tax
Corporation Income Tax
Social Insurance and RetirementReceipts
Excise Taxes
Other
33
Principles to Guide Tax Reform Legislation
• Distribution matters– A just distribution of economic resources
• Progressivity• Taxing earnings and investments
– Intergenerational justice/ Deficits
• Behavioral consequences matter– Encourage work and savings– Marriage penalties and bonuses– Keep effective tax rates as low as possible– Growth and a stronger dollar
• Simplification
34
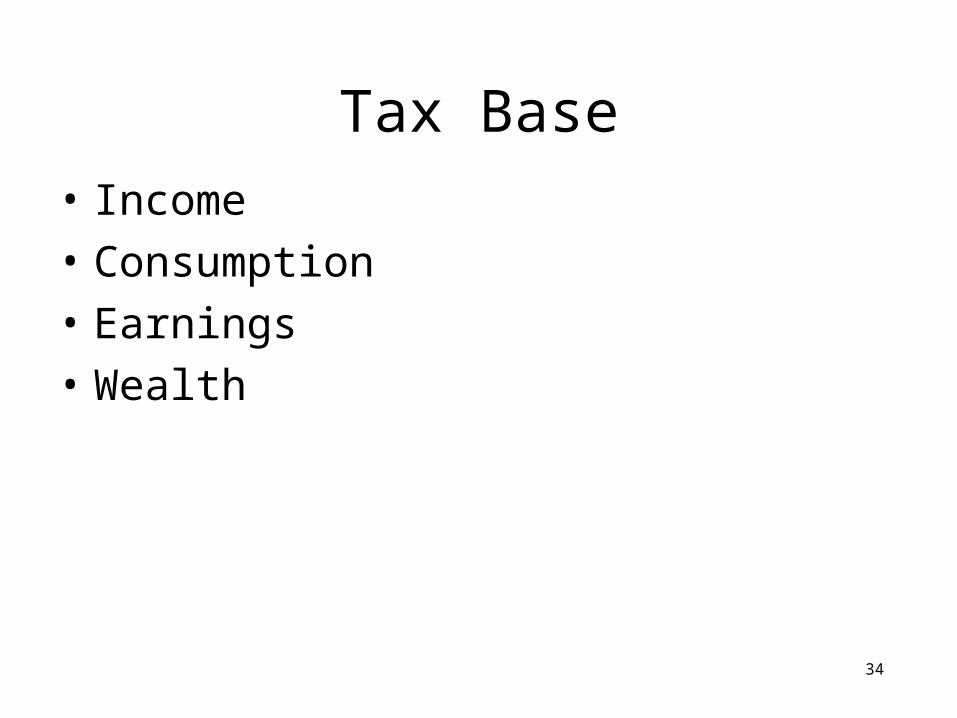
Tax Base• Income
• Consumption
• Earnings
• Wealth
35
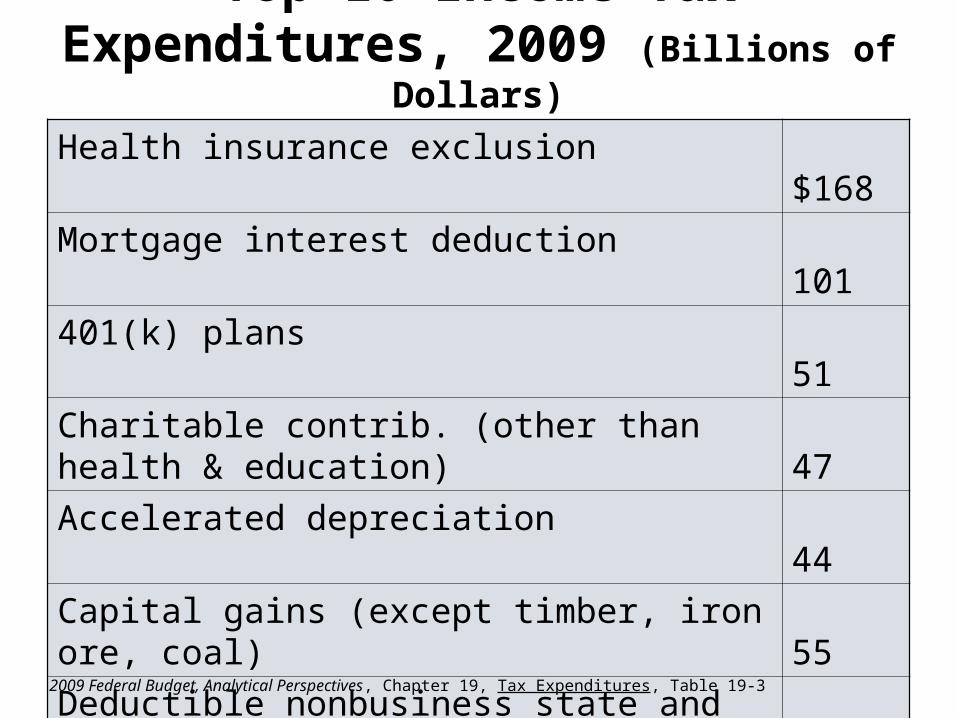
Top 10 Income Tax Expenditures, 2009 (Billions of Dollars)
Health insurance exclusion $168
Mortgage interest deduction 101
401(k) plans 51
Charitable contrib. (other than health & education)
47
Accelerated depreciation 44
Capital gains (except timber, iron ore, coal) 55
Deductible nonbusiness state and local taxes other than on houses
33
Employer plans 46
Step-up of basis at death 37
Capital gains exclusion on homes 342009 Federal Budget, Analytical Perspectives, Chapter 19, Tax Expenditures, Table 19-3
36Office of Management and the Budget, A New Era of Responsibility: Renewing America’s Promise (2009).
37Office of Management and the Budget, A New Era of Responsibility: Renewing America’s Promise (2009).
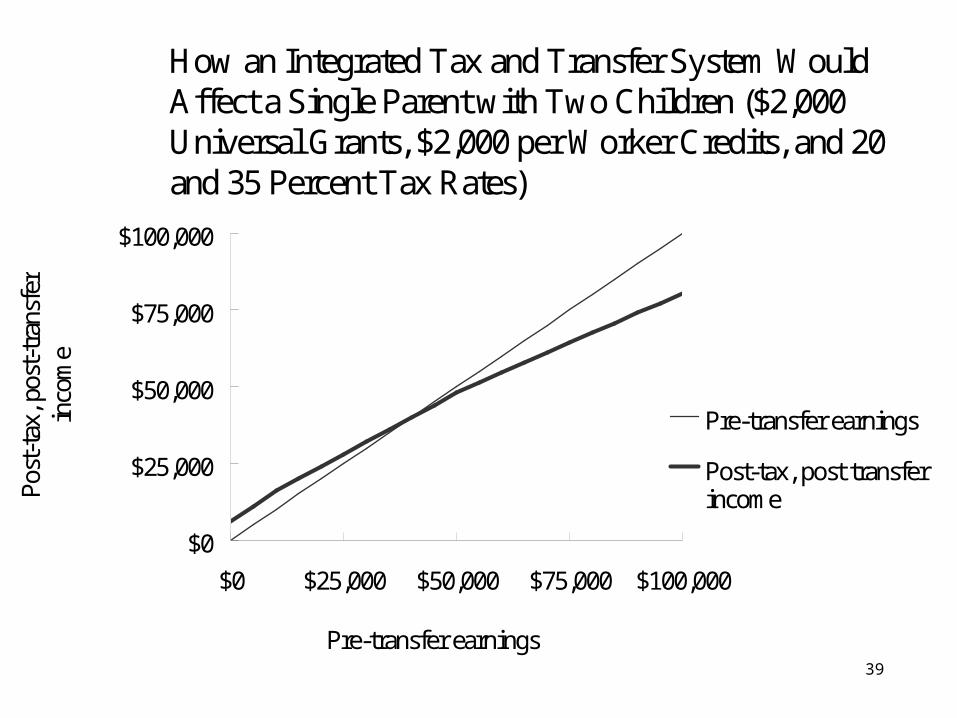
How an Integrated Tax & Transfer System Would Affect a Single Parent with 2
Children ($2,000 Personal Tax Credits, $2,000 per Worker Credits, and 20 & 35% Tax Rates)
How an Integrated Tax and Transfer System Would Affect a Single Parent with Two Children ($2,000 Universal Grants, $2,000 per Worker Credits, and 20 and 35 Percent Tax Rates)
$0
$25,000
$50,000
$75,000
$100,000
$0 $25,000 $50,000 $75,000 $100,000
Pre-transfer earnings
Post
-tax
, pos
t-tr
ansf
er
inco
me
Pre-transfer earnings
Post-tax, post transferincome
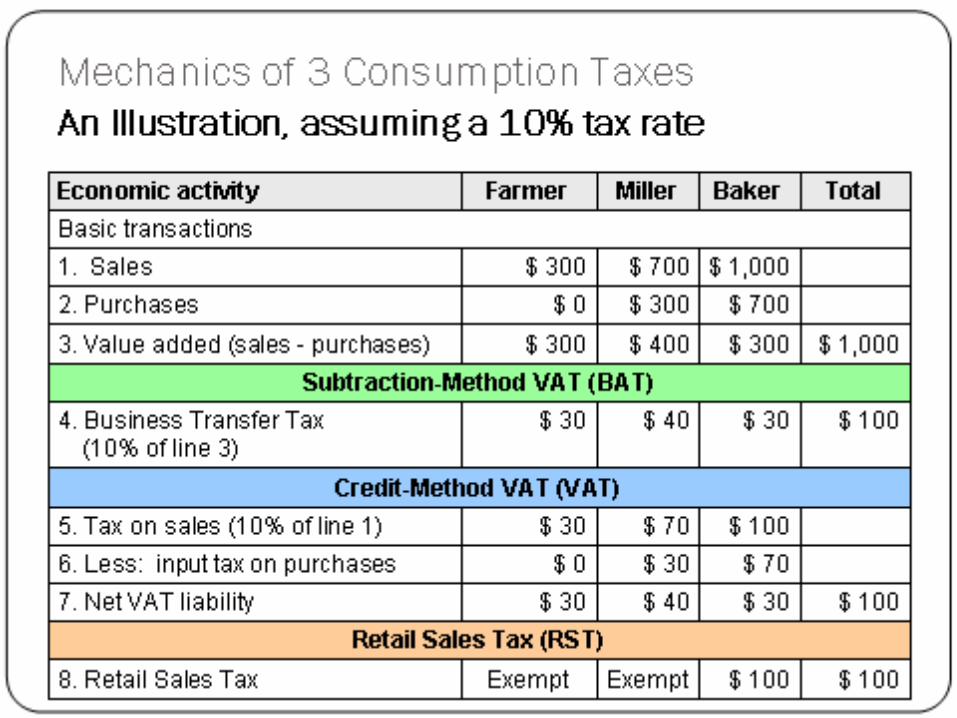
Consumption Tax Options
• Progressive Personal Consumption Tax
• Subtraction method Value Added Tax– Treasury Department proposal for
Business Activity Tax (BAT)
• Credit-method (European style) VAT
• National retail sales tax (RST)
Charles E. McClure, Jr., Why the United States Needs a Value Added Tax (2009).
42
Conclusion• President needs 60 votes in the U.S. Senate
– The whole tax and benefit system is in play• And will be in play for years
– The lobbyists will be tripping over each other
• Change is almost always incremental
About the Author• Jonathan Barry Forman (“Jon”) is
– the Professor in Residence at the Internal Revenue Service Office of Chief Counsel, Washington, DC, for the 2009-2010 academic year;
– the Alfred P. Murrah Professor of Law at the University of Oklahoma College of Law, teaching tax and pension law; and
– the author of Making America Work (Washington, DC: Urban Institute Press, 2006).
• Prior to entering academia, Professor Forman served in all three branches of the federal government. He has a law degree from the University of Michigan and master’s degrees in both economics and psychology.
• Jon can be reached at [email protected], 405-325-4779• Slides, etc. at www.law.ou.edu/faculty/forman.shtml