Taxes, Institutions and Local Governance: Evidence from a Natural Experiment in Colonial Nigeria Daniel Berger September 7, 2009 Abstract Can local colonial institutions continue to affect people’s lives nearly 50 years after decolo- nization? Can meaningful differences in local institutions persist within a single set of national incentives? The literature on colonial legacies has largely focused on cross country comparisons between former French and British colonies, large-n cross sectional analysis using instrumental variables, or on case studies. I focus on the within-country governance effects of local insti- tutions to avoid the problems of endogeneity, missing variables, and unobserved heterogeneity common in the institutions literature. I show that different colonial tax institutions within Nigeria implemented by the British for reasons exogenous to local conditions led to different present day quality of governance. People living in areas where the colonial tax system required more bureaucratic capacity are much happier with their government, and receive more compe- tent government services, than people living in nearby areas where colonialism did not build bureaucratic capacity. Author’s Note: I would like to thank David Laitin, Adam Przeworski, Shanker Satyanath and David Stasavage for their invaluable advice, as well as all the participants in the NYU predissertation seminar. All errors, of course, remain my own.
Transcript
Taxes, Institutions and Local Governance:
Evidence from a Natural Experiment in Colonial Nigeria
Daniel Berger
September 7, 2009
Abstract
Can local colonial institutions continue to affect people’s lives nearly 50 years after decolo-nization? Can meaningful differences in local institutions persist within a single set of nationalincentives? The literature on colonial legacies has largely focused on cross country comparisonsbetween former French and British colonies, large-n cross sectional analysis using instrumentalvariables, or on case studies. I focus on the within-country governance effects of local insti-tutions to avoid the problems of endogeneity, missing variables, and unobserved heterogeneitycommon in the institutions literature. I show that different colonial tax institutions withinNigeria implemented by the British for reasons exogenous to local conditions led to differentpresent day quality of governance. People living in areas where the colonial tax system requiredmore bureaucratic capacity are much happier with their government, and receive more compe-tent government services, than people living in nearby areas where colonialism did not buildbureaucratic capacity.
Author’s Note: I would like to thank David Laitin, Adam Przeworski, Shanker Satyanath and David
Stasavage for their invaluable advice, as well as all the participants in the NYU predissertation seminar. All
errors, of course, remain my own.
Do local institutions matter? Can diverse local institutions persist within a single country or
will they be driven to convergence? Do decisions about local government structure made by colonial
governments a century ago matter today? This paper addresses these issues by looking at local
institutions and local public goods provision in Nigeria. Previous work such as Acemoglu et al.
(2001) and Sokoloff and Engerman (2000) has presented strong cross-national evidence that colonial
legacies are important, and that their importance at least partially passes through institutions. In
this paper I use a natural experiment within Nigeria to show that differences in colonial institutions
caused different post-independence outcomes in parts of Nigeria which were substantively identical
before colonization. The long-run effects of different institutional legacies within Nigeria show us
that local institutions are remarkably persistent and have real consequences for people’s lives today.
Places where the British built local tax collection bureaucracies a century ago have contemporary
local governments which have higher levels of public approval, better delivery of public goods such
as vaccinations and lower levels of corruption that those places where the British were less active.
This paper advances the state of knowledge on local institutions in three significant ways. First
of all, I focus directly on the governance effects of institutions instead of on the economic effects
which have previously been the object of more scrutiny. Secondly, in addition to finding differences
in satisfaction with local governments, I trace specifically what the higher quality local governments
are doing better. Finally, by working rigorously within a single country, I produce results unaffected
by the problems of unobserved heterogeneity common in the cross-national study of institutions.
The specific institution on which I focus is the de facto institution of local bureaucratic capacity.
Local bureaucratic capacity is the ability of local governments to accomplish tasks delegated to
them. In a country like Nigeria, where corruption and indifference to the law are commonplace,
it is more important to focus on what local governments actually do in practice rather than what
they are supposed to do on paper (de jure institutions). Further, the political instability in the
country has caused successive military and civilian governments to frequently change the laws and
organizational structures under which local governments officially operate but to leave the personnel
relatively unchanged. Therefore the ability of local governments to function depends much more
heavily on the honesty and competence of the local bureaucrats than on the specifics of the laws
1
under which they are operating. Only local governments largely staffed by individuals with norms
of honesty and public service will successfully deliver local public goods.
In this paper I show that the historical accident of the division of Nigeria in 1900 into separate
administrative allows me to measure the effects of institutions and colonial legacies. The British
divided Nigeria into different regions along the 7◦10′ line of latitude. Otherwise identical villages
were subjected to different tax regimes based on whether they were barely north or barely south
of the line. This led to different levels of local bureaucratic capacity formation. Today, a century
after the different systems were implemented, differences in government quality persist.
I explain how the division was based on concerns exogenous to the situation at the border. I
then present evidence that the decision of whether or not to implement direct taxation in the north
and south was exogenous to conditions near the border. Next I show that the British removed
the differences in tax systems for reasons again exogenous to the situation near the border and
that no systematic migration between the two areas occurred. Therefore the difference in present
conditions in these areas forms a natural experiment in the spirit of a regression discontinuity on
the relative institutional effects induced by the two tax systems.
Local governments which were forced to collect taxes had to generate the institutional capacity
to be able to collect said taxes. Someone had to take a sufficiently accurate census to know how
many people lived in a village. Someone had to collect the money and record who had paid.
Someone had to get the money to the British officials. All of this had to occur with a limited
amount of corruption or outright theft. I show that today’s bureaucracy is far more effective in
areas where the British developed the bureaucratic capacity to carry out the delegated task of
tax collection. This argument actually parallels the argument by Braun that a large part of the
creation of a professional bureaucracy in England came from the need to collect taxes. “Public
finance and the fiscal branches of the government had to be evaluated as one of the crucial means in
the process of bureaucratization and the development of a modern civil service performed by skilled
professionals.” (Braun (1975) p.318) The British forced local governments in parts of Nigeria to
evolve in the same way.
This abrupt discontinuity in institutions is essential both to identifying the effect of local insti-
2
tutions and to understanding what this paper is not doing. Northern Nigeria and southern Nigeria
are without a doubt very different places. A comparison of average northerners with average south-
erners would yield very little information about colonial legacies. Even matching similar individuals
between the entire regions would be highly questionable. In this paper I only look at villages which
are physically close, sitting on opposite sides of the imaginary line at 7◦10′ N. This line does not
now and has not since 1914 formed any administrative boundary between north and south Nige-
ria. The people on both sides were similar before the arrival of the British and subjected to the
same independence movements and post-independence economic and political effects. Even the
area north of this line is significantly south of of what is considered today to be part of “Northern
Nigeria.” (The structure and demands of the independence movements in general were different
between what is traditionally thought of as the North and what is traditionally thought of as the
South.) In the interests of clarity, I will refer to the area directly north of 7◦10′ as the area directly
above the line and the area directly south of 7◦10′ as the area directly below the line. I will refer to
the Northern Protectorate and Southern Protectorate when I am referring to the entireties of the
colonial subdivisions of Nigeria from 1900-1914 and simply use north and south to refer to areas
which match current understandings of northern and southern Nigeria. Finally, I am comparing
the institutions left by two different colonial regimes, not comparing colonialism to no colonialism
or arguing that colonialism was a positive experience for Africa.
Since this institutional gap was created by the British during the colonial era, its persistence is
quite remarkable. I explore how the incentives in place for bureaucrats in Nigeria encourage rela-
tively effective local governments to continue to operate well while simultaneously driving corrupt
and ineffective local governments to remain that way. This is driven by a combination of very low
turnover in local government jobs (even after coups and reorganizations) and the high levels of
nepotism causing the local governments to behave like family businesses, with both the good and
bad aspects thereof.
This paper follows a simple progression. The next section is a review of the literatures on types
of colonialism in Africa and on institutions and development. Part three lays out a detailed stylized
history of Nigeria from the late 19th century to the present, explaining how the natural experiment
3
came about and providing some prima facie evidence that there is a difference across the old border.
I then briefly discuss my data and the methods I use. Sixth, I present my results. Following the
results section I consider other explanations for differences across the line and conclude that the
initial institutional explanation is the most plausible. Finally, I show why we should expect local
institutions to persist. The paper closes unsurprisingly with a conclusion.
2 Institutions and Development
Political scientists and economists have been very interested in how history, working through the
pathway of institutions, leads to present day conditions. This paper contributes to multiple major
social science discussions about these issues. First of all, the study of institutions’ effects on
economic and political outcomes has recently blossomed. In this paper I look at institutions at
the local level which permits me to remove a large amount of the unobserved heterogeneity (e.g.
cultural differences) which is frequently a problem in the study of institutions. Further, I look
at the long-run persistence of institutions and their effects which speaks to the policy question of
what short-term improvements quick institutional reforms can be expected to engender. Finally, I
address the debate on long-run colonial legacies. While this paper looks at subnational variation
in a colonial policy within Nigeria, tax policies varied in systematic ways between British and
French colonies and understanding these effects will allow us to better understand how much of
the difference between former French and British colonies comes from institutions and how much
comes from other sources.
Attempts to understand the effects of colonialism and colonial institutions on modern outcomes
have been plagued by many complications. First of all, there are extreme issues of endogeneity,
unobserved heterogeneity and missing variables. Secondly, it is often difficult to isolate an individual
institution from the cluster generally imposed by a colonial power. Finally, it is often difficult to
interpret the effect of institutions when the only variation is at the cross-national level.
The current focus on institutions and development largely originated with North (1990), Hall
and Jones (1999) and Knack and Keefer (1995) all of whom examine how the “rules of the game”
affect economic outcomes. These papers were quickly followed by two attempts to use climate as
4
an instrument for institutions. Acemoglu, Johnson and Robinson (Acemoglu et al. (2001)) examine
how deadly climates lead to the foundation of extractive colonies with poor institutions while more
hospitable climates led to the foundation of settler colonies with better institutions. Sokoloff and
Engerman (2000) look instead at the incentives created based on whether climates were conducive
to the growing of plantation crops. Both papers show that institutions which respected property
rights in colonial times are strongly correlated with economic wellbeing today. While the succeeding
literature has criticized their data (Albouy (2006)), suggested that their results could be driven by
other factors (Glaeser et al. (2004)) and raised question about persistence (Przeworski (2004)) their
insights on the persistent effects of institutions on growth have had a major impact. Further work
along this line has led to other ways of identifying exogenous cross-national variation in institutions
such as pacific wind patterns (Feyrer and Sacerdote (2006)).
The cross-national comparisons have recently been complimented by a small micro-level liter-
ature. In “History, Institutions and Economic Performance: The Legacy of Colonial Land Tenure
Systems in India.” Banerjee and Iyer (2004) exploit the effectively random decision by the British
of which land tenure system to impose where in India. They show that these institutions have per-
sisted and hugely effect present day incomes. Similarly, a study of various extractive institutions
in Brazil was able to show that parts of Brazil which had a gold based economy today have better
rule of law than those associated with the sugar trade. (Naritomi et al. (2007))
There is also a much less historically oriented literature on institutions, with a heavy focus
on democracy. These papers often focus on how the institution of democracy (or elections) gives
governments incentives to provide basic services for citizens. In The Logic of Political Survival
Bueno de Mesquita et al. (2003) show both formally and empirically that systems which require
the consent of a large proportion of the governed (democracies) generate more public spending,
especially on education and health care, than those which do not require the support of a significant
percentage of the population (autocracies). Democracy has been shown to avert famines (Sen
(1983)) and to be correlated with greater primary education spending (Stasavage (2005)). This
literature is per force constrained to look at the national level making it is difficult to control for
unobserved effects which might lead both to democracy and better goods provision.
5
Some of the earliest work on institutions and development, even though it didn’t use the spe-
cific terms, is the work on French and British colonial legacies. The British were more likely to
employ indirect rule where the colonial government would govern through preexisting indigenous
authorities. According to Lugard (1922), this was supposed to foster better governance by reduc-
ing the magnitude of disruptions inherent in the change of rulers. The French, on the other hand
would use direct rule in which they would implement their institutions in areas they controlled
instead of adapting the institutions that were already there. The French believed this would lead
to “civilizing” the colonized. (Lewis (1962))
This putative difference in colonial styles created a literature which began in the colonial period
itself and continues on to today. Whittlesey (1962) contrasts British indirect rule and French direct
rule along the coast of West Africa using the language of a natural experiment. His study is mostly
descriptive, and though he finds much to admire in the order and organization of the French colonies
he argues that the British form of rule left their colonies more suited for successful self-government.
An important piece written in the immediate aftermath of decolonialization was Crowder (1964)
where he argues strongly that even if there were some differences in rule within the British and
French empires these paled in comparison with the differences between the rule instituted by the
two colonial powers. This conclusion has been important to the succeeding two generations of
work on African colonial institutions. Geschiere (1993) shows how when confronted with similar
situations in Cameroon the French and British styles of rule led them to creating entirely different
institutions.
My micro level examination of local institutions in Nigeria speaks to all of these literatures. First
of all, it addresses the national level institutional debate by providing better control of endogeneity
and unobserved heterogeneity than the large cross-country studies. Further, I am able to be more
specific about institutions than “property rights” and focus on an institution which doesn’t co-vary
with many other institutions. I also address both the local and national level literatures by focusing
on an informal institution rather than the formal ones which have previously been the focus of most
of the literature. My focus on local public goods speaks to the literature on institutions and quality
of life. Finally, by looking at an institution which varied systematically between the British and
6
French I gain leverage on the question of what it was about their different colonial styles that led
to different post-independence outcomes.
3 A Stylized History of Nigeria
The colonial history of Nigeria provides an ideal environment in which to examine the effects of
different institutional histories on development. British Colonial administrators in London divided
up the protectorate of Nigeria and gave autonomy to the colonial governors who instituted different
practices in the colonies of Northern Nigeria and Southern Nigeria. These different institutional
decisions were not driven by conditions in the border region, which was considered relatively unim-
portant to the economies of both regions.
In this section I trace a stylized history of the part of Nigeria’s middle belt where the dividing
line ran, focusing my attention on the different institutions created on the two sides in the early 20th
century. I also add observations on different levels of government competence between the areas
directly above and below the line, both around independence and today. The most important point
of this section is that the different institutions were implemented in the Northern and Southern
Protectorates for reasons unrelated to conditions near the border. I am not making the (false)
claim that the institutional difference was totally random and unrelated to the characteristics of
the protectorates of Northern and Southern Nigeria, but rather that it was driven by differences
between parts of the Northern and Southern Protectorates which are physically, culturally and
economically distant from the border region.
3.1 Geography and People
This paper focuses on the area around 7◦ 10′ N, running across the eastern 2/3 of Nigeria. The area
is a wooded tropical zone in which agriculture is the dominant economic activity. The largest cash
crops are fruits which is exported to other states in Nigeria and cocoa which is sold internationally.
There is some yam and rice production but most calories come from cassava and yam. It is north
of the Oil Rivers in the delta (named for palm kernel oil, not the petroleum which is located in
the same general areas). Ethnically, there are from west to east Yoruba, Edo, Ibala, Idoma and
7
Tiv regions. The region is to the north of the Igbo majority region which attempted to secede
from Nigeria leading to the Biafran war and is commonly considered to be part of Nigeria’s middle
belt. This area is also north of the main area in which the British implemented the Warrant Chief
system. The Warrant Chiefs were mostly instituted among the Ibo, Ibibo, Ijo, and Ogoja people
in the southeast, (Afigbo, 1972) and did not drive institutions in the middle belt.
The British perceived the vast majority of the inhabitants of this border area as “politically
backwards.” There were very few organized governments larger than a village or a small group of
villages. This is very different from the Hausa Emirates in the far north and the Yoruba kingdoms
in the southwest. This relative lack of organization is the reason the British created institutions
whole cloth as opposed to slightly modifying preexisting institutions as in the far north.
3.2 Up to 1899
Europeans first reached the coast of Nigeria in 1485, but until the middle of the 19th century
there was very little European penetration into the interior. In 1852 the British took Lagos and
established the Lagos colony in the southwest of modern-day Nigeria. The main wealth of Nigeria
was in edible oils, which the British increased exports of. In the Berlin conference of 1885 Britain
was granted the region between the German Cameroons and French Dahomey (now Benin). The
northern border was, however, left somewhat ambiguous. The Royal Niger Company was granted
a charter in 1886 to run most of what is now modern Nigeria, including the muslim northern
area. The company chose to maintain a very small presence in the north, instead concentrating
its resources in the fertile south. Britain revoked the company’s charter in 1899 as a result of
Anglo-French convention of 1898 which recognized Nigeria as a British crown colony.
[FIGURE 1 ABOUT HERE]
The British then decided to split Nigeria into three regions, with a Northern governor in Jebba
(not Kano), a Southern governor in Lagos, and a crown colony in the Southwest around Lagos
and also administered from Lagos.1 The decision to divide the colony was made for two reasons.
First of all, Nigeria as a whole was large enough that it would have required a governor general,1The crown colony is not relevant to this paper and I will generally ignore it for the rest of the stylized history.
8
which is a relatively senior colonial office position. However, “for climatic reasons: it would be
impossible under present circumstances, to get any but a young man to do efficient work in West
Africa.”(Madden and Fieldhouse (1991) p. 451) This was essentially a fear that a senior colonial
officer would die of malaria if posted to Nigeria. The poor existing infrastructure was the other
reason given for not creating a single colony: “the absence of of telegraphs and roads . . . render it
really more difficult to communicate with all parts of the territory from any possible point within it
than from Downing Street.” (Madden and Fieldhouse (1991) p. 451) The dividing line was drawn
by first drawing a line connecting the rapids of Calabar with the center of the town of Yola. Then
the boundary is the line between where the first line crosses the north fork of the Katsena river to
the center of the town of Owo. (Lucas (1899) pp.254-5) This is approximately the 7◦ 10′ N line
mentioned above. Note that this is where the line intersects a river which runs north-south, the
dividing line is not following the river.
The dividing line did not follow any existing division as can be observed in the 1896 map
presented in Figure 1 Panel 1. It was placed at 7◦ 10’ because the British wanted to avoid drawing
the dividing line down the center of a river “both banks of the Niger must be under one jurisdiction
on opposite banks, [otherwise] the administration of criminal and civil law will be more difficult.”
(Madden and Fieldhouse (1991) p.451) They also wanted to keep the southern Yoruba people
and northern Hausa Muslim emirates intact. Therefore they chose a line at 7◦10′ which was well
south of the Benue river and which ran through villages which were neither Christian nor Muslim.
Third, it had the advantage of running through an area which British had little interest in, so it
avoided dividing any British owned or operated plantations between the newly created Northern
and Southern Protectorates.
3.3 1900 to 1914
The divergence in institutions between the areas directly above and below 7◦ 10’ entirely enter
during this 15 year period. The difference is due to two major factors. First, the the Northern
Protectorate was landlocked while the Southern Protectorate was a maritime province, leading
to very different available tax handles. Second, the cultures and people in the north part of the
9
Northern Nigeria Protectorate were very different from those in the coastal part of the Southern
Nigeria Protectorate even though the areas at the line were identical. Here I concentrate on a few
aspects of those factors.
The first is the issue of government finance. The government of the Southern Protectorate had
an obvious tax handle in import tariffs levied at the ports. In the fiscal year ending on March 31,
1901 over 90% of the revenues of the Southern Nigerian government came from import duties,(Geary
(1927) p.125) largely on alcohol. A very small fraction of the population actually drank imported
alcohol, and as Geary says “The whole of the revenue might as far as the Native is concerned be
taxes on what were to him luxuries.”(Geary (1927) p.125) All of Nigeria was treated as a customs
union, so all imports that would reach the Northern Protectorate (except for salt) also had to pass
through the southern ports. It is also important to note that these ports are far away from the
dividing line between the Northern and Southern Protectorates. Therefore any direct or indirect
effects of the existence of the major ports (increased trade, employment, education etc.) did not
affect the area directly below the 7◦10′ line.
Since the Protectorate of Northern Nigeria had no seacoast and thus no ports the northern
government was unable to raise money from tariffs. (The quantity of overland trade was insignifi-
cant, especially since all of Nigeria’s neighbors were French colonies.) Lord Lugard, the governor,
was therefore forced to find other tax handles. The colonial government of the Northern Protec-
torate received an annual transfer of approximately £34,000 - £75,000 out of more than £1 million
of tariff revenue taken in by the southern government. The northern government also received a
grant from the British crown of £100,000 - £400,000 per year. This was still not enough to run
the government. Therefore, Lugard raised the rest of the money he needed by a series of direct
taxes.(Geary, 1927) In the Muslim areas farther to the north there were property taxes and taxes
on livestock. However, in what they referred to as the “pagan areas” they used a simple poll-tax.
The annual amount of the poll tax varied from 6d up to 3s,(Northern Nigeria Lands Committee
(1910) p.47) which is equivalent to $4 - $20 in 2006 dollars.(Officer and Williamson) The exact
amount was based on the perceived wealth of the community, but nearly the entire area directly
10
above the line was placed in the least wealthy category.2 By 1914 the British collected £8,062
(Agber (2002) p.390) of taxes in Tivland, which overlaps significantly with the northeastern part
of modern Benue State.
There are multiple ways the different financial situations could lead to a divergence between the
two regions. The most obvious is that if the southern region collected more taxes this would allow
greater spending on infrastructure and education. However, it appears that near the dividing line
both sides had similarly low levels of public spending. There was no road system built in this area,
as the rivers were considered to be the best means of transportation and shipping in the region.
Further, there is no evidence of any schools being built by the British in the area. There was
one rail line built near the end of this period which ran north-south to connect coal fields further
north to the sea. There is no obvious reason why this should have affected the two sides of the line
differently.
Another difference between the two regions was in the court systems implemented by the British.
In the Northern Protectorate, there was a native court and theoretically a supreme court run by
the colonial administration. However, it is unclear whether this court heard more than one case
in the entire period from 1900-1914. (Parliament began an investigation over whether there had
been more than one case heard, but other 1914 events caused the investigation to be abandoned
and never reopened (Geary (1927) p.269).) There was certainly no such court set up near the
line during this period. In the Southern Protectorate there were British district courts to which
serious cases could be appealed. These appeared to have been much more active than the supreme
court of the north. However, these courts were not active in the area directly below the line, being
coastally concentrated. After amalgamation in 1914 the court systems were fully harmonized so
any institutional differences induced by the difference in courts would have to have been locked
in during this 15 year period of different de jure by identical de facto institutions. Further, any
institutional effects of the theoretically stronger courts in the south would likely be in the direction
of better institutions in the Southern Protectorate.
It is also possible that there could be a preexisting difference between the people directly above2The area directly below the line was not classified since no poll tax was being collected there but there is no
reason to believe that it was any different.
11
and below the dividing line or that such a difference was perceived by the British which they then
encouraged. This is where looking at the areas close to the dividing line is essential. There is
no doubt that there were massive preexisting differences between the Muslim far north and the
people of the coastal regions. However, there is no evidence of any preexisting difference between
the people directly above and below the line. There is also the British appear not to have believed
any difference existed, which could have lead to the areas being treated differently in other ways.
Sir R. Menendez testified to parliament about the lack of cultural differences across the line: “[m]y
impression is that the customs prevailing among the pagan communities in [the Protectorate of]
Southern Nigeria are practically, if not altogether, the same as those in the pagan communities
[in the Protectorate] of Northern Nigeria.”(Northern Nigeria Lands Committee (1910) p.65) In a
memorandum on taxation attached to the same report, Lord Lugard makes it clear that he does
not believe that the area above the line has a preexisting development edge on anyone. When
talking about the economies and organizations of the different regions of the Northern Protectorate
he insults this area as “entirely occupied by pagans of the most uncivilized class.”(Northern Nigeria
Lands Committee (1910) p.128)
This leaves different institutions as the main way for living standards to move apart. There
was an extreme divergence between governmental institutions in the two areas. In the Southern
Protectorate, there was almost no intervention in local affairs. “Aside from affording protection to
the European traders and suppressing some of the grosser forms of fetish worship, the administration
had pursued a hands-off policy.”(Cook (1943) p.194) Lugard himself saw one of the major benefits
of direct taxation as being institutional. He not only saw a direct incentive based effect: “direct
taxation is a moral benefit to the people by stimulating industry and production.”(Lugard (1919),
¶4) He also sees institutional advantages as “by no means the least benefit of direct taxation
. . . [is that it] promotes an intimate touch between the British Staff and the Natives” and “direct
taxation ensures the selection of the most capable and most influential men as the Chiefs and
Advisors.”(Lugard (1919), ¶10)
12
3.4 1914-1925
The period from 1914 to 1925 encompasses the post-amalgamation Governor Generalships of Lord
Lugard and Sir H.C. Clifford. Lugard planned and oversaw amalgamation in 1914 and Clifford
largely followed Lugard’s vision. The political regions were redrawn, with the old dividing line
now cutting through three newly created administrative regions. These were the Southeast Ilorin
district, the Benue district and the Adamawa district, all parts of the southeast region. The line
also passes nearby the northern tip of the new Onitsha district. At least initially, amalgamation
had little impact on this part of Nigeria. There was an increase in tariffs, but importantly direct
taxation continued to affect only the areas it had already been implemented in.(Geary (1927) pp.
262-3) Therefore, any differences in institutions caused by the different levels of taxes continued,
despite the official amalgamation of Nigeria. The other major political innovation in this period,
the partially elected legislative council, only drew from major cities and therefore had no districts
in or near the border region.
The court system, on the other hand, was more tightly regularized. A standardized system was
implemented across the entire colony, with four classes of native courts along with British courts
administered by colonial authorities. Every district had a class D court where almost all cases were
settled.(Bohannan (1968) p.8) One important consequence of the immediate standardization of
court systems for my purposes is that any difference between the two regions brought on by different
legal institutions must have been frozen into place by 1914 when the amalgamation occurred since
unlike the various tax systems the differences did not outlive partitioned Nigeria.
3.5 1925-1945
The post-Clifford period in Nigeria was one of convergence of the areas above and below the line,
even though on a larger scale significant regional difference persisted and even possibly increased.
Perceptions that different regions of Nigeria were very different intensified during this period.
This is largely due to the major urban centers of Lagos, Port Harcourt and Kano developing in
various unique ways. While these large cities are very important in Nigerian history and provided
most of the major actors in the later push for independence none of them are particularly close to or
13
involved with the border region I examine in this paper. Since education levels between the entire
regions of the north and the south diverged during this period it is important to consider whether a
difference developed in the area around the line. The answer is no for two major reasons. Prior to
the end of World War II there was almost no higher education (10-20 total Nigerian college graduates
per year) (Coleman (1958) pp.123-4) so any difference would have to lie in literacy and secondary
schooling. Government schools were overwhelmingly concentrated in the largest few cities, so rural
schools were all missionary schools. The difference between densities of missionary schools, which
focused on teaching the 4 R’s, was driven by whether or not an area was predominantly muslim
(Coleman (1958) pp.132-140) and its distance from population centers. Both sides of the divide
were primarily animist and the area of interest is only a thin band for which neither the areas above
or below the line were appreciably nearer to any population centers.
In the region of interest, initial steps were taken towards the harmonization of the tax systems.
“In 1926, after long discussions, it was decided that those people who did not pay taxes, mainly
in the Eastern Region and part of the West, should be forced to pay tax in the form of a poll
tax.”(Coleman (1958) p.252) The decision to implement this tax led to huge riots in Eastern
Nigeria when the British tried to take a census of women which led the British to try to figure out
how to implement indirect rule in the region in the 1930’s and to slowly install their preferred local
chiefs.
Therefore, the difference between the areas above and below the line that can lead to divergence
in outcomes is the strong divergence in institutions in the 30-40 years of very different tax systems
from 1900 to the 1930’s. Divergence after this is very unlikely as it would require a change correlated
across a long east-west distance, but not along a much shorter north-south distance.
3.6 1945-1960
The period between the end of World War II and independence was highly eventful for Nigeria, but
did not lead to non-institutional divergence between the areas directly above and below the line.
The most important trend during this time period was the independence movement. The National
Council of Nigeria and the Cameroons (NCNC) was active in this area as it was closer to the Igbo
14
population to its south than the Hausa populations in the north. Importantly, there was not a
division, with those above the line working with one independence movement and those below the
line working with a different one.
It is also worth noting that while small oil deposits were discovered in the years leading up to
independence they were mostly in the north, not in the area around the line. It wasn’t until after
independence that the off-shore deposits which made Nigeria a major oil producer were discovered.
Petroleum therefore did not play a significant role in this period. (Irukwu (1983) pp. 251-255)
3.7 Post Independence
Histories written about the period after independence make it suddenly much more difficult to tell
anything about what is happening across this line. There are several reasons for this. One is that
the states are redrawn at independence and then again several times afterwards. Most comparisons
are state-to-state as opposed to at the level of detail I need to be able to pull out the parts of
the states I am interested in. Secondly, the coups, civil war, ethnic conflicts, macro-level colonial
legacies and oil seem to be more interesting to most historians than the minutiae of old colonial
borders.
Nigeria has devolved power and created additional regions and levels of government since in-
dependence. There were three regions at independence which became 12 states in 1967 and 21
by 1987. In the 1970’s and 1980’s local government areas (LGAs) which function on the level of
counties in the United States were given increasing powers and responsibility. Today there are 774
LGAs in Nigeria. They are the level of local administration I examine in the rest of this paper.
3.8 Today
There are fragments of evidence suggesting that local government is still worse below the line
than above it. Finding this evidence can however be difficult for several reasons. First of all, the
middle belt has not been studied in the literature likely because it lacks the oil and secessionist
movements of the southeast. It further lacks the dramatic contrast that can be drawn between the
overwhelmingly Muslim north (in the present sense of Northern Nigeria) and the heavily Christian
15
southwest which have battled for control of the country. Finally, since the old dividing line passes
through current state boundaries the differences across it are not obvious when casually looking at
state level data.
[FIGURE 2 ABOUT HERE]
In the book Local Institutions and National Development in Nigeria (Olowu et al. (1991)) the
authors use Benue state as a case study. Benue is sliced in half by the colonial line. The authors
use Ankpa, a district above the line as an example of successful local government, while they use
Kwande, which is below the line as an example of “not-so-successful” local government. The authors
attribute the difference to “the performance of officials in various local governmental councils”
The difference in tax collection ability was indirectly observed in a study of the finances of local
governments in 1982.(Omopariola (1995)) This study looked at tax collection in various LGAs
in Benue state. While he does not note this conclusion in his article, Omopariola presents data
showing much greater revenue collection in the northern LGAs than in the southern LGAs.
In 2002 a State Reform Team carried out an assessment of local government areas in Benue
state. (Dada et al. (2002)) One of the metrics they use for quality of government is the amount
of money which went to projects as opposed to personnel. They did report the percentage of each
LGA’s budget that went to personnel. In the eight LGAs below the line the average was 51% and
the lowest was 44%. In the seven LGAs above the line the average was 43% and there were three
which spent less than 20% on personnel.
4 Data and Methodology
I use three different types of data in this paper, each of which requires different methods to estimate
the effects of institutions. I describe each of these in detail in this section.
4.1 Data
I begin with data from Afrobarometer. Afrobarometer takes standardized opinion surveys across
Africa. I use the 2005 Nigeria survey (round 1.5) since it is the only Afrobarometer Nigeria survey
to record the Local Government Area (LGA) of each respondent, permitting within-state com-
16
parisons. Afrobarometer asks several questions about perceptions of government quality allowing
me to examine whether residents of LGAs directly above of the dividing line actually have better
perceptions of their government than residents of the LGAs directly below the dividing line.
Afrobarometer also asks several other questions which allow me to rule out other possible effects.
First of all, because Afrobarometer asks about local, state and national government approval I can
separate different levels of approval of government in general from different levels of local government
approval. Afrobarometer asks further questions about employment and perceptions of the economic
situation. This lets me examine whether any differences in government approval across the line are
being driven by differences in employment or beliefs about the state of the economy. Because the
majority of people in this area are not working in the formal economy they do not even ask about
incomes.
I briefly use data from a local government reform study of Benue state. The study reports on
various measures of spending in each LGA of Benue state. I directly read the data off of the tables
in the report.
The rest of the data in this paper comes from the Demographic and Health Surveys (DHS).
DHS has a program, MEASURE DHS which is affiliated with the USAID MEASURE programs
for gathering improved global health information with a focus on AIDS data. All the DHS data in
this paper comes from the 1990 DHS-II survey of Nigeria because that is the only Nigeria survey
which has complete GPS data available.
There are several appealing features of the DHS data. First of all, DHS records Global Posi-
tioning System (GPS) coordinates of each cluster of surveyed households, allowing their locations
to be plotted on a map and thus allows the data to be examined at levels not corresponding to
current political boundaries. This is important because the old colonial dividing line does not form
any type of modern boundary. Next, they survey tens of thousands of households which leaves
significant sample sizes after I restrict the area of interest to that near the dividing line. Finally,
the surveys are long enough to provide a wide range of covariates.
There are several reasons why health data is especially useful in judging the performance of
institutions. Preferences over health are relatively consistent between people - everyone would
17
prefer to be more healthy than less. This means a measure of health is superior to measuring
consumption of any particular good where there might be significant heterogeneity in preferences
among individuals. For federally-funded locally-administered health interventions, there will be
differences in provision but not in charges or taxes between jurisdictions. Finally, health data is
useful since there is a large amount of variation in health outcomes between individuals making
it possible to pick up differences and health variables are relative easy to code in consistent and
meaningful ways, reducing measurement error.
The specific measure I focus on is vaccination levels. This is because vaccinations allow me to
measure local government competence in a way that other basic services or individual indicators
would not because of the unique way vaccinations are provided. While national governments and aid
groups often do the macro-level coordination of vaccination campaigns, the actual vaccinations are
only delivered in coordination with the local infrastructure. Vaccinations are very observably either
provided or not, as opposed to other (quite possibly more important) local government services such
as primary education where there is often a tradeoff between quality (which is difficult to measure)
and quantity (which is easy to measure). I use mothers’ self-reports of their children’s vaccination
statuses, and in a robustness check restrict children considered vaccinated to be only those whose
mothers show documentation to the DHS interviewer.
If different policies in colonial rule resulted in different levels of local governmental institutions
and infrastructure it should be possible to measure these differences when each area is asked to do
exactly the same thing. This leads to a natural test of the hypothesis that the areas which were
initially taxed have better functioning institutions today than areas which were initially not taxed.
It is important to note that population density and urbanization can be significant confounding
variables here, but the line seems to have rarely cut right next to a large urban area.3
3This is very different from other services such as primary education or electricity. Education is provided by a largenumber of local employees who are paid for locally. This means that large numbers of teachers could be indicatorseither of effective provision of schooling or of teaching positions being doled out to supporters. Since schools are paidfor at the LGA level it is also possible that some LGAs are in low tax-low service equilibria while others are in hightax-high service equilibria. In that case different levels of provision of education would not be evidence of differentlevels of local government quality but rather of different local preferences. Electricity, on the other hand, is almostentirely provided without the involvement of the local government. In fact, since theft of electricity through illegalhookups to power lines is so rampant, areas with less competent or more corrupt police could actually have higherlevels of theft and therefore of houses with electricity.(Smith, 2004)
18
Vaccinations are a service that have traditionally been delivered at the local level. In the liter-
ature on public health local governments are considered to be very important. Soerojo and Wilson
(2001) look at the importance of center-local coordination in the provision of immunizations. Other
research has shown that local governments provide an especially important role in linguistically di-
verse countries in producing informational materials or simply coordinating participation in the
immunization program. Interestingly, in the presence of decentralization overall declines in immu-
nization rates are often observed as funds which are transferred to the local level for primary health
are diverted.(Khaleghian, 2003)
4.2 Methodology
Because I am working with three different types of data it is necessary to use three different types
of estimation. In each case the aim is to understand the effect of living above the 7◦10′ line. For
the public opinion data I estimate how much approval rates increase, for the local spending data I
estimate how likely it us that the percentages of local budgets spent on salaries is uncorrelated with
whether or not a local government is above or below the line, and for the vaccinations I estimate
how much more likely to be vaccinated a child is. Each of these is of course a different proxy
for the quality of local government. Therefore, while they cause me to measure local government
quality with error, the should not cause any bias or inconsistency in my estimation since the error
is occurring in my measurement of the dependent variable.
I begin by looking at public opinion data for government approval. I look only at Benue state
which straddles the dividing line and in some robustness checks at Kogi which is mostly, but not
entirely, above the line. The question was asked on a four point scale so I use a standard ordered
probit estimator. This is preferable to a simple regression both because the dependent variable is
a discrete ordinal variable. (The difference between one and two and the difference between two
three or three and four might not be the same.) All categorical variables (e.g. religion) are broken
into a complete set of dummies. In order to facilitate easy interpretation I report marginal effects
for an individual who has all control variables set to their medians (which for binary variables is
also their mode). I find substantively similar results for other choices for representative individuals.
19
OLS regressions (linear probability models) of the same specifications are substantively identical
and are available upon request.
When I compare payroll spending in northern and southern LGAs in Benue I have a small
number of datapoints with a few outliers. In this situation I use a Wilcoxon ranksum test instead
of a simple comparison of means. This limits the leverage of outliers and requires me to make fewer
parametric assumptions than an equality of means test would require.
I employ matching techniques to estimate the effects of living above the dividing line on propen-
sity to be vaccinated. This has the advantage of requiring me to make much weaker assumptions
about the the functional form through which institutions affect vaccination propensities than a pro-
bit or logit would. I rely on exact matching on all categorical characteristics and nearest neighbor for
continuous characteristics such as mother’s age in all of the matching specifications I use. There is
no significant difference when using exact matching on all variables, though the sample sizes shrink
slightly. I use a single nearest match (based on physical distance) for each child. Matches can be
used many times (they are returned to the pool). I am never comparing the distance between two
different types of variables, however, and can avoid the theoretical assumptions necessary in cases
where that is done. (I.e. I never have to compare whether two people of different religions and the
same floor material are more or less similar than two people with the same religion and different
floor materials.) The fact that my dependent variable is binary does not affect the consistency of
the estimates of the marginal effects, but it does absolutely require that I compute bootstrapped
standard errors to avoid significantly underestimating the variances. 4 I limit myself to individuals
within 1◦ of the line and in robustness checks shrink the radius around the line to as little as 0.2◦.
The sample is restricted to a small radius around the dividing line. I usually use a radius of
1◦ but results for different choices of radii are also presented. There is an obvious tradeoff when
choosing the radius to use. Larger radii admit more data points and therefore give a more precise
estimate. However, the wider the radius used the farther geographically apart the average matched4As a robustness check, I impose the much stronger parametric assumptions necessary to estimate a logit model.
This requires me to assume a specific functional form but produces more precise estimates as a result. An additionalreason to impose this robustness check is that it allows my results to be directly comparable to previous work onvaccinations which usually rely on logistic regressions. Third, it demonstrates that my results are not being drivenby a hidden assumption in the setup of the main matching estimator. These have substantively identical results tothe matching estimator and are available upon request.
20
pair is, leading to a higher probability that other unobserved effects are contaminating the natural
experiment. Figure 2 Panel 1 shades the parts of Nigeria I do not examine, leaving only the region
around the line unshaded.
5 Results
In this section I show that governance today is significantly better in the areas just above the 7◦10′
line than in the areas just below it. I start by presenting public opinion data from both sides of
the line which shows that local residents think the governments above the line are better. Then
I examine the household level data to show that the governments above the line are observably
more competent than those below it. Finally, I show that this discontinuity represents a true
discontinuity in the data by examining what happens when I move the dividing line.
Local residents just above the dividing line believe their local governments are significantly
better than residents just below the line. The 2005 Afrobarometer surveys ask about approval of
local, state and national government on a four point scale. Moving just north of the line increases
average approval by approximately a point on that four point scale. The first column of Table 1
shows that this is the case whether only looking at Local Government Areas (LGAs) wholly above
or below the line in Benue State (Panel 1), if we add in the LGAs which straddle the line (panel 2),
assign the states which straddle the line to either above or below (panel 3) or bring in Kogi state
as well as Benue State (Benue and Kogi states are the only two states to largely straddle the line,
and only Benue state has individuals in the Afrobarometer survey from LGAs both entirely above
and entirely below the dividing line.) A graphical representation of this information is presented
in Figure 3. The first graph of Panel 1 of Figure 3 corresponds to the most conservative sample
(Table 1, panel 1) and the second graph represents the most expansive sample (Table 1, panel 4).
[FIGURE 3 ABOUT HERE]
If residents above the line were just happier with government than residents below the line then
it wouldn’t be clear that local government in particular was better. Columns two through four
of Table 1 look at approval of state government, the president and the federal parliament. The
effect on approval of living above the line is insignificant for all of these bodies in all four samples.
21
Another possibility would be that economic conditions are significantly better above the lines and
local residents attribute that to better local governance. However, column five shows that local
residents above the line are no happier with the economic conditions than residents below the line.
This strongly implies that it is local government in particular which is better above the line.
TABLE 1 ABOUT HERE
We can confirm the difference in government quality which local residents perceive by looking
at actual local government actions. One easily observable action is how LGAs spend their money.
As discussed before, a preponderance of spending on salaries (as opposed to infrastructure and
maintenance) is often considered to be an indicator of less competent government. A comparison
of means shows us that LGAs in the area directly below the line spend 10 percentage points more of
their budgets on salaries. A t-test of this difference in means across the two regions rejects equality
at the 90% confidence level.5
Now that we have seen that local governments just above the line are more liked and appear to
be more efficiently run the next step is to see that they are better at doing their job of delivering
better local public goods to their citizens. I use vaccinations as a household-level indicator of local
government quality for the reasons explained earlier: the local government coordinates but does
not fund them, which means that any difference in vaccination propensities are almost certainly
not driven by different sized budgets. I begin with group means and continue on to use matching.
It is important to remember that matching estimators are simply extensions of the concept of
comparisons of group means so if the line at 7◦10′ truly provides truly exogenous variation then a
comparison of group means with no controls will also provide consistent estimates of the treatment
effect, and should the comparisons of means be significantly different from the matching estimates
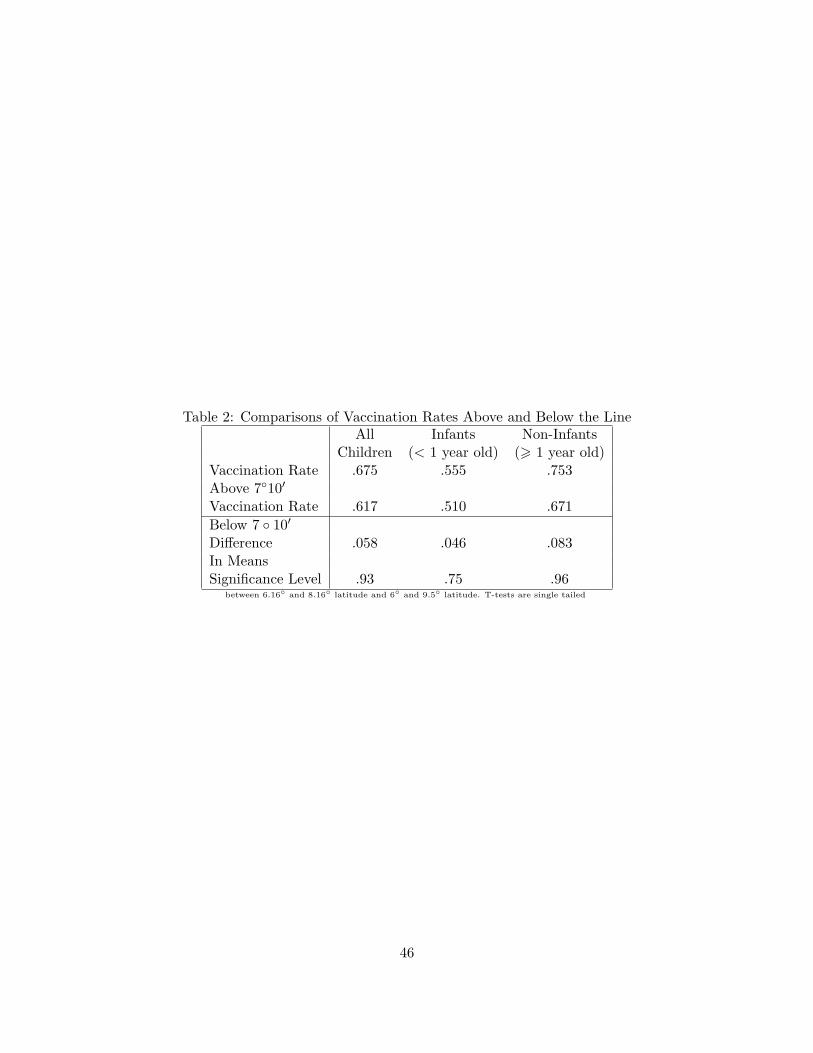
it is a sign that the division is not actually exogenous. Table 2 provides this basic information on
polio vaccinations. Column one shows that those just above the line are approximately 5 percentage
points more likely to be vaccinated than southerners. This difference, however, is only barely
statistically significant. The next two columns suggest one reason why and suggest that matching5This result is robust to making slightly different assumptions about the distributions. Both a Kruskal-Wallis
equality-of-populations rank test and a Wilcoxon test reject the two samples being the same. Similarly a Fligner-Policello robust rank test rejects the two populations coming from the same distribution.
22
is a good way to continue. We can see from column two that there is a smaller effect, both in
magnitude and significance, on the youngest children (less than a year old) than on the average
child. This should not be unexpected since if the immunization services are offered intermittently
an older child has a higher chance of having been old enough to be vaccinated when a government
vaccination truck came around. Column three shows that about 8% more older children (older than
12 months) above the line were vaccinated than similarly aged children below the line, confirming
that among those children who are old enough to have definitely been around for a vaccination
campaign, living above the dividing line is a strong predictor of whether or not they have been
vaccinated.
TABLE 2 ABOUT HERE
We can, however, get more precise measures of the effect of living above the dividing line by
matching on observable characteristics of mothers. In Table 3 I show that there is a significant
difference in their propensities to vaccinate their child above and below the line. Each column
in this table presents the average treatment effect (marginal propensity to be vaccinated) on the
treated (those living above the line). The other variables accounted for (matched on) are indicated
below the results. The first column considers only the age of the child and no aspects of the mother.
I find that living just below the line leads to a 10.7 percentage point reduction in the probability
that her child will be vaccinated for polio. In the second column I also match on birth order effects
and show that the magnitude of the effect of living above the line increases and retains significance
in both specifications. Columns three and four add consideration of mother specific factors, adding
first her age (in five year intervals) and then her level of education. The marginal effect increases
again, to 18.4 percentage points. In columns five and six I add the household specific attributes
of wealth and religion. Wealth is controlled for using a combination of house roof material and
whether or not the house has access to electricity. Adding these reduces the estimated effect back
to 10 percentage points (almost exactly the same substantive effect as in column 1). The final
column also controls for the state. This allows me to separate out state level effects that might
be confounding my results from local effects. The estimate remains significant, implying that not
only is the difference in vaccination rates real, it is being driven by local government as opposed to
23
state government effectiveness.
TABLE 3 ABOUT HERE
While the religious opposition to polio vaccinations were significantly north of the area I am
examining it is important to make sure that this isn’t somehow driving the results by looking at
measles vaccinations, which no one has raised similar opposition to. I confirm that this in not
simply an artifact of the polio vaccinations in Table 4. It has the same layout and follows the same
progression as Table 3. The effect of living just above the line on the probability of vaccination
against measles is much lower than in the effect on the probability of vaccination against polio. This
is largely because the overall measles vaccination rate is higher than the polio vaccination rate, likely
largely driven by the fact that the polio vaccine is significantly more fragile than the measles vaccine.
The effect of living below the line on vaccination probability increases from about three percentage
points in the specification which only matches on child age up to almost six percentage points in
the most expansive specification. The results are highly statistically significant throughout.
TABLE 4 ABOUT HERE
It is important to confirm that the results are actually driven by different levels of vaccination
and not by different willingness by the unvaccinated to falsely claim to have been vaccinated.
In Table 5 I show that the latter is not the case. Recall that in the rest of the paper I count
as vaccinated any child whom the mother claims is vaccinated, whether or not she can produce
the vaccination records. In this table, I only count as vaccinated children whose mothers were
able to produce properly filled out vaccination cards for their child, giving the date and place of
the vaccination along with an appropriate signature from the vaccine deliverer. The table shows
that with various sets of covariates the results are unchanged in sign, though they do change in
magnitude. The first column shows results for measles vaccination accounting only for child age.
The second column also accounts for birth order and mother’s age. The third column accounts for
these plus mother’s education, household wealth, religion and state of residence. The last three
columns of Table 5 follow the same pattern of covariates. The most expansive specification does
lose significance in this measure of vaccinations.
TABLE 5 ABOUT HERE
24
In the previous three tables I matched individuals in a one degree radius around the dividing line.
I prefer this distance as a good tradeoff between smaller radii, which further limit the amount of
unobserved heterogeneity and larger radii which permit me to work with larger samples. However,
it is useful to show that the results I find are not dependent on the exact radius I use. In Panel
1 of Table 6 I match on the same observable characteristics as the last column of Table 4. I
incrementally decrease the radius around the dividing line, losing observations but gaining tighter
control over the variance of unobservables. As the table demonstrates, the effect persists until the
radius is reduced to 0.2◦ where the sample becomes too small.
TABLE 6 ABOUT HERE
It is possible that there is some effect that consistently increases vaccinations as one moves north
in Nigeria. If this were the case, I would observe the same effect anywhere in the country an east-
west line were drawn. Figure 3, Panel 2 shows the effect of moving the matching line throughout
the country. As is immediately obvious, there is a large spike in the effect at the dividing line I
am looking at, with the effect being negligible in the rest of the country. This confirms that there
is a discontinuity in vaccination probabilities near the 1900 boundary. This discontinuity is in the
opposite direction of the general trend of vaccination rates decreasing as one moves north.
Another possibility is that instead of institutions, the difference in government effectiveness
is being driven by the direct taxation forcing an earlier monetization of the economy. If earlier
monetization is indeed driving the difference though economics rather than institutions it would
be by increasing economic specialization and working for wages. Table 1 shows us that there is no
difference in perceptions of the economic situation. In Table 6 Panel 2 we can see in the first two
columns that northern inhabitants of Benue state are no more likely to work for cash, nor do they
work more hours. The third column uses DHS data to look at the probability of working in the
money economy and also finds no effect.
We can also see that the discontinuity in preferences exists in nonparametric regressions above
and below the line. In Figure 4 we see that lowess and running mean regressions both show that
there is an apparent discontinuity at the dividing line. These also point out that this discontinuity
is in the opposite direction of the general trend. Were we to simply run a regression on the entire
25
country we would find that increasing latitude has in general a negative effect on vaccination rates.
It is worth noting that the regressions in Figure 4 are more valuable for demonstrating the existence
of an effect than for estimating the actual exact magnitude of the effect of moving across the line
since we are comparing boundary points.
[FIGURE 4 ABOUT HERE]
Therefore, in this section we have seen that people just above the old dividing line experience
better governance than those just below it. This difference is observable in public opinion approval
rates, estimates of how local governments spend their money, and in household level observations of
public service delivery. Further, it is clear that these are not being driven by different impressions of
the economic situation or different levels of participation in the cash economy. This effect persists
if the radius around the dividing line is narrowed. It disappears if the line is shifted either north
or south.
6 Alternative Explanations
In order to draw any conclusions from this natural experiment, it is important to establish three
things. First of all, there have to be observable differences in outcomes between the two sides of the
divide. The second is that any differences between individuals in the two regions can be explained
by institutional differences. The third is that another equally reasonable explanation for why there
are differences does not exist. The first of these points was demonstrated in the previous section.
I show the second in the persistence section. This section establishes the final of these important
points. After briefly discussing why the mobility of the populace doesn’t cause the differences to
be washed away I consider several other alternate explanations for the differences I observe.
We might expect these differences to disappear if political elites moved freely between villages
above and below the old dividing line. Since there are no formal barriers to their movement it
is important to understand the informal barriers which exist. These take two major forms both
drawing from the fact that the administrators were largely drawn from the preexisting elite. The
first is that they also own land which they are unlikely to want to give up in order to move and
which can be fairly difficult to sell. The other is the flip side of the first. Someone moving, even from
26
nearby, is unlikely to be considered to be part of the traditional elite to be trusted with positions
of responsibility. “According to Egonwman, [t]he role of the traditional rulers cannot be
overemphasized”(bold in original) (Egonwman and Ibodje (1999) p.21), and in general traditional
rulers do not move as they have no access to the traditional hierarchy outside their home village.
These two factors conspire to limit the mobility of elites more than the mobility of the poor.
The first obvious alternative mechanism for tax differences to matter would be if one area
used its greater revenues to invest in improvements in physical or human capital. As discussed
above, the local governments were not permitted to keep the revenues they collected. Further, they
were not permitted to collect extra revenue in the name of collecting these taxes,(Lugard (1919))
which would have lowered the relative cost of funding local government services in the Northern
Protectorate. Neither the government of the Northern Protectorate nor the government of the
Southern Protectorate saw the “pagan tribes” near the boundary as an area worthy of significant
investment. (The Northern Protectorate was concentrated on relations with and development in
the Hausa Emirates while the Southern Protectorate included the major cities of Lagos and Ibaden,
and Benin and the oil rivers.) Therefore investments in infrastructure in both areas were minimal,
with the exception of transport connecting the coast to the far north, which ran equally through
both regions. Even today there are neither stronger transportation networks built above the line
nor more intensive land use as shown in Figure 6.
[FIGURE 6 ABOUT HERE]
Another alternative mechanism would be through some sort of preexisting difference in wealth
or culture which has simply persisted through time. This is unlikely for several reasons. First
of all, as mentioned above this was a region mainly consisting of small independent village-level
chieftaincies as opposed to a larger organized state. As Figure 5 Panel 1 shows, the ethnic division
in the state is between the Idoma in the west and Tiv in the east, which is perpendicular to the
dividing line. This means that it is highly unlikely that a random straight line would catch a major
preexisting difference in culture or political organization. We can see from climate maps that there
do not appear to be major climactic differences between the two regions nor major differences in
crops grown. Finally, as shown in Figure 5 Panel 2 there is no river or mountain chain which follows
27
this line, again decreasing the probability that it is picking up a preexisting discontinuity in wealth.
[FIGURE 5 ABOUT HERE]
Figure 5 Panel 2 shows that the Benue river forms part of the Northern border of the state and
even cuts through the part of the state which extends north. There are several ways to confirm
that this is not a river effect. First of all, Figure 3 Panel B shows that moving the line a similar
distance north of the river does not create a significant effect in the opposite direction. Secondly,
Table 3 Panel 1 shows that the effect remains strong as the band around the dividing line is drawn
very tightly. Third, a major tributary to the Benue River runs north through the state. Table
7 Panel A shows that there are no significant differences in measles or polio immunization rates
between those close to the tributary and those at a similar longitude but farther away from the
river. Finally, the Benue river runs more southerly in the center of the state than at either the east
or west sides. Table 7 Panel B shows that the results are not being driven by the center of Benue
State.
[TABLE 7 ABOUT HERE]
A third possibility unique to the situation of Nigeria is that the differences today reflect legacies
of the Biafran war. (The Biafran was is also known as the Nigerian Civil War. It occurred from
1967-1970.) However, when looking at the areas of fighting in the war, the region which attempted
to secede is significantly south of the dividing line. The Biafrans did conduct raids into the rest of
Nigeria, but those raids were primarily to the west, as opposed to the north. It is possible that the
inability to transport goods though Biafra affected the area below the line more than the area above
the line. However, the period of civil war was short enough and their locations would otherwise
lend a slight advantage to areas just below the line, so it is unlikely that this is a major effect.
Similarly, it is important to consider the flow of refugees from the war. However, it appears that
again most of the refugees fled west into the Yoruba majority areas, not north into the middle belt.
For these reasons it seems unlikely that the Biafran war is driving differences within the middle
belt.
The next alternate reason that local governments just above the line may be more successful
than ones just below it because the need for British administrators to become involved in tax
28
collection gave them stronger ties to the people and therefore more decided to settle permanently
in the area just above the line than chose to settle just below it. A less extreme case would be if
the British brought educated Nigerians from other parts of the country in order to administer the
more complicated tax system who then settled there, again resulting in an importation of human
capital. There is no evidence that either of these events occurred. British settlement outside of the
major cities was almost nonexistent (and settlement in the cities was very rare in its own right)
and I can find no historical reference to bringing educated Nigerians from other parts of the colony
to take any part in the administration either directly above or below the line. Therefore it is not
plausible that settler densities are driving the differences.
Another possibility would be that the tax collection created stronger networks just above the
line. Either the simple fact that people were all paying taxes created more of a sense of togetherness
or the communication of tax collectors with the center fostered more communication of information
or even the fact that information was being collected and people were used to being visited by the
government created more participation in democracy. In Table 6 Panel 3 I show that none of these
are actually happening. Columns one and two show that people just above the line are not more
likely to discuss politics or to discuss politics with friends and neighbors or to attend community
meetings than the people directly below it. Column three shows that people just above the old line
are not more likely to listen to news than people directly below it.6
Finally, there are plausible pathways through taxation which do not involve institutions and
which must be addressed in the results section. They were discussed in the results section but bear
repeating here. One is that this is simply a border effect. Perhaps creating a frontier naturally
creates a difference at the border which is equally likely to matter in either direction. Another is
that taxes in the areas directly above the line could have forced earlier monetization of the local
economies there, leading to more specialization and therefore a more vibrant economy. The British
used a poll tax in South Africa to force indigenous peoples into a market economy, but the poll
tax they used was approximately 40 times as large as the poll tax in Nigeria. Both of these were
shown not to be occurring in the results section.6The other two sources of news, TV and newspaper, were both too concentrated around “never” to produce
meaningful results
29
We therefore see that there is a reasonable prima face case for tax institutions having a long-
term effect on bureaucratic outcomes in the middle belt of Nigeria. Further, it is not likely that
competing explanations based on investment, preexisting differences, the Biafran war, settlers,
border effects, or differential rates of monetization can explain any modern day differences.
7 Persistence
In order to observe effects today of institutional choices made a century ago the institutions must
have persisted over a long period of time. The previous section showed how British choices on
taxation caused the development of different levels of bureaucratic capacity on opposite sides of the
dividing line but did not illustrate how these differences survived to the post-independence period.
Here I postulate a theory of why these differences are so persistent.
Understanding the persistent capacity differences between local governments hinges upon a
few important facts. The large literature on Nigerian local government, especially Koehn (1990)
and Khemani (2004), has been invaluable to my understanding these. First of all, these local
governments have been almost entirely captured by their employees. The state has a very limited
ability to sanction poor bureaucrats and specifically it is very difficult to fire a bad local bureaucrat.
((Olowu and Wunsch, 2004) pp.119-123) Second, these entities (as the Nigerian government in
general) are rife with nepotism leading the local governments to behave like small family businesses.
One author even analyzes them as businesses. (Gusau (199-)) The third major fact is that, while in
theory the local governments are funded mostly by the center, transfers of funds from the center are
highly irregular and it is not uncommon for payments to be a year or more in arrears. (Khemani
(2004)) Finally, while the central and state governments in theory have the power to reassign local
employees to other local governments in practice they do not do so. ((Koehn, 1990) p.37)
This small set of facts led to incentives which create two very different equilibria which we can
observe. In the first, the local government does little except extract what few bribes it can which
given the relatively small amounts of wealth in deep rural Nigeria are relatively meagre (compared
to the large rents available to federal bureaucrats who have access to oil money.). There is no
incentive for hard work, as bureaucrats will neither be able to extract appreciably more rents (due
30
to the limited amount of money available in the local economy) nor will they be able to improve
government functioning on their own. (since efficient functioning requires the entire bureaucracy
working together) This also leads to a knock on effect on the human capital available to the
local governments as the families which control the local government have no reason to steer their
smartest children into local government service. This equilibrium is best explored by Egonwman.
(Egonwman and Ibodje (1999) chapter 1)
The second equilibrium is one in which significant services are actually delivered. Here, the local
government is capable of delivering local basic public services with a reasonable level of efficiency
and honesty. This grants sufficient legitimacy to the local government that they are able to collect
local taxes, which never go to the center. They can then pay themselves regularly despite the fact
that they are not regularly receiving the transfers they are due from the center. Here hard work
does make a difference. Should the local government cease to deliver local public goods it will revert
to the poor equilibrium described above. While there may be short term rents to extracted in this
transition (while local taxes are still being paid and rents are being extracted) the stable dynastic
aspect of these governments (i.e. the fact that the jobs and therefore the payoffs remain within a
family) mean that the long term discounted payoffs matter to the local bureaucrats. Furthermore,
even though it is difficult to fire a shirking employee, families can sanction internally, creating a
greater incentive for employees to behave well. It is in their interest to do so since they share in the
long term rewards of good governance. Finally, there is also a positive human capital effect on the
local governments as running a functioning local government requires human capital and therefore
families with access to the jobs will steer their more competent children into them.
The literature on local institutions in Nigeria provides evidence supporting these equilibria.
Most prominently, Egonwman writes about “the vicious cycle of poverty in Nigerian Local Govern-
ments” (Egonwman and Ibodje (1999) p.3) which focuses on the feedback between poor capacity,
poor local funding, and low quality personnel. The median Local Government Area (LGA) in Kogi
state was 6 months in arrears in local salaries in 2002 (Khemani (2004)). Aborisade focuses on how
low morale from the lack of salaries being regularly paid leads to the exodus from local government
of motivated staff. This exodus leaves only those who are “unconcerned for progress” at the local
31
level. (Aborisade (1995) p.16-17)
On the other hand, while Koehn often decries the poor quality of Nigerian local governments
he emphasizes that competent local governments are highly capable of participating in local devel-
opment work. (Koehn (1990) p.242) Olowu et al. explain that a common feature of successful local
governments is the ability to raise money though “long-standing local government instruments en-
abling them to collect property rates not . . . collected in several large urban communities” (Olowu
et al. (1991) p.21) Khemani (2004) studies local service delivery in Kogi.7 He finds that the fewer
the months that salaries are in arrears the lower the apparent level of corruption (e.g. public prop-
erty taken and resold privately) Another purer measure of effort is provided by his showing that,
controlling for several other covariates, each month without payment of salaries increases the odds
that local medical facilities are dirty by 2%. Since basic cleaning requires much less human capital
than other local government functions this implies that there is a direct effect of lack of payment
of salaries on lack of efficient effort put forth.
It should not be surprising to find that local governments operating as family businesses can be
effective in Nigeria. First of all, given the low quality of the official rules, it is important for people
in the local governments to be able to understand an follow unwritten rules, an advantage of family
businesses. (Vinton (2004) pp.297-298) Second, it is hard to officially discipline local government
employees, and family businesses are at an advantage when it is not viable to sanction employees
officially. (Dyer (2006) pp. 259-262) Finally, information about qualifications is scarce in Nigeria,
a situation where family firms are at an advantage since they know the ability levels of the family
members. (Kaufman (2007) pp. 81-82)
Finally, it is important to note that this institution of capacity does not pass through formal
rules or organizations. There is no formal difference between the good and poor local governments,
but the different norms, which are transmitted from generation to generation, lead to very different
outcomes. This is why it has persisted first through independence and then through the series
of coups and subsequent government reorganizations that Nigeria has suffered. Even though the
formal rules change, the personnel do not change, (Koehn (1990) p.252) causing capacity to persist7The Nigerian state directly west of Benue
32
across total reorganizations.
To sum up, honest norms among the local bureaucracy allows all the individual bureaucrats to
do their jobs, increasing respect for the government and therefore allowing the local government to
actually raise funds locally and pay their own salaries. On the other hand, a lack of honest norms
mean that no matter what an individual bureaucrat does local public goods won’t be delivered.
Thus there is no incentive to do anything other than be corrupt.
8 Conclusion
Even at the local level, basic bureaucratic institutions are both important and long lasting. I have
shown that in Nigeria a difference in institutions implemented before independence has caused a
range of local government qualities. The simple act of having to collect taxes caused governments
to be forced to build the capacity which can now provide basic government services. I was then able
to show that services are better provided above the dividing line than below it. I further showed
that local residents appear to be aware of this, rating their local governments significantly better
in the areas directly above the line than in the areas directly below it.
This has several interesting implications. First of all, it suggests that raising taxes in colonies
may not have been as bad as some theories have suggested. Rather, the act of raising certain taxes
might have aided future development, above and beyond the value of whatever the taxes were used
to fund. An interesting avenue for future work would be to examine whether different taxation
policies by the British and French account for part of the differences in observed development
outcomes of their former colonies.
Secondly, this provides micro-level evidence for the importance of institutions. Most previous
work on institutions has been cross-national or at best cross-state within a single country. In those
cases there is often a significant possible contamination by unobserved attributes of countries or
states which make identification questionable. The fact that the line dividing the two regions ceased
to officially matter nearly a century ago is a huge advantage in avoiding this contamination.
This also obliquely speaks to the concept of resource curses. In resource rich colonies and
countries the easiest way of raising revenue is by taxing that extractive industry. This was even
33
more so in colonial times. If that leads to worse government through the formation of inferior
institutions then this could help understand resource curses better.
Finally, this adds to our understanding of the difference between former colonies of different
colonial powers. My initial survey of formerly colonial west African and island countries finds
that the British were far more likely to impose small poll taxes than the French, which would be
consistent with the better outcomes British colonies in general have shown. A very interesting
project would look at when broad-based taxation was introduced by the various colonial powers,
and whether it is correlated with present day outcomes.
References
O. Aborisade. Abolition of the local government service commission (lgsc): Where do we go?
In A.M. Awotokun, editor, New Trends in Nigerian Local Government, pages 12–19. Obafemi
Owolowo Univeristy Press, Ile-Ife, Nigeria, 1995.
Daron Acemoglu, Simon Johnson, and Jim Robinson. The colonial origins of comparative develop-
ment: An empirical investigation. American Economic Review, 91:1369–1401, 2001.
A. E. Afigbo. The Warrent Chiefs: Indirect Rule in Southeastern Nigeria 1891-1929. Humanities
Press, Great Britain, 1972.
Kwaghkondo Agber. The Tiv Economy in the Colonial Era, pages 387–398. Lagos, Nigeria, 2002.
David Albouy. The colonial origins of comparative development: An investigation of the settler
mortality data. American Economic Review, 2006.
Abhijit Banerjee and Lakshmi Iyer. History, institutions and economic performance: The legacy of
colonial land tenure systems in india. 2004.
Paul Bohannan. Justice and Judgement among the Tiv. Oxford University Press, New York, second
edition edition, 1968.
34
Rudolf Braun. Taxation, Sociopolitical Structure, and State Building: Great Britain and
Brandenburg-Prussia, pages 243–327. Princeton University Press, Princeton, NJ, 1975.
Bruce Bueno de Mesquita, Alastair Smith, Randolph M. Siverson, and James D. Morrow. The
Logic of Political Survival. MIT Press, Cambridge, MA, 2003.
James S. Coleman. Nigeria: Background to Nationalism. University of California Press, Berkeley,
CA, third printing edition, 1958.
Arthur Cook. British Enterprise in Nigeria. University of Pennsylvania Press, Philadelphia, 1943.
Michael Crowder. Indirect rule: French and british style. Africa: Journal of the International
African Institute, 34(3):197–205, 1964.
Niyi Dada, Benedict Agada, and Mark Sheldrake. A preliminary assessment of local governments
in benue state, 2002.
W. Gibb Dyer. Examining the “family effect” on firm performance. Family Business Review, 19
(4):253–273, 2006.
J.A. Egonwman and S.W.E. Ibodje. Reinventing Local Government in Nigeria: From Hierarchy to
Participation. Resyin, Benin City, Nigeria, 1999.
James Feyrer and Bruce Sacerdote. Colonialism and modern income - islands as natural experi-
ments. SSRN eLibrary, 2006.
N. M. Geary. Nigeria Under British Rule. Frank Cass & Co., London, third edition with a new
introduction by mark kirk-greene edition, 1927.
Peter Geschiere. Chiefs and colonial rule in cameroon: Inventing chieftaincy, french and british
style. Africa: Journal of the International African Institute, 63(2):151–175, 1993.
Edward L. Glaeser, Rafael La Porta, Florencio Lopez de Silanes, and Andrei Shleifer. Do institutions
cause growth? Journal of Economic Growth, 9(3):271–303, 2004.
35
Bawa Hussein Gusau. Line and Staff Relations within Local Government, pages 32–37. Samkari &
Sons., Kano, Nigeria, 199-.
Robert E. Hall and Charles I. Jones. Why do some countries produce so much more output per
worker than others? The Quarterly Journal of Economics, 144(1):83–116, 1999.
J. R. Irukwu. Nigeria at the Crossroads: A Nation in Transition. Witherby & Co., London, 1983.
Roger Kaufman. Nepotism and the minimum wage. Journal of Labor Research, 4(1):81–89, 2007.
Peyvand Khaleghian. Decentralization and public services: The case of immunization. World Bank
Policy Research Working Paper 2989, 2003.
Stuti Khemani. Local government accountability for service delivery in nigeria. 2004. URL
between 6.16◦ and 8.16◦ latitude and 6◦ and 9.5◦ latitude. T-tests are single tailed
46
Tab
le3:
Eff
ect
ofli
vin
gso
uth
of7◦
10′
onp
rob
abil
ity
ofb
ein
gva
ccin
ated
for
Pol
ioM
atch
ing
-10.
7%**
*-1
2.0%
***
-14.
6%**
*-1
8.4%
***
-16.
7***
-10.
0%**
*-9
.32*
*E
stim
atio
n(3
.42)
(3.6
1)(2
.21)
(1.6
5)(1
.07)
(0.5
9)(4
.15)
Acc
ount
ing
For:
Chi
ldA
geX
XX
XX
XX
Bir
thO
rder
XX
XX
XX
Mot
her
Age
XX
XX
XM
othe
rE
duca
tion
XX
XX
Wea
lth
XX
XR
elig
ion
XX
Stat
eX
Sta
ndard
Err
ors
inP
are
nth
ese
s.O
nly
house
hold
slivin
gb
etw
een
6◦10′
and
8◦10′
inclu
ded.
47
Tab
le4:
Eff
ect
ofli
vin
gso
uth
of7◦
10′
onp
rob
abil
ity
ofb
ein
gva
ccin
ated
for
Mea
sles
Mat
chin
g-2
.89%
***
-3.6
9%**
*-4
.70%
***
-5.4
9%**
*-3
.22%
***
1.01
%**
*-5
.68*
*E
stim
atio
n(0
.991
)(0
.645
)(0
.481
)(0
.261
)(0
.59)
(0.1
13)
(0.1
87)
Acc
ount
ing
For:
Chi
ldA
geX
XX
XX
XX
Bir
thO
rder
XX
XX
XX
Mot
her
Age
XX
XX
XM
othe
rE
duca
tion
XX
XX
Wea
lth
XX
XR
elig
ion
XX
Stat
eX
Sta
ndard
Err
ors
inP
are
nth
ese
s.O
nly
house
hold
slivin
gb
etw
een
6◦10′
and
8◦10′
inclu
ded.
48
Tab
le5:
Eff
ect
ofli
vin
gso
uth
of7◦
10′
onp
rob
abil
ity
ofb
ein
gva
ccin
ated
,n
arro
wd
efin
itio
nM
easl
esP
olio
Mat
chin
g-2
.17%
***
-3.0
7%**
*-3
.30%
***
-2.1
2**
-2.7
0***
0E
stim
atio
n(0
.970
)(0
.664
)(0
.109
)(0
.261
)(0
.558
)(0
.069
9)
Acc
ount
ing
For:
Chi
ldA
geX
XX
XX
XB
irth
Ord
erX
XX
XM
othe
rA
geX
XX
XM
othe
rE
duca
tion
XX
Wea
lth
XX
Rel
igio
nX
XSta
ndard
Err
ors
inP
are
nth
ese
s.O
nly
house
hold
slivin
gb
etw
een
6◦10′
and
8◦10′
inclu
ded.
49
Tab
le6:
Rob
ustn
ess
Che
cks
Pan
el1:
Rob
ust
nes
sto
diff
eren
tra
dii
1◦0.
9◦0.
8◦0.
7◦0.
6◦0.
5◦0.
4◦0.
3◦0.
2◦
ME
-6.8
**-8
.1**
*-9
.6**
*-1
1.6*
**-1
2.7*
**-9
.3**
-18.
1***
-8.3
**0.
0SE
2.6
2.8
3.3
4.1
4.3
4.1
4.1
3.1
5.8
Pan
el2:
Cas
hE
conom
yP
arti
cipat
ion
AB
Wor
kfo
rP
ayA
BH
ours
DH
SW
ork
for
Pay
Mar
ginal
Eff
ect
0.25
0.25
-0.1
1SE
0.17
0.57
0.73
Pan
el3:
Oth
erC
ivic
Enga
gem
ent
Fri
ends
Nei
ghb
ors
New
sM
argi
nal
Eff
ect
0.08
-0.2
0-0
.11
SE
0.19
0.71
0.23
50
Table 7: Benue River Effect
Panel A: Middle to Sides: Measles Vaccination RatesRiver River River RiverCloser Farther River River
Marginal Effect -22.8 % ** -28.3 % *** -41.2 % *** -23.8 % ***SE (9.26) (10.0) (5.80) (7.72)Child Age X X X XMother Age X X X XDistance X X X XReligion X XN 116 76 38 42
Panel B: Southern Fork: Measles Vaccination RatesMarginal Effect -0.398 % 2.24%SE (6.57) (4.63)Child Age X XMother Age X XDistance XReligion XN 252 164