1 Thread Count Automation Project Co-directors C. Richard Johnson, Jr. (Cornell University) Don H. Johnson (Rice University) ANNUAL REPORT :: 2009 The Thread Count Automation Project (TCAP), initiated in 2007, is dedicated to creating and disseminating computer-assisted, signal-processing-based tools that support conservators and art historians in their examination and analysis of fine art, in particular paintings on canvas.
Transcript
1
Thread
Count
Automation
Project
Co-directors
C. Richard Johnson, Jr. (Cornell University)Don H. Johnson (Rice University)
ANNUAL REPORT :: 2009
The Thread Count Automation Project (TCAP), initiated in 2007,is dedicated to creating and disseminating
computer-assisted, signal-processing-based toolsthat support conservators and art historiansin their examination and analysis of fine art,
in particular paintings on canvas.
Johnson and Johnson/TCAP Annual Report :: 2009 2
1 Background
Given over twenty years of technical advances in multispectral imaging of paintings, theaccelerating digitization of these images in museum archives, and a growing emphasis onan archaeology of the object in art historical studies, the time is ripe for the developmentof digital signal processing tools in support of painting analysis from digitized images. Inattempting to enter a nascent, cross-disciplinary field, our strategy was to seek problemsthe fundamental technical solutions for which are rather ordinary from a traditional basicresearch perspective. Such problems are typically bypassed by researchers seeking fundingfrom the usual sources focused more on advances to technology and science than to theapplication. Thus, to help close this gap, we seek to develop compelling applications of basicsignal processing to painting analysis as a method of accelerating the development of cross-disciplinary scholarly activity that will ultimately expose more fundamentally challengingtasks of high utility and bring major improvements to the practice of painting analysis andconservation.
For this plan, a target application should(a) use data now at museums [thereby not requiring a new imaging device or a disruptive
imaging campaign];(b) be a widely performed, tedious task [where just stuffing the task onto the computer
offers significant labor savings and documentation capabilities]; and(c) have a basic solution apparent to an undergraduate engineer [so algorithm creation is
a more likely-to-succeed development task than risky basic research] that can be explainedto and operated by art historians.
The target application chosen by Professor Rick Johnson in 2007 was thread countingof canvas density from x-rays of paintings. At that time there were no automatic schemesor software tools for this application. Furthermore, among art historians, there was nota widely accepted, precise methodology regarding the procedure of data collection or theformat of its archival recording. But, it is a skill for which (almost) all conservators ofpaintings have been trained.
Thread counting has a history of use for dating and attribution in studies of the paintingsof the Dutch masters Rembrandt van Rijn (van de Wetering, Rembrandt: The Painter atWork, 1997) and Vincent van Gogh (Lister, Peres, and Fielding, “Tracing an Interaction:Supporting Evidence, Experimental Grounds” in Van Gogh and Gaugin: The Studio ofthe South, Druick and Zegers with Salvesen, 2001). In these studies, the average of countsof local density at various spots across the canvas of one painting is compared to thesimilar average for the canvas support of a separate painting as key evidence in claimingthe two canvases are (or are not) from the same canvas roll. Such original proximity, whenconsistent with other evidence, can be used in conjunction with knowledge of the artist’sstudio practice to support precise claims regarding relative dating of the paintings.
These thread counts have traditionally been taken manually on (analog) x-rays withthe aid of a magnifying eyepiece. X-rays are used because the original canvas can typicallyno longer be seen from the front or the back. The front is covered with paint. Theback is usually covered with a newer supporting canvas glued to the back of the old one.Fortunately, from the 16th century on through the early twentieth century, canvas wastypically prepared for painting by first applying a ground layer that commonly includedradio-opaque material. This ground layer is thicker in the grooves between the individualthreads. An x-ray will reveal these filled grooves as they pass less x-ray energy that exposes
Johnson and Johnson/TCAP Annual Report :: 2009 3
the x-ray film. The developed x-ray film is posted on a lightbox and a magnifying aid isused to enlarge a view where the variation in threads is illustrated with a periodic shiftfrom dark to light and back. The variations are counted against a ruler inserted intothe magnified view, and recorded in threads/centimeter. For a simple weave, the count(in threads/cm) of the (nearly) vertically oriented threads and the count of the (nearly)horizontal threads are recorded for each spot.
The tedium and time consumption of traditional “manual” thread counting are suffi-ciently substantial that most studies rely on averages from a relatively small number (lessthan a few dozen) of spot counts across the painting canvas. This makes this task ripe forthe time-saving and documentation benefits of performing the “manual” count on the en-larged digital image on the computer screen. Then, once the image data is in the computer,the algorithmic tricks of signal processing can be applied to perform the thread countingautomatically.
2 Exploiting Spectral Analysis
Indeed, extracting the frequency of a dominant periodic component in a signal measured inthe presence of various other additive components is an applied mathematics task criticalin a variety of engineering applications. The Fourier transform is a basic analytical tool forsuch frequency estimation tasks. In the summer of 2007, Professor Rick Johnson wrote asimple algorithm for computing thread density with a Fourier transform of intensity datafrom the scanned x-ray of a van Gogh painting.
This confirmation of concept was expanded into a competition among research teamsat various universities for the best algorithms to count threads automatically in excerptsfrom scanned x-rays. Winners (from Rice University, University of Wisconsin-Madison,and Worcester Polytechnic Institute) were selected in summer 2008. The selection wasmade against a set of over 900 spot counts from scanned x-rays of over 20 Van Goghpaintings. These spot counts were performed by a student team at Cornell Universitysupervised by Professor Rick Johnson using a crude graphical user interface developed(in Matlab, for easy connection to the candidate counting algorithms) at Cornell. Thecount at each spot in the test set was confirmed by two independent hand-counters. Thebest algorithms (with over 95% of counts within 1 th/cm of verified hand count) werethen inserted in larger programs that can automatically count the average thread densityand determine the average thread angle in 1 cm squares across the entire painting. AsProfessor Don Johnson’s two-dimensional Fourier transform based scheme (described inJohnson, Johnson, Klein, Sethares, Lee, and Hendriks, “A Thread Counting Algorithm forArt Forensics,” Proc. 13th IEEE DSP Workshop, Marco Island, FL, Janaury 2009) wasthe winner among fully automatic schemes, he was persuaded to join TCAP as co-directorin 2009.
The data generated by such thorough coverage – with average thread counts deter-mined within every small square across the entire surface of a painting – can be turnedinto color-coded maps of the thread density as it varies across the painting. The pattern ofthese variations can be used to identify neighbors on the original canvas roll (as describedin Johnson, Hendriks, Noble, and Franken, “Advances in Computer-Assisted Canvas Ex-amination: Thread counting algorithm”, 37th Annual Meeting of American Institute forConservation of Historic and Artistic Works, Los Angeles, CA, May 2009).
Johnson and Johnson/TCAP Annual Report :: 2009 4
The resulting first-generation software has been compiled for free distribution (alongwith a free training seminar) to conservators at museums and students and staff at graduateconservation programs (in the United States, the Netherlands, and England). This novel,pioneering effort to develop image analysis algorithms suited to the specific task of threadcounting as part of an art historical examination of canvas supports of old masters paintingsis representative of a nascent interdisciplinary effort between the engineering and appliedmathematics of signal processing and art historical painting analysis described in Barni,Pelagotti, and Piva, “Image Processing for the Analysis and Conservation of Paintings:Opportunities and Challenges,” IEEE Signal Processing Magazine, vol. 22, pp. 141-144,September 2005.
3 Major Projects
In coordination with a studio practice project underway at the Van Gogh Museum(http://www3.vangoghmuseum.nl/vgm/index.jsp?page=13321&lang=en), TCAP, in col-laboration with Dr. Ella Hendriks (Head, Conservation Department, Van Gogh Museum),provided thread count reports during 2009 on all paintings by Vincent van Gogh in the col-lection of the Van Gogh Museum (a task beyond imagining with traditional manual counttechniques). These reports include maps of thread density and angle for the horizontal andvertical threads and histograms of the thread densities in both directions in 1 cm squares on0.5 cm centers across the painting surface. (A sample thread count report for “The SheepShearers” is attached as an appendix to this annual report.) This effort is being broadenedto include similar thread count reports for other Van Gogh paintings from cooperativemuseums (including, so far, Kroller-Muller Museum, National Gallery - London, ClevelandMuseum of Art, Phillips Collection, Art Institute of Chicago, Philadelphia Museum of Art,Museum of Modern Art, Harvard University (Fogg) Museum, Courtauld Institute Galleries,Stedelijk Museum, Detroit Institute of Arts, the Beyeler Institute, Musee d’Orsay, Museude Arte de Sao Paulo, Princeton University Art Museum, Norton Simon Museum, NeuePinakothek, E. G. Buhrle Collection, and Wadsworth Atheneum). TCAP has counted over200 van Gogh paintings in 2009, and has begun assembling a growing collection of sub-groups of rollmate candidates with “matching” patterns of varying local thread density.Identifying such sub-groups and interpreting their implications is expected to be a majoractivity for TCAP in 2010 and 2011.
All of this thread count data, and other data, such as ground materials assessment,critical to rollmate status evaluation, is to be archived by the end of 2010 in the studiopractice project of the Van Gogh Museum. Beginning in 2011, the museum study staff willcomplete and examine this collection of data with specific attention to rollmate possibilitiesand dating issues. Preliminary results indicate that the automatically-generated expansivethread count data will advance the investigations in a variety of issues in van Gogh studies.Indeed, some parts of the general understanding of either Vincent’s studio practice or theprocedures followed by canvas manufacturers will require re-thinking to achieve consistencywith the forensic data being generated.
In 2009, TCAP also initiated a similar effort for 17th century Dutch artists.In cooperation with Robert van Langh and Ige Verslype from the Rijksmuseum,Petria Noble at the Mauritshuis, and Michiel Franken of the Netherlands In-stitute for Art History (RKD), thread count reports were drafted for paintings
Johnson and Johnson/TCAP Annual Report :: 2009 5
by Rembrandt (connected to a pilot project funded by the Mellon Foundationhttp://mac.mellon.org/issues-in-conservation-documentation). The MetropolitanMuseum of Art in New York City has since provided scans of x-rays of some of their Rem-brandt paintings to this effort. The National Gallery of Art in Washington, DC is expectedto join this effort in 2010. The Rembrandt paintings studied have quite substantial non-uniformity in the thread thickness (apparent in the x-rays). This challenged the robustnessof our current algorithms. Two alternatives were pursued (and will be followed into 2010):(i) adding a pre-calculation triage component to our current scheme that removes exami-nation squares with unreliable data from being counted and (ii) upgrading our algorithmsto accommodate more weave non-uniformity.
Asked for a thread count report for “The Art of Painting” by Vermeer in the collectionof the Kunsthisrisches Museum in Vienna, we discovered that this 17th century canvasshowed weave and thread regularity similar to that observed in the 19th century canvasesused by van Gogh. Thus, at the close of 2009, TCAP established a project with the goalof counting threads for all Vermeer paintings on canvas. Initially, scans of the x-rays ofpaintings by Vermeer in the collections of the Kunsthistorisches Museum, the Rijksmuseum,the Mauritshuis, the Metropolitan Museum of Art, and the National Gallery of Art in DC(which covers over a third of Vermeer’s known oeuvre) are being sought before approachingfurther museums in 2010. The ultimate goal is to extend the study to Vermeer’s 17thcentury contemporaries that used the same regularly woven canvas supports as did Vermeer.
During 2009, TCAP prepared thread count reports for paintings on canvas by HenriMatisse to be included in a forthcoming exhibition jointly created by the Art Institute ofChicago and the Museum of Modern Art in New York City. TCAP continues to providethread count reports on a regular basis for Renoir and Monet paintings, for which an on-linecatalog is being created by the Art Institute of Chicago.
4 Limited Investigations
Museums and galleries that contacted TCAP with requests on specific paintings to whichTCAP responded with thread count reports in 2009 include:
• J. Paul Getty Museum (Los Angeles, CA): a painting by Guido Cagnacci
• Leiden Galleries (New York City): 2 paintings by Jan Lievens
• National Gallery of Art (Washington, DC): 4 paintings by Luis Melendez
• Germanisches Nationalmuseum (Nurnberg, Germany): a painting by(?) Jan vanThielen
• Munch Museet (Oslo, Norway): a painting by Edvard Munch
Johnson and Johnson/TCAP Annual Report :: 2009 6
5 Publications
Available at http://people.ece.cornell.edu/johnson/ and/orhttp://www.ece.rice.edu/∼dhj.
• D. H. Johnson, C. R. Johnson, Jr., A. G. Klein, W. A. Sethares, H. Lee, and E.Hendriks, “A Thread Counting Algorithm for Art Forensics,” Proc. 13th IEEE DSPWorkshop, Marco Island, FL, January 2009.
• C. R. Johnson, Jr., E. Hendriks, P. Noble, and M. Franken, “Advances in Computer-Assisted Canvas examination: Thread counting algorithms,” 37th Annual Meetingof American Institute for Conservation of Historic and Artistic Works, Los Angeles,CA, May 2009.
6 Presentations
In September 2009, the TCAP co-directors along with their primary conservation collab-orator Dr. Ella Hendriks (Van Gogh Museum) presented the first training workshop (atthe Courtauld institute in London) for their current package of semi-automatic and fullyautomatic thread counting software (compiled from Matlab for Windows) to an audienceof over 30. A forerunner was presented to University of Amsterdam conservation stu-dents and Rijksmuseum staff in March 2009 by Ella Hendriks, Petria Noble (Mauritshuis),Michiel Franken (RKD), and Rick Johnson that concluded with training in use of TCAP’ssemi-automatic thread counting software tool.
The TCAP co-directors gave a number of (unpublished) talks about TCAP efforts in2009, including:
• R. Johnson, “Computer-assisted Thread Counting from Scanned X-rays,” Museumof Modern Art, New York City, January 23, 2009.
• D. Johnson, R. Johnson, and E. Hendriks, “Computer Analysis of the CanvasWeaves of Vincent van Gogh’s Paintings,” EU-Artech Symposium: Van Gogh andContemporaries, Amsterdam, the Netherlands, May 15, 2009.
• R. Johnson, “Engineering Painting Image Analysis: Automated Thread Counting,”Art Conservation Department, Buffalo State SUNY, Buffalo, NY, April 10, 2009;Center for Interdisciplinary Science for Art, Architecture, and Archaeology, Universityof California, San Diego, CA May 18, 2009.
• R. Johnson, “Threads, Strokes and Other Numbers: Engineering Painting Analy-sis,” Department of Electrical and Computer Engineering, University of California,Santa Barbara, May 19, 2009.
• R. Johnson, E. Hendriks, and D. Johnson, “Automated Thread Counting, Match-ing Weave Maps, and Rollmate Candidates in the Paintings of Vincent van Gogh,”National Gallery of Art, Washington, DC, September 3, 2009; Center for AppliedMathematics, Cornell University, Ithaca, NY, Septemeber 25, 2009; ConservationCenter, Institute for Fine Arts, New York University, New York City, NY, October16, 2009.
Johnson and Johnson/TCAP Annual Report :: 2009 7
• E. Hendriks, R. Johnson, and D. Johnson, “Automated Thread Counting from X-Rays of Canvas Supports,” ICOM-CC Working Group Paintings, London, England,September 19, 2009.
• R. Johnson, E. Hendriks, and D. Johnson, “Counting Van Gogh,” Workshop onImage Analysis Tools for Cultural Heritage, Tilburg University, Tilburg, the Nether-lands, December 7, 2009.
• D. Johnson, “Signal Processing and Analyzing Works of Art,” School of Engineeringand Electronics, University of Edinburgh, December 17, 2009.
7 Personnel
Cornell University:
• Rick Johnson
• Selina Lok (spring ’09)
• Peter Kung (spring ’09)
• Ling-wei Lee (spring ’09)
• Linda Zhang (spring ’09)
• Michell Cho (spring ’09)
• Naoto Hamashima (fall ’09)
• Vikram Rao (fall ’09)
• Harold Yang (fall ’09)
Rice University:
• Don Johnson
• Lucia Sun
8 Principal Collaborators
• Ella Hendriks (Van Gogh Museum)
• Chris Stolwijk (Van Gogh Museum)
• Sjraar van Heugten (Van Gogh Museum)
• Louis van Tilborgh (Van Gogh Museum)
• Frans Stive (Van Gogh Museum)
Johnson and Johnson/TCAP Annual Report :: 2009 8
• Muriel Geldof (Instituut Collectie Nederland)
• Petria Noble (Koninklijk Kabinet van Schilderijen Mauritshuis)
• Michiel Franken (Rijksbureau voor Kunsthistorische Documentatie)
• Ige Verslype (Rijksmuseum)
• Robert van Langh (Rijksmuseum)
• Elke Oberthaler (Kunsthistorisches Museum)
• Charlotte Hale (Metropolitan Museum of Art)
• Sarah Fisher (National Gallery of Art - DC)
• Ann Hoenigswald (National Gallery of Art - DC)
• Jim Coddington (Museum of Modern Art)
• Kristin Lister (Art Institute of Chicago)
• Frank Zuccari (Art Institute of Chicago)
• Inge Fielder (Art Institute of Chicago)
• Kelly Keegan (Art Institute of Chicago)
• Johanna Salvant (Centre de recherche et de restauration des musees de France)
• Michel Menu (Centre de recherche et de restauration des musees de France)
• Meta Chavannes (Kroller-Muller Museum)
• Luuk van der Loeff (Kroller-Muller Museum)
9 Appendix
A sample thread count report (for “The Sheep Shearers” by Vincent van Gogh) is appendedto this document.
THREAD COUNT REPORT
The Sheep-Shearers (after Millet)
(F634 / JH1787 / S42)from the van Gogh Museum
Presented byVAN GOGH M USEUM, AMSTERDAM
in collaboration with theThread Count Automation Project of
CORNELL UNIVERSITY andRICE UNIVERSITY
Prepared by: R. Johnson, E. Hendriks, and D. JohnsonJune 2009
Thread Count Report F634
Summary
This report provides the canvas weave densities and local thread angle variations of “The Sheep-Shearers (after Millet)” (F634 / JH1787 / S42) by Vincent vanGogh held in the collection of thevan Gogh Museum. Automatic counts were made from high resolution digital scans of x-rays(600 dpi, 1:1 with painting surface; 8-bit greyscale). These x-rays, at sufficient enlargement,expose the canvas weave to be in the “plain” category. Software automates the process of de-termining, across the entire scanned x-ray, the thread count of the canvas weave pattern in twodirections (nearly vertical and nearly horizontal in the x-ray) and the angles of these threads refer-enced to true vertical and horizontal respectively. The thread-count processing software revealedthe minimum (min), maximum (max), average (avg) and standard deviation (σ ) of the threadcounts and angles for the horizontal and vertical threads for the entire painting to be
F634 min max avg σhorizontal thread density (th/cm) 13.8 22.0 18.0 1.2vertical thread density (th/cm) 10.8 12.0 11.4 0.2horizontal thread angle (degrees)-19.9 12.8 -1.5 1.2vertical thread angle (degrees) -12.7 1.8 -1.4 0.8
Using the criterion that the thread count having the smallest standard deviation corresponds towarp threads, calculations revealed that canvas warp corresponded to the vertical threads.
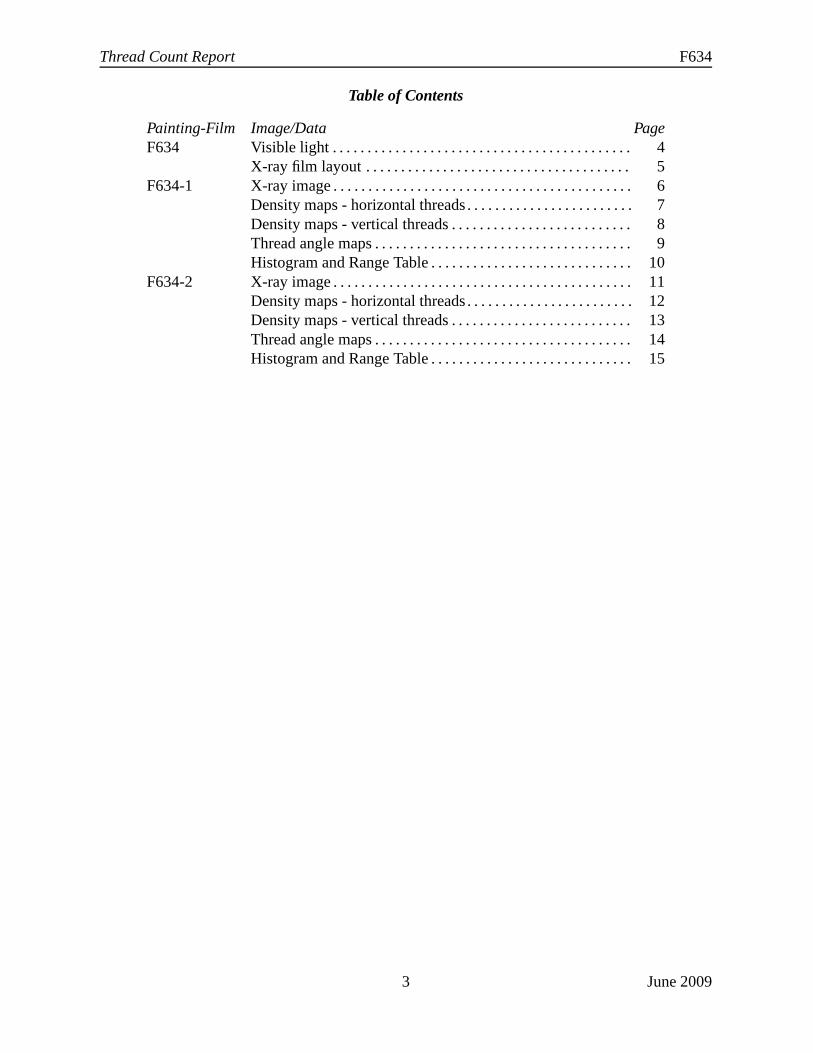
For each x-ray film covering the painting, this report provides a horizontal thread count map,a horizontal thread count deviation map, a vertical thread count map, a vertical thread count devi-ation map, a horizontal thread angle map, a vertical thread angle map, a histogram of horizontaland vertical thread counts and a table of minimum, maximum, average, and standard deviationof horizontal and vertical thread densities and angles. A table of contents occurs on page 3.
Acknowledgments: The thread counting software arose from a collaboration between the van Gogh Mu-seum (Amsterdam) and the Thread Count Automation Project initiated by Professor Rick Johnson in theSchool of Electrical and Computer Engineering at Cornell University. The calculations were performedby Professor Don Johnson (Rice University) using the technique described in Johnson et al., “A ThreadCounting Algorithm for Art Forensics,”Proc. 13th IEEE DSP Workshop, January 2009. The softwareused here has been in development since 2007 in a collaboration among researchers B. Sethares, R. Arora,and H. Lee at the University of Wisconsin, A. Klein at Worcester Polytechnic Institute, D. Johnson at RiceUniversity, and R. Johnson and J. Ng at Cornell University. Astudent team at Cornell (J. Ng, C. Che-ung, M. Cho, P. Kung, S. Lok, B. Stubler, M. Wu, L. Zhang) plus a“corresponding” student at WPI(I. Ozil) are responsible for testing numerous early versions of the software suite and performing the man-ual counts used to assess the candidate thread counting algorithms. For more information on the softwareused, contact Professor Rick Johnson [email protected] or Professor Don Johnson [email protected]. The x-rays provided for algorithm development were selected by Dr. Ella Hendriksof the Van Gogh Museum and digitized by Frans Stive of the Van Gogh Museum by scanning them into16-bit greyscale tiff files at high resolution (greater than300 dpi, typically 600 dpi).
1 June 2009
Thread Count Report F634
Introduction
This report provides a series of figures representing visualizations of various thread count andangle data for F634. TheVISIBLE LIGHT color image was downloaded in jpeg format fromthe publicly accessible websitehttp://www.vggallery.com/. All x-ray scans used inthis report were provided at 600 dpi. The scans were then cropped in Photoshop by ProfessorDon Johnson (Rice University) to exclude portions of the x-ray outside the canvas. When scansincluded a portion of the canvas’s front edge, it was used to align the corresponding edge of thecropped image, thereby enabling a consistent orientation of the cropped images with respect tothe painting. The software processed the x-rays individually according to the following protocol.
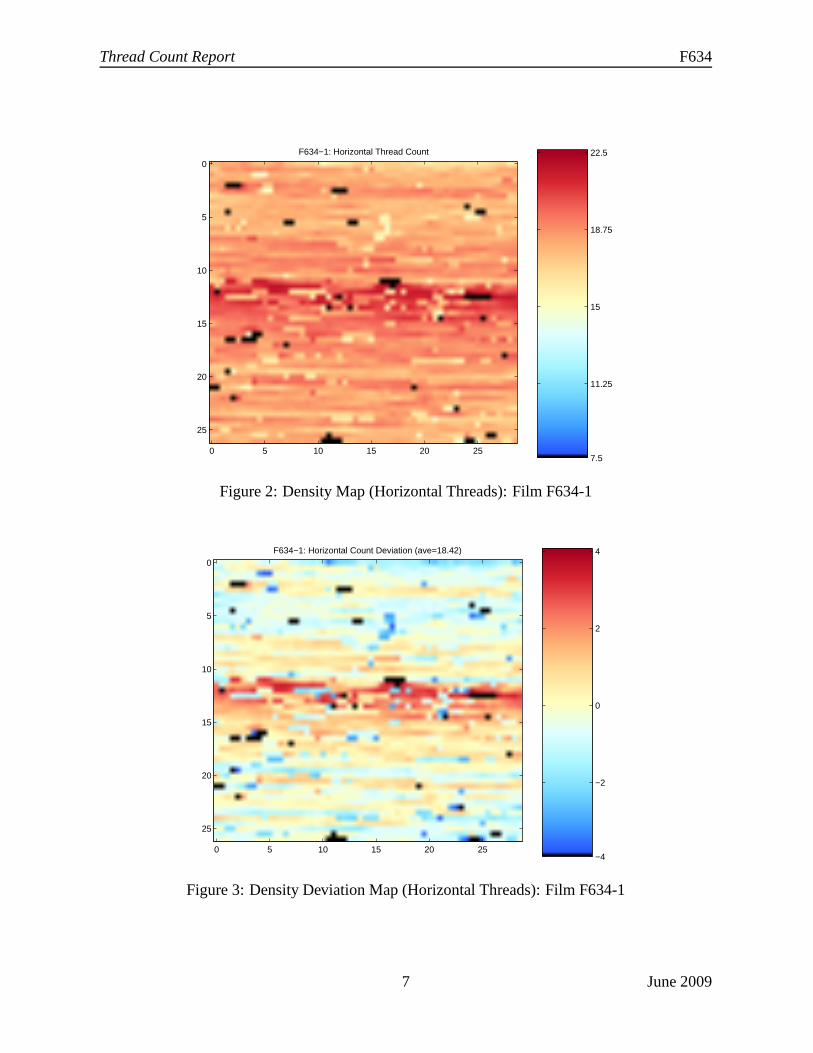
• TheDENSITY MAPS record the average thread densities (in threads/cm) computed in over-lapping 1 cm squares on 1/2 cm centers for each x-ray. The density at each location isindicated by a color. The axes on the density maps indicate the distance (in centimeters)from the origin in the upper left corner of the image. Two setsof illustrations for eachscanned x-ray film are provided: one with a color bar of threaddensity values and the otherwith a color bar indicating deviation from the average density. Separate maps are providedfor (near) horizontal and (near) vertical threads. ARANGE TABLE records the minimum,maximum, mean, and standard deviation over the set of averages computed for each 1 cmsquare. X-rays of canvas taken from the same roll should havea very close (within tenthsof a thread/cm) match of average densities of threads in the warp direction and a closematch (within±1 thread/cm) in the weft direction.
• TheTHREAD ANGLE MAPS indicate with color the values of the average thread angle (rel-ative to horizontal and vertical alignment of the x-ray) in the 1 cm squares examined tocompose the weave maps. The axes on the angle maps are marked with values in centime-ters indicating the distance from the origin in the upper left corner of the image. Separatemaps are provided for the (near) horizontal and (near) vertical threads. These angle mapsvividly display cusping when present.
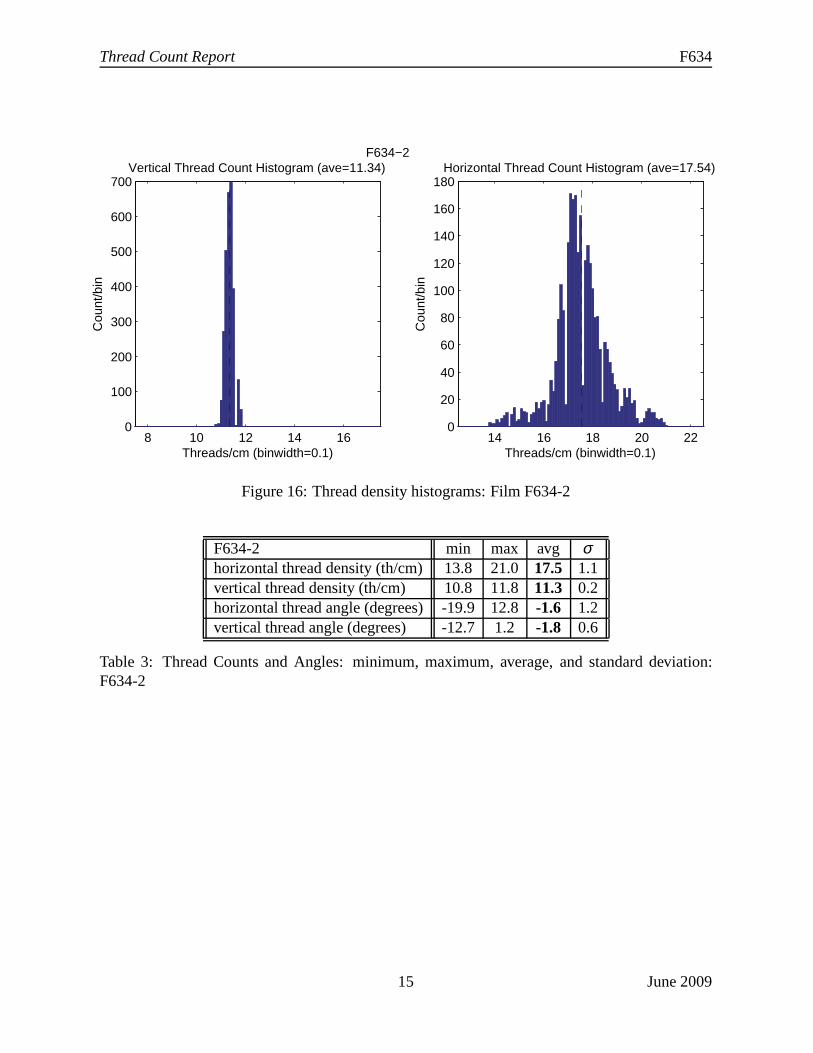
• The HISTOGRAM plots the number of evaluation squares having average densities withineach range increment (of 0.1 th/cm) along thex-axis. This plot is useful for visualizing thedistribution of the thread densities. Canvases from the same roll should have quite similarhistograms in both directions. Often, the threads in the warp direction show less variability,i.e. a narrower distribution, in their count than the weft threads.
“The Sheep-Shearers (after Millet)” (F634 / JH1787 / S42)
[43.5×29.5 cm, 15.09.1889, van Gogh Museum]
4 June 2009
Thread Count Report F634
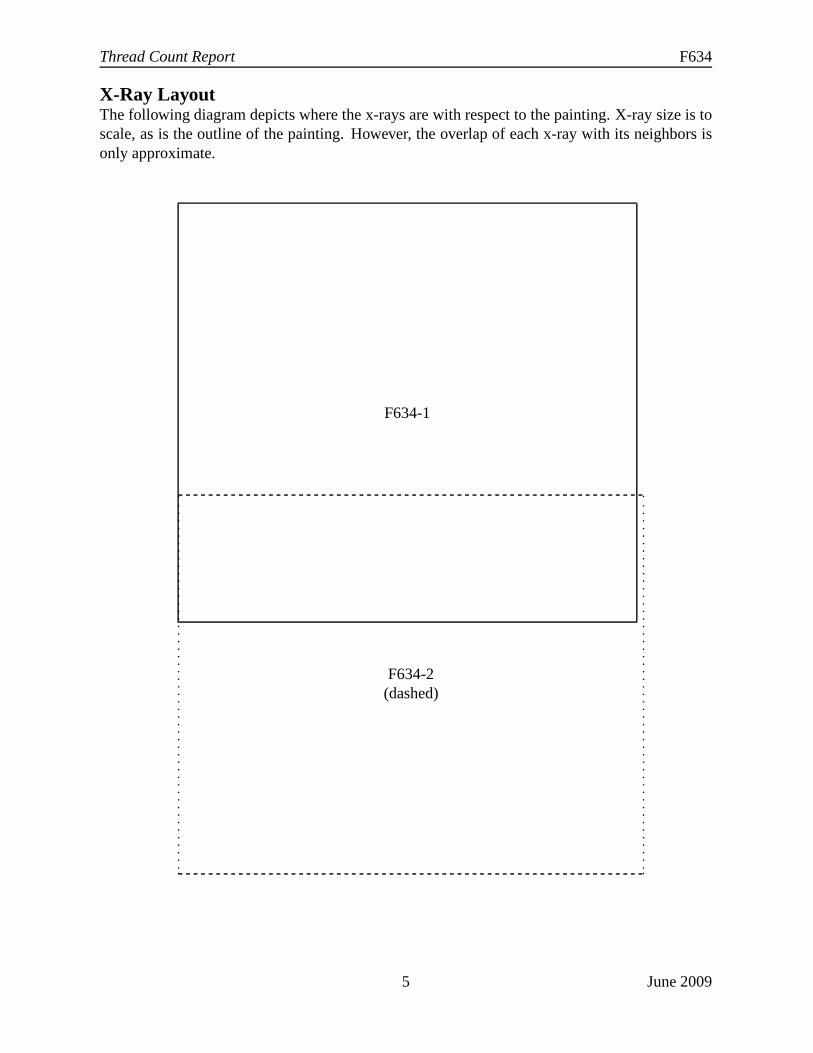
X-Ray LayoutThe following diagram depicts where the x-rays are with respect to the painting. X-ray size is toscale, as is the outline of the painting. However, the overlap of each x-ray with its neighbors isonly approximate.
F634-1
F634-2(dashed)
5 June 2009
Thread Count Report F634
Figure 1: X-ray image: Film F634-1
6 June 2009
Thread Count Report F634
F634−1: Horizontal Thread Count
0 5 10 15 20 25
0
5
10
15
20
25
7.5
11.25
15
18.75
22.5
Figure 2: Density Map (Horizontal Threads): Film F634-1
F634−1: Horizontal Count Deviation (ave=18.42)
0 5 10 15 20 25
0
5
10
15
20
25
−4
−2
0
2
4
Figure 3: Density Deviation Map (Horizontal Threads): FilmF634-1
7 June 2009
Thread Count Report F634
F634−1: Vertical Thread Count
0 5 10 15 20 25
0
5
10
15
20
25
7.5
11.25
15
18.75
22.5
Figure 4: Density Map (Vertical Threads): Film F634-1
F634−1: Vertical Count Deviations (ave=11.38)
0 5 10 15 20 25
0
5
10
15
20
25
−4
−2
0
2
4
Figure 5: Density Deviation Map (Vertical Threads): Film F634-1
8 June 2009
Thread Count Report F634
F634−1: Horizontal Thread Angle
0 5 10 15 20 25
0
5
10
15
20
25
−10
−5
0
5
10
Figure 6: Angle Map (Horizontal Threads): Film F634-1
F634−1: Vertical Thread Angle
0 5 10 15 20 25
0
5
10
15
20
25
−10
−5
0
5
10
Figure 7: Angle Map (Vertical Threads): Film F634-1