PWGSC Contract #: 5Z011-120154 POR Registration #: POR 022-11 Contract Award Date: 26/09/2011 2011 TD Summer Reading Club Final Report of Program Statistics For Library and Archives Canada Submitted to: Library and Archives Canada Lianne Fortin Program Manager, TD Summer reading Club 395 Wellington Street Ottawa, Ontario K1A 0N4 Submitted by: Harris/Decima, Ottawa, On
Transcript
PWGSC Contract #: 5Z011-120154 POR Registration #: POR 022-11
Contract Award Date: 26/09/2011
2011 TD Summer Reading Club
Final Report of Program Statistics
For Library and Archives Canada
Submitted to: Library and Archives Canada
Lianne Fortin Program Manager, TD Summer reading Club
395 Wellington Street Ottawa, Ontario
K1A 0N4
Submitted by: Harris/Decima, Ottawa, On
Proprietary Warning The information contained herein is proprietary to Library and Archives Canada and may not be used, reproduced or disclosed to others except as specifically permitted in writing by the originator of the information. The recipient of this information, by its retention and use, agrees to protect the same and the information contained therein from loss, theft or compromise. Any material or information provided by Library and Archives Canada and all data collected by Harris/Decima will be treated as confidential by Harris/Decima and will be stored securely while on Harris/Decima's premise (adhering to industry standards and applicable laws).
OTTAWA 1800-160 Elgin St. Tel: (613) 230-2200 Ottawa, Ontario, Canada Fax: (613) 230-3793 K2P 2P7 MONTRÉAL 400-1080 Beaver Hall Hill Tel: (514) 288-0037 Montréal, Québec, Canada Fax: (514) 288-0138 H2Z 1S8 TORONTO 405-2345 Yonge St. Tel: (416) 962-2013 Toronto, Ontario, Canada Fax: (416) 962-0505 M4P 2E5 VANCOUVER 500-666 Burrard St. Tel: (778) 370-1373 Vancouver, British Columbia, Canada Fax: (604) 601-2074 V6C 3P6
Acknowledgements Harris/Decima would like to extend its thanks to the many people who assisted with the TD Summer Reading Club (TDSRC) Statistics and Evaluation project. In particular, we would like to thank Lianne Fortin, Program Manager, Library and Archives Canada, for her guidance and commentary throughout the project. We would also like to thank the provincial and regional coordinators for their assistance in communicating with their library systems, as well as the library systems that took the time to compile the statistics from their branches and affiliates. Lastly we cannot overlook the contribution of the individual libraries that devoted their time to providing their program statistics.
The TDSRC is made possible thanks to the joint initiative between TD Bank Financial Group (TDBFG), Library and Archives Canada (LAC) and the Toronto Public Library (TPL).
LAC – TD Summer Reading Club 2011 Final Report of Program Statistics
Executive Summary / Key Findings Objectives and Methodology
LAC’s interest in conducting this study is to provide TD Bank Financial Group with accurate information about the success of the TD Summer Reading Club (TDSRC).
As libraries are organized differently in each province and territory, LAC had to identify a common denominator to respond to the evaluation. For most regions, the library systems were identified as the online evaluation respondents. A library system refers to either the main branch of a library with many library branches, an individual library, or a regional library system with many affiliated libraries. In some cases the evaluation respondents were the individual libraries. Such an example is the Toronto Public Library whose system includes over 90 library branches. Each branch within the Toronto Public Library was sent a link to complete their own evaluation form.
In some regions, the individual library branches were asked to provide the necessary information regarding the program to their library system using the Statistics and Evaluation Form found on the reading club website and in the Staff Manual. The library systems then compiled the data and filled out a unique online Statistics and Evaluation Form on the TD Summer Reading Club, using Harris/Decima’s online evaluation tool.
This year, Harris/Decima sent out 598 email invitations in both official languages to public libraries (systems) within the eleven participating provinces and territories, explaining the process of evaluating the program. In total, 554 evaluations were collected between October 1st and November 10th, 2011, yielding a submission rate of 93% and a response rate of 92%.
Throughout this report, the results from the 2011 TDSRC program are being compared with those obtained in previous years, beginning in 2005 and continuing through 2010.
LAC – TD Summer Reading Club 2011 Final Report of Program Statistics
Research Results The research highlights include the following:
Statistics on Participation
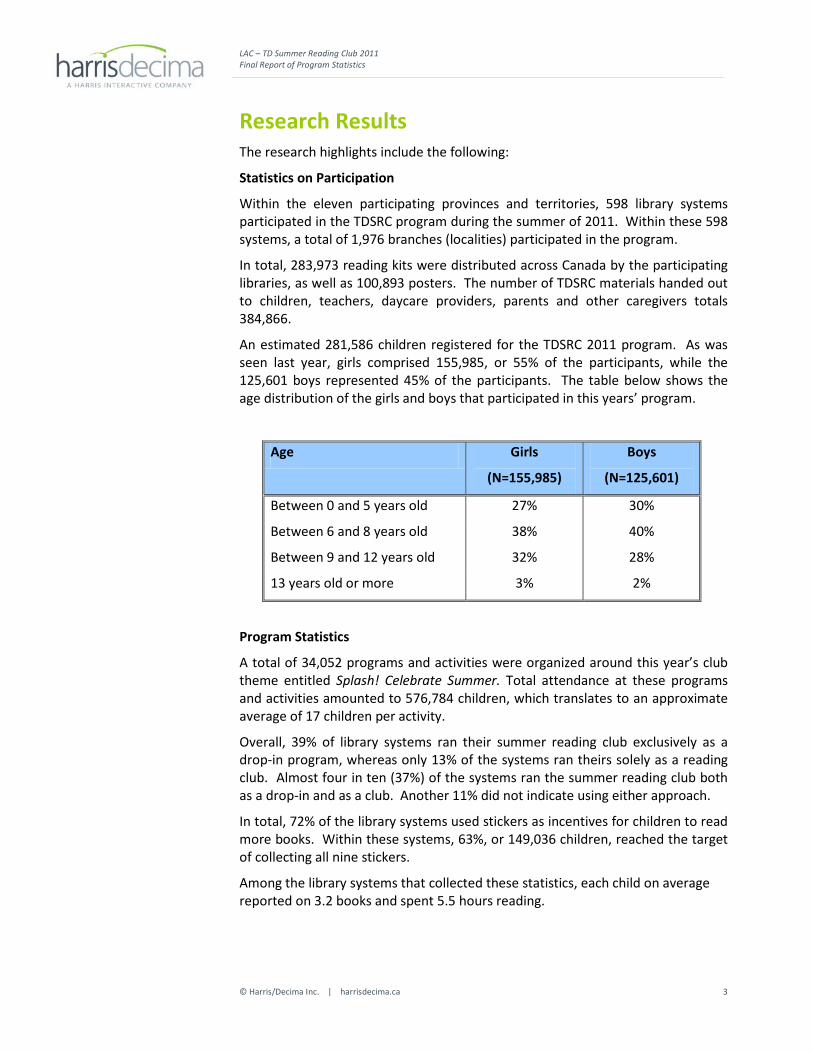
Within the eleven participating provinces and territories, 598 library systems participated in the TDSRC program during the summer of 2011. Within these 598 systems, a total of 1,976 branches (localities) participated in the program.
In total, 283,973 reading kits were distributed across Canada by the participating libraries, as well as 100,893 posters. The number of TDSRC materials handed out to children, teachers, daycare providers, parents and other caregivers totals 384,866.
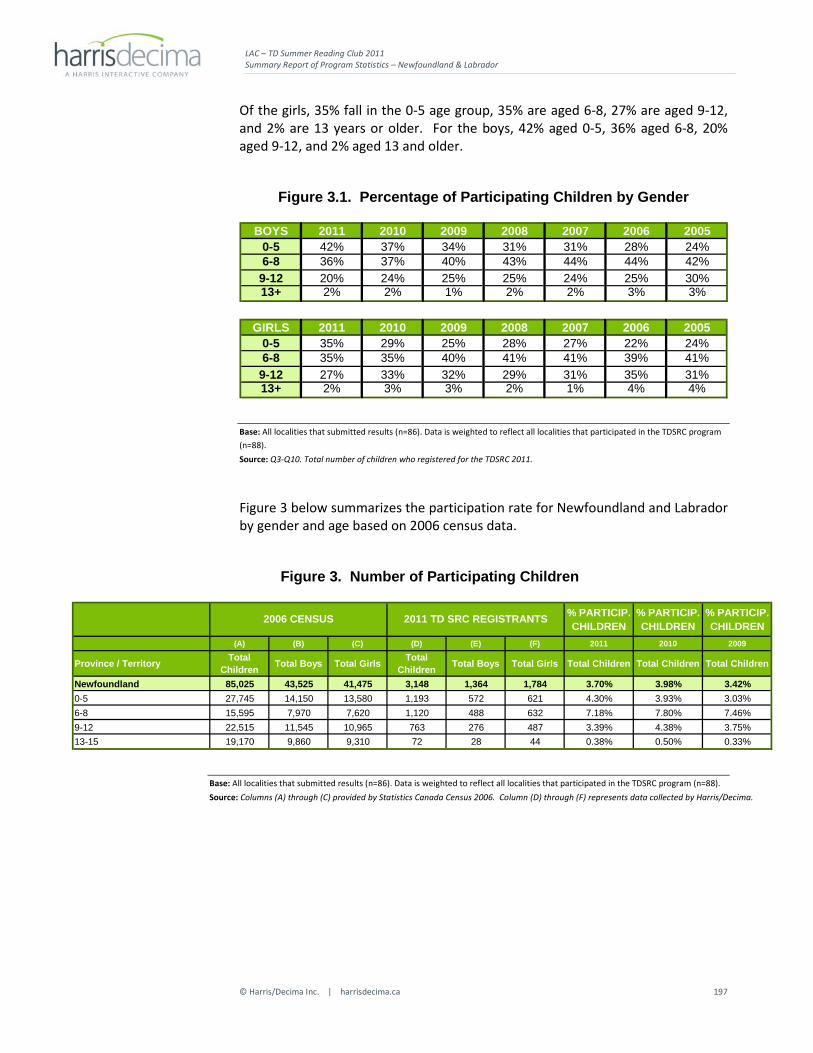
An estimated 281,586 children registered for the TDSRC 2011 program. As was seen last year, girls comprised 155,985, or 55% of the participants, while the 125,601 boys represented 45% of the participants. The table below shows the age distribution of the girls and boys that participated in this years’ program.
Age Girls
(N=155,985)
Boys
(N=125,601)
Between 0 and 5 years old 27% 30%
Between 6 and 8 years old 38% 40%
Between 9 and 12 years old 32% 28%
13 years old or more 3% 2%
Program Statistics
A total of 34,052 programs and activities were organized around this year’s club theme entitled Splash! Celebrate Summer. Total attendance at these programs and activities amounted to 576,784 children, which translates to an approximate average of 17 children per activity.
Overall, 39% of library systems ran their summer reading club exclusively as a drop-in program, whereas only 13% of the systems ran theirs solely as a reading club. Almost four in ten (37%) of the systems ran the summer reading club both as a drop-in and as a club. Another 11% did not indicate using either approach.
In total, 72% of the library systems used stickers as incentives for children to read more books. Within these systems, 63%, or 149,036 children, reached the target of collecting all nine stickers.
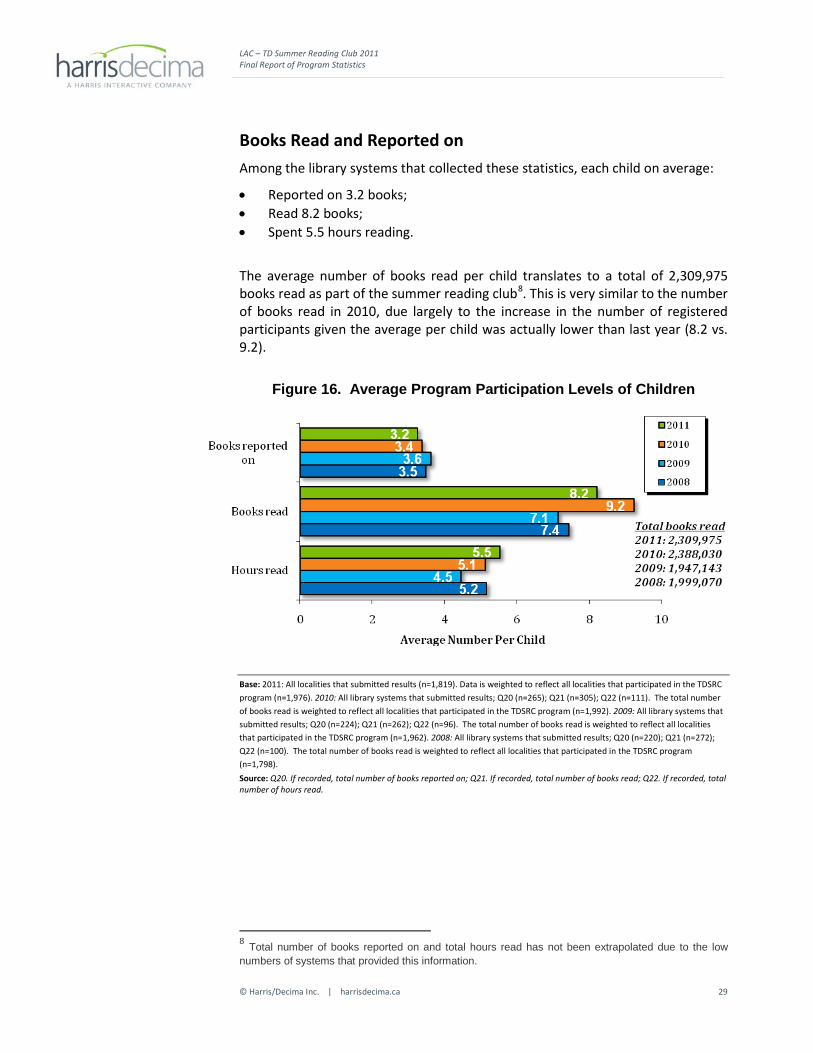
Among the library systems that collected these statistics, each child on average reported on 3.2 books and spent 5.5 hours reading.
LAC – TD Summer Reading Club 2011 Final Report of Program Statistics
On average, each child read approximately 8.2 books, which calculates to a total of 2,309,975 books read as part of the summer reading club1.
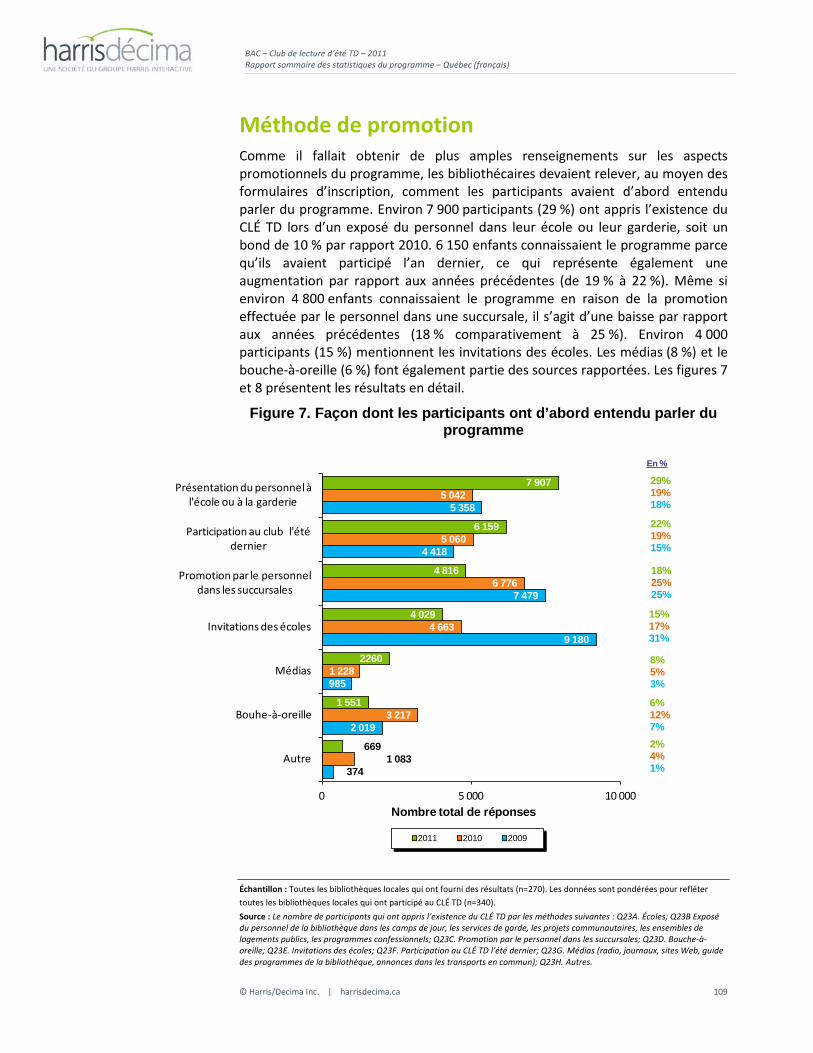
Promotion of the Program
Almost two-thirds (64%) of the library systems indicate that their library staff made visits to schools and daycares to promote the summer reading club. In total, 8,863 visits were made to schools and daycares, and 506,352 children were reached by these means.
Roughly 90,000 participants (32%) first heard of the TDSRC program through staff promotion in the branch, while about 71,600 (25%) first heard via a presentation at a school or daycare. Another 58,200 (21%) were participants from last year.
Overall Satisfaction
Satisfaction was exceptionally high across the libraries. Almost all (94%) libraries are “very satisfied” or “satisfied” with the theme and another 93% with the quality of the logbook and the visual representation of the theme in the materials. At least nine in ten were also satisfied with the program poster (91%) and the relevance of the content in the logbook (90%). Overall satisfaction with the website was up by one point over last year, from 83% to 84%.
Comments and Suggestions
The most common indicator of reading successes from the reading club is the children getting ‘hooked’ and interested in reading (33%). Other major indicators were increased reading habits (22%) and that the children were proud of their accomplishments (20%).
Children reading more frequently was most often mentioned as a positive outcome of the program by parents, caregivers and/or teachers (30%). More than a quarter of libraries reported parental enthusiasm and appreciation (26%) and the same number stated that children enjoy the program and theme. Another common testimonial mentioned the improved reading skills of the children who participated (23%). Another 16% of libraries reported that the program helps the children in their transition back to school.
A number of different themes were proposed for future programs, the most popular ones involving other cultures or countries (33%), fantasy/adventure (27%) or something related to animals, whether it be animals in general, or more specifically, pets, bugs or insects (22%).
Of those participants who suggested as way to improve the gathering of statistics (36% of respondents overall had suggestions), the most commonly mentioned was that the forms/reports should be provided earlier in the year (28%).
Finally, when asked for overall suggestions, a number of systems commented on the excellence and success of the program (37%, up from 30% last year). The most common suggestion for the TDSRC program in 2012 is to improve the materials used (22%), followed by having more age-appropriate themes (11%),
1 Total number of books reported on and total hours read has not been extrapolated due to the low numbers of systems that provided this information.
LAC – TD Summer Reading Club 2011 Final Report of Program Statistics
L’objectif du sondage chapeauté par Bibliothèque et Archives Canada (BAC) est d’évaluer le succès du Club de lecture d’été de la Banque TD (CLÉ TD) pour en informer le Groupe Financier Banque TD.
Puisque les bibliothèques fonctionnent différemment selon la province et le territoire, BAC devait d’abord définir un dénominateur commun pour qu’elles puissent toutes répondre à l’évaluation. Dans la plupart des régions, les réseaux de bibliothèques ont été choisis pour répondre à l’évaluation en ligne. Un réseau de bibliothèques désigne la succursale principale d’une bibliothèque possédant des succursales, une bibliothèque autonome ou un réseau régional de bibliothèques ayant des bibliothèques affiliées. Dans certains cas, les répondants étaient des bibliothèques autonomes. La Bibliothèque publique de Toronto, dont le réseau compte plus de 90 succursales, en est un bon exemple. Un lien a été envoyé à toutes les succursales de la Bibliothèque publique de Toronto afin qu’elles remplissent leur propre formulaire d’évaluation.
Dans certaines régions, chacune des succursales des bibliothèques devait fournir les données nécessaires à propos du programme au réseau dont elle fait partie en remplissant le Formulaire d’évaluation et de statistiques qui se trouvait sur le site Web du Club de lecture et dans le guide d’animation. Les réseaux de bibliothèques ont ensuite compilé ces données et soumis un seul Formulaire d’évaluation et de statistiques du Club de lecture d’été de la Banque TD au moyen de l’outil d’évaluation en ligne de Harris/Décima.
Cette année, Harris/Décima a invité 598 bibliothèques publiques (réseaux) dans les onze provinces et territoires participants. Le courriel d'invitation, rédigé en français et en anglais, expliquait le processus d'évaluation du programme. En tout, 554 évaluations ont été remplies du 1er octobre au 10 novembre 2011, soit un taux de soumission de 93 % et un taux de réponse de 92 %.
Dans ce rapport, les résultats du programme CLÉ TD 2011 sont comparés à ceux obtenus chaque année depuis le début du programme en 2005.
LAC – TD Summer Reading Club 2011 Final Report of Program Statistics
Résultats Les points saillants de la recherche sont notamment les suivants :
Statistiques de participation
Dans les onze provinces et territoires participants, 598 réseaux de bibliothèques ont participé au programme CLÉ TD au cours de l'été 2011. Parmi ces 598 réseaux, 1 976 succursales (localités) ont participé au programme.
Les bibliothèques participantes ont distribué en tout 283 973 trousses de lecture et 100 893 affiches partout au Canada. Ce sont donc 384 866 articles (trousses et affiches) qui ont été remis aux enfants, aux enseignants, aux éducateurs en garderie, aux parents et aux autres accompagnateurs dans le cadre du programme CLÉ TD 2011.
Environ 281 586 enfants se sont inscrits au programme CLÉ TD 2011. Tout comme l’année dernière, le programme comptait 55 % de filles, soit 155 985 participantes, et 45 % de garçons, soit 125 601 participants. Le tableau ci-dessous démontre la distribution par groupe d’âge des filles et des garçons qui ont participé au programme cette année.
Âge Filles
(N=155 985)
Garçons
(N=125 601)
De 0 à 5 ans 27% 30%
De 6 à 8 ans 38% 40%
De 9 à 12 ans 32% 28%
13 ans et plus 3% 2%
Statistiques sur le programme
En tout, 34 052 programmes et activités ont été organisés cette année autour du thème Splouff! Mouille-toi! 576 784 enfants ont participé à ces activités et programmes, soit une moyenne de 17 enfants par activité.
Globalement, 39 % des réseaux de bibliothèques ont fonctionné exclusivement selon le principe de la porte ouverte, alors que seulement 13 % des réseaux de bibliothèques ont fonctionné uniquement selon le principe du club de lecture. Près de quatre réseaux sur dix (37 %) ont fonctionné en combinant le principe de la porte ouverte et du club de lecture. Finalement, environ 11 % des réseaux n’ont pas indiqué l’approche privilégiée.
En tout, 72 % des réseaux de bibliothèques ont eu recours aux autocollants pour encourager les enfants à lire davantage. Dans ces réseaux, 63 % des participants, soit 149 036 enfants, ont réussi à collectionner les 9 autocollants.
Au sein des réseaux de bibliothèques qui ont compilé des statistiques à cet égard, les enfants ont en moyenne produit des comptes rendus de lecture pour 3,2 livres et ont lu pendant 5,5 heures.
LAC – TD Summer Reading Club 2011 Final Report of Program Statistics
En moyenne, chaque enfant a lu environ 8,2 livres, ce qui donne un total de 2 309 975 livres lus dans le cadre du club de lecture d’été2.
Promotion du programme
Près des deux tiers (64 %) des réseaux de bibliothèques ont indiqué que les employés de leur bibliothèque s’étaient rendus dans les écoles et dans les garderies pour faire la promotion du club de lecture d’été. En tout, ils ont fait 8 863 visites dans les écoles et les garderies et ainsi rejoint 506 352 enfants.
Environ 90 000 participants (32 %) ont appris l’existence du programme CLÉ TD par l’entremise du personnel des succursales, alors qu’environ 71 600 participants (25 %) en ont d’abord entendu parler à l’école ou à la garderie. 58 200 participants (21 %) avaient déjà participé au programme l’an dernier.
Satisfaction générale
Le niveau de satisfaction est exceptionnellement élevé dans toutes les bibliothèques. En effet, presque toutes les bibliothèques (94 %) sont « très satisfaites » ou « satisfaites » du thème, et 93 % d’entre elles sont satisfaites de la qualité du livret d’activités et de la représentation graphique du thème dans la documentation. Au moins neuf bibliothèques sur dix sont également satisfaites de l’affiche du programme (91 %) et de la pertinence du contenu du livret d’activités (90 %). La satisfaction générale à l’égard du site Web a grimpé d’un point de pourcentage par rapport à l’an dernier et est passée de 83 % à 84 %.
Commentaires et suggestions
Les enfants qui deviennent « accros » et s’intéressent à la lecture (33 %) sont l’indicateur qui revient le plus souvent pour mesurer la réussite du club de lecture. Les autres grands indicateurs sont le développement des habitudes de lecture (22 %) et la fierté des enfants à l’égard de ce qu’ils ont accomplit (20 %).
Les parents, les accompagnateurs et les enseignants mentionnent le plus fréquemment (30 %) comme résultat positif le fait que les enfants lisent plus souvent. Plus du quart des bibliothèques signalent l’enthousiasme et l’appréciation des parents (26 %) et le même pourcentage d’entre elles affirment que les enfants aiment le programme et le thème. Un autre témoignage courant touche l’amélioration des habiletés de lecture des enfants qui ont participé au programme (23 %). Par ailleurs, 16 % des bibliothèques rapportent que le programme aide les enfants à faire la transition vers de retour en classe.
De nombreux thèmes différents sont suggérés pour les années à venir. Les plus populaires sont ceux qui touchent les autres cultures ou les autres pays (33 %), la fantaisie et l’aventure (27 %) ou les thèmes en lien avec les animaux, que ce soit les animaux en général ou plus précisément les animaux de compagnie, les bestioles ou les insectes (22 %).
Parmi les participants qui ont suggéré des moyens d’améliorer la collecte des statistiques (36 % de l’ensemble des répondants), la suggestion la plus courante est de fournir les formulaires ou les rapports plus tôt dans l’année (28 %).
2 Le total des comptes rendus de lecture et celui des heures consacrées à la lecture n'ont pas été extrapolés en raison du faible nombre de réseaux qui ont fourni ces renseignements.
LAC – TD Summer Reading Club 2011 Final Report of Program Statistics
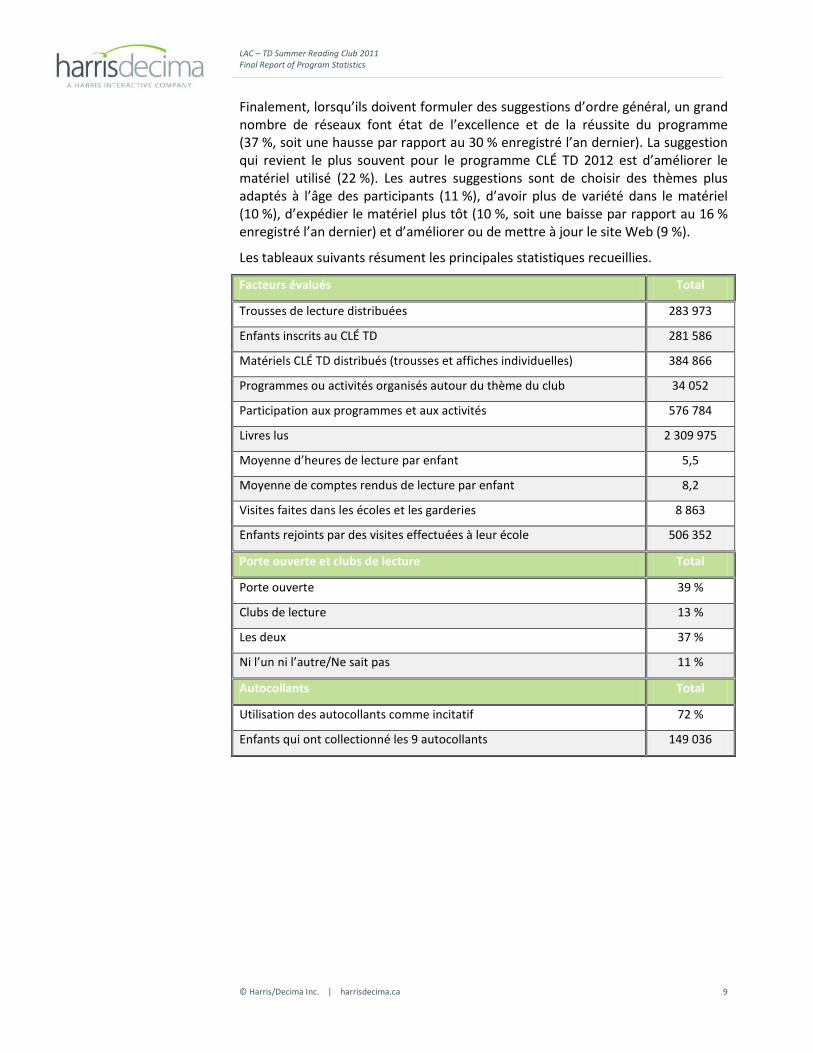
Finalement, lorsqu’ils doivent formuler des suggestions d’ordre général, un grand nombre de réseaux font état de l’excellence et de la réussite du programme (37 %, soit une hausse par rapport au 30 % enregistré l’an dernier). La suggestion qui revient le plus souvent pour le programme CLÉ TD 2012 est d’améliorer le matériel utilisé (22 %). Les autres suggestions sont de choisir des thèmes plus adaptés à l’âge des participants (11 %), d’avoir plus de variété dans le matériel (10 %), d’expédier le matériel plus tôt (10 %, soit une baisse par rapport au 16 % enregistré l’an dernier) et d’améliorer ou de mettre à jour le site Web (9 %).
Les tableaux suivants résument les principales statistiques recueillies.
Facteurs évalués Total
Trousses de lecture distribuées 283 973
Enfants inscrits au CLÉ TD 281 586
Matériels CLÉ TD distribués (trousses et affiches individuelles) 384 866
Programmes ou activités organisés autour du thème du club 34 052
Participation aux programmes et aux activités 576 784
Livres lus 2 309 975
Moyenne d’heures de lecture par enfant 5,5
Moyenne de comptes rendus de lecture par enfant 8,2
Visites faites dans les écoles et les garderies 8 863
Enfants rejoints par des visites effectuées à leur école 506 352
Porte ouverte et clubs de lecture Total
Porte ouverte 39 %
Clubs de lecture 13 %
Les deux 37 %
Ni l’un ni l’autre/Ne sait pas 11 %
Autocollants Total
Utilisation des autocollants comme incitatif 72 %
Enfants qui ont collectionné les 9 autocollants 149 036
LAC – TD Summer Reading Club 2011 Final Report of Program Statistics
The 2011 TD Summer Reading Club (TDSRC) was offered in eleven provinces and territories across the country through the support of TD Bank Financial Group3. Beginning in Toronto in 1994, the program expanded across Ontario in 2001 and was widely available across Canada under the auspices of Library and Archives Canada as of summer 2004. The TDSRC focuses on young Canadians, promoting the fun of reading and encouraging them to visit their local library over the summer months. The program gives children a structured reading environment and rewards personal achievements.
Led by the Toronto Public Library, a team of librarians from Toronto, Ottawa, Quebec City and Montreal created the bilingual material for this program. Public libraries were encouraged to contact local schools in May to drop off bookmark-size invitations and request that they be distributed with the children’s report cards. Reading kits were provided to children beginning the program in late June or early July, which included a poster, stickers and a logbook. In some cases, libraries only provided the posters to children.
3 The provinces of New Brunswick and British Columbia did not participate in the program and are not included in this report.
LAC – TD Summer Reading Club 2011 Final Report of Program Statistics
Methodology According to the data collected and the information provided by the provincial library services and associations coordinating the program regionally, 1,817 public library localities, supplied their statistics from the 2011 TD Summer Reading Club program4. As a provision for receiving the free program kits, each library was asked to collect and evaluate statistical information related to the program. So that libraries would know what information to collect over the summer, a version of the evaluation form was included on the reading club website and in the TDSRC staff manual.
As in previous years in which the program was run, LAC assumed responsibility for analyzing these statistics, and teamed with Harris/Decima to collect the requisite information. Since libraries are organized differently in each province and territory, LAC had to identify a common denominator to respond to the evaluation. The library systems were identified as the online evaluation respondents5.
LAC provided Harris/Decima with the evaluation form in both official languages, which Harris/Decima then programmed and hosted on its secure on-line server. LAC also provided Harris/Decima with a database containing the most recent contact information available for the participating systems. This database had been compiled based on contact information provided to LAC by each provincial/territorial coordinator.
Each contact in this database was sent an email invitation by Harris/Decima (on behalf of LAC), containing a unique password-encrypted hyperlink to the online evaluation. The unique URL was provided to ensure that only one form could be completed per system (i.e. no duplicate entries would be possible) and as a means of tracking which systems had submitted results. The library systems compiled the data from their library branches and subsequently completed the online form, using the hyperlink provided to them in the email invitation.
During the data collection period, Harris/Decima provided LAC with updates on which systems had not yet accessed the online form. LAC relayed this information to provincial/territorial coordinators, who then followed up with these systems to encourage participation. This year, a total of 1,819 of the 1,976 participating libraries reported data, and their evaluations were collected between October 1st and November 10th, 2011, yielding a 92% response rate.
The numbers presented in this report are based on a weighting system that represents the estimated 1,976 participating branches and not just the 1,819 that provided statistics for their respective systems. The weighting scheme takes into account all of the individual libraries within a given province or territory and weighting the available data to represent the missing libraries.
4 A library system may have many branches, but this number refers to the total number of individual libraries, regardless of whether they are part of a larger system or not. 5 In some cases, as with the Toronto Public Library, individual links were sent to the library branches, rather than to the system itself.
LAC – TD Summer Reading Club 2011 Final Report of Program Statistics
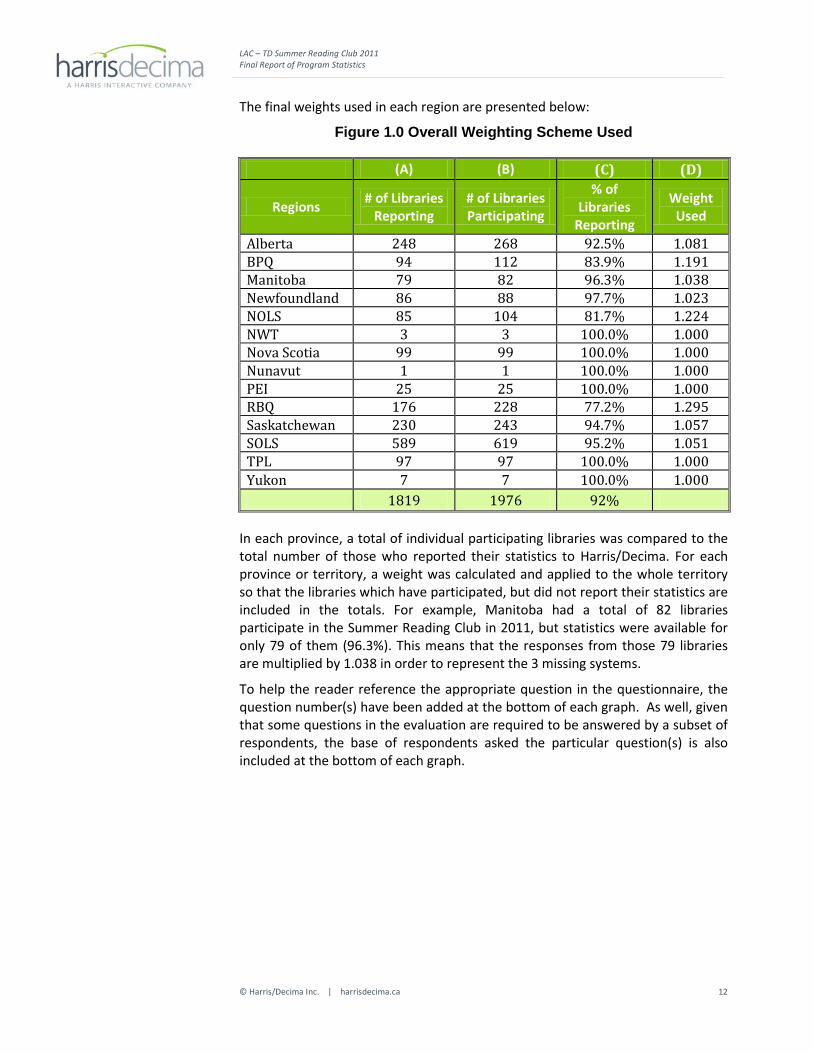
In each province, a total of individual participating libraries was compared to the total number of those who reported their statistics to Harris/Decima. For each province or territory, a weight was calculated and applied to the whole territory so that the libraries which have participated, but did not report their statistics are included in the totals. For example, Manitoba had a total of 82 libraries participate in the Summer Reading Club in 2011, but statistics were available for only 79 of them (96.3%). This means that the responses from those 79 libraries are multiplied by 1.038 in order to represent the 3 missing systems.
To help the reader reference the appropriate question in the questionnaire, the question number(s) have been added at the bottom of each graph. As well, given that some questions in the evaluation are required to be answered by a subset of respondents, the base of respondents asked the particular question(s) is also included at the bottom of each graph.
LAC – TD Summer Reading Club 2011 Final Report of Program Statistics
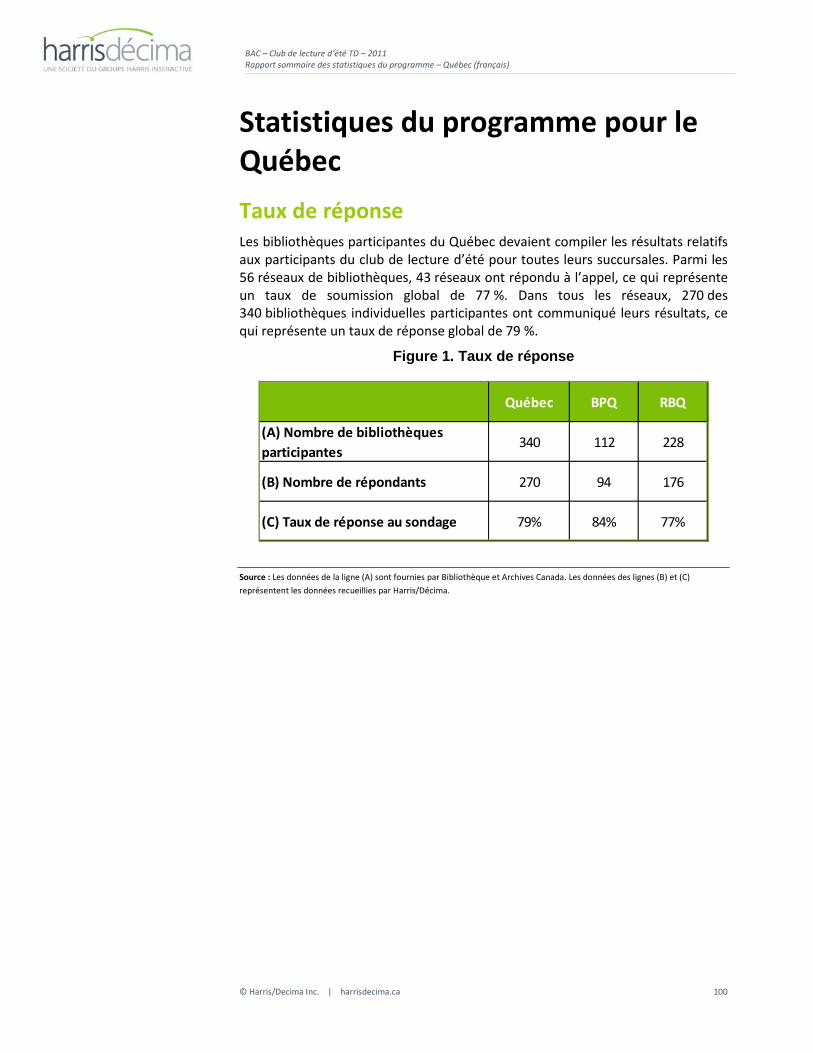
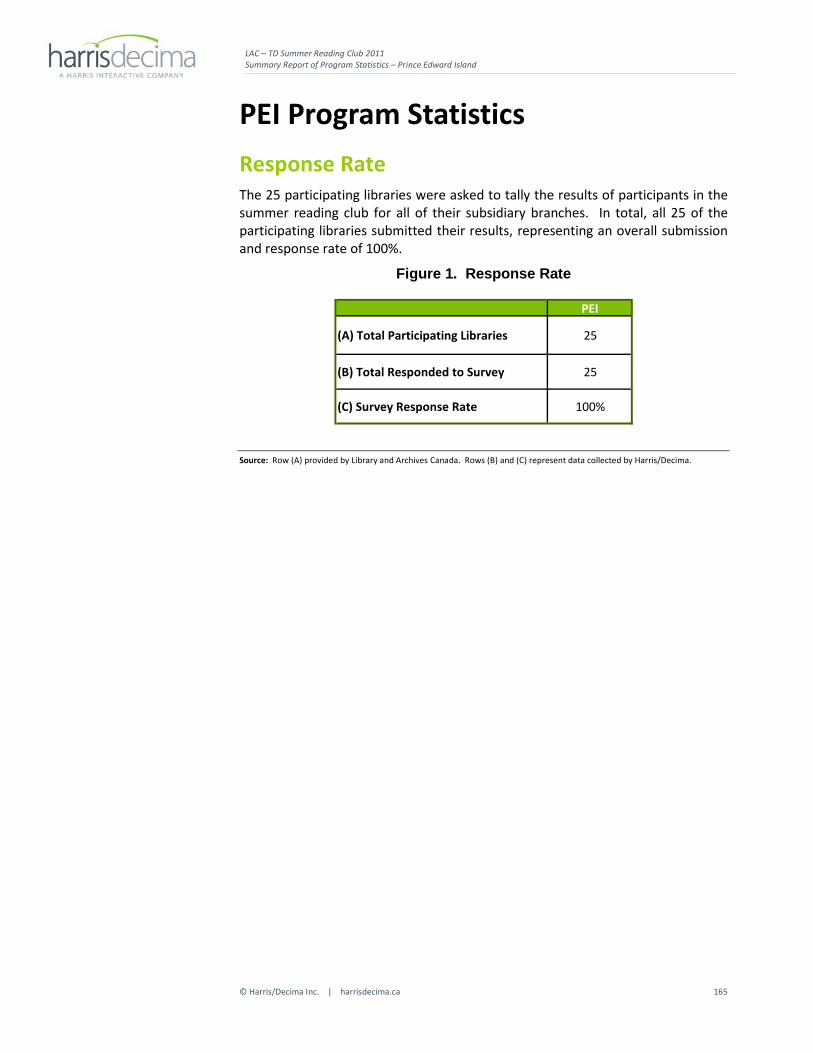
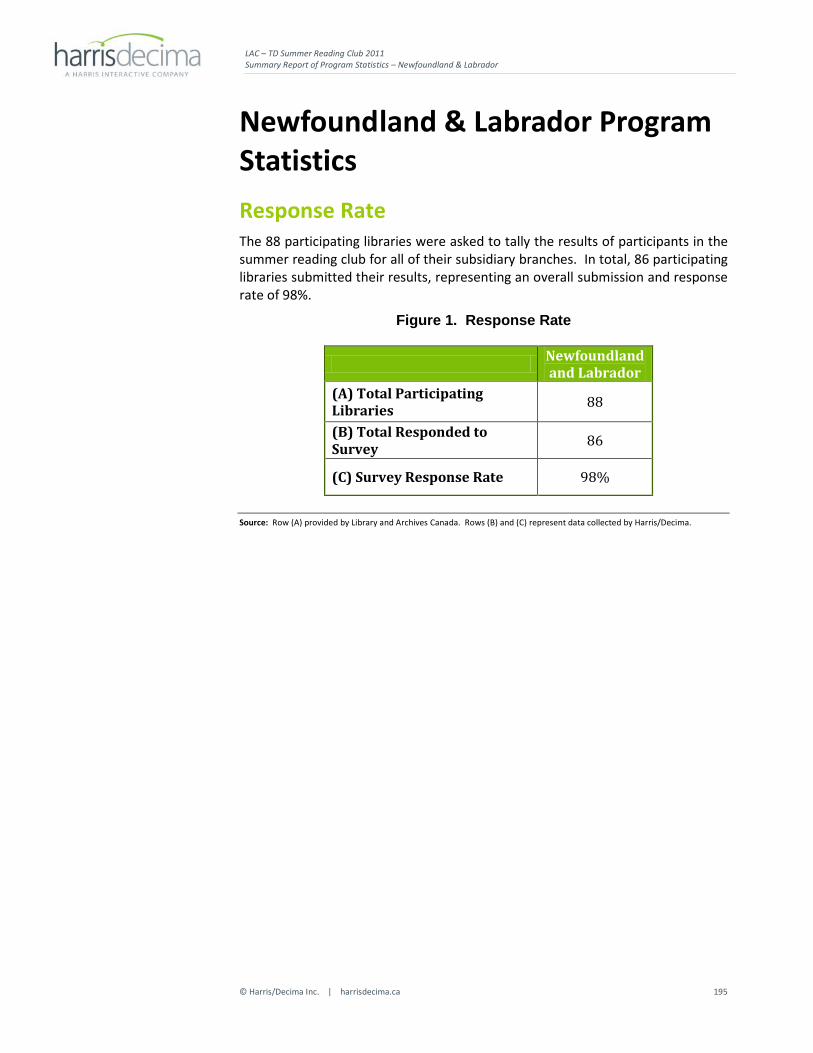
National Program Statistics Submission Rate & Response Rate The 598 participating library systems (including some participants at the branch level) were asked to tally the results of participants in the summer reading club for their own library as well as any subsidiary branches. The submission rate refers to how many of the libraries systems that were sent an email actually responded and entered data for the system they were responsible for. Of the 598 participating library systems, 554 submitted their results, representing an overall submission rate of 92.6%. The figure below depicts the submission rate by region.
Source: Column A provided by Library and Archives Canada. Column B represents data collected by Harris/Decima. NOTE: Regarding both the BPQ (Bibliothèques Publiques du Québec) and the RBQ (Réseau BIBLIO du Québec), some systems were sent a single invitation for their whole system, while in others, individual member libraries were sent invitations. For weighting and response rate, only the overall number of libraries was considered, but for submission rate, individual invitations were considered.
LAC – TD Summer Reading Club 2011 Final Report of Program Statistics
The response rate refers to the total number of libraries whose data are represented in the responses received. When working out the overall response rate, the only consideration is the total number of libraries that are reporting, without considering systems. The result is a more accurate overall picture of how many of the libraries that participated in the TD Summer Reading Club are actually represented in the data. The figure below depicts the response rate by region. With 1,819 of the total 1,976 libraries being represented, the overall response rate was 92%.
Source: Column A provided by Library and Archives Canada. Column B represents data collected by Harris/Decima. NOTE: Regarding both the the BPQ (Bibliothèques Publiques du Québec) and the RBQ (Réseau BIBLIO du Québec), some systems were sent a single invitation for their whole system, while in others, individual member libraries were sent invitations. For weighting and response rate, only the overall number of libraries was considered, but for submission rate, individual invitations were considered.
LAC – TD Summer Reading Club 2011 Final Report of Program Statistics
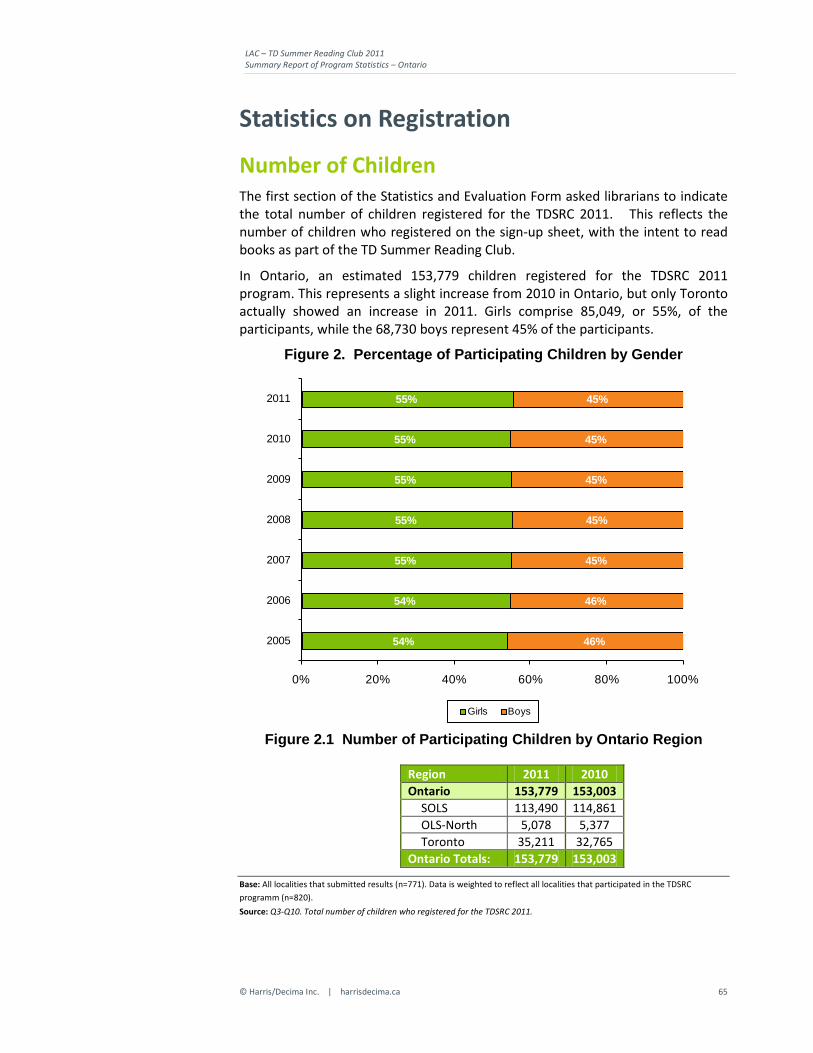
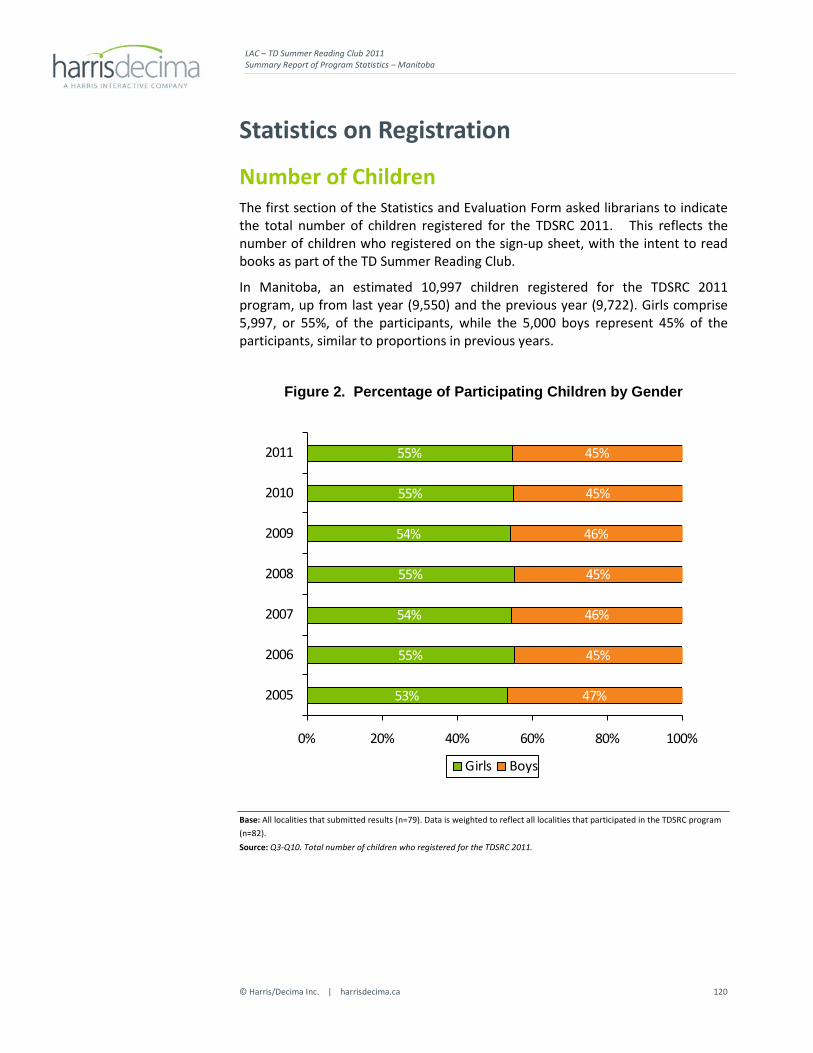
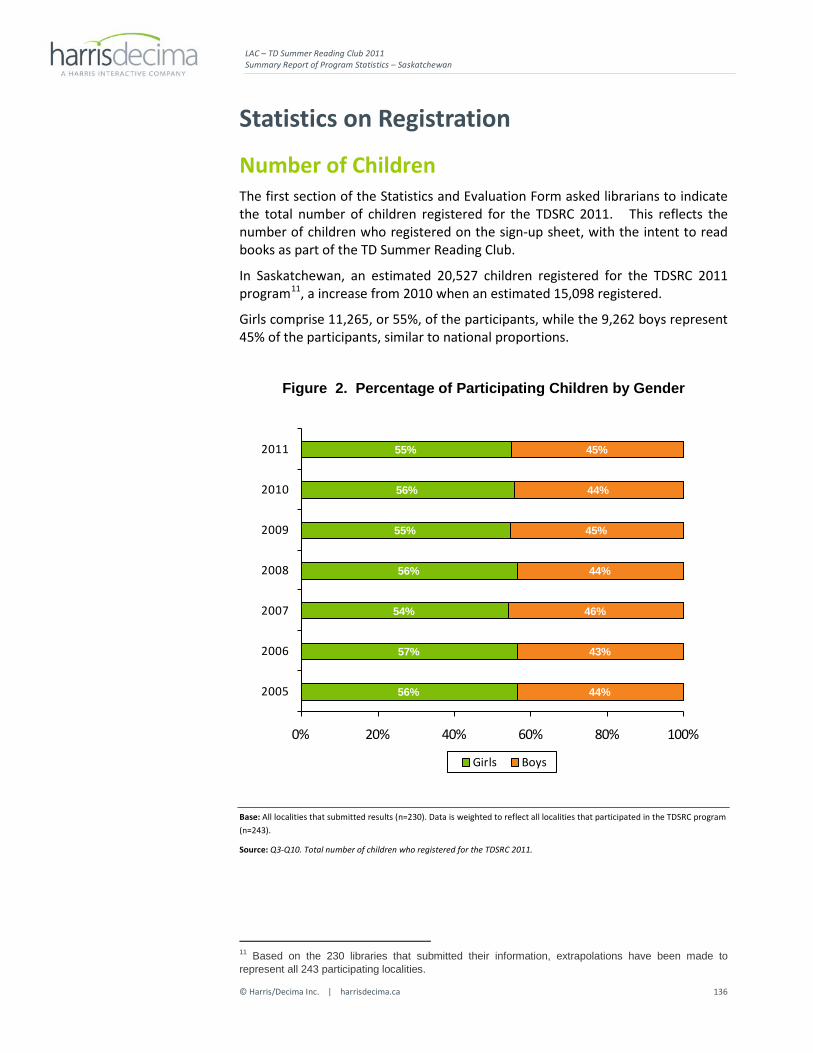
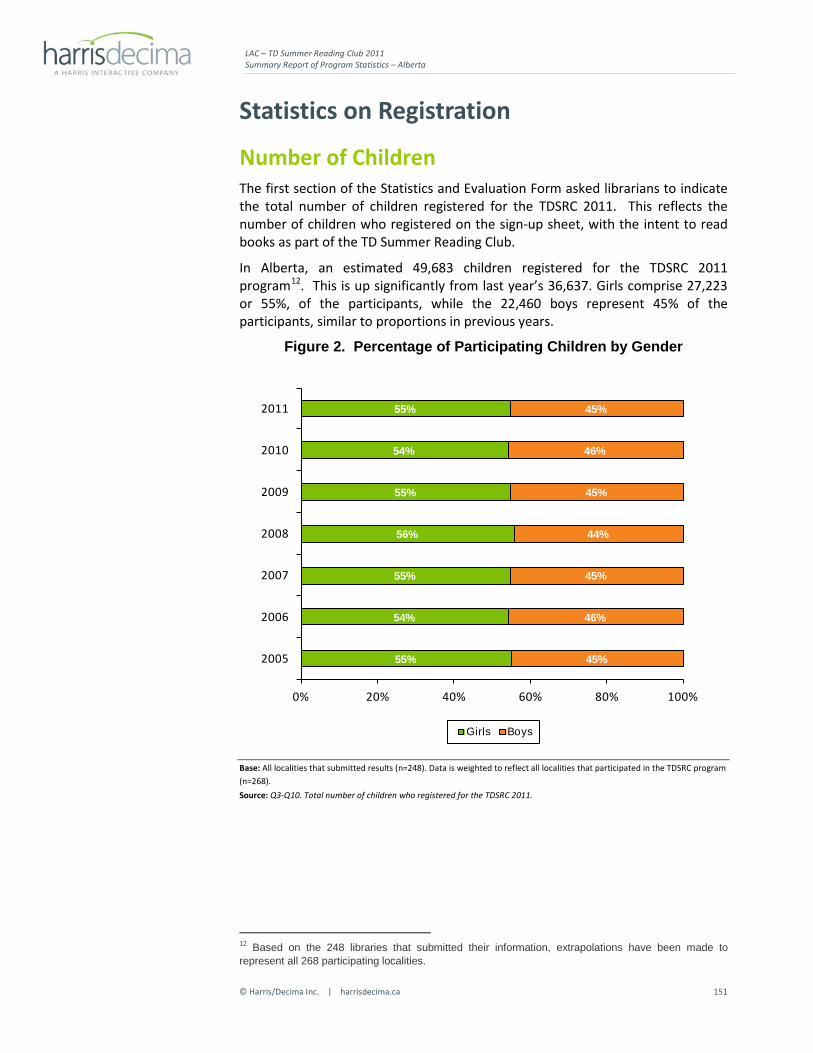
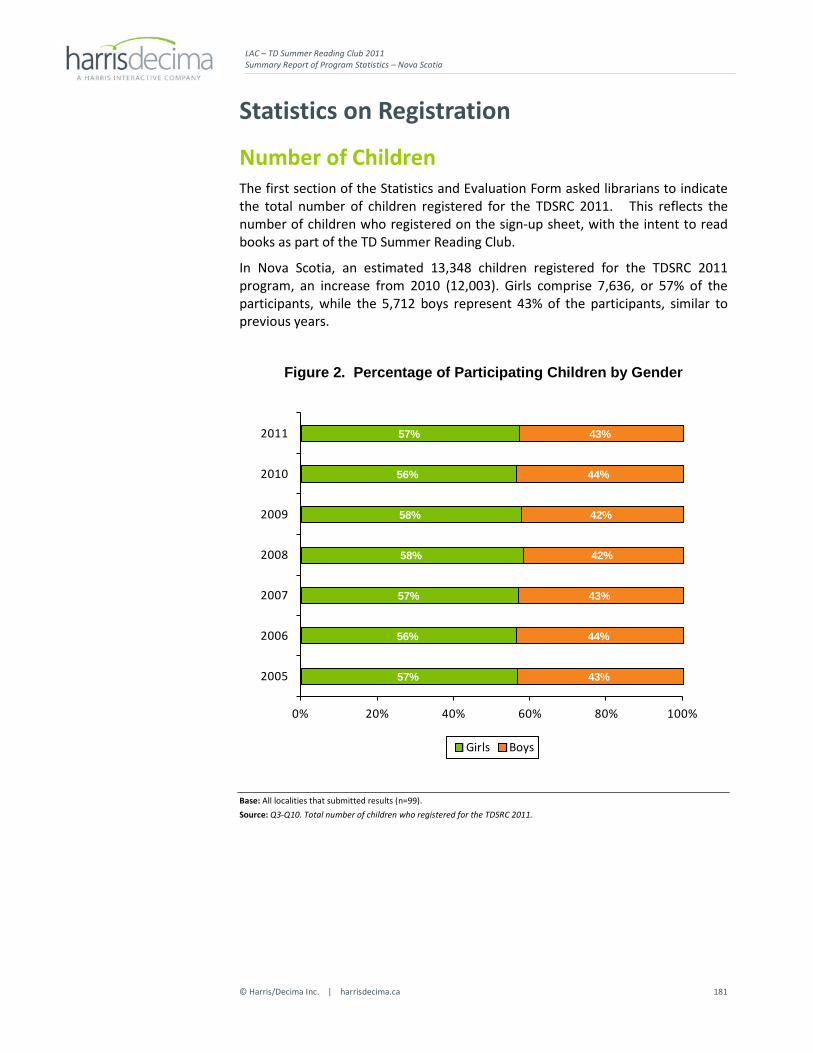
Number of Children The first section of the Statistics and Evaluation Form asked librarians to indicate the total number of children registered for the TDSRC 2011 program. This reflects only the number of children who registered on the sign-up sheet, with the intent to read books as part of the TD Summer Reading Club.
Across Canada, an estimated 281,586 children registered for the TDSRC 2011 program6. This is the highest number reported so far for the TD Summer Reading Club.
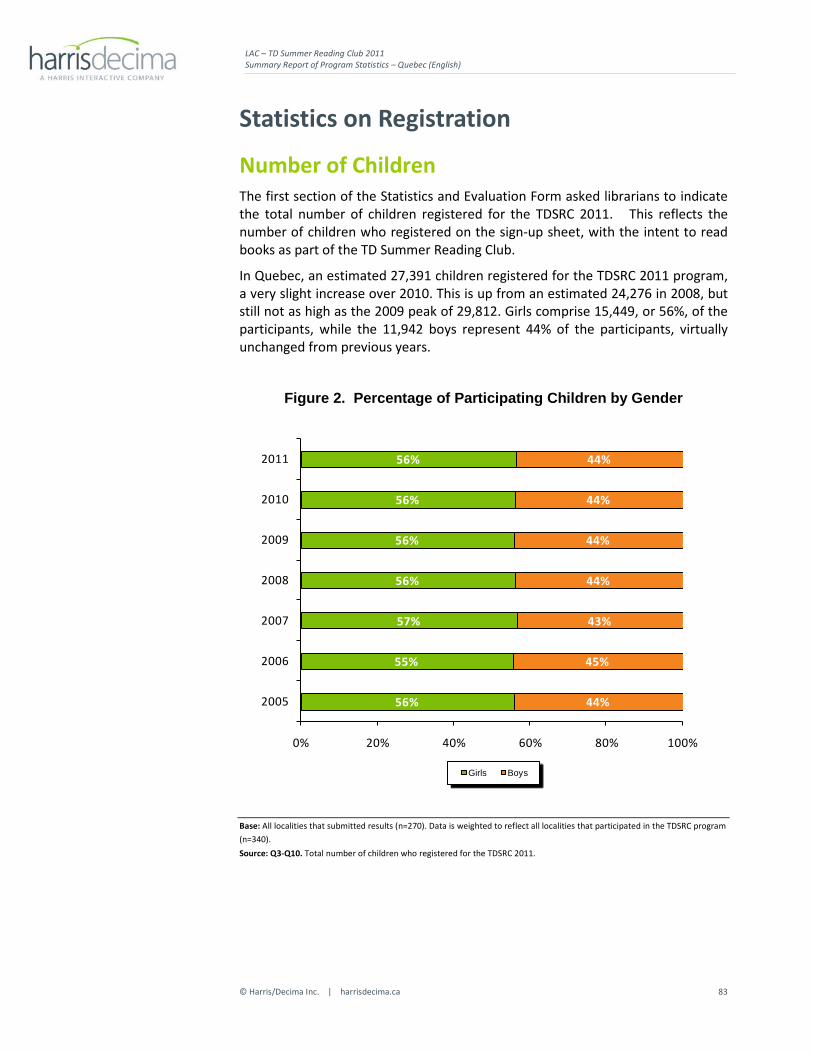
Girls comprise 155,985, or 55%, of the participants, while the 125,601 boys represent 45% of the participants, equal to the proportions in previous years.
Figure 3. Percentage of Participating Children by Gender
Base: 2011: All localities that submitted results (n=1,819). Data is weighted to reflect all localities that participated in the TDSRC program (n=1,976). 2010: All localities that submitted results (n=1,762). Data is weighted to reflect all localities that participated in the TDSRC program (n=1,992). 2009: All localities that submitted results (n=1,718). Data is weighted to reflect all localities that participated in the TDSRC program (n=1,962). 2008: All localities that submitted results (n=1,611). Data is weighted to reflect all localities that participated in the TDSRC program (n=1,798). 2007: All localities that submitted results (n=1,585). Data is weighted to reflect all localities that participated in the TDSRC program (n=1,706). 2006: All localities that submitted results (n=1,650). Data is weighted to reflect all localities that participated in the TDSRC program (n=1,951). 2005: All library systems that submitted results (n=372). Data is weighted to reflect all systems that participated in the TDSRC program (n=432). Source: Q3-Q10. Total number of children who registered for the TDSRC 2011 program.
6 Based on the 554 systems and/or branches that submitted their information, extrapolations have been made to represent all 1,976 participating branches.
LAC – TD Summer Reading Club 2011 Final Report of Program Statistics
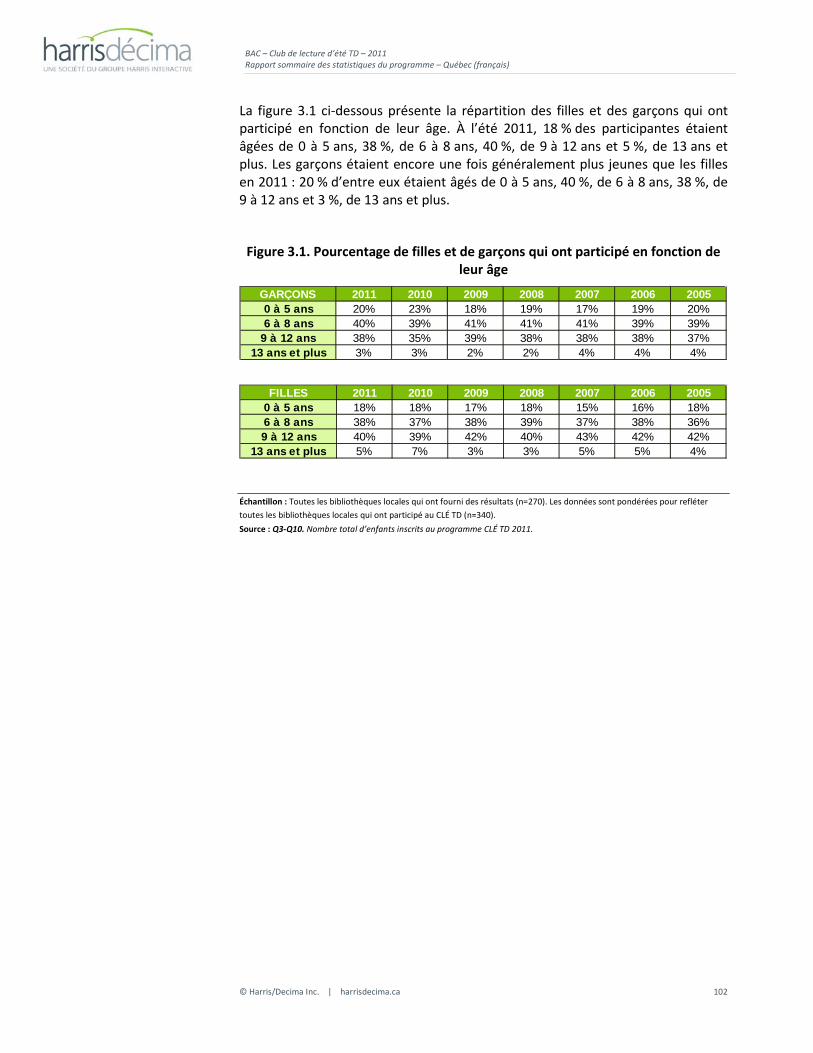
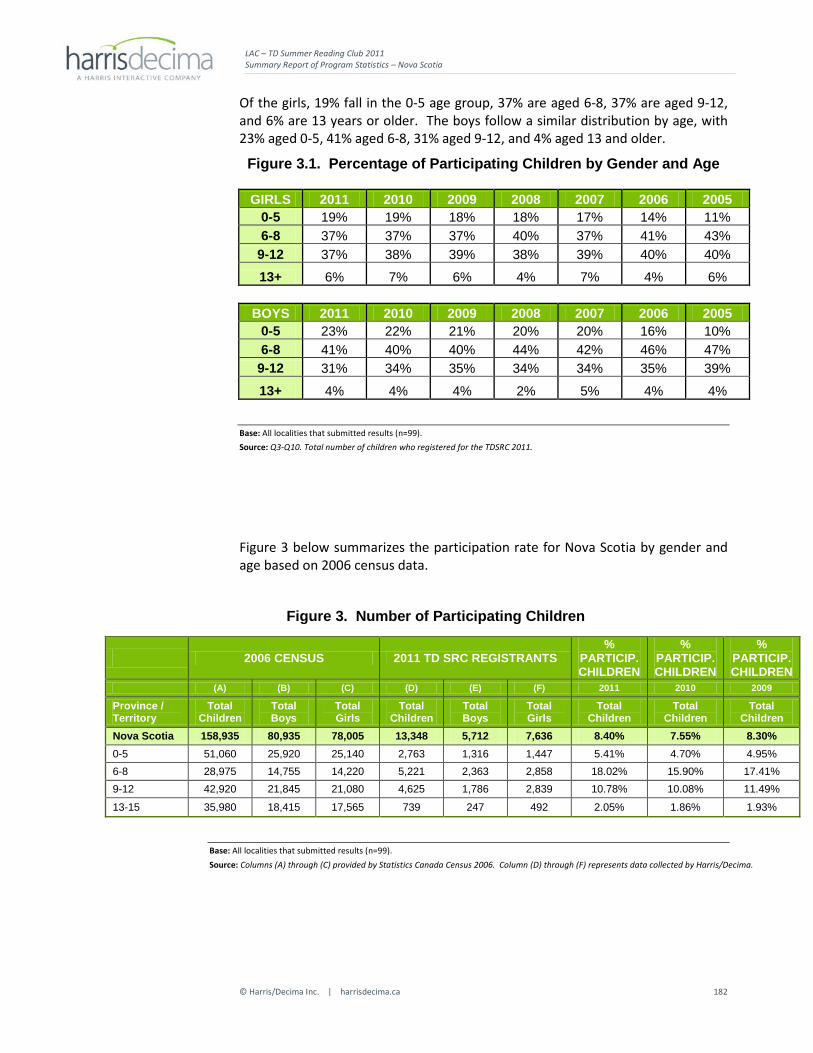
The distribution by age group also remains consistent from year to year. Age distributions are also similar for boys and girls. As was the case in 2010, in 2011, 27% of girls fell in the 0-5 age group, 38% were aged 6-8, 32% were aged 9-12, and 3% were 13 years or older. The boys followed a similar distribution by age, with 30% aged 0-5, 40% aged 6-8, 28% aged 9-12, and 2% aged 13 and older. These numbers are virtually identical to those recorded in 2010.
The figure below shows results by age and gender from 2005 onward.
Figure 3.1. Percentage of Registered Children by Age & Gender
Base: 2011: All localities that submitted results (n=1,819). Data is weighted to reflect all localities that participated in the TDSRC program (n=1,976). 2010: All localities that submitted results (n=1,762). Data is weighted to reflect all localities that participated in the TDSRC program (n=1,992). 2009: All localities that submitted results (n=1,718). Data is weighted to reflect all localities that participated in the TDSRC program (n=1,962). 2008: All localities that submitted results (n=1,611). Data is weighted to reflect all localities that participated in the TDSRC program (n=1,798). 2007: All localities that submitted results (n=1,585). Data is weighted to reflect all localities that participated in the TDSRC program (n=1,706). 2006: All localities that submitted results (n=1,650). Data is weighted to reflect all localities that participated in the TDSRC program (n=1,951). 2005: All library systems that submitted results (n=372). Data is weighted to reflect all systems that participated in the TDSRC program (n=432). Source: Q3-Q10. Total number of children who registered for the TDSRC 2011 program.
The table below summarizes the number of children who participated in the 2011 program by province, and by network for Quebec and Ontario. The table features detailed numbers by both gender and age for each province.
LAC – TD Summer Reading Club 2011 Final Report of Program Statistics
Base: All localities that submitted results (n=1,819). Data is weighted to reflect all localities that participated in the TDSRC program (n=1,976). Source: Q3-Q10. Total number of children who registered for the TDSRC 2011.
LAC – TD Summer Reading Club 2011 Final Report of Program Statistics
Figure 5 on the following page summarizes the registration rate by age and region, based on 2006 census data.
Similar to previous years, 2011 reach was highest among 6 to 8 year old children in every province and territory, but particularly in the Saskatchewan (22. 4%), and Nova Scotia (18.0%). Conversely, reach continues to be lowest for teenagers between 13 and 15 years old with a national average reach of 0.7%.
Nova Scotia (8.4%) and Saskatchewan (10.1%) had the greatest percentage of children overall register for the Summer Reading Club in the country, which is a similar trend as was seen last year. Traditionally, Quebec and the Territories have lower registration but in 2011, while Quebec registration remained low (2.0%), registration in the Territories jumped significantly, to 5.04%.
LAC – TD Summer Reading Club 2011 Final Report of Program Statistics
Base: 2011: All localities that submitted results (n=1,819). Data is weighted to reflect all localities that participated in the TDSRC program (n=1,976). 2010: All localities that submitted results (n=1,762). Data is weighted to reflect all localities that participated in the TDSRC program (n=1,992). 2009: All localities that submitted results (n=1,718). Data is weighted to reflect all localities that participated in the TDSRC program (n=1,962). Source: Columns (A) through (C) provided by Statistics Canada Census 2006. Column (D) through (F) represents data collected by Harris/Decima.
LAC – TD Summer Reading Club 2011 Final Report of Program Statistics
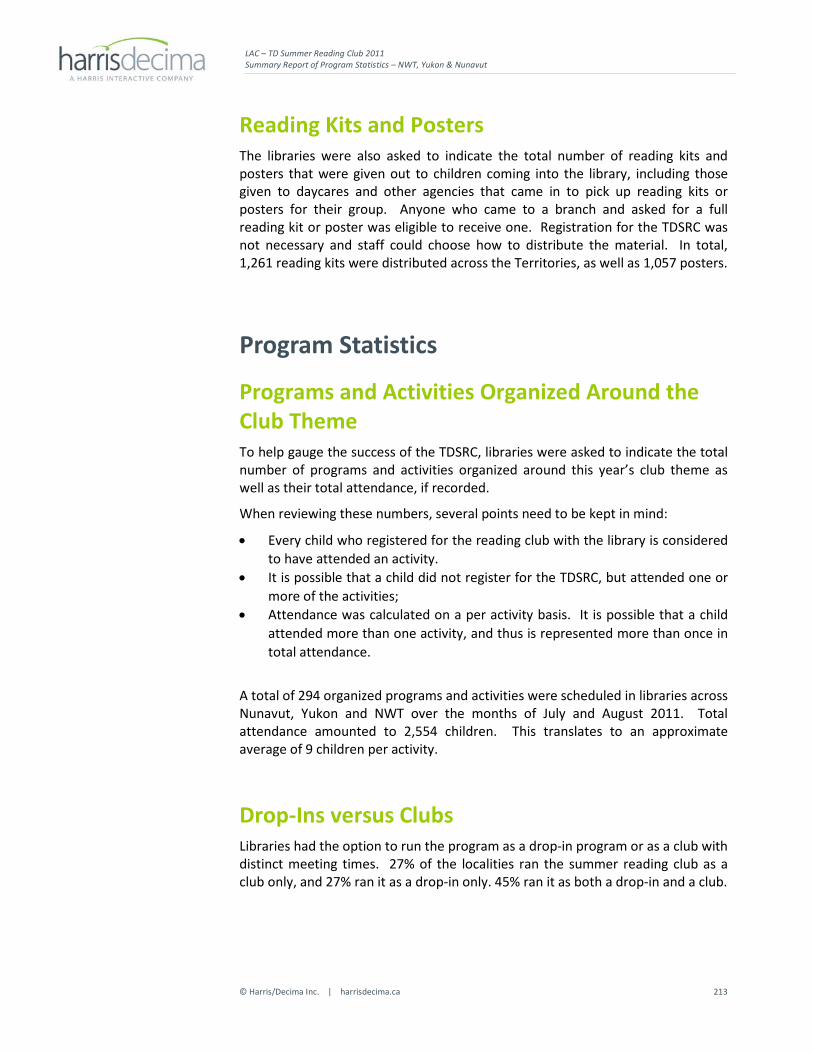
Reading Kits and Posters The libraries were also asked to indicate the total number of reading kits and posters that were given out to children coming into the library, including those given to daycares and other agencies that came in to pick up reading kits or posters for their group. Anyone who came to a branch and asked for a full reading kit or poster was eligible to receive one. Registration for the TDSRC was not necessary and staff could choose how to distribute the material.
In total, 283,973 reading kits were distributed across Canada in 2011 among the participating libraries, the highest number since 2006. However, 100,893 posters were given out, which is lower than it had been in the two previous years. The number of TDSRC materials handed out to children, teachers, daycare providers, parents and other caregivers totaled 384,866, down only slightly from last year.
Figure 6. Total Distribution of Reading Kits and Posters
95,168
256,370
351,538
100,770
257,463
358,233
99,251
272,300
371,551
121,350
274,170
395,520
118,813
266,746
385,559
100,893
283,973
384,866
0 100,000 200,000 300,000 400,000
Posters
Reading Kits
Total Distribution of Posters and Reading Kits
201120102009200820072006
Base: 2011: All localities that submitted results (n=1,819). Data is weighted to reflect all localities that participated in the TDSRC program (n=1,976). 2010: All localities that submitted results (n=1,762). Data is weighted to reflect all localities that participated in the TDSRC program (n=1,992). 2009: All localities that submitted results (n=1,718). Data is weighted to reflect all localities that participated in the TDSRC program (n=1,962). 2008: All localities that submitted results (n=1,611). Data is weighted to reflect all localities that participated in the TDSRC program (n=1,798). 2007: All localities that submitted results (n=1,585). Data is weighted to reflect all localities that participated in the TDSRC program (n=1,706). 2006: All localities that submitted results (n=1,650). Data is weighted to reflect all localities that participated in the TDSRC program (n=1,951). 2005: All library systems that submitted results (n=372). Data is weighted to reflect all systems that participated in the TDSRC program (n=432). Source: Q11. Total number of posters given out; Q12. Total number of reading kits given out.
LAC – TD Summer Reading Club 2011 Final Report of Program Statistics
Programs and Activities Organized Around the Club Theme To help gauge the success of the TDSRC, libraries were asked to indicate the total number of programs and activities organized around this year’s club theme as well as their total attendance.
When reviewing these numbers, several points need to be kept in mind:
• Every child who registered for the reading club with the library is considered to have attended an activity;
• It is possible that a child did not register for the TDSRC, but attended one or more of the activities; and
• Attendance was calculated on a per activity basis. It is possible that a child attended more than one activity, and thus is represented more than once in total attendance.
A total of 34,052 organized programs and activities were scheduled in libraries across Canada over the months of July and August 20117, from which a full 88% were organized inside libraries. Total attendance increased to 576,784 children, another increase over 2010. Approximately 17 children attended each activity.
Figure 10 on the following page shows the total attendance of programs and activities organized this year compared to the results obtained in previous years.
7 Many libraries did not enter this data. In this case, the total participation totals are substituted for attendance, and the number of activities was estimated using a ratio derived from all of the other libraries/systems that reported both pieces of information. Further, if libraries entered a total attendance number lower than their total participation number, the attendance was increased to match the registration total.
LAC – TD Summer Reading Club 2011 Final Report of Program Statistics
Figure 10. Organized Programs and Activities and Attendance
18,582
353,269
21,367
433,723
27,258
499,412
27,352
519,065
27,620
543,494
34,051
576,784
0 100,000 200,000 300,000 400,000 500,000 600,000
Total programs and activities organized around club theme
Total attendance
2011
2010
2009
2008
2007
2006
Average: 17 children per activity
Base: 2011: All localities that submitted results (n=1,819). Data is weighted to reflect all localities that participated in the TDSRC program (n=1,976). 2010: All localities that submitted results (n=1,762). Data is weighted to reflect all localities that participated in the TDSRC program (n=1,992). 2009: All localities that submitted results (n=1,718). Data is weighted to reflect all localities that participated in the TDSRC program (n=1,962). 2008: All library systems that submitted results: Q15A&Q15B (n=536); Q16A&Q16B (n=592). 2007: All library systems that submitted results: Q15A&Q16A (n=434); Q15B&Q16B (n=419). 2006: All localities that submitted results: Q18 (n=1,449); Q19 (1,407). 2005: All library systems that submitted results: Q18 (n=343); Q19 (n=324). Source: Q15A/Q16A. If recorded, total number of club programs/activities; Q15B/Q16B. If recorded, total attendance at programs/activities.
LAC – TD Summer Reading Club 2011 Final Report of Program Statistics
Figure 11 summarizes the total number of theme-related programs and activities, along with the total theme-related activity attendance. The average attendance to each activity is also shown by province and region.
Figure 11. Organized Programs and Activities and Attendance by Region
Base: 2011: All localities that submitted results (n=1,819). Data is weighted to reflect all localities that participated in the TDSRC program (n=1,976). 2010: All localities that submitted results (n=1,762). Data is weighted to reflect all localities that participated in the TDSRC program (n=1,992). 2009: All localities that submitted results (n=1,718). Data is weighted to reflect all localities that participated in the TDSRC program (n=1,962).
Source: Q15A/Q16A. If recorded, total number of club programs/activities; Q15B/Q16B. If recorded, total attendance at programs/activities. Q15C/Q16C. If recorded, total attendance at programs/activities for boys; Q15D/Q16D. If recorded, total attendance at programs/activities for girls.
LAC – TD Summer Reading Club 2011 Final Report of Program Statistics
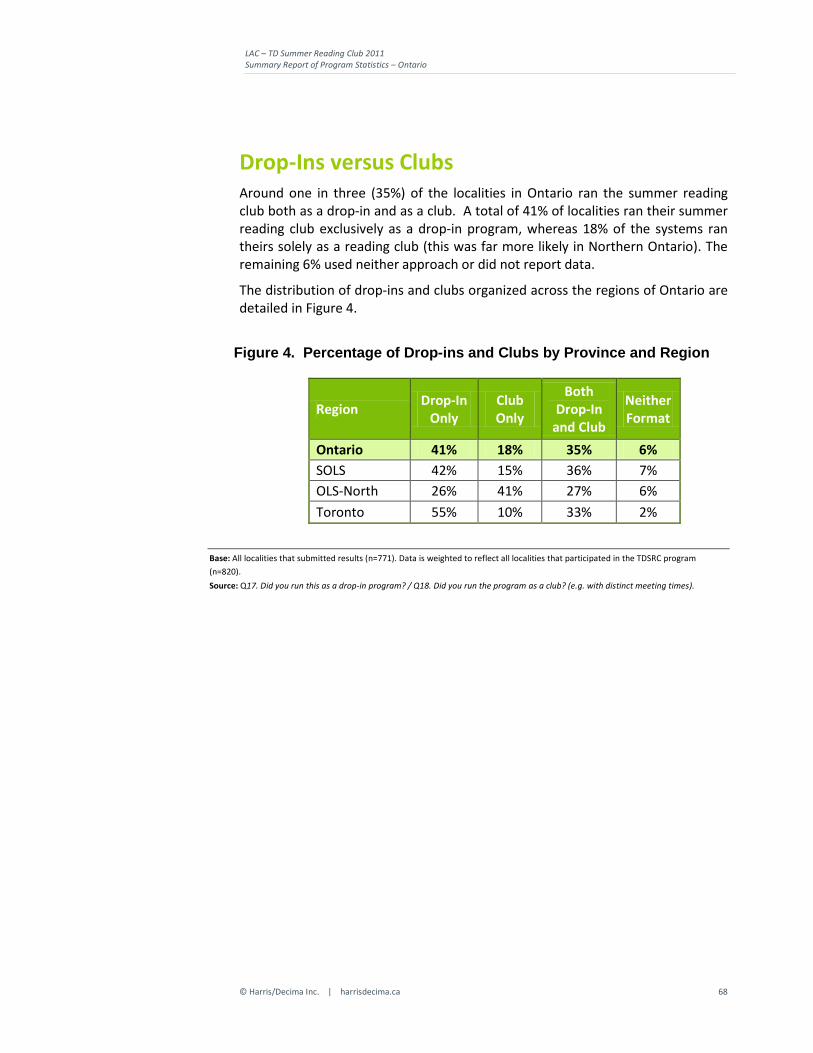
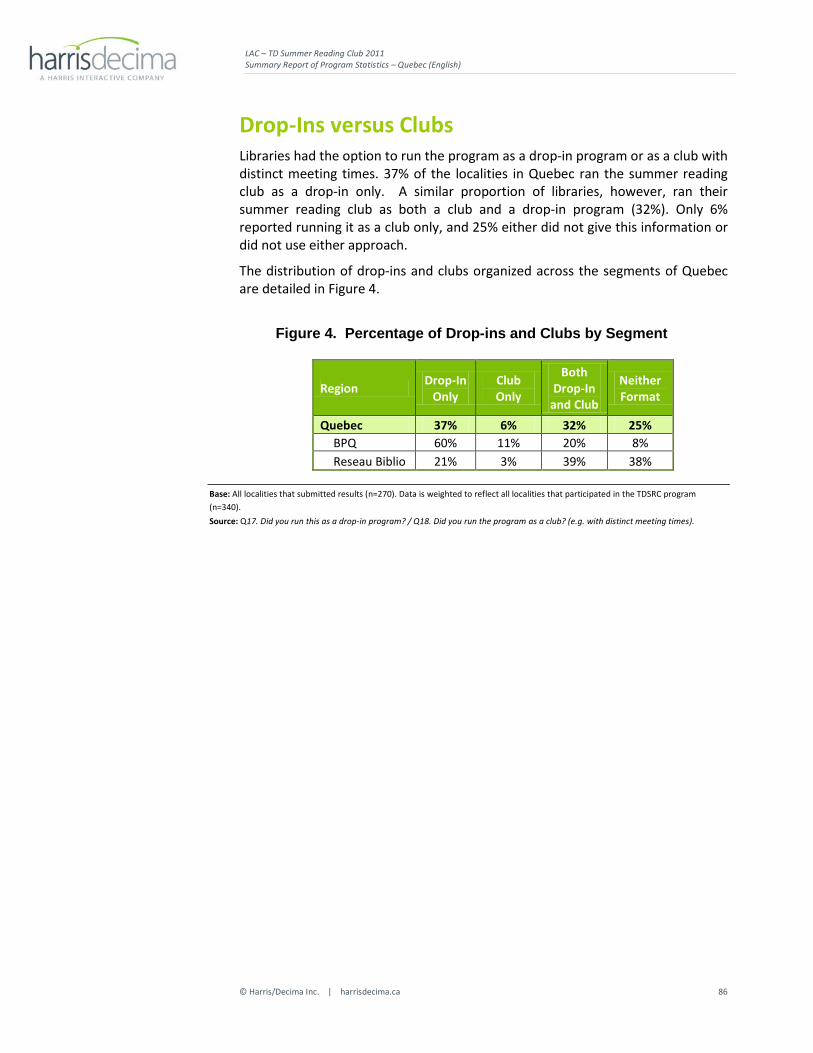
Drop-Ins versus Clubs Libraries had the option to run the program as a drop-in program or as a club with distinct meeting times. Overall, 39% of library systems ran their summer reading club exclusively as a drop-in program, whereas 13% of the systems ran theirs solely as a reading club. In 2011, 37% of libraries ran the summer reading club both as a drop-in and as a club, a slight drop from 2010 but still higher than in 2009. 11% did not indicate using either approach.
The proportion of libraries running the program as just a club (13%) continues on a downward trend going back to 2005. 2011 had the lowest proportion of libraries running their program as just a club in any year where this data was collected.
Figure 12. Percentage of Drop-ins and Clubs
Base: 2011: All localities that submitted results (n=1,819). Data is weighted to reflect all localities that participated in the TDSRC program (n=1,976). 2010: All localities that submitted results (n=1,762). Data is weighted to reflect all localities that participated in the TDSRC program (n=1,992). 2009: All localities that submitted results (n=1,718). Data is weighted to reflect all localities that participated in the TDSRC program (n=1,962). 2008: All localities that submitted results (n=1,611). Data is weighted to reflect all localities that participated in the TDSRC program (n=1,798). 2007: All localities that submitted results (n=1,585). Data is weighted to reflect all localities that participated in the TDSRC program (n=1,706). 2006: All localities that submitted results (n=1,650). Data is weighted to reflect all localities that participated in the TDSRC program (n=1,951). 2005: All library systems that submitted results (n=372). Data is weighted to reflect all systems that participated in the TDSRC program (n=432). Source: Q17. Did you run this as a drop-in program? / Q18. Did you run the program as a club? (e.g. with distinct meeting times).
LAC – TD Summer Reading Club 2011 Final Report of Program Statistics
Figure 13 summarizes the total percentage of libraries that ran the summer reading club as a drop-in only, a club only, or as both a drop-in and a club, by province and region. As in previous years, systems in Atlantic Canada were the most likely to run their program as a drop-in only (53%), whereas those in the West were the most likely to run their program as both a drop-in and a club (48%). Although the number of libraries reporting was small compared to other regions, the Territories were the most likely to run the program as only a club.
Figure 13. Percentage of Drop-ins and Clubs by Province and Region
Base: 2011: All localities that submitted results (n=1,819). Data is weighted to reflect all localities that participated in the TDSRC program (n=1,976). Source: Q17. Did you run this as a drop-in program? / Q18. Did you run the program as a club? (e.g. with distinct meeting times).
LAC – TD Summer Reading Club 2011 Final Report of Program Statistics
Program Successes Depending on how libraries implemented the program, they tracked the impact of their program on reading habits and learning using a variety of metrics. These included:
Total number of children who collected all nine stickers;
Total number of books reported on;
Total number of books read; and
Total number of hours read.
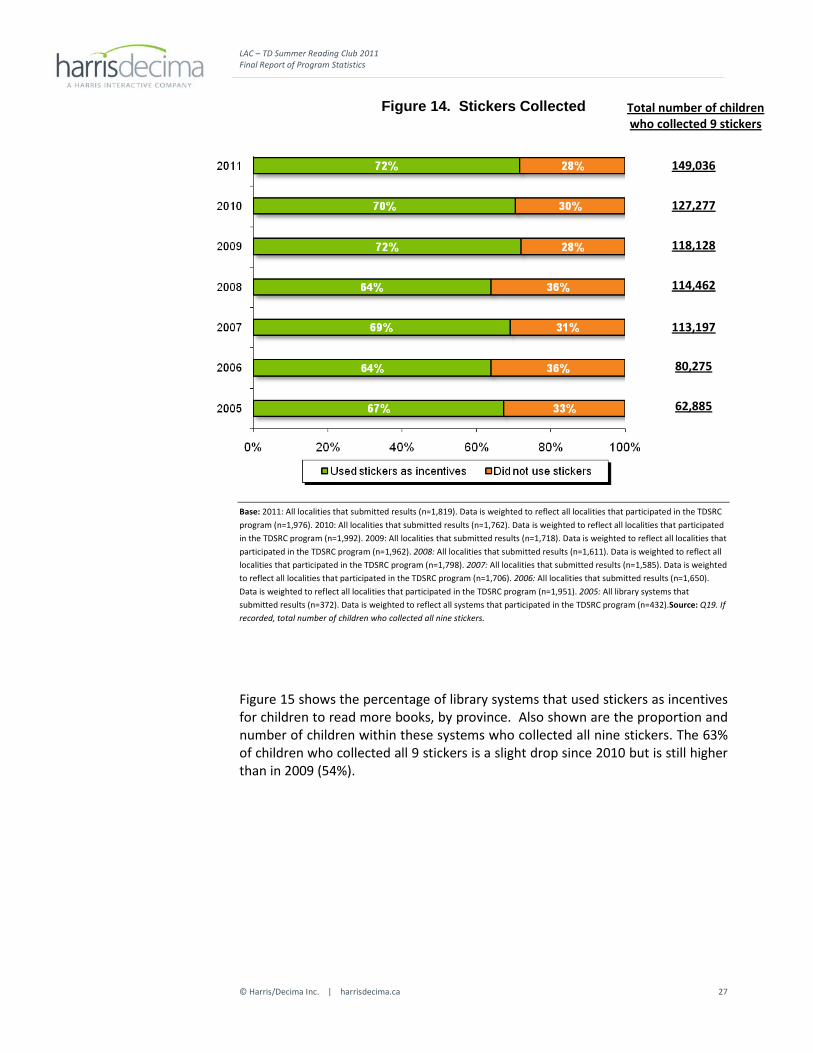
Stickers Collected Stickers were used by some of the libraries as incentives for children to read more books. The ultimate goal was to collect all nine stickers. In total, 72% of the library systems used stickers as incentives for children, a slight increase from 2010, but the same as 2009. Among these systems, approximately 149,036 children reached the target of collecting all nine stickers.
LAC – TD Summer Reading Club 2011 Final Report of Program Statistics
Base: 2011: All localities that submitted results (n=1,819). Data is weighted to reflect all localities that participated in the TDSRC program (n=1,976). 2010: All localities that submitted results (n=1,762). Data is weighted to reflect all localities that participated in the TDSRC program (n=1,992). 2009: All localities that submitted results (n=1,718). Data is weighted to reflect all localities that participated in the TDSRC program (n=1,962). 2008: All localities that submitted results (n=1,611). Data is weighted to reflect all localities that participated in the TDSRC program (n=1,798). 2007: All localities that submitted results (n=1,585). Data is weighted to reflect all localities that participated in the TDSRC program (n=1,706). 2006: All localities that submitted results (n=1,650). Data is weighted to reflect all localities that participated in the TDSRC program (n=1,951). 2005: All library systems that submitted results (n=372). Data is weighted to reflect all systems that participated in the TDSRC program (n=432).Source: Q19. If recorded, total number of children who collected all nine stickers.
Figure 15 shows the percentage of library systems that used stickers as incentives for children to read more books, by province. Also shown are the proportion and number of children within these systems who collected all nine stickers. The 63% of children who collected all 9 stickers is a slight drop since 2010 but is still higher than in 2009 (54%).
Total number of children who collected 9 stickers
149,036
127,277
118,128
114,462
113,197
80,275
62,885
LAC – TD Summer Reading Club 2011 Final Report of Program Statistics
Base: 2011: All localities that submitted results (n=1,819). Data is weighted to reflect all localities that participated in the TDSRC program (n=1,976). 2010: All localities that submitted results (n=1,762). Data is weighted to reflect all localities that participated in the TDSRC program (n=1,992). 2009: All localities that submitted results (n=1,718). Data is weighted to reflect all localities that participated in the TDSRC program (n=1,962).
Source: Q19. If recorded, total number of children who collected all nine stickers.
LAC – TD Summer Reading Club 2011 Final Report of Program Statistics
The average number of books read per child translates to a total of 2,309,975 books read as part of the summer reading club8. This is very similar to the number of books read in 2010, due largely to the increase in the number of registered participants given the average per child was actually lower than last year (8.2 vs. 9.2).
Figure 16. Average Program Participation Levels of Children
Base: 2011: All localities that submitted results (n=1,819). Data is weighted to reflect all localities that participated in the TDSRC program (n=1,976). 2010: All library systems that submitted results; Q20 (n=265); Q21 (n=305); Q22 (n=111). The total number of books read is weighted to reflect all localities that participated in the TDSRC program (n=1,992). 2009: All library systems that submitted results; Q20 (n=224); Q21 (n=262); Q22 (n=96). The total number of books read is weighted to reflect all localities that participated in the TDSRC program (n=1,962). 2008: All library systems that submitted results; Q20 (n=220); Q21 (n=272); Q22 (n=100). The total number of books read is weighted to reflect all localities that participated in the TDSRC program (n=1,798). Source: Q20. If recorded, total number of books reported on; Q21. If recorded, total number of books read; Q22. If recorded, total number of hours read.
8 Total number of books reported on and total hours read has not been extrapolated due to the low numbers of systems that provided this information.
LAC – TD Summer Reading Club 2011 Final Report of Program Statistics
The figure below depicts average number per child for the number of books reported on, the number of books read, and the number of hours read, by region. It also shows the total books read per region based on the national average of 8.2 books read per child. In general, the Atlantic region has a higher average of books read than other regions, a trend which continued in 2011.
Figure 17. Average Program Participation Levels of Children by Region
Base: 2011: All library systems that submitted results; Q20 (n=395); Q21 (n=314); Q22 (n=146). The total number of books read is weighted to reflect all localities that participated in the TDSRC program (n=1,976). Source: Q20. If recorded, total number of books reported on; Q21. If recorded, total number of books read; Q22. If recorded, total number of hours read.
LAC – TD Summer Reading Club 2011 Final Report of Program Statistics
Base: 2011: All library systems that submitted results; Q21 (n=314). 2010: All library systems that submitted results; Q21 (n=305). 2009: All library systems that submitted results; Q21 (n=262). 2008: All library systems that submitted results; Q21 (n=272). 2007: All library systems that submitted results; Q21 (n=256). 2006: All localities that submitted results; Q26 (n=768). 2005: All library systems that submitted results; Q26 (n=175). Source: Q21. If recorded, total number of books read. Note: Nunavut did not submit any results for this question.
LAC – TD Summer Reading Club 2011 Final Report of Program Statistics
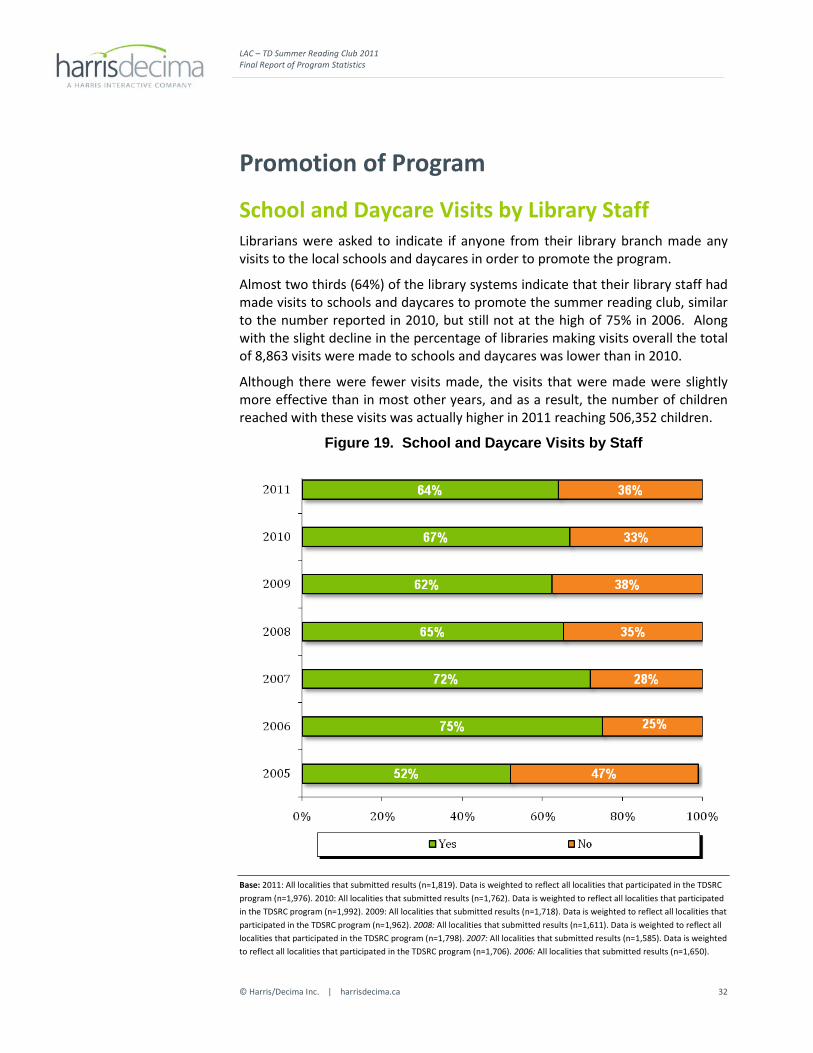
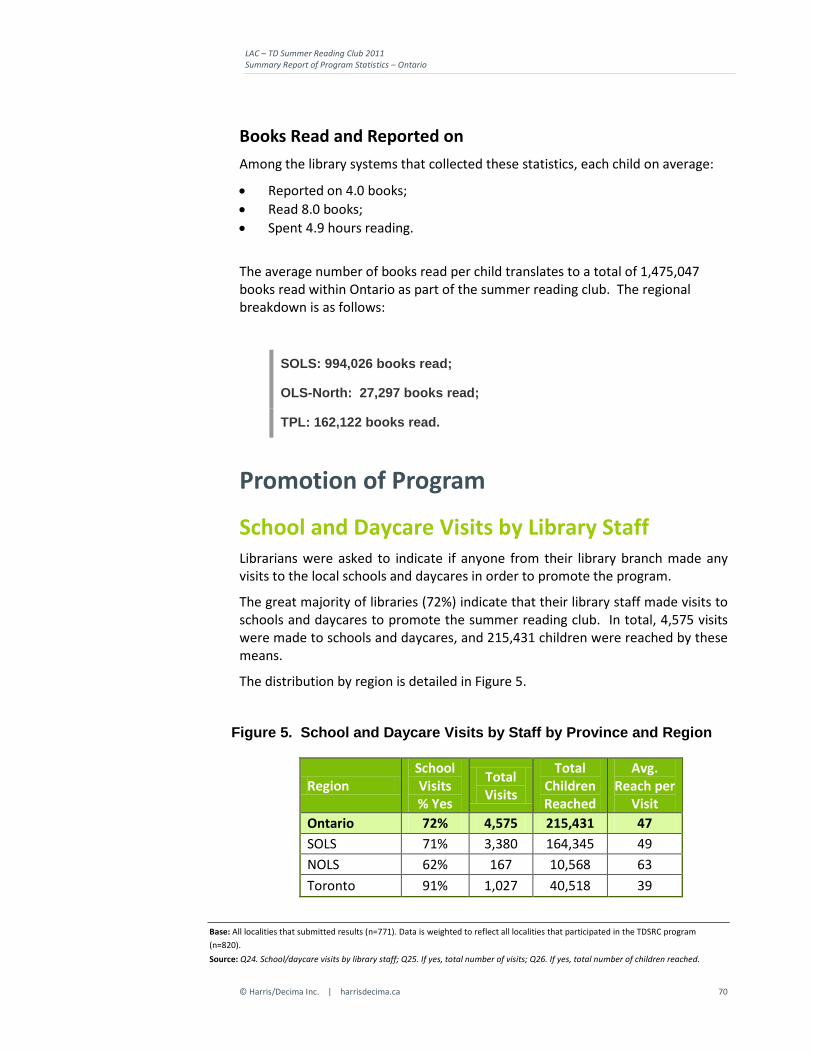
School and Daycare Visits by Library Staff Librarians were asked to indicate if anyone from their library branch made any visits to the local schools and daycares in order to promote the program.
Almost two thirds (64%) of the library systems indicate that their library staff had made visits to schools and daycares to promote the summer reading club, similar to the number reported in 2010, but still not at the high of 75% in 2006. Along with the slight decline in the percentage of libraries making visits overall the total of 8,863 visits were made to schools and daycares was lower than in 2010.
Although there were fewer visits made, the visits that were made were slightly more effective than in most other years, and as a result, the number of children reached with these visits was actually higher in 2011 reaching 506,352 children.
Figure 19. School and Daycare Visits by Staff
Base: 2011: All localities that submitted results (n=1,819). Data is weighted to reflect all localities that participated in the TDSRC program (n=1,976). 2010: All localities that submitted results (n=1,762). Data is weighted to reflect all localities that participated in the TDSRC program (n=1,992). 2009: All localities that submitted results (n=1,718). Data is weighted to reflect all localities that participated in the TDSRC program (n=1,962). 2008: All localities that submitted results (n=1,611). Data is weighted to reflect all localities that participated in the TDSRC program (n=1,798). 2007: All localities that submitted results (n=1,585). Data is weighted to reflect all localities that participated in the TDSRC program (n=1,706). 2006: All localities that submitted results (n=1,650).
LAC – TD Summer Reading Club 2011 Final Report of Program Statistics
Data is weighted t o reflect all localities that participated in the TDSRC program (n=1,951). 2005: All library systems that submitted results (n=372). Data is weighted to reflect all systems that participated in the TDSRC program (n=432). Source: Q24. School/daycare visits by library staff; Q25. If yes, total number of visits; Q26. If yes, total number of children reached.
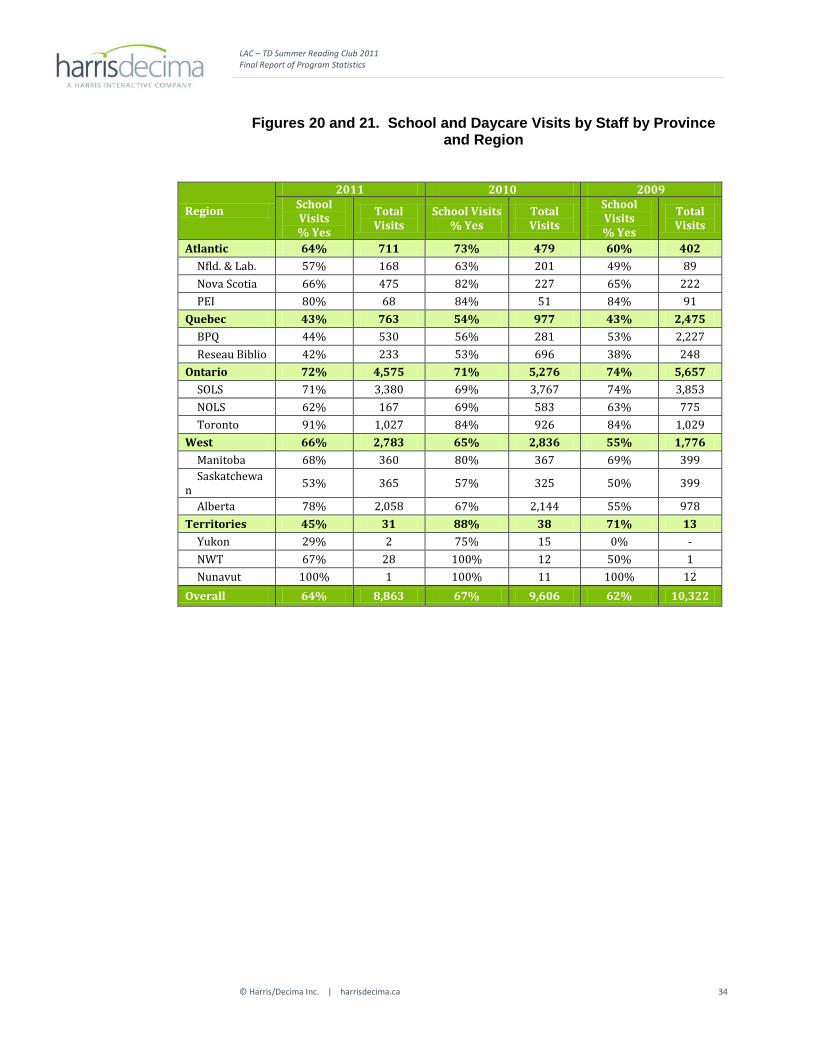
The tables on the following pages summarize the percentage of library systems whose staff had made visits to schools and daycares, by province and region. Also shown is the total number of visits as well as the total number of children reached. The average “success” per visit is calculated, summarizing the total number of children reached based on the number of visits made. A national average of 51 children were reached per visit made to schools and daycares, a moderate increase over last year, but still below the high in 2008 (59 children per visit).
LAC – TD Summer Reading Club 2011 Final Report of Program Statistics
Base: 2011: All localities that submitted results (n=1,819). Data is weighted to reflect all localities that participated in the TDSRC program (n=1,976). 2010: All localities that submitted results (n=1,762). Data is weighted to reflect all localities that participated in the TDSRC program (n=1,992). 2009: All localities that submitted results (n=1,718). Data is weighted to reflect all localities that participated in the TDSRC program (n=1,962). Source: Q24. School/daycare visits by library staff; Q25. If yes, total number of visits; Q26. If yes, total number of children reached.
LAC – TD Summer Reading Club 2011 Final Report of Program Statistics
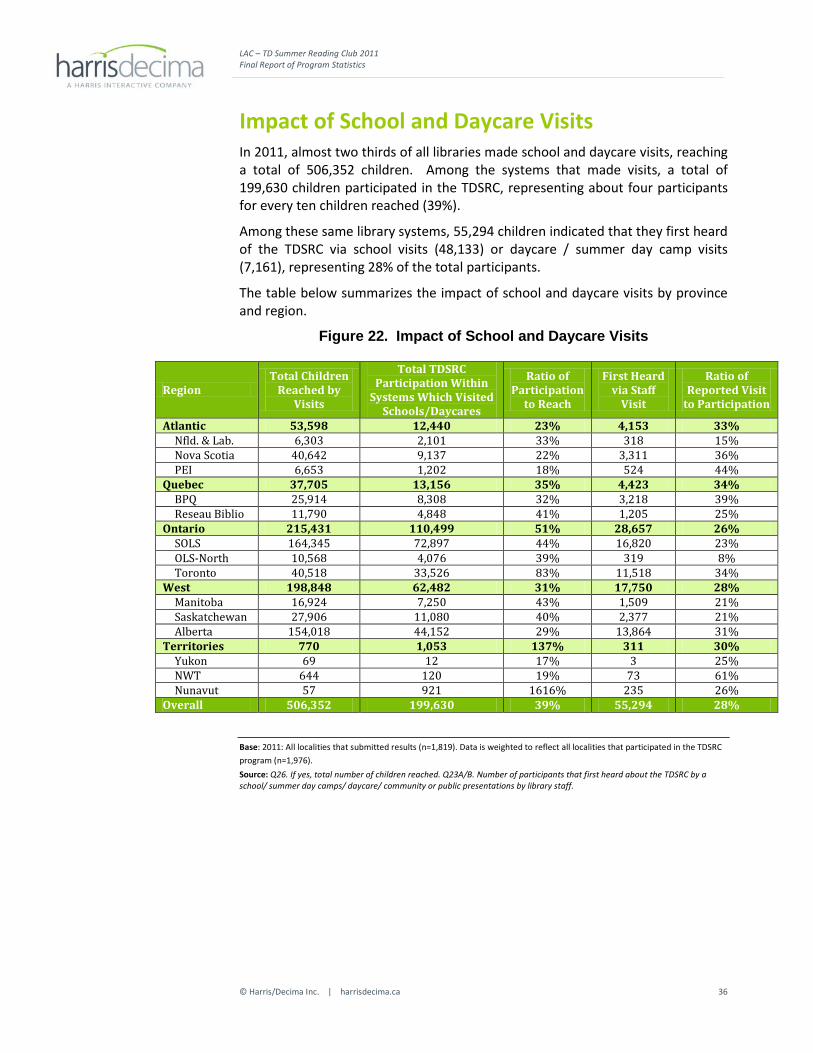
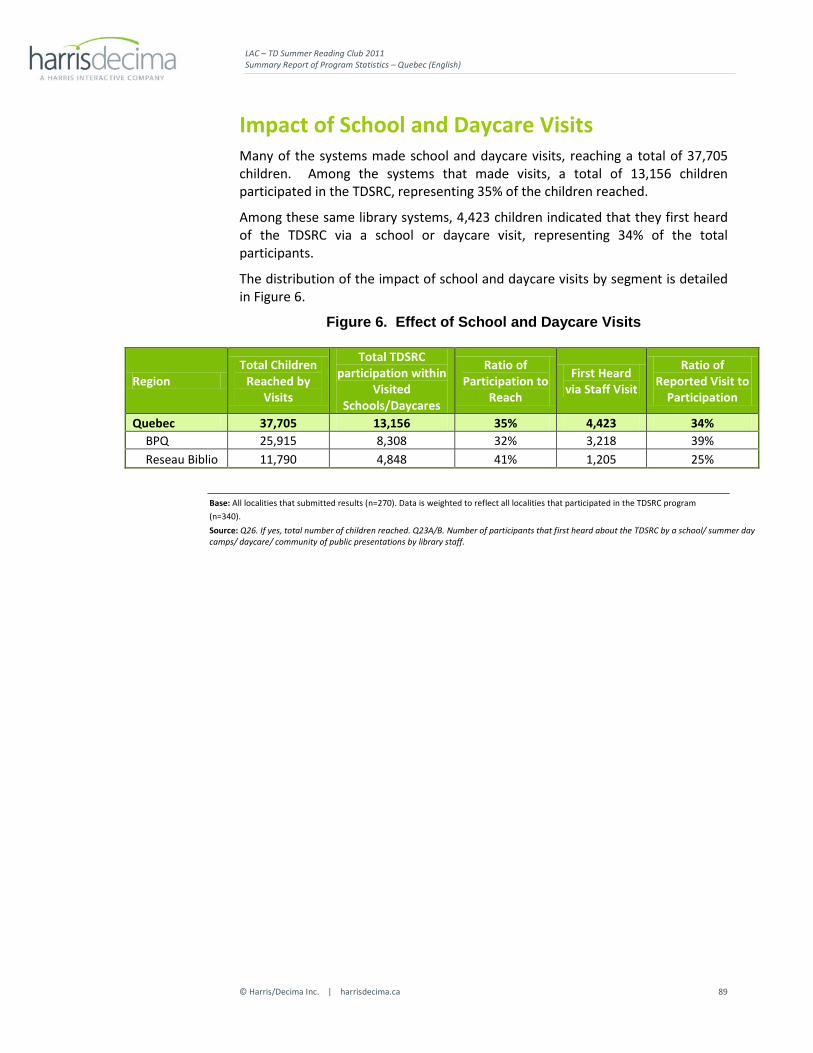
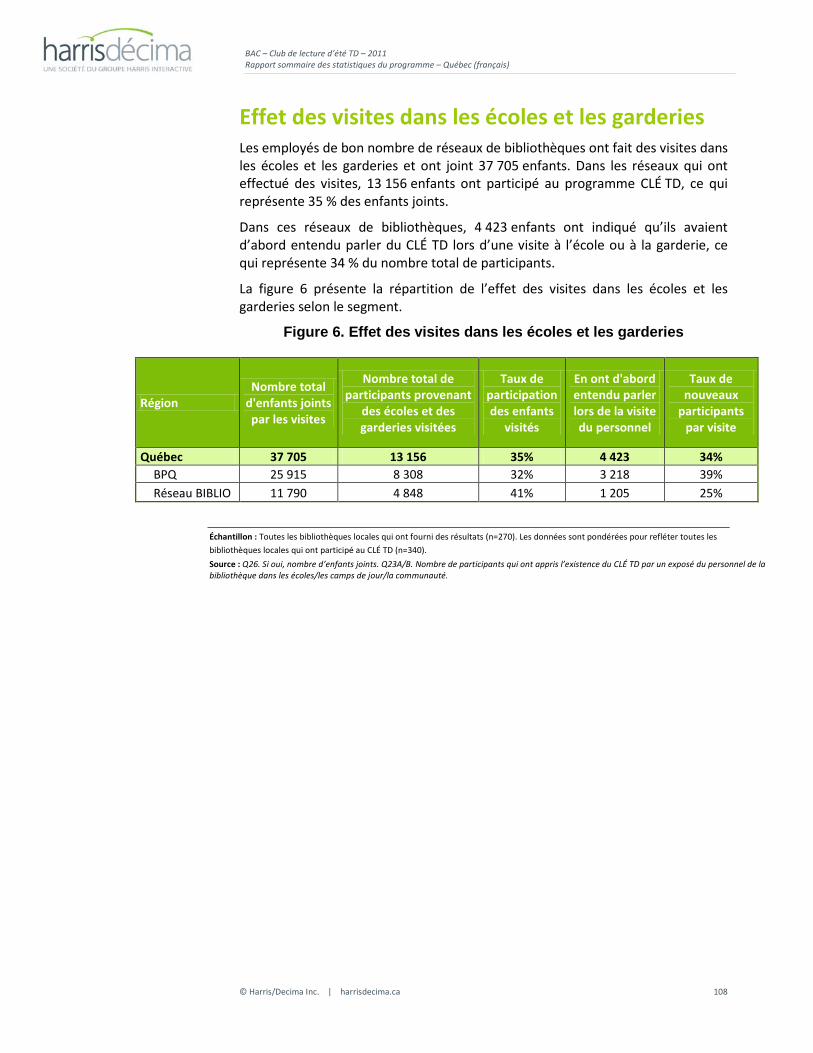
Impact of School and Daycare Visits In 2011, almost two thirds of all libraries made school and daycare visits, reaching a total of 506,352 children. Among the systems that made visits, a total of 199,630 children participated in the TDSRC, representing about four participants for every ten children reached (39%).
Among these same library systems, 55,294 children indicated that they first heard of the TDSRC via school visits (48,133) or daycare / summer day camp visits (7,161), representing 28% of the total participants.
The table below summarizes the impact of school and daycare visits by province and region.
Base: 2011: All localities that submitted results (n=1,819). Data is weighted to reflect all localities that participated in the TDSRC program (n=1,976). Source: Q26. If yes, total number of children reached. Q23A/B. Number of participants that first heard about the TDSRC by a school/ summer day camps/ daycare/ community or public presentations by library staff.
LAC – TD Summer Reading Club 2011 Final Report of Program Statistics
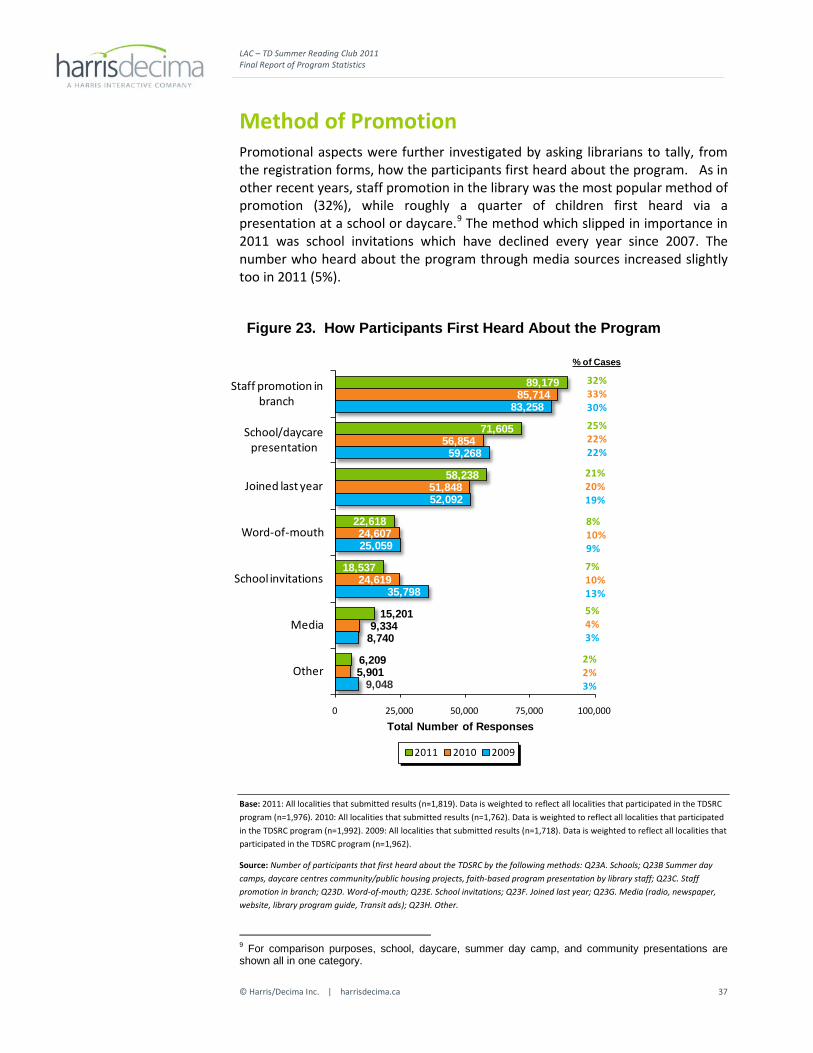
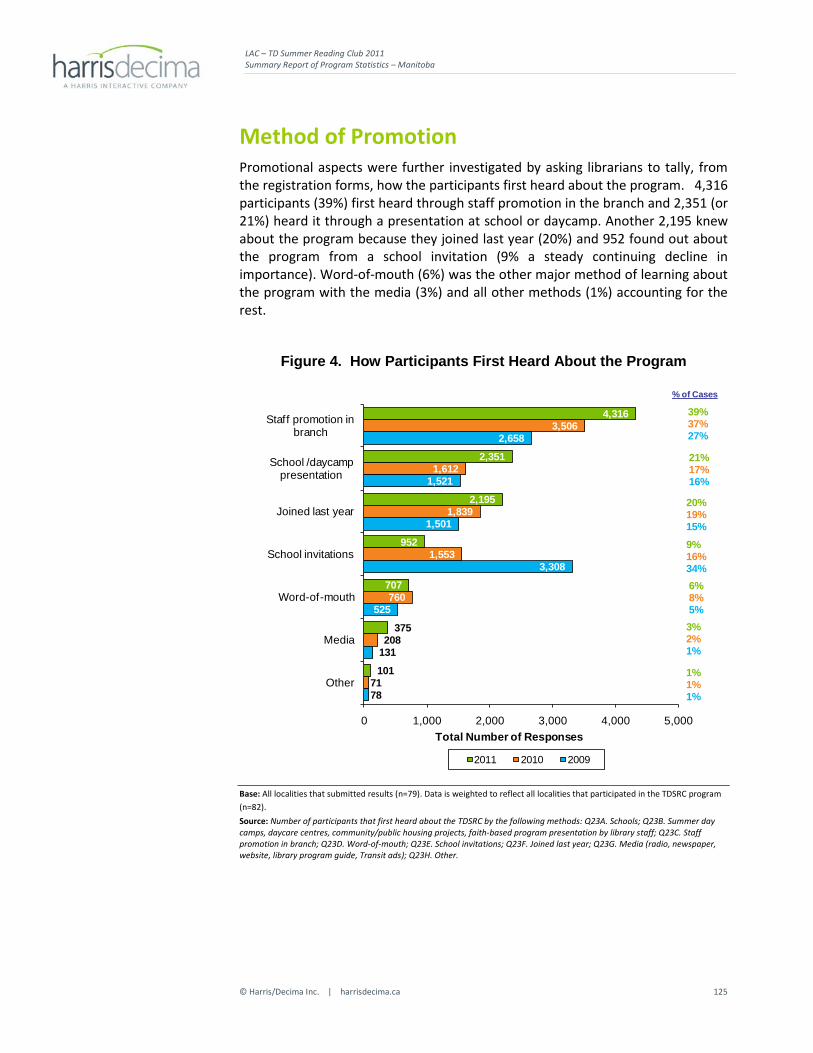
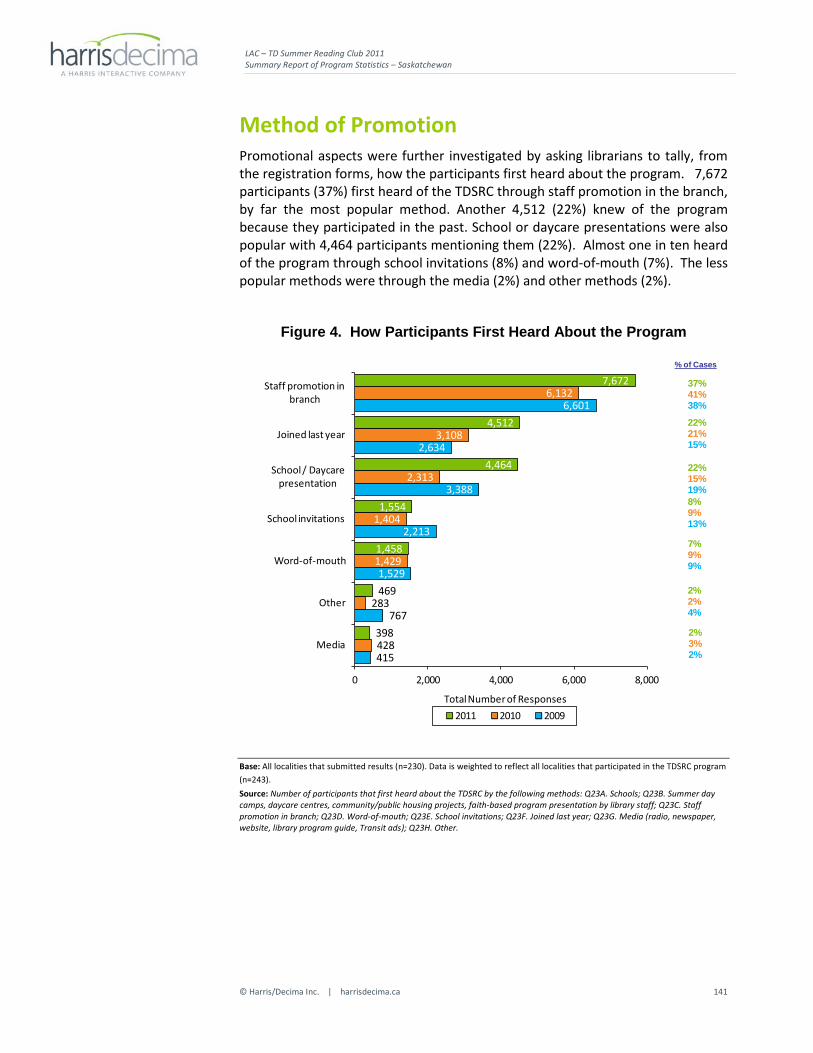
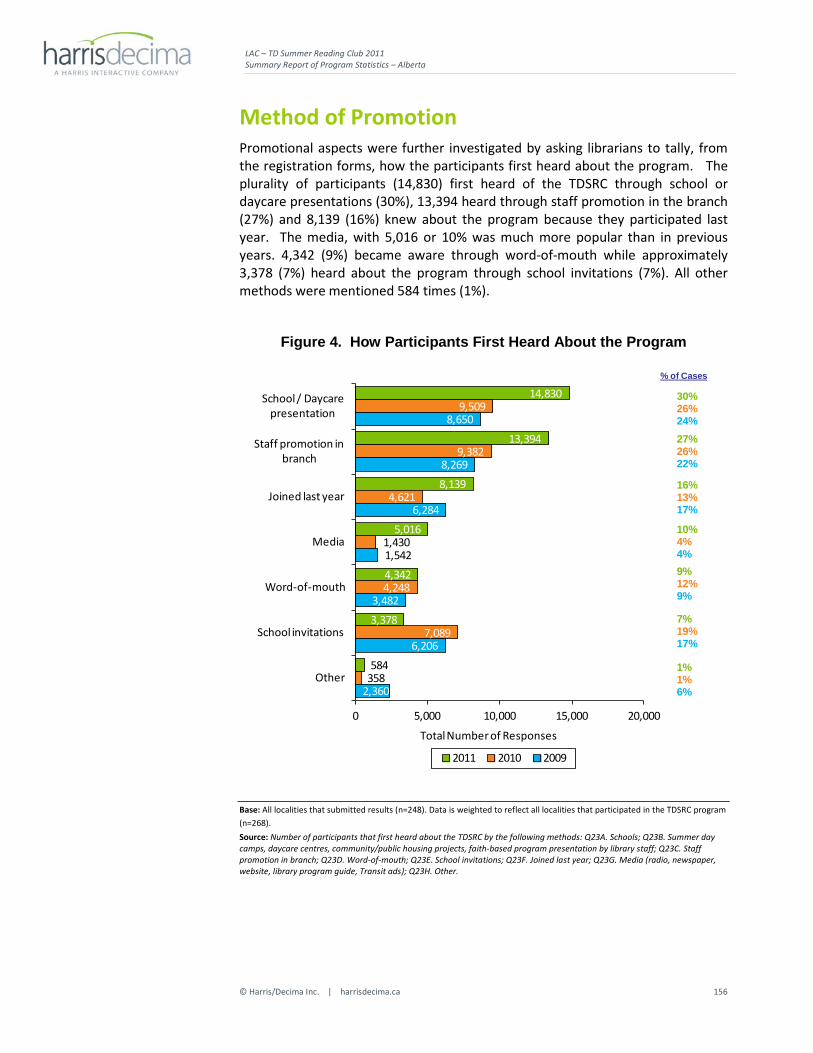
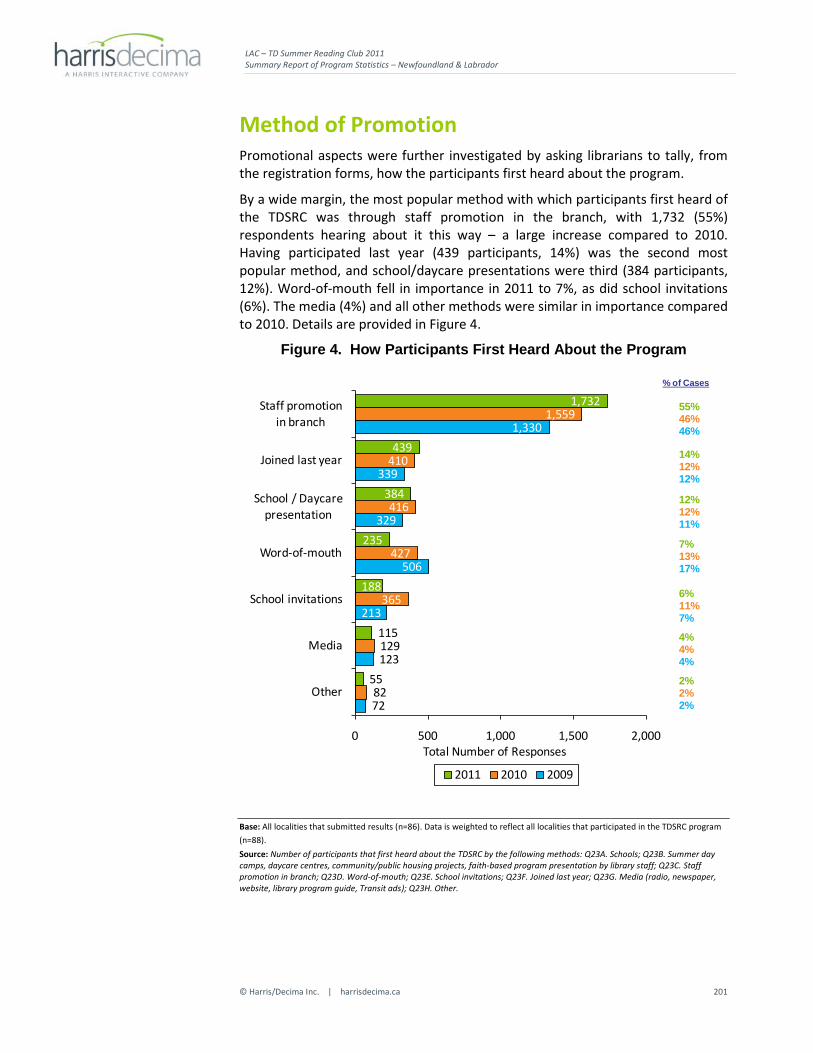
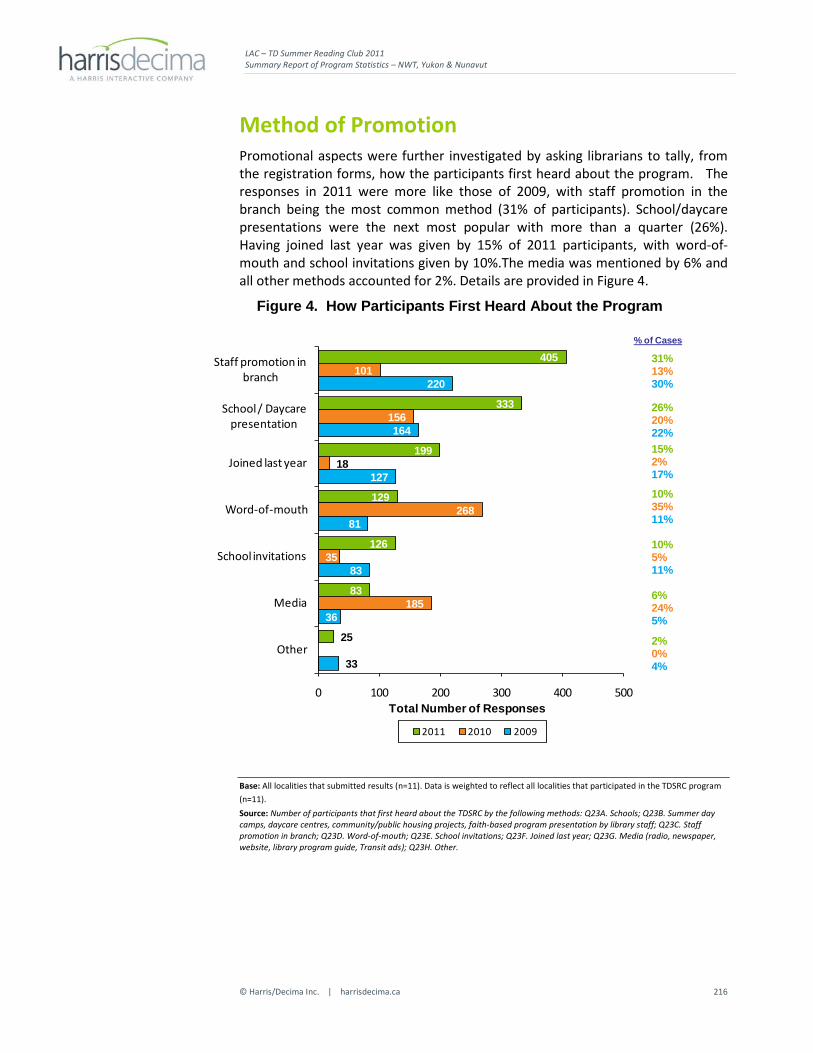
Method of Promotion Promotional aspects were further investigated by asking librarians to tally, from the registration forms, how the participants first heard about the program. As in other recent years, staff promotion in the library was the most popular method of promotion (32%), while roughly a quarter of children first heard via a presentation at a school or daycare.9 The method which slipped in importance in 2011 was school invitations which have declined every year since 2007. The number who heard about the program through media sources increased slightly too in 2011 (5%).
Figure 23. How Participants First Heard About the Program
89,179
71,605
58,238
22,618
18,537
15,201
6,209
85,714
56,854
51,848
24,607
24,619
9,334
5,901
83,258
59,268
52,092
25,059
35,798
8,740
9,048
0 25,000 50,000 75,000 100,000
Staff promotion in branch
School/daycare presentation
Joined last year
Word-of-mouth
School invitations
Media
Other
Total Number of Responses
2011 2010 2009
32%33%30%
25%22%22%
21%20%19%
8%10%9%
7%10%13%5%4%3%
2%2%3%
% of Cases
Base: 2011: All localities that submitted results (n=1,819). Data is weighted to reflect all localities that participated in the TDSRC program (n=1,976). 2010: All localities that submitted results (n=1,762). Data is weighted to reflect all localities that participated in the TDSRC program (n=1,992). 2009: All localities that submitted results (n=1,718). Data is weighted to reflect all localities that participated in the TDSRC program (n=1,962).
Source: Number of participants that first heard about the TDSRC by the following methods: Q23A. Schools; Q23B Summer day camps, daycare centres community/public housing projects, faith-based program presentation by library staff; Q23C. Staff promotion in branch; Q23D. Word-of-mouth; Q23E. School invitations; Q23F. Joined last year; Q23G. Media (radio, newspaper, website, library program guide, Transit ads); Q23H. Other.
9 For comparison purposes, school, daycare, summer day camp, and community presentations are shown all in one category.
LAC – TD Summer Reading Club 2011 Final Report of Program Statistics
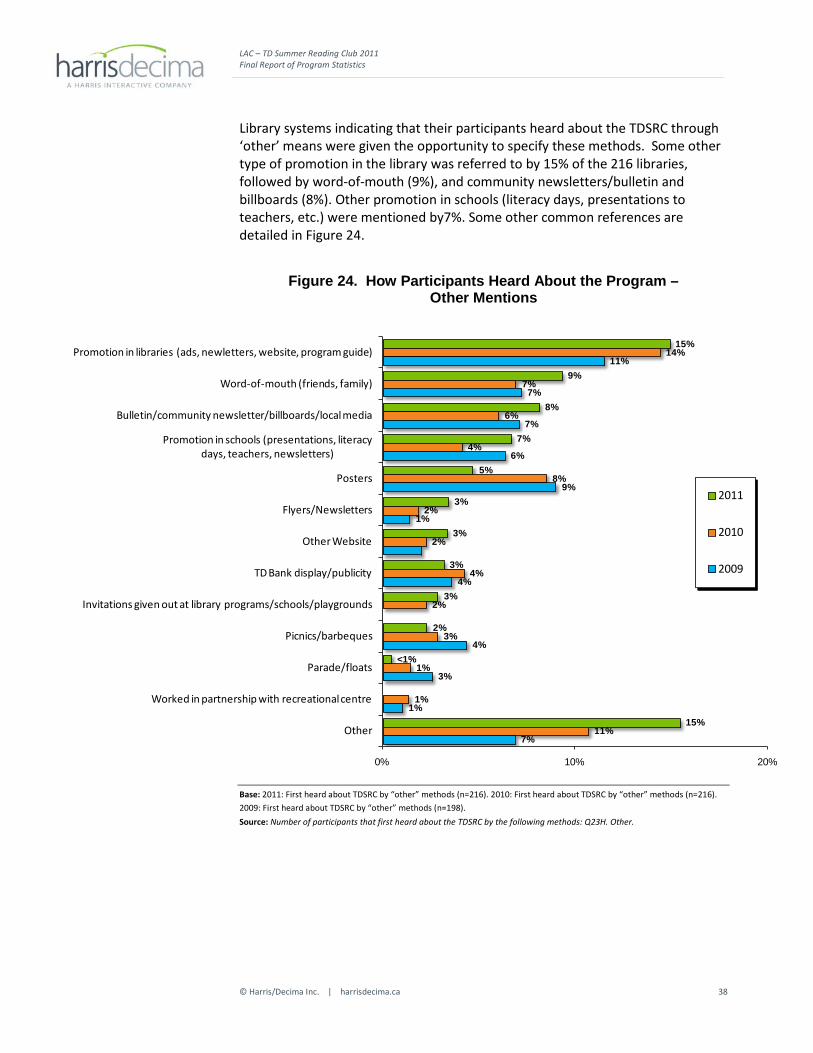
Library systems indicating that their participants heard about the TDSRC through ‘other’ means were given the opportunity to specify these methods. Some other type of promotion in the library was referred to by 15% of the 216 libraries, followed by word-of-mouth (9%), and community newsletters/bulletin and billboards (8%). Other promotion in schools (literacy days, presentations to teachers, etc.) were mentioned by7%. Some other common references are detailed in Figure 24.
Figure 24. How Participants Heard About the Program – Other Mentions
15%
9%
8%
7%
5%
3%
3%
3%
3%
2%
<1%
15%
14%
7%
6%
4%
8%
2%
2%
4%
2%
3%
1%
1%
11%
11%
7%
7%
6%
9%
1%
4%
4%
3%
1%
7%
0% 10% 20%
Promotion in libraries (ads, newletters, website, program guide)
Word-of-mouth (friends, family)
Bulletin/community newsletter/billboards/local media
Promotion in schools (presentations, literacy days, teachers, newsletters)
Posters
Flyers/Newsletters
Other Website
TD Bank display/publicity
Invitations given out at library programs/schools/playgrounds
Picnics/barbeques
Parade/floats
Worked in partnership with recreational centre
Other
2011
2010
2009
Base: 2011: First heard about TDSRC by “other” methods (n=216). 2010: First heard about TDSRC by “other” methods (n=216). 2009: First heard about TDSRC by “other” methods (n=198). Source: Number of participants that first heard about the TDSRC by the following methods: Q23H. Other.
LAC – TD Summer Reading Club 2011 Final Report of Program Statistics
Figure 25 depicts total numbers by province for the number of people who first heard of the program through the various channels.
Figure 25. How Participants Heard About the Program Summary by Region (Totals)
Base: All localities that submitted results (n=1,819). Data is weighted to reflect all localities that participated in the TDSRC program (n=1,976). Source: Number of participants that first heard about the TDSRC by the following methods: Q23A. Schools; Q23B. Summer day camps, daycare centres, community/public housing projects, faith-based programs presentations by library staff; Q23C. Staff promotion in branch; Q23D. Word-of-mouth; Q23E. School invitations; Q23F. Joined last year; Q23G. Media (radio, newspaper, website, library program guide, Transit ads); Q23H. Other.
Figure 26 provides the same information as displayed in Figure 25 in percentages, to show the prevalence of certain promotional techniques within each region. Staff promotion in the branch is still the most popular way for people to hear about the program everywhere except Quebec, where school presentations were more important. Certain techniques were relatively more successful in specific regions as well. For example, school invitations played a bigger role in Quebec than elsewhere and having joined last year was more important in Atlantic Canada.
Figure 26. How Participants Heard About the Program Summary by Region (Percentages)
Base: All localities that submitted results (n=1,819). Data is weighted to reflect all localities that participated in the TDSRC program (n=1,976). Source: Number of participants that first heard about the TDSRC by the following methods: Q23A. Schools; Q23B. Summer day camps, daycare centres, community/public housing projects, faith-based programs presentations by library staff; Q23C. Staff promotion in branch; Q23D. Word-of-mouth; Q23E. School invitations; Q23F. Joined last year; Q23G. Media (radio, newspaper, website, library program guide, Transit ads); Q23H. Other.
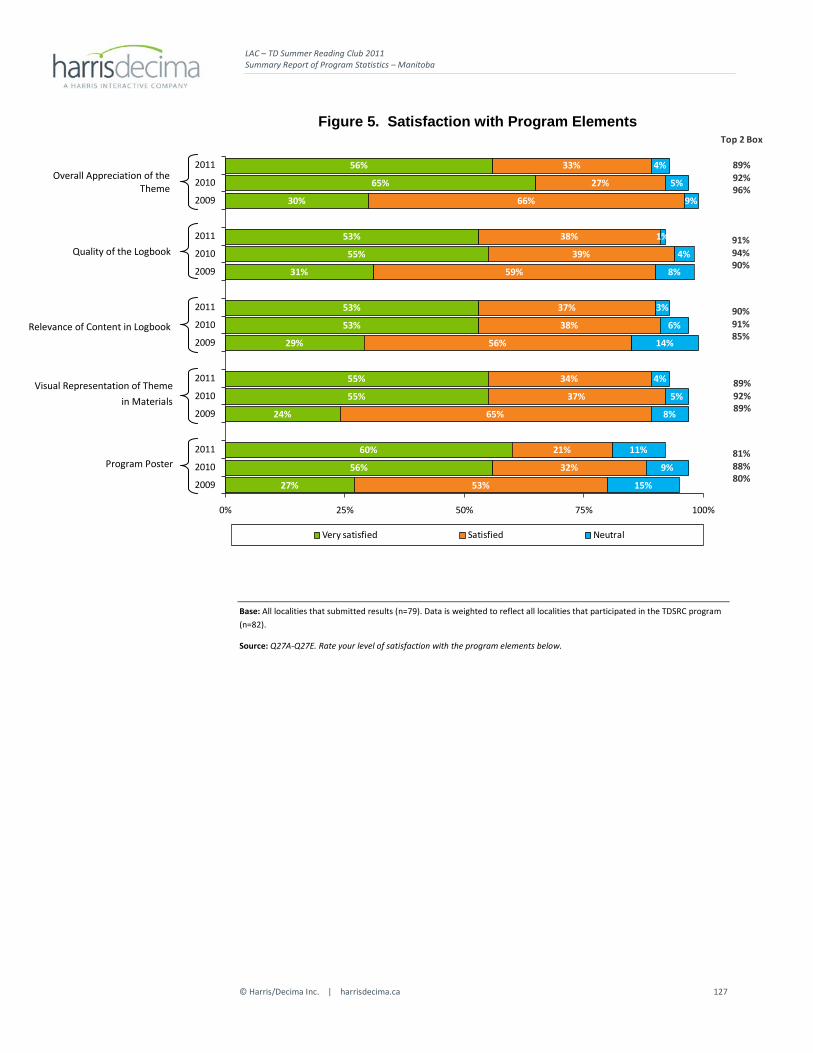
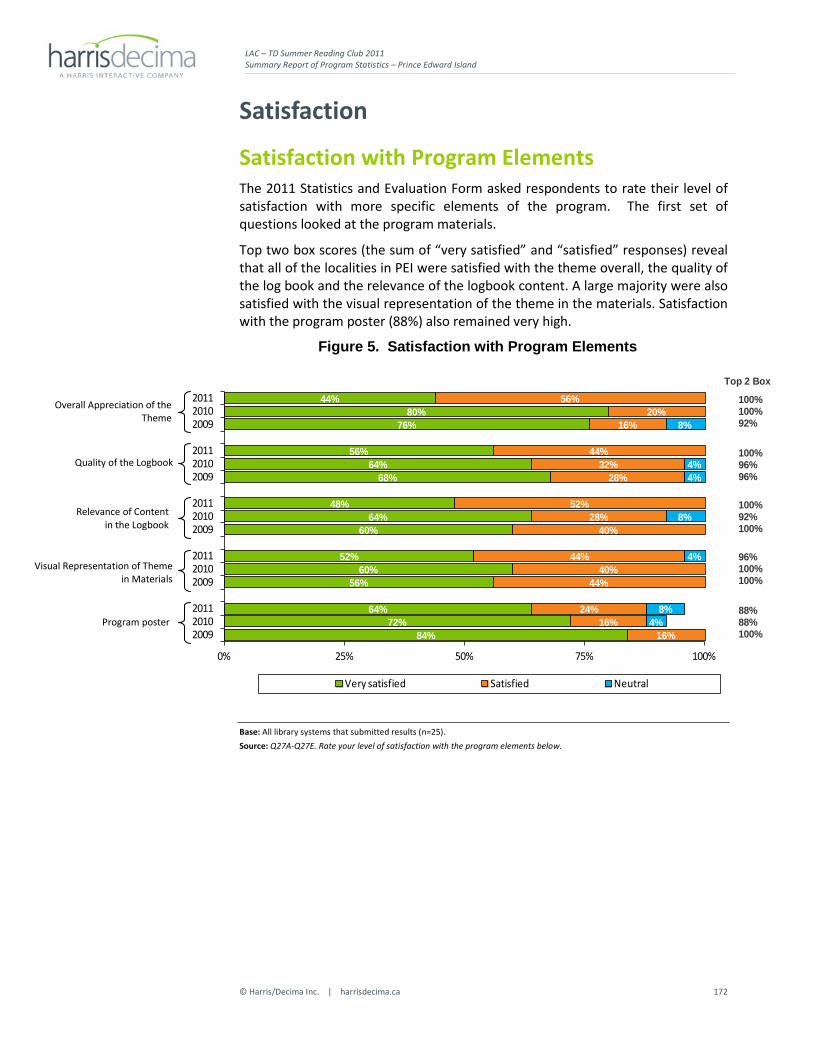
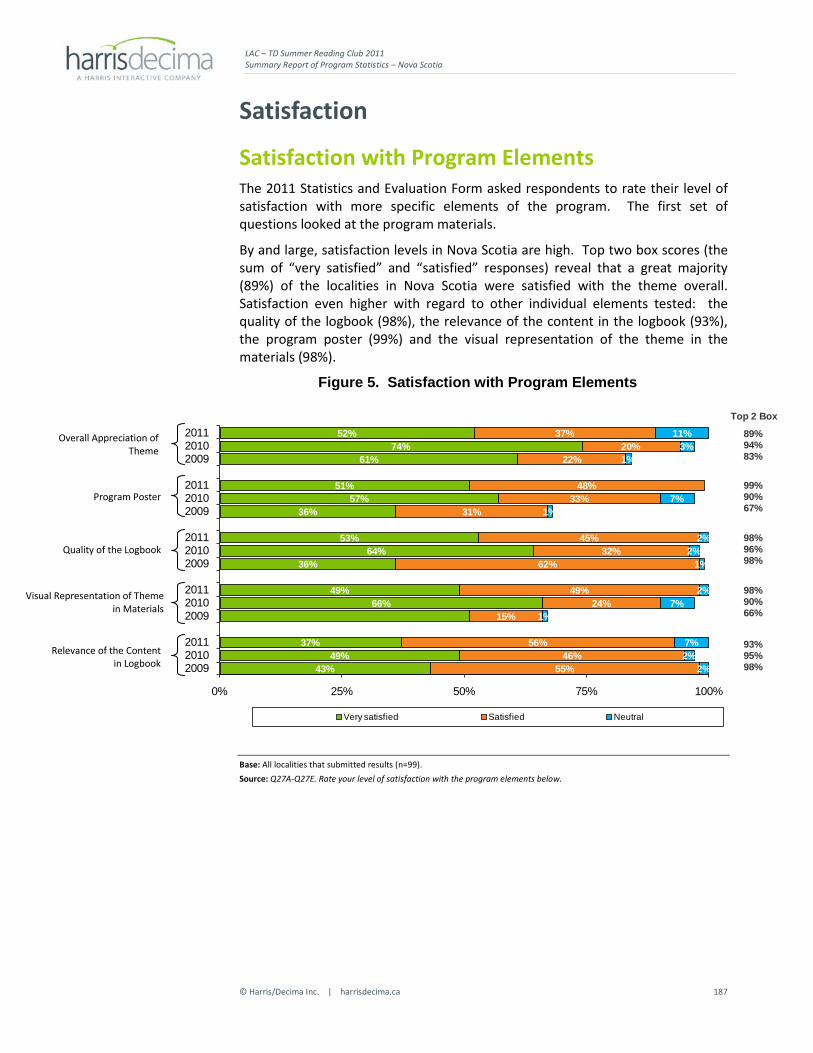
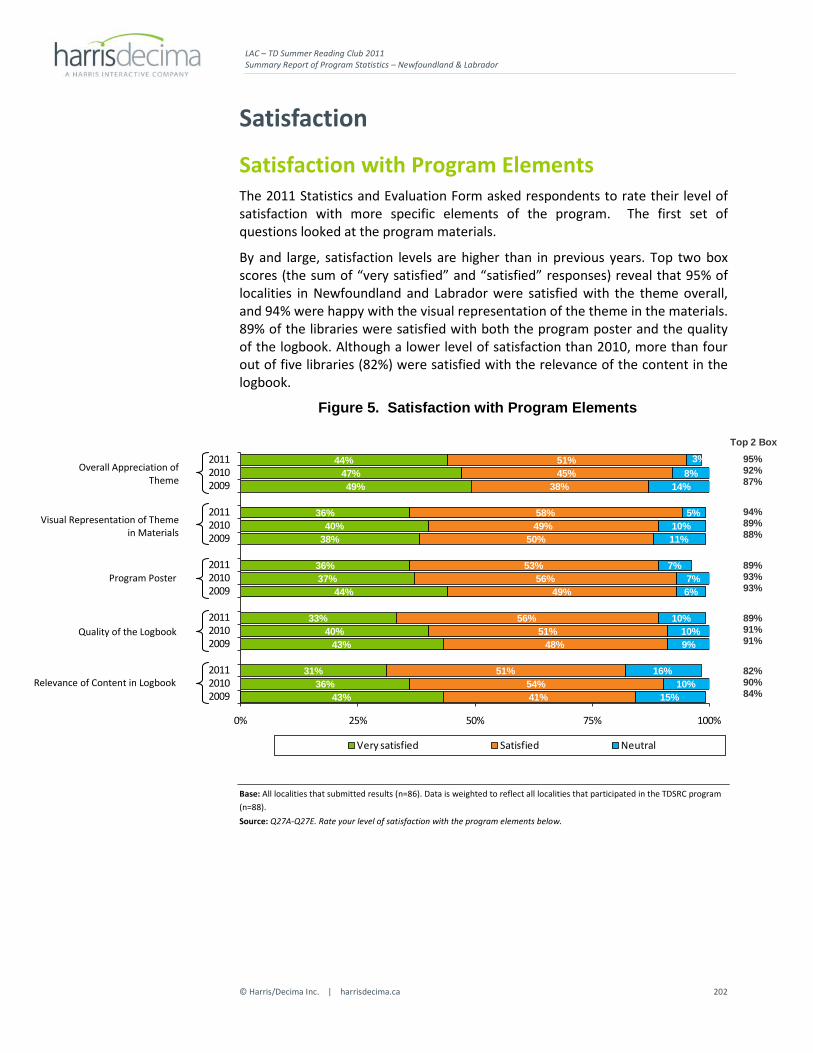
Overall Satisfaction The 2011 Statistics and Evaluation Form asked respondents to rate their level of satisfaction with specific elements of the program. The first set of questions looked at the program materials.
Satisfaction levels are largely consistent with previous years and remain very high. Top two box scores (the sum of “very satisfied” and “satisfied” responses) reveal that 94% of all libraries were satisfied with the theme in 2011, 93% were satisfied with the quality of the logbook and 92% with the visual representation of the theme in the materials. 91% were satisfied with the program poster (a 4% increase over 2010) and with the relevance of the content of the logbook.
Figure 27. Satisfaction with Program Elements
54%63%
51%
50%52%
44%
51%50%
42%
52%49%
43%
46%48%
41%
40%32%
41%
43%42%
48%
41%42%
46%
39%38%
41%
45%44%
48%
5%4%
5%
6%5%
7%
6%5%
9%
6%8%
11%
8%7%
10%
0% 25% 50% 75% 100%
201120102009
201120102009
201120102009
201120102009
201120102009
Very satisfied Satisfied Neutral
Top 2 Box
93%94%92%
94%95%91%
92%92%88%
91%87%84%
91%92%89%
Base: 2011: All localities that submitted results (n=1,819). Data is weighted to reflect all localities that participated in the TDSRC program (n=1,976). 2010: All localities that submitted results (n=1,762). Data is weighted to reflect all localities that participated in the TDSRC program (n=1,992). 2009: All localities that submitted results (n=1,718). Data is weighted to reflect all localities that participated in the TDSRC program (n=1,962). Source: Q27A-Q27E. Rate your level of satisfaction with the program elements below.
Relevance of Content in Logbook
Visual Representation of the Theme in the Materials
Quality of the Logbook
Program Poster
Overall Appreciation of the Theme
LAC – TD Summer Reading Club 2011 Final Report of Program Statistics
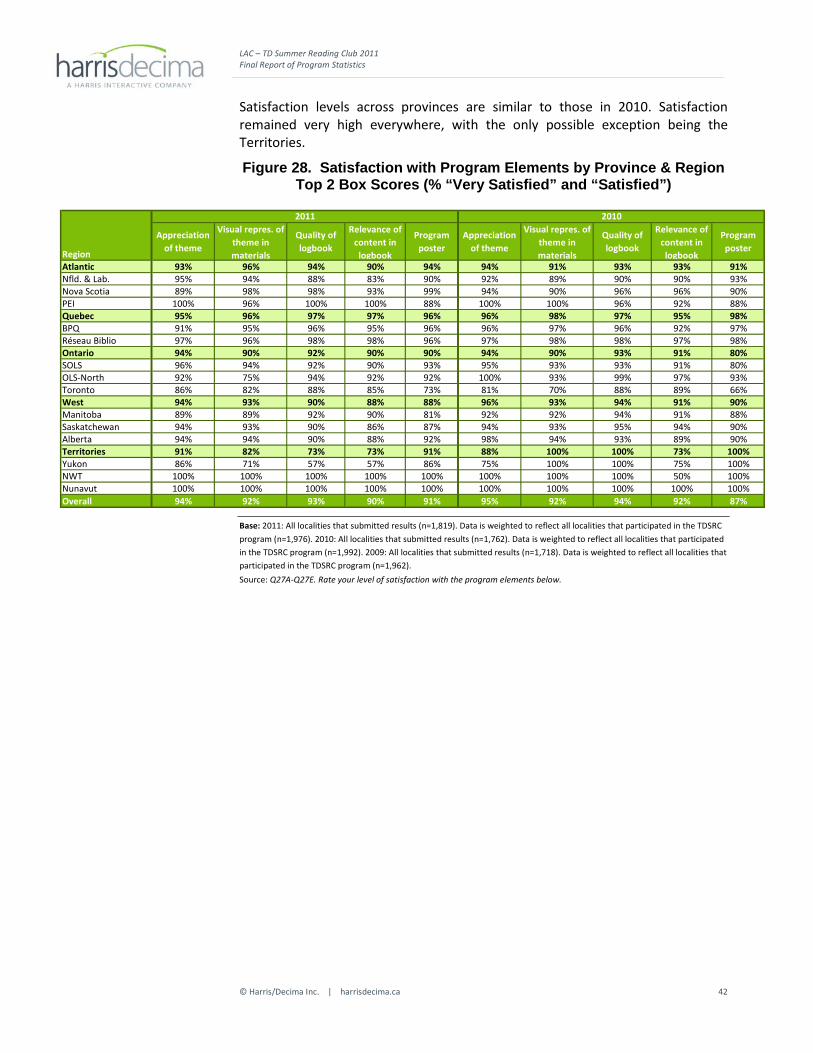
Satisfaction levels across provinces are similar to those in 2010. Satisfaction remained very high everywhere, with the only possible exception being the Territories.
Figure 28. Satisfaction with Program Elements by Province & Region Top 2 Box Scores (% “Very Satisfied” and “Satisfied”)
Base: 2011: All localities that submitted results (n=1,819). Data is weighted to reflect all localities that participated in the TDSRC program (n=1,976). 2010: All localities that submitted results (n=1,762). Data is weighted to reflect all localities that participated in the TDSRC program (n=1,992). 2009: All localities that submitted results (n=1,718). Data is weighted to reflect all localities that participated in the TDSRC program (n=1,962). Source: Q27A-Q27E. Rate your level of satisfaction with the program elements below.
LAC – TD Summer Reading Club 2011 Final Report of Program Statistics
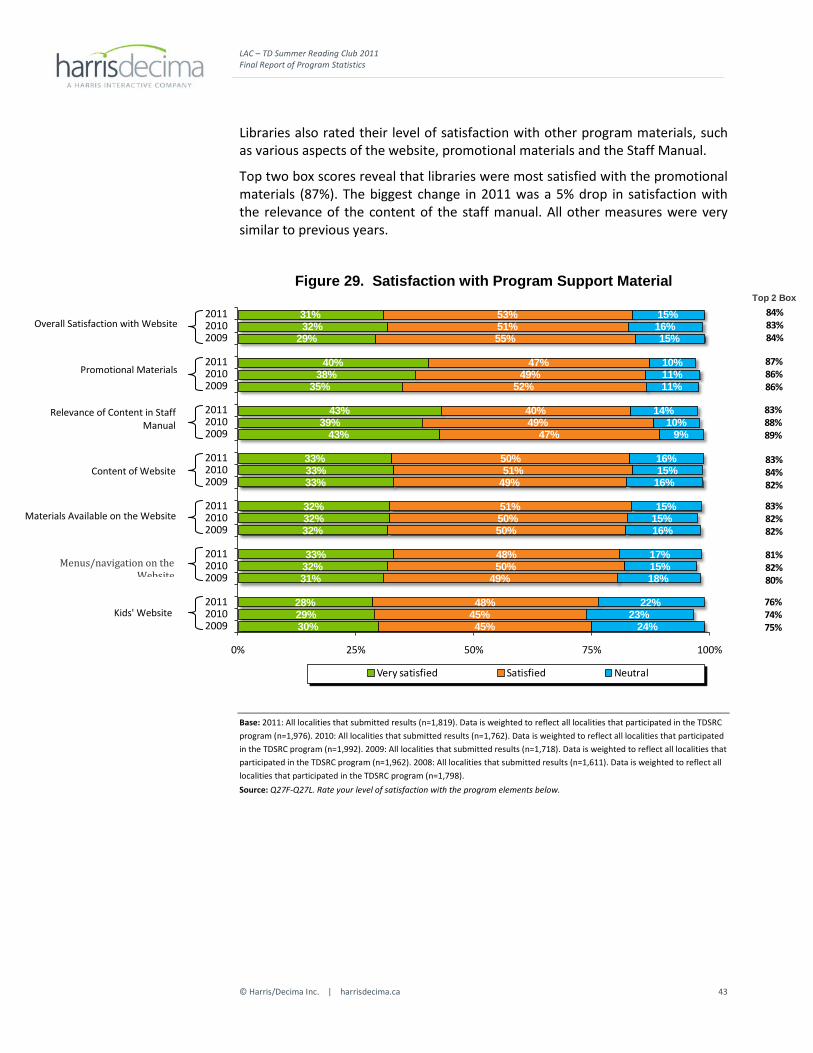
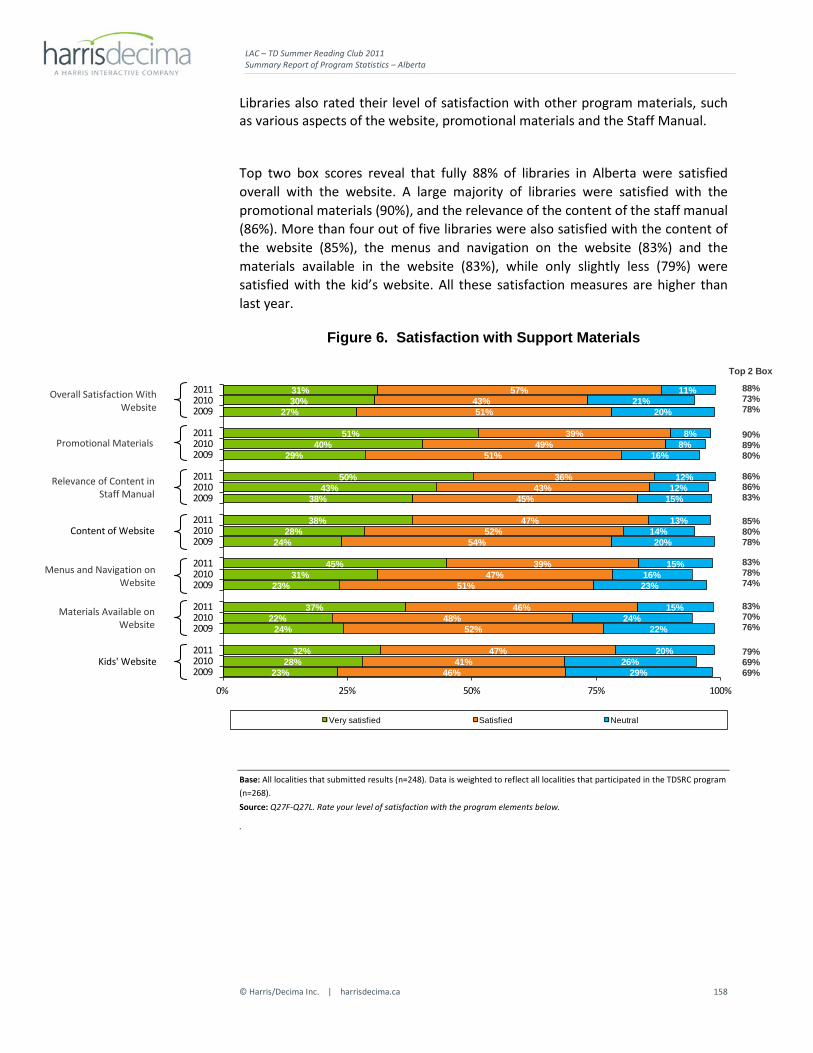
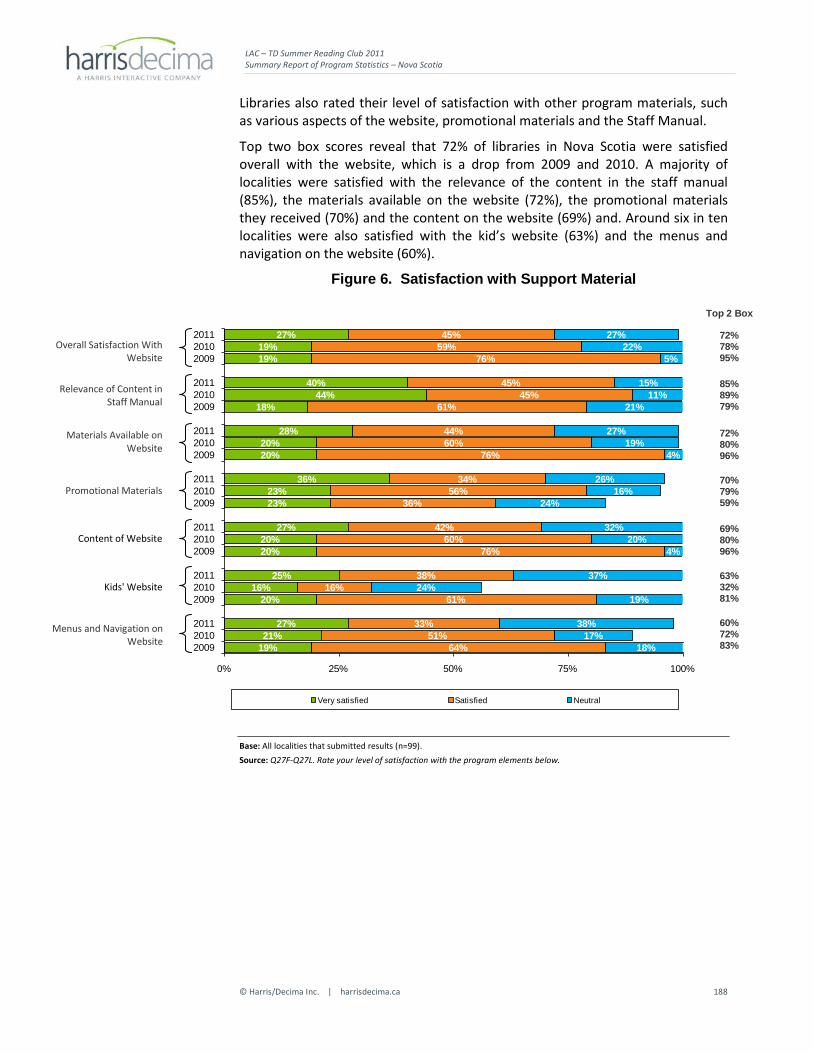
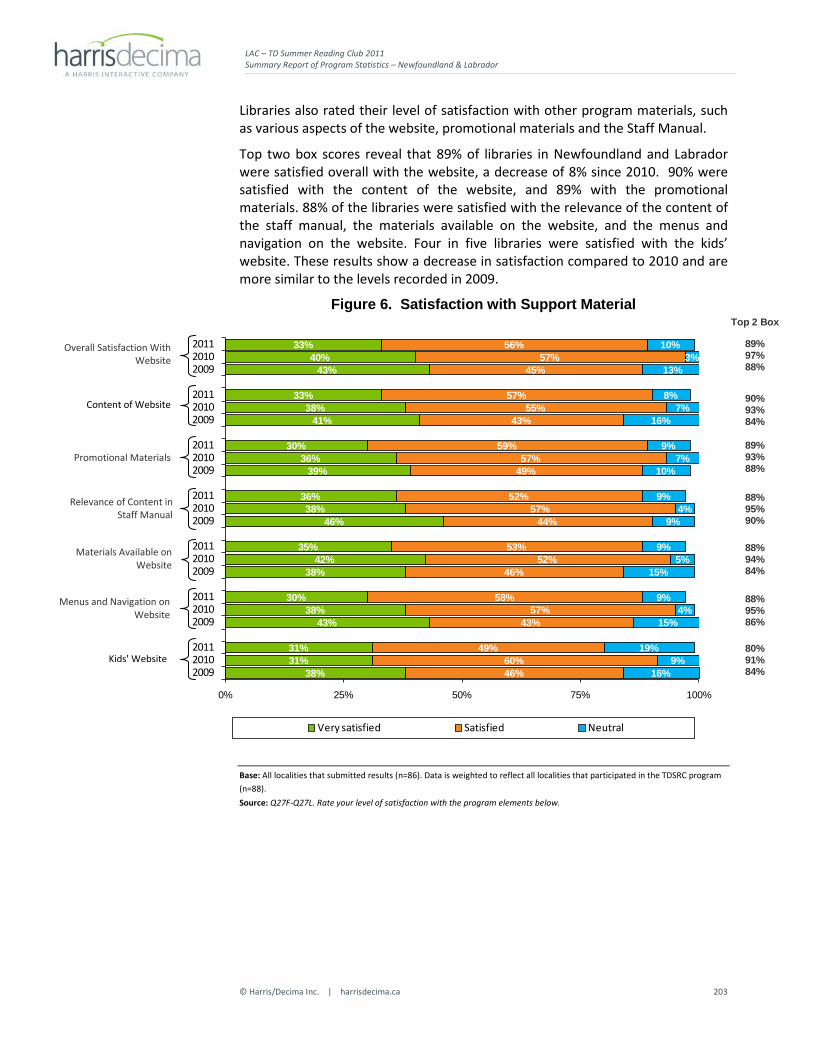
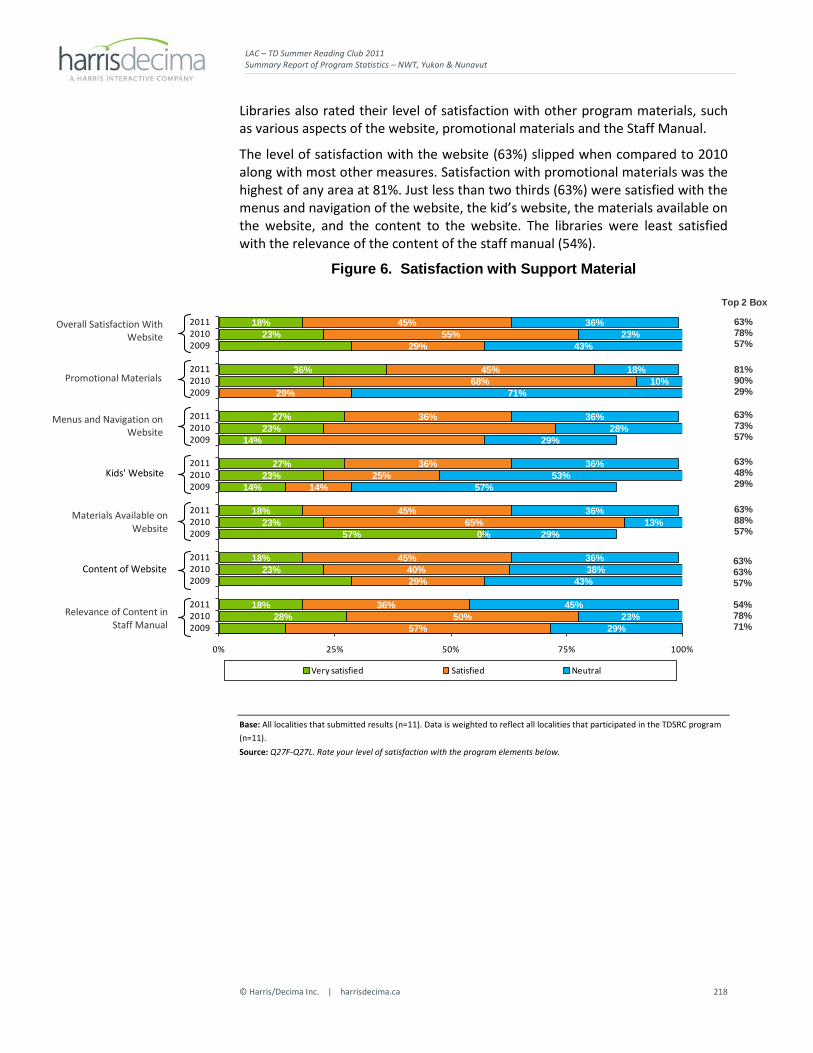
Libraries also rated their level of satisfaction with other program materials, such as various aspects of the website, promotional materials and the Staff Manual.
Top two box scores reveal that libraries were most satisfied with the promotional materials (87%). The biggest change in 2011 was a 5% drop in satisfaction with the relevance of the content of the staff manual. All other measures were very similar to previous years.
Figure 29. Satisfaction with Program Support Material
31%32%
29%
40%38%
35%
43%39%
43%
33%33%33%
32%32%32%
33%32%31%
28%29%30%
53%51%55%
47%49%
52%
40%49%
47%
50%51%
49%
51%50%50%
48%50%
49%
48%45%45%
15%16%15%
10%11%11%
14%10%
9%
16%15%
16%
15%15%16%
17%15%18%
22%23%
24%
0% 25% 50% 75% 100%
201120102009
201120102009
201120102009
201120102009
201120102009
201120102009
201120102009
Very satisfied Satisfied Neutral
Top 2 Box84%83%84%
87%86%86%
83%88%89%
83%82%82%
83%84%82%
81%82%80%
76%74%75%
Base: 2011: All localities that submitted results (n=1,819). Data is weighted to reflect all localities that participated in the TDSRC program (n=1,976). 2010: All localities that submitted results (n=1,762). Data is weighted to reflect all localities that participated in the TDSRC program (n=1,992). 2009: All localities that submitted results (n=1,718). Data is weighted to reflect all localities that participated in the TDSRC program (n=1,962). 2008: All localities that submitted results (n=1,611). Data is weighted to reflect all localities that participated in the TDSRC program (n=1,798). Source: Q27F-Q27L. Rate your level of satisfaction with the program elements below.
Overall Satisfaction with Website
Relevance of Content in Staff Manual
Promotional Materials
Content of Website
Menus/navigation on the Website
Materials Available on the Website
Kids' Website
LAC – TD Summer Reading Club 2011 Final Report of Program Statistics
Altogether, Quebec was the most satisfied with the support material and Atlantic Canada and the Territories were less satisfied. There was little consistent regional variation beyond that, however. With the exception of the relevance of the content of the staff manual mentioned above, there was little change in satisfaction in almost all areas from 2010 to 2011. The category with the lowest overall satisfaction was the kid’s website in every region, much like in previous years. Specific details by province and region are provided in the table below.
Figure 30. Satisfaction with Support Material by Province & Region Top 2 Box Scores (% “Very Satisfied” and “Satisfied”)
Base: 2011: All localities that submitted results (n=1,819). Data is weighted to reflect all localities that participated in the TDSRC program (n=1,976). 2010: All localities that submitted results (n=1,762). Data is weighted to reflect all localities that participated in the TDSRC program (n=1,992). Source: Q27F-Q27L. Rate your level of satisfaction with the program elements below.
LAC – TD Summer Reading Club 2011 Final Report of Program Statistics
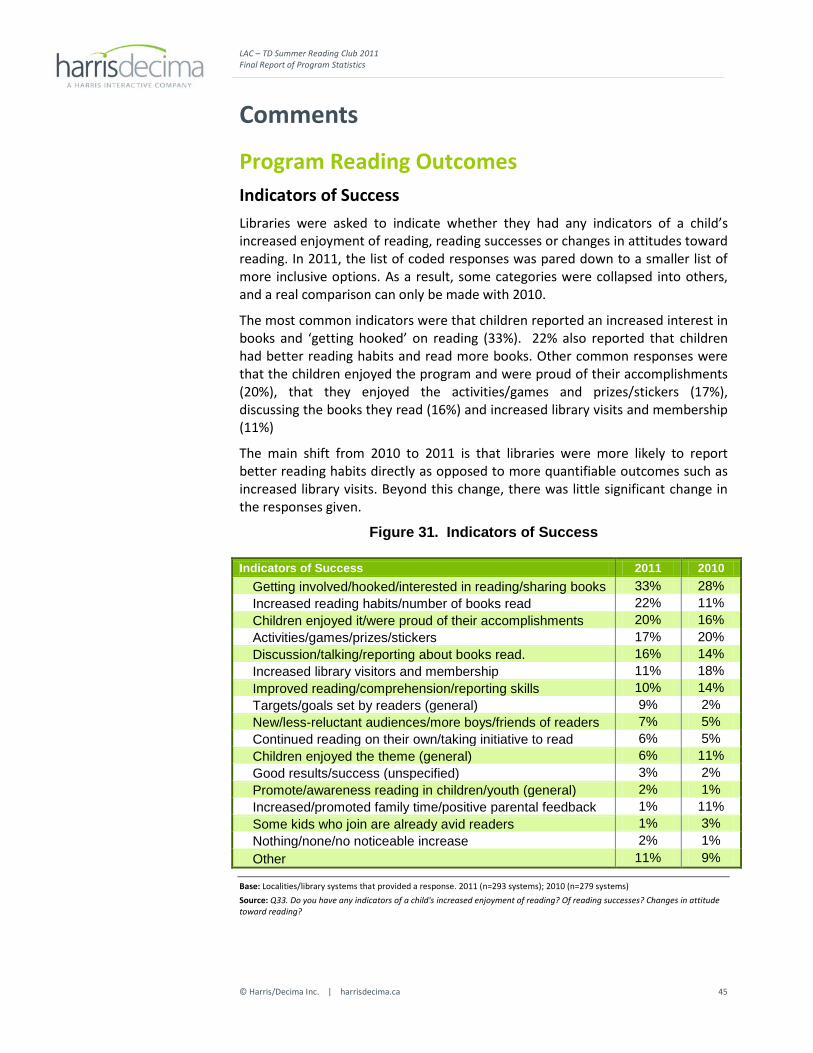
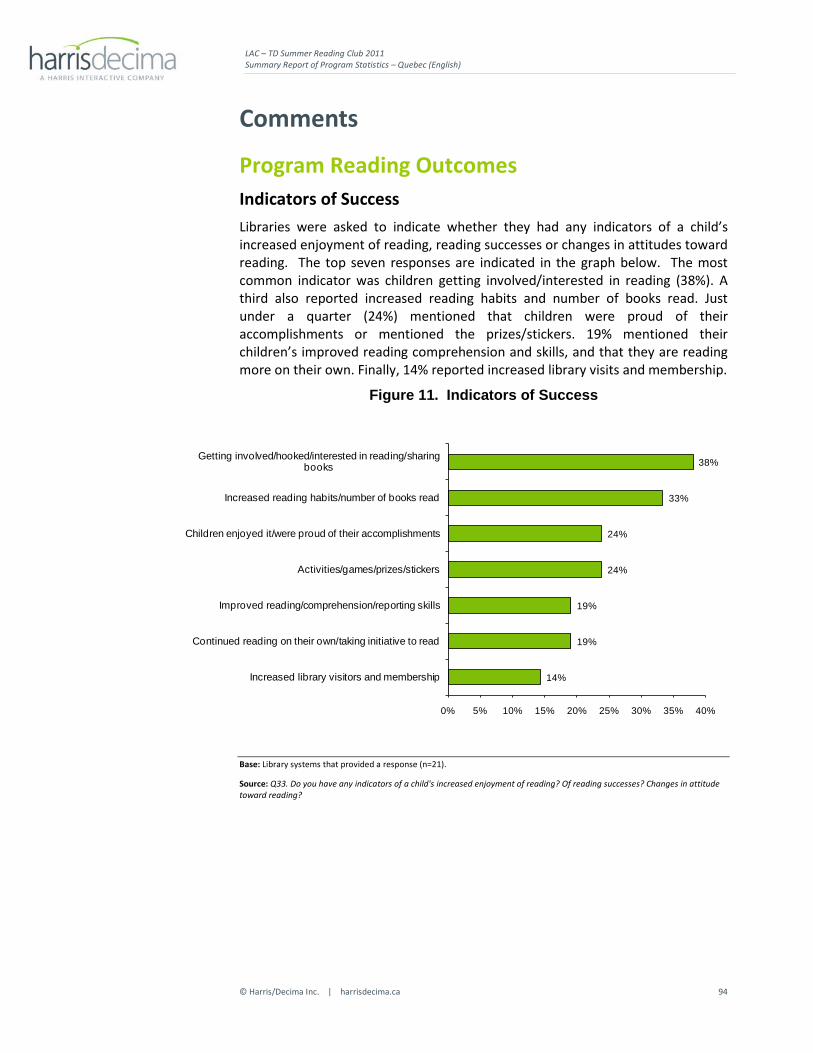
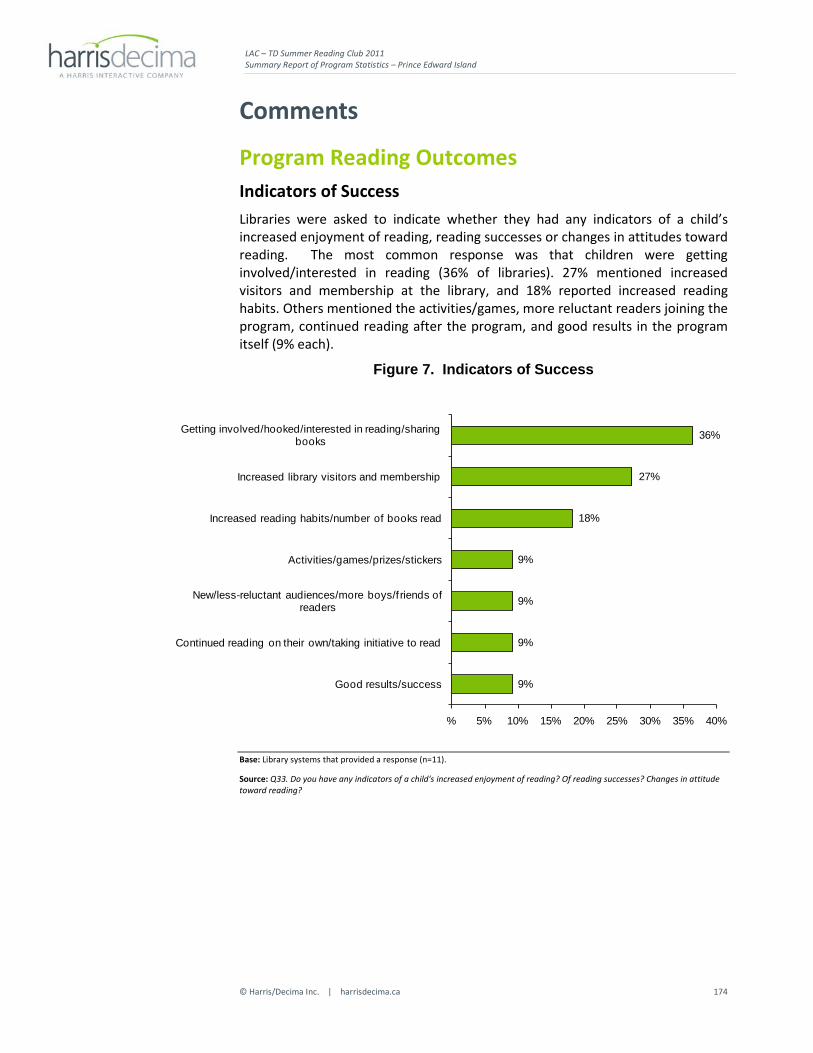
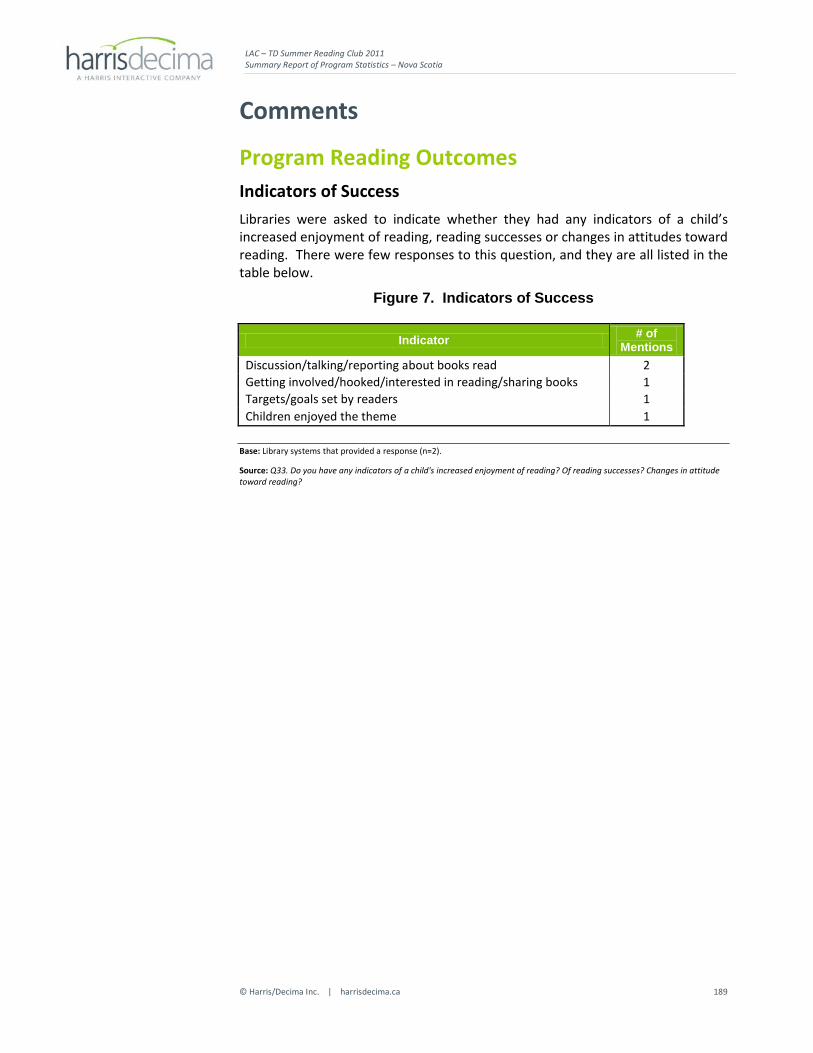
Program Reading Outcomes Indicators of Success Libraries were asked to indicate whether they had any indicators of a child’s increased enjoyment of reading, reading successes or changes in attitudes toward reading. In 2011, the list of coded responses was pared down to a smaller list of more inclusive options. As a result, some categories were collapsed into others, and a real comparison can only be made with 2010.
The most common indicators were that children reported an increased interest in books and ‘getting hooked’ on reading (33%). 22% also reported that children had better reading habits and read more books. Other common responses were that the children enjoyed the program and were proud of their accomplishments (20%), that they enjoyed the activities/games and prizes/stickers (17%), discussing the books they read (16%) and increased library visits and membership (11%)
The main shift from 2010 to 2011 is that libraries were more likely to report better reading habits directly as opposed to more quantifiable outcomes such as increased library visits. Beyond this change, there was little significant change in the responses given.
Figure 31. Indicators of Success
Indicators of Success 2011 2010 Getting involved/hooked/interested in reading/sharing books 33% 28% Increased reading habits/number of books read 22% 11% Children enjoyed it/were proud of their accomplishments 20% 16% Activities/games/prizes/stickers 17% 20% Discussion/talking/reporting about books read. 16% 14% Increased library visitors and membership 11% 18% Improved reading/comprehension/reporting skills 10% 14% Targets/goals set by readers (general) 9% 2% New/less-reluctant audiences/more boys/friends of readers 7% 5% Continued reading on their own/taking initiative to read 6% 5% Children enjoyed the theme (general) 6% 11% Good results/success (unspecified) 3% 2% Promote/awareness reading in children/youth (general) 2% 1% Increased/promoted family time/positive parental feedback 1% 11% Some kids who join are already avid readers 1% 3% Nothing/none/no noticeable increase 2% 1% Other 11% 9%
Base: Localities/library systems that provided a response. 2011 (n=293 systems); 2010 (n=279 systems) Source: Q33. Do you have any indicators of a child's increased enjoyment of reading? Of reading successes? Changes in attitude toward reading?
LAC – TD Summer Reading Club 2011 Final Report of Program Statistics
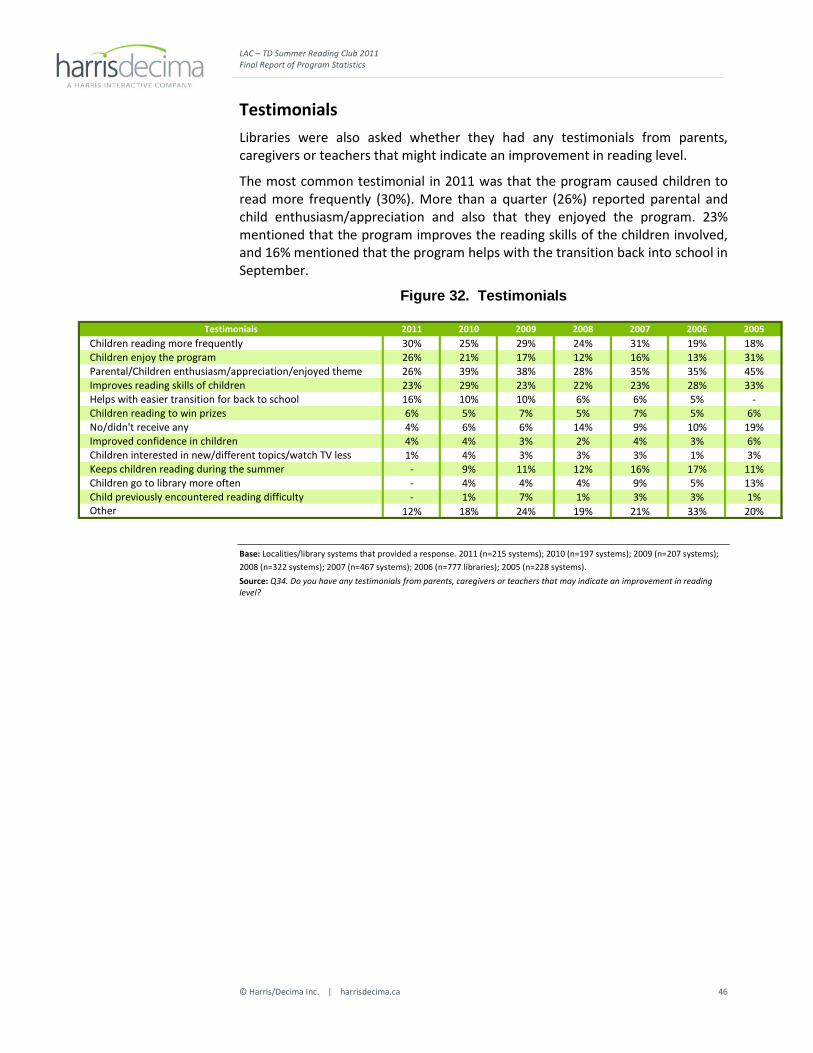
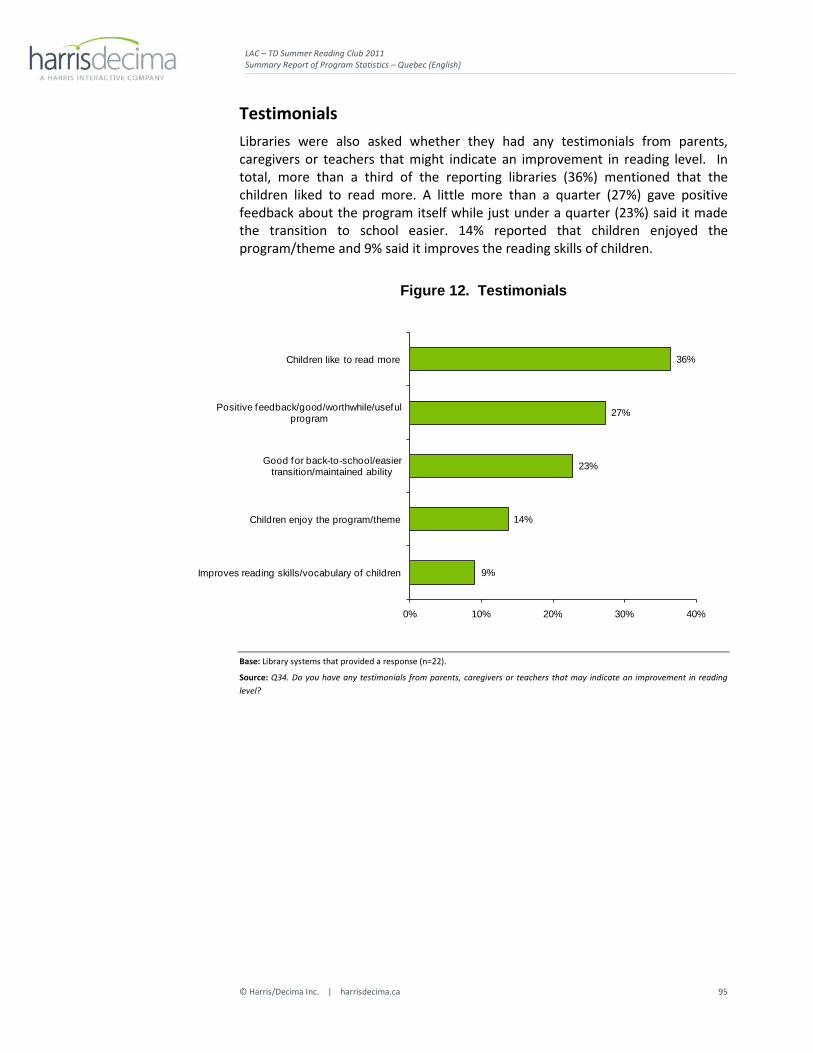
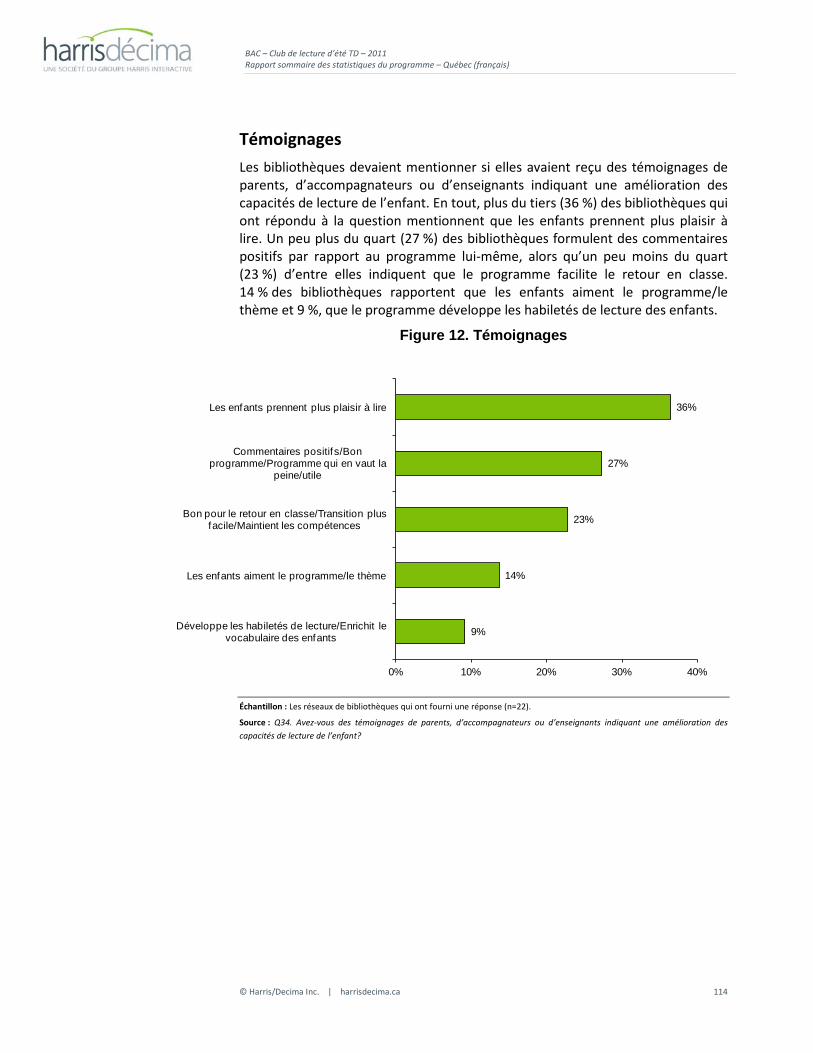
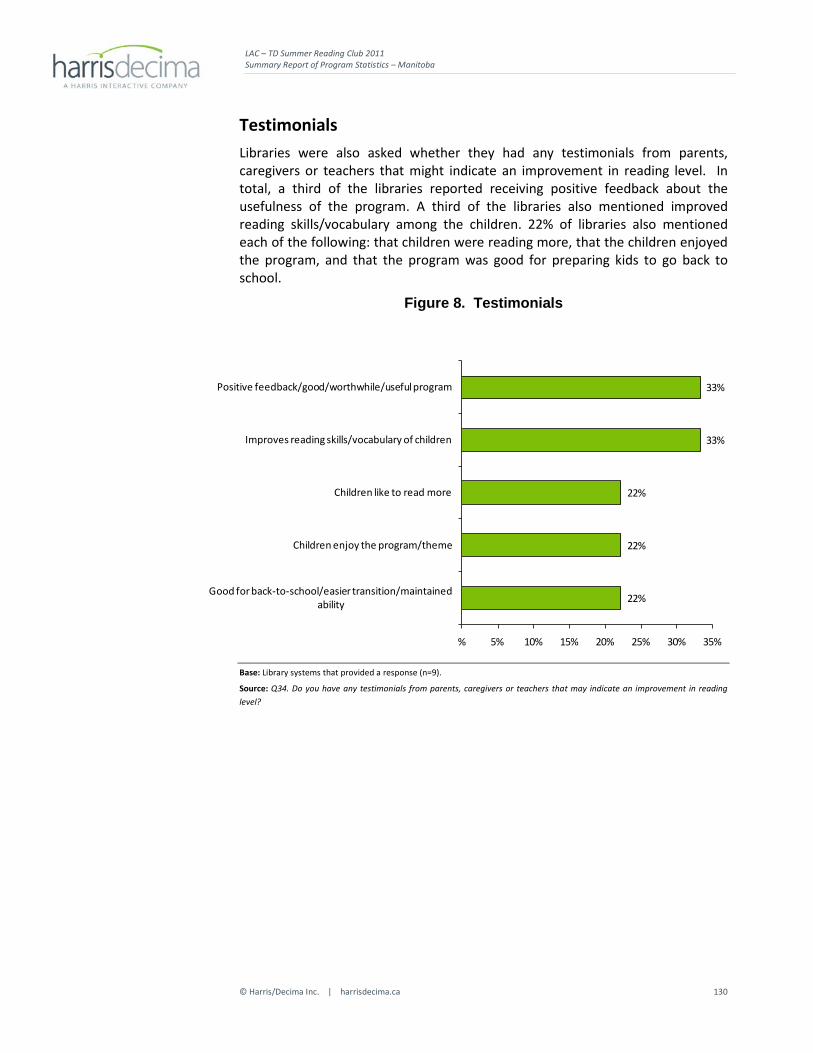
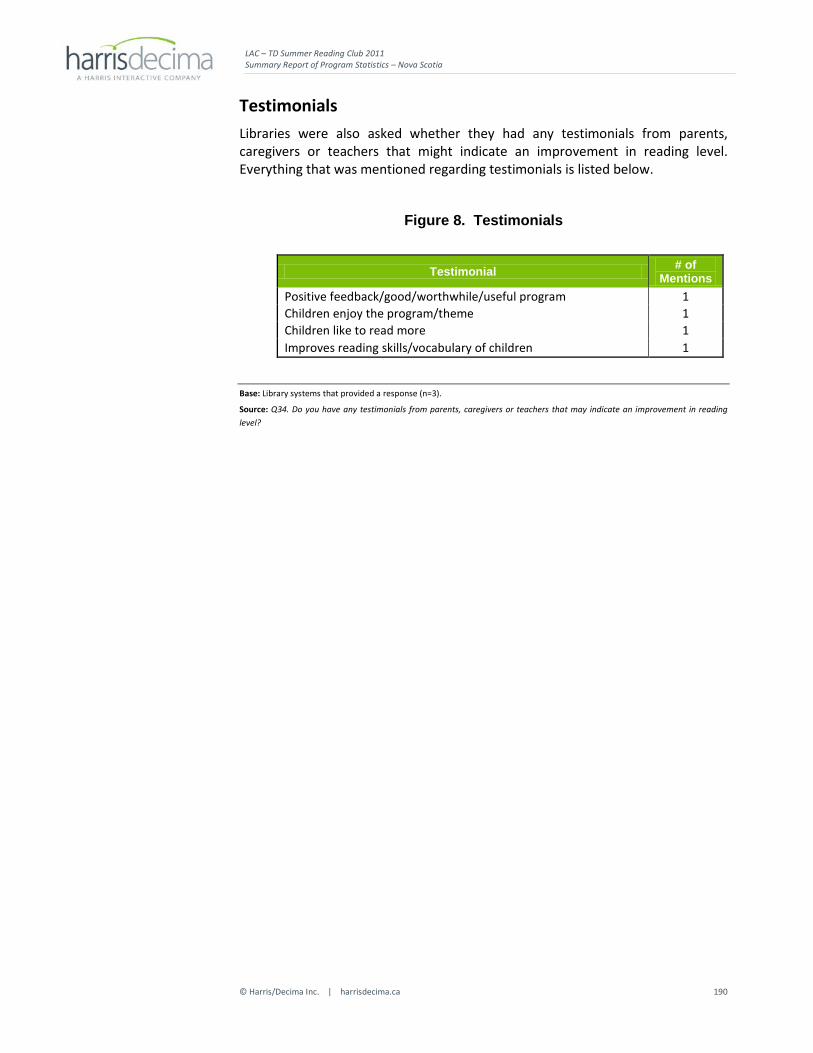
Testimonials Libraries were also asked whether they had any testimonials from parents, caregivers or teachers that might indicate an improvement in reading level.
The most common testimonial in 2011 was that the program caused children to read more frequently (30%). More than a quarter (26%) reported parental and child enthusiasm/appreciation and also that they enjoyed the program. 23% mentioned that the program improves the reading skills of the children involved, and 16% mentioned that the program helps with the transition back into school in September.
Figure 32. Testimonials
Testimonials 2011 2010 2009 2008 2007 2006 2005Children reading more frequently 30% 25% 29% 24% 31% 19% 18%Children enjoy the program 26% 21% 17% 12% 16% 13% 31%Parental/Children enthusiasm/appreciation/enjoyed theme 26% 39% 38% 28% 35% 35% 45%Improves reading skills of children 23% 29% 23% 22% 23% 28% 33%Helps with easier transition for back to school 16% 10% 10% 6% 6% 5% -Children reading to win prizes 6% 5% 7% 5% 7% 5% 6%No/didn't receive any 4% 6% 6% 14% 9% 10% 19%Improved confidence in children 4% 4% 3% 2% 4% 3% 6%Children interested in new/different topics/watch TV less 1% 4% 3% 3% 3% 1% 3%Keeps children reading during the summer - 9% 11% 12% 16% 17% 11%Children go to library more often - 4% 4% 4% 9% 5% 13%Child previously encountered reading difficulty - 1% 7% 1% 3% 3% 1%Other 12% 18% 24% 19% 21% 33% 20%
Base: Localities/library systems that provided a response. 2011 (n=215 systems); 2010 (n=197 systems); 2009 (n=207 systems); 2008 (n=322 systems); 2007 (n=467 systems); 2006 (n=777 libraries); 2005 (n=228 systems). Source: Q34. Do you have any testimonials from parents, caregivers or teachers that may indicate an improvement in reading level?
LAC – TD Summer Reading Club 2011 Final Report of Program Statistics
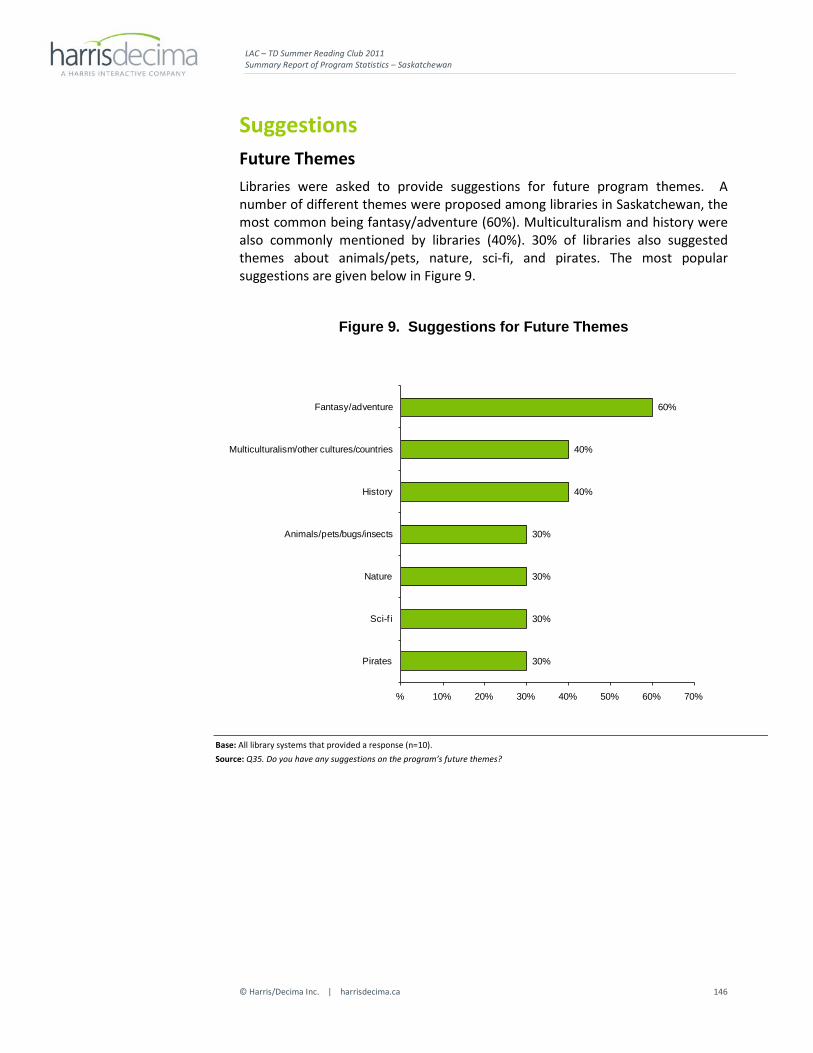
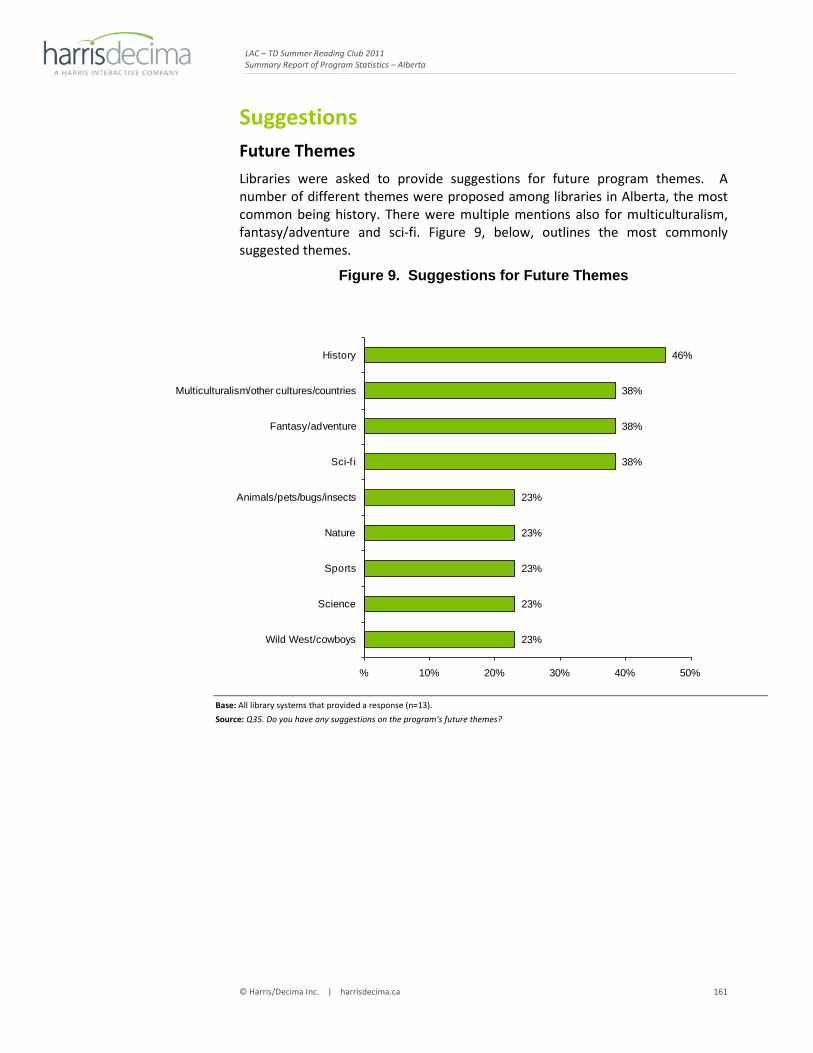
Suggestions Future Themes The list of library suggestions for future program themes was also reduced in 2011. A great number of different themes were proposed but the most common were themes about multiculturalism and other countries (33%), fantasy/adventure (27%), and animals (22%). History and Nature were both mentioned by 18% of those offering a response. The figure below presents the suggestions made by at least 5% of systems in 2011.
Figure 33. Suggestions for Future Themes
33%
27%
22%
18%
18%
15%
12%
9%
7%
7%
5%
5%
5%
23%
31%
12%
25%
35%
18%
8%
9%
1%
4%
4%
4%
5%
0% 5% 10% 15% 20% 25% 30% 35% 40%
Multiculturalism/other cultures/countries
Fantasy/adventure
Animals/pets/bugs/insects (general)
History
Nature
Sci-fi
Sports (general)
Science
Fairs/festivals/carnivals/the circus
Food/nutrition
Cartoons/comic strips
Pirates
Music
2011
2010
Base: Library systems/localities that provided a response. 2011 (n=243 systems); 2010 (n=280 systems); Source: Q35. Do you have any suggestions on the program’s future themes?
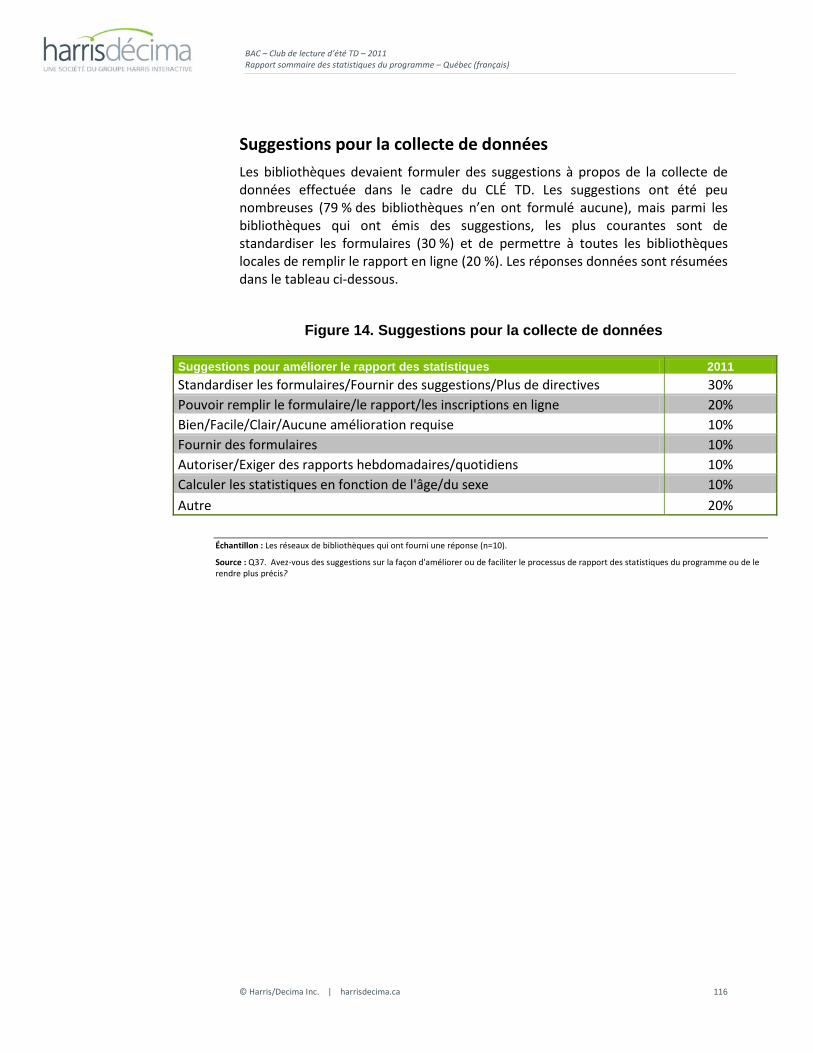
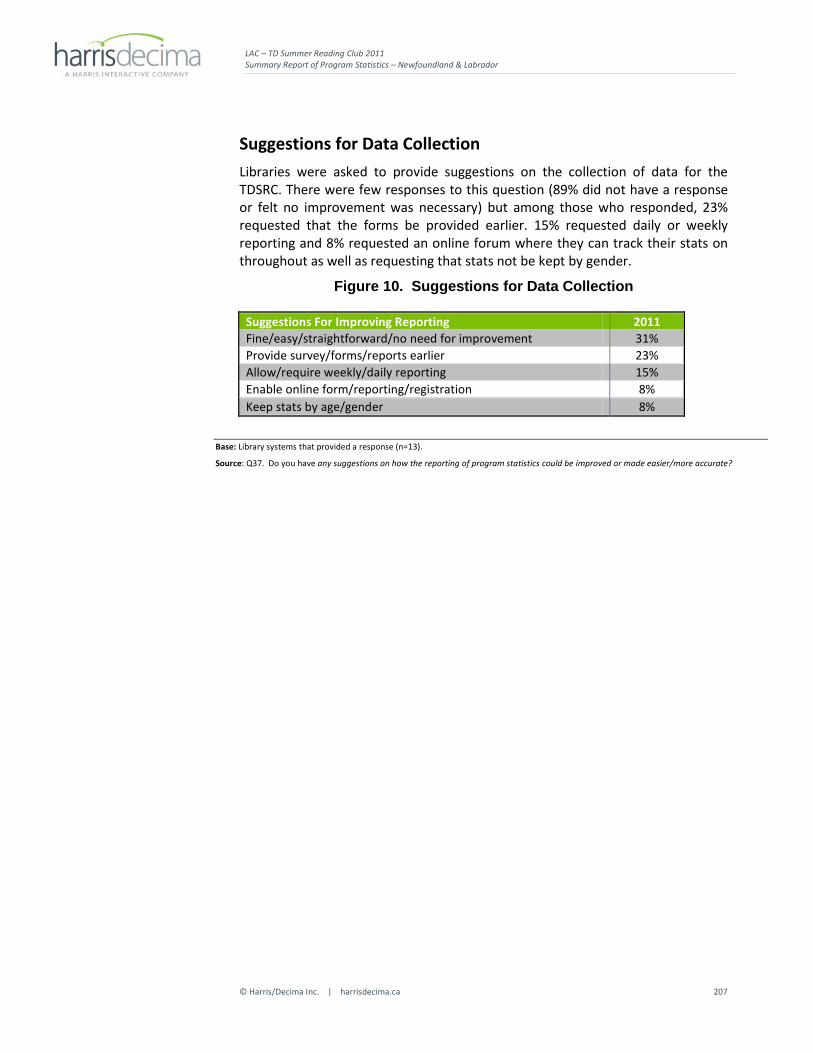
TDSRC Statistics Collection Libraries were asked to provide suggestions on how to improve the collection of program statistics. Among those who had a suggestion (60% did not provide one), the most common was that the forms/reports should be provided earlier in the year (28% of those who had a response). More standardized forms with more instruction (15%), the ability for individual libraries within systems to report their statistics directly online (11%), that forms be provided directly to all libraries (8%), that questions be clarified (7%), and allowing or requiring weekly registration (5%) were all mentioned. All other suggestions are listed in the table below.
Figure 34. Suggestions for Data Collection
Suggestions For Improving Reporting 2011 2010 Provide survey/forms/reports earlier 28% 15% Fine/easy/straightforward/no need for improvement 17% 16% Standardize forms/provide suggestions/more instructions 15% 11% Enable online form/reporting/registration 11% 11% Provide forms to all individual libraries 8% 4% Clarify/specify survey questions 7% 10% Allow/require weekly/daily reporting 5% 4% Enable Excel spreadsheet/database registration 4% 8% Difficult/time consuming to keep counts 4% 5% Do not track/require stats on gender 4% 4% Improve recording of number of hours read 1% 9% Keep stats by age/gender 1% 2% Provide fewer options when asking about program awareness < 1% 5% Other 15% 27%
Base: Localities/library systems that provided a response. 2011 (n=199); 2010 (n=161). Source: Q37. Do you have any suggestions on how the reporting of program statistics could be improved or made easier/more accurate?
LAC – TD Summer Reading Club 2011 Final Report of Program Statistics
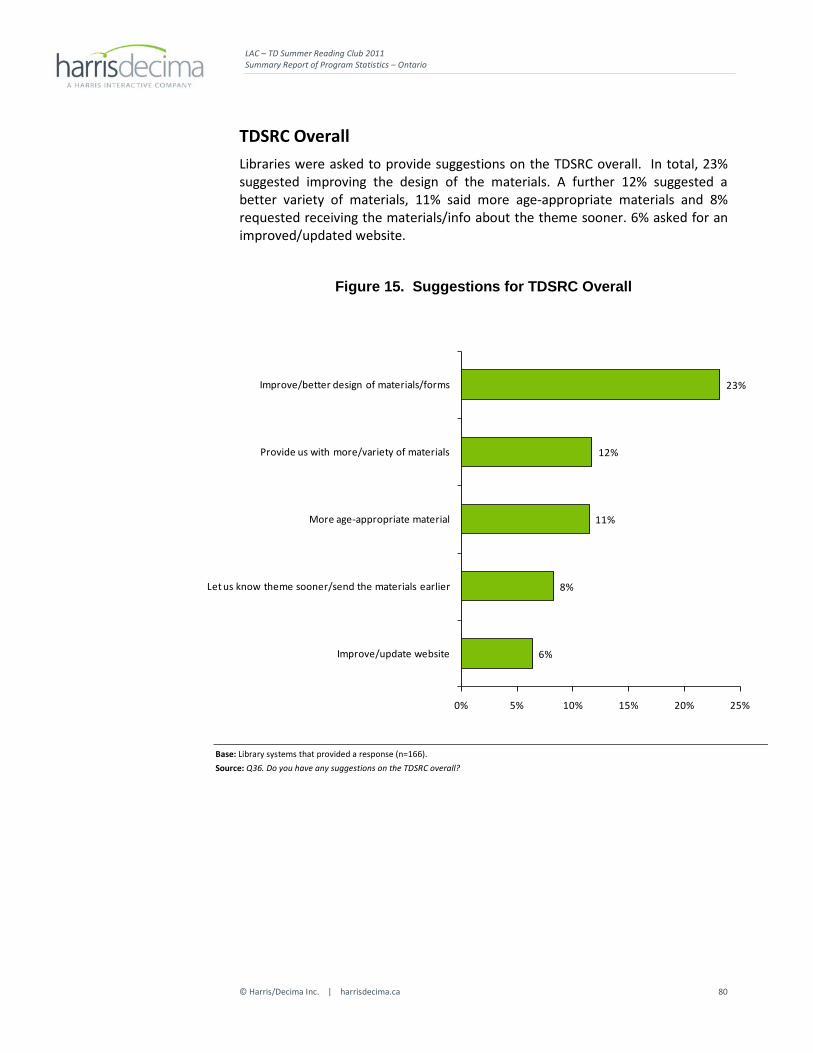
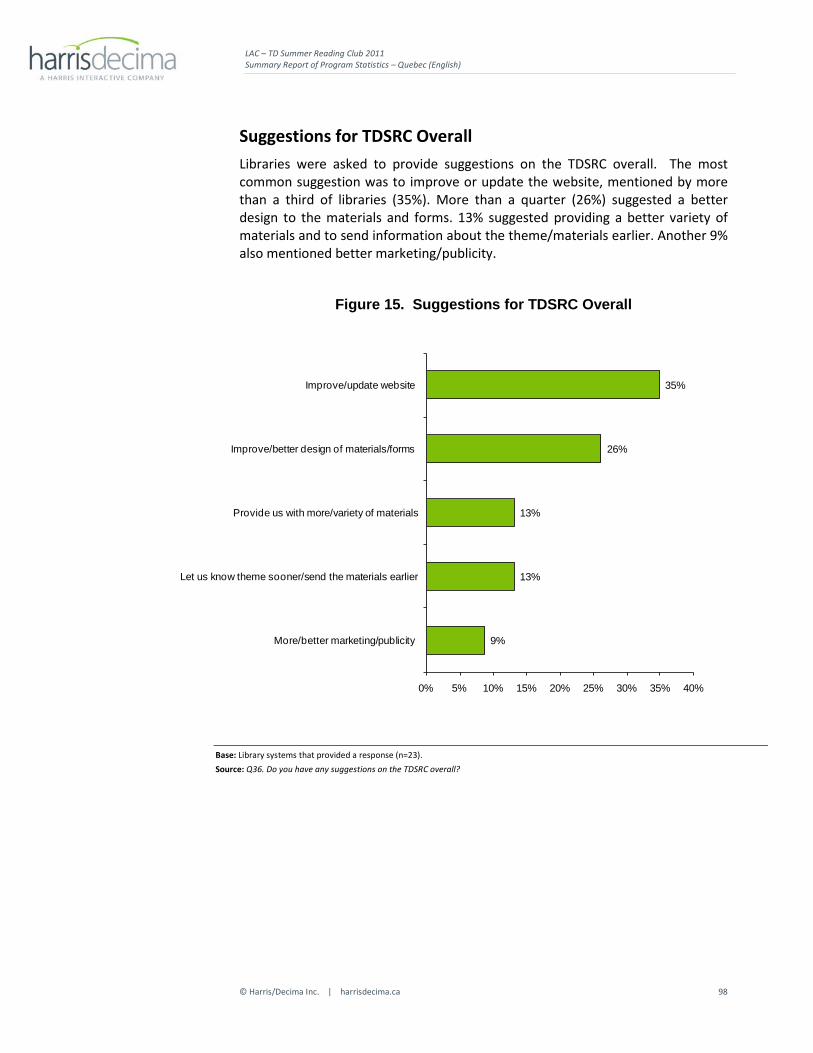
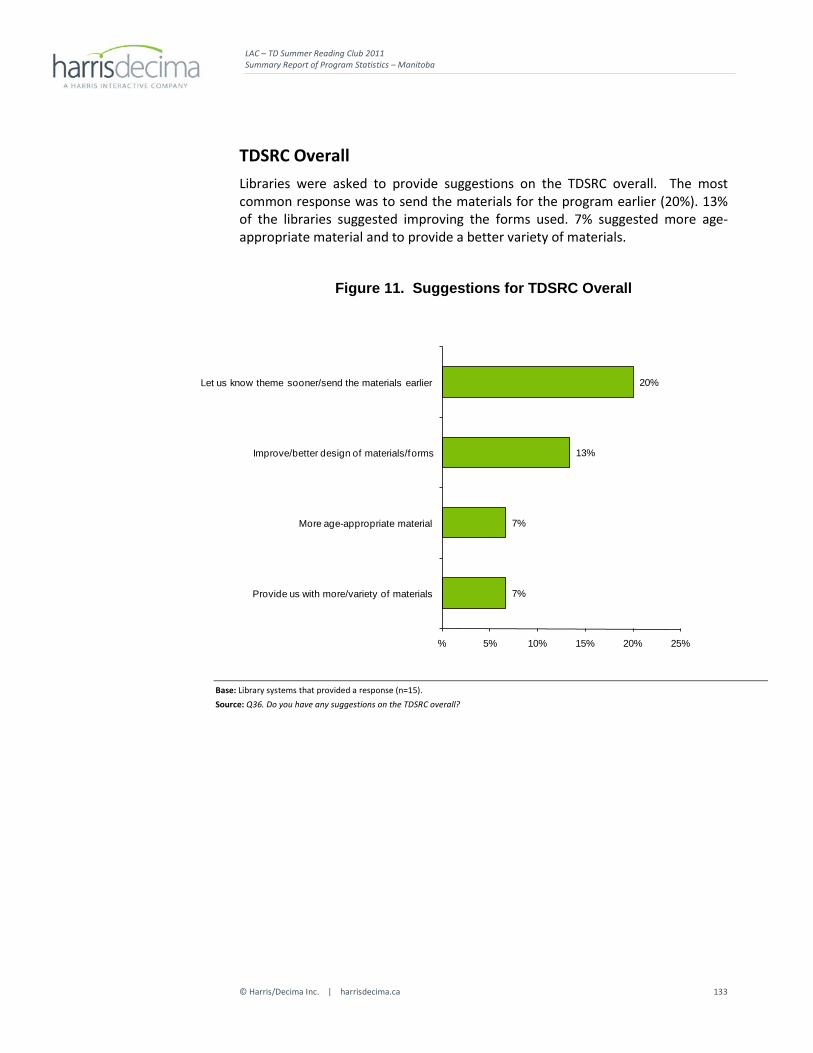
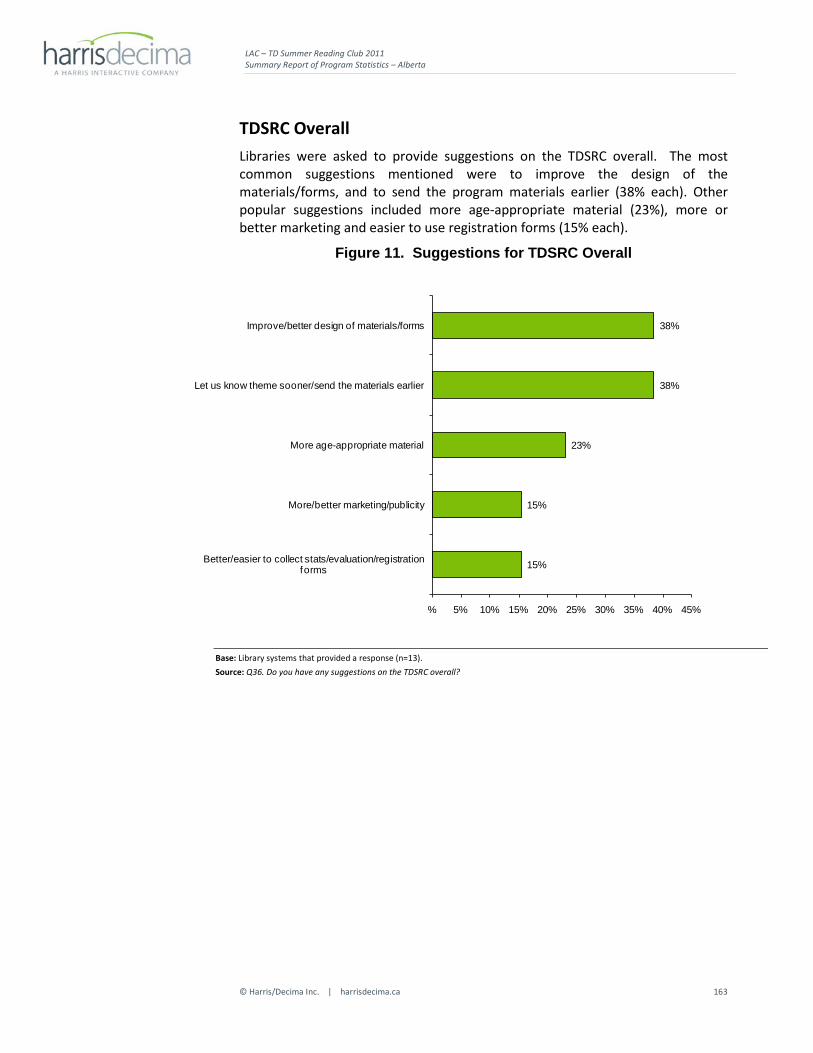
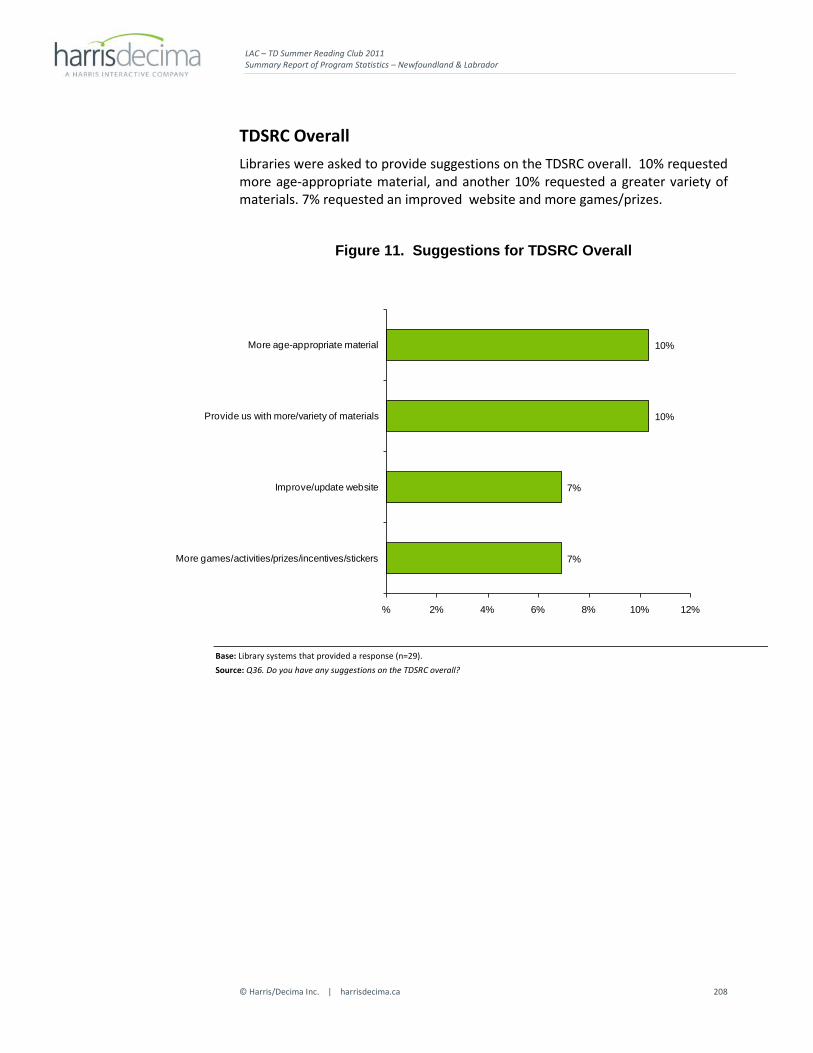
TDSRC Overall Libraries were asked to provide suggestions on the TDSRC overall. Systems often use this question as an opportunity to provide feedback, with a number of comments referring to the excellence of the program (37%). The most common suggestions are to improve the materials/posters/stickers used (22%), but 11% also requested more age-appropriate themes. Roughly one in ten libraries who offered a suggestion requested a greater variety of materials and another 10% requested that the materials be send earlier.
Concerns with the materials vary from year to year but concerns of this type were virtually unchanged when compared to 2010. Overall, more libraries offered only that the program was excellent and could not offer a concrete suggestion than in previous years.
Figure 35. Suggestions for TDSRC Overall
Suggestions 2011 2010 2009Excellent/successful program 37% 30% 32%Improve the materials/posters/stickers 22% 21% 34%More age-appropriate themes 11% 4% 2%Provide us with more variety of materials 10% 6% 2%Send the material to be used earlier 10% 16% 8%Improve/update the website 9% 6% 2%More games and interactive activities/prizes and incentives 5% 12% 11%More/better marketing and publicity 4% 6% 2%More interesting/exciting/appropriate/focused themes 3% 1% 1%Make it easier to collect statistics/better forms 3% 0% 2%Provide more information/training on the program 3% 1% 3%More geared to literature/reading 1% - -Flexible Themes/for wider audiences 1% 2% 2%More financial support for libraries 1% - -Kids enjoy the program - 8% 3%Improve log book/easier for children - 5% 2%Other 7% 14% 30%
Base: Localities/library systems that provided a response. 2011 (n=259); 2010 (n=259); 2009 (n=244) Source: Q36. Do you have any suggestions on the TDSRC overall?
LAC – TD Summer Reading Club 2011 Summary Report of Program Statistics
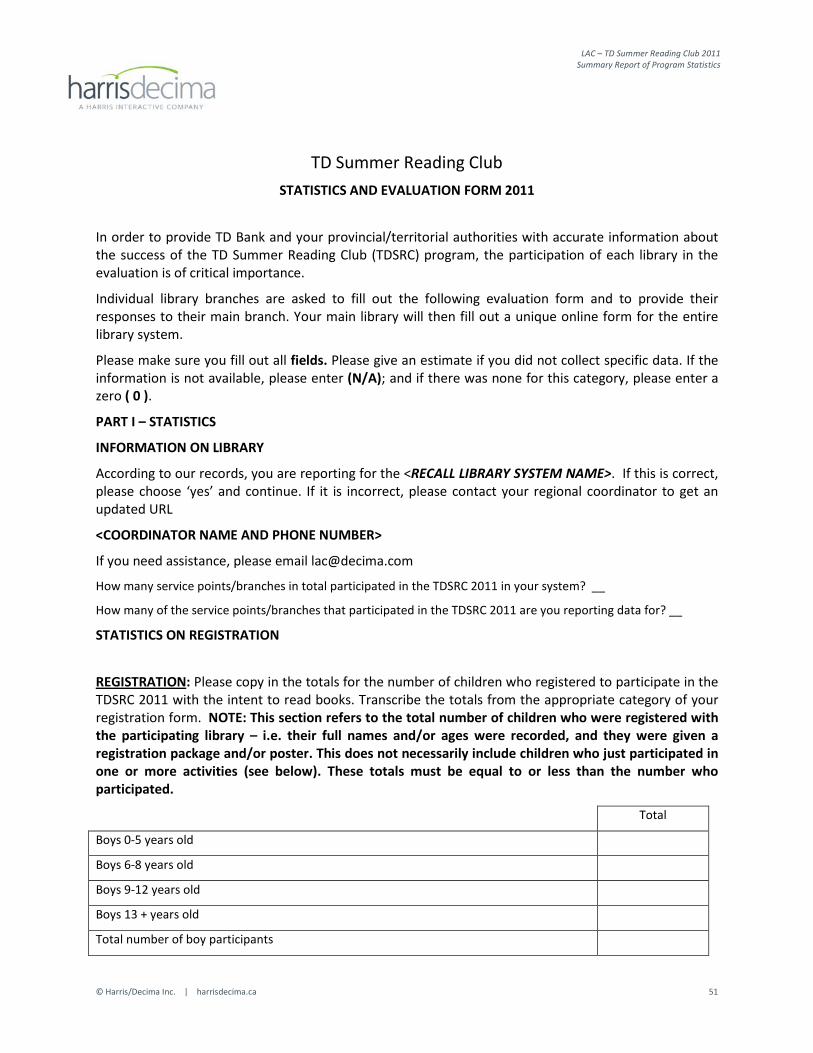
TD Summer Reading Club STATISTICS AND EVALUATION FORM 2011
In order to provide TD Bank and your provincial/territorial authorities with accurate information about the success of the TD Summer Reading Club (TDSRC) program, the participation of each library in the evaluation is of critical importance.
Individual library branches are asked to fill out the following evaluation form and to provide their responses to their main branch. Your main library will then fill out a unique online form for the entire library system.
Please make sure you fill out all fields. Please give an estimate if you did not collect specific data. If the information is not available, please enter (N/A); and if there was none for this category, please enter a zero ( 0 ).
PART I – STATISTICS
INFORMATION ON LIBRARY
According to our records, you are reporting for the <RECALL LIBRARY SYSTEM NAME>. If this is correct, please choose ‘yes’ and continue. If it is incorrect, please contact your regional coordinator to get an updated URL
How many service points/branches in total participated in the TDSRC 2011 in your system? __
How many of the service points/branches that participated in the TDSRC 2011 are you reporting data for? __
STATISTICS ON REGISTRATION
REGISTRATION: Please copy in the totals for the number of children who registered to participate in the TDSRC 2011 with the intent to read books. Transcribe the totals from the appropriate category of your registration form. NOTE: This section refers to the total number of children who were registered with the participating library – i.e. their full names and/or ages were recorded, and they were given a registration package and/or poster. This does not necessarily include children who just participated in one or more activities (see below). These totals must be equal to or less than the number who participated.
Total
Boys 0-5 years old
Boys 6-8 years old
Boys 9-12 years old
Boys 13 + years old
Total number of boy participants
LAC – TD Summer Reading Club 2011 Summary Report of Program Statistics
PARTICIPATION: This is the total number of children who attended any or all of the activities conducted. They may not have been registered, and should be counted each time they attended an activity. The number of children participating must be equal to, or higher than the number who have registered.
Please enter the totals for all libraries in the system that you are reporting for. If you are missing data for this question for some systems, please include estimates for those libraries in your totals.
Programs/activities conducted in the libraries in your system
Total
Total number of club programs/activities
Total attendance at programs/activities for boys and girls
Total attendance at programs/activities for boys
Total attendance at programs/activities for girls
Programs /activities conducted at locations other than the libraries in your system
Total
Total number of club programs/activities
Total attendance at programs/activities for boys and girls
Total attendance at programs/activities for boys
Total attendance at programs/activities for girls
MATERIAL PROVIDED: Total number of reading kits or posters given out to children coming into the libraries in your system, and any materials provided to summer day camps, child-care centres, community/public housing projects, faith-based programs, etc.
Please enter the totals for all libraries in the system that you are reporting for. If you are missing data for this question for some systems, please include estimates for those libraries in your totals.
Posters only
LAC – TD Summer Reading Club 2011 Summary Report of Program Statistics
Reading kits (includes poster, activity booklet and stickers)
You are reporting data for <RECALL # OF LIBRARIES/BRANCHES THEY ARE REPORTING ON> service points/branches. Please enter how many of those service points responded with yes and no, and if some service points did not supply information, enter that number under ‘No Info Provided’
Did you run this as a drop-in program?
Yes No No Info Provided
Did you run the program as a club? (e.g., with distinct meeting times) (can do both)
Yes No No Info Provided
Please enter the totals for all libraries in the system that you are reporting for. If you are missing data for this question for some systems, please include estimates for those libraries in your totals.
Total
If recorded, total number of children who collected all 9 stickers
If recorded, total number of books reported on
If recorded, total number of books read (at home or at the library)
If recorded, total number of hours read (at home or at the library)
PROMOTION OF PROGRAM
Please transcribe the totals from your registration form to the appropriate methods below (only one method per participant):
Number of participants that first heard about the TDSRC by the following methods
Total
1. Presentation to schools by library staff
2. Presentation to summer day camps, child-care centres, community/public housing projects, faith-based programs, etc.
3. Staff promotion in branch
4. Word of mouth
LAC – TD Summer Reading Club 2011 Summary Report of Program Statistics
7. Media (radio, newspaper, website, library program guide, transit ads)
8. Other – Describe here:
You are reporting data for <RECALL # OF LIBRARIES/BRANCHES THEY ARE REPORTING ON> service points/branches. Please enter how many of those service points responded with yes and no, and if some service points did not supply information, enter that number under ‘No Info Provided’
Did any library staff promote the program to schools/summer day camps/child-care centres/community/public housing projects/faith-based programs, etc.
Yes No No Info Provided
If yes, total number of visits.
If yes, total number of children reached.
LEVEL OF SATISFACTION
Please rate your level of satisfaction with the program elements below:
You are reporting data for <RECALL # OF LIBRARIES/BRANCHES THEY ARE REPORTING ON> service points/branches. For each statement, enter the number of service points that responded with each level of satisfaction. If some service points did not supply information, enter that number under ‘No Info Provided’.
For example, if you are reporting for four service points, and two are very satisfied and two are satisfied with the ‘Program Poster’, enter the number 2 under the satisfied and very satisfied column on the ‘Program Poster’ row.
LAC – TD Summer Reading Club 2011 Summary Report of Program Statistics
Club de lecture d’été TD FORMULAIRE D’ÉVALUATION ET DE STATISTIQUES 2011
Afin de procurer à la Banque TD et à l’administration provinciale ou territoriale des renseignements précis sur le succès du programme du Club de lecture d’été TD (CLÉ TD), il est primordial que chaque bibliothèque publique participe à l’évaluation.
Chaque succursale de bibliothèque est invitée à remplir le formulaire d’évaluation ci-joint et à le soumettre à la succursale centrale. Celle-ci remplira ensuite un formulaire unique en ligne pour l’ensemble du réseau de bibliothèques.
Veuillez vous assurer de remplir tous les champs. Si vous avez omis de collecter certaines données, vous pouvez donner une réponse approximative. Si vous ne pouvez pas répondre à une question, faute de données, inscrivez (S/O); s’il n’y a pas eu de participation pour cette catégorie, inscrivez un zéro ( 0 ).
PARTIE I – STATISTIQUES
RENSEIGNEMENTS SUR LA BIBLIOTHÈQUE
Selon nos dossiers, vous fournissez des données pour le <NOM DU RÉSEAU DE BIBLIOTHÈQUES>. Si cette information est exacte, veuillez choisir « Oui BIBLIOTHÈQUES>» et continuer. Si cette information est incorrecte, veuillez communiquer avec votre coordonnateur régional pour obtenir une adresse URL à jour.
<NOM DU COORDONNATEUR ET NUMÉRO DE TÉLÉPHONE> Si vous avez besoin d'aide, veuillez envoyer un courriel à [email protected].
Combien de points de service/succursales en tout ont participé au CLETD 2010 dans votre réseau? __
Pour combien de points de service/succursales qui ont participé au CLETD 2010 fournissez-vous des données? __
STATISTIQUES D’INSCRIPTION
INSCRIPTION : Veuillez indiquer le nombre total d'enfants qui se sont inscrits pour participer au CLETD 2010 dans l'intention de lire des livres. Veuillez transcrire le nombre total dans la catégorie appropriée de votre formulaire d'inscription. NOTE : Cette section renvoie au nombre total d'enfants qui s'étaient inscrits à la bibliothèque participante - c.-à-d. leur nom complet et/ou leur âge, et si une trousse d'inscription et/ou une affiche leur a été remise. Ce nombre n'inclut pas nécessairement les enfants qui ont participé uniquement à une ou plusieurs activités (se reporter ci-après). Le total de ces nombres doit être égal ou moindre que le nombre d'enfants qui ont participé. Total
Garçons âges 0-5
Garçons âges 6-8
Garçons âges 9-12
Garçons âges 13 +
Total des garçons
LAC – TD Summer Reading Club 2011 Summary Report of Program Statistics
PARTICIPATION : Il s'agit du nombre total d'enfants qui ont pris part à une ou à toutes les activités offertes. Il se peut qu'ils ne se soient pas inscrits, et ceux-ci doivent être comptés chaque fois qu'ils ont participé à une activité. Le nombre d'enfants qui ont participé doit être égal ou supérieur au nombre d'enfants inscrits. Veuillez entrer le total de toutes les bibliothèques du réseau pour lequel vous faites rapport. S'il vous manque des données pour cette question pour certains réseaux, veuillez inclure des estimations pour ces bibliothèques dans vos totaux. Programmes ou activités en bibliothèque de votre système
Total
Nombre total de programmes ou d’activités organisés
Participation totale des garçons et des filles aux programmes et aux activités
Participation totale des garçons aux programmes et aux activités
Participation totale des filles aux programmes et aux activités
Programmes ou activités à l’extérieur de la bibliothèque
Total
Nombre total de programmes ou d’activités organisés
Participation totale des garçons et des filles aux programmes et aux activités
Participation totale des garçons aux programmes et aux activités
Participation totale des filles aux programmes et aux activités
MATÉRIEL REMIS : Nombre total de trousses de lecture ou d’affiches remises aux enfants qui ont fréquenté la bibliothèque, et de tout matériel remis à des camps de jour, des services de garde, des projets communautaires, des ensembles de logements publics, des programmes confessionnels, etc.
LAC – TD Summer Reading Club 2011 Summary Report of Program Statistics
Veuillez entrer le total de toutes les bibliothèques du réseau pour lequel vous faites rapport. S'il vous manque des données pour cette question pour certains réseaux, veuillez inclure des estimations pour ces bibliothèques dans vos totaux. Affiches seulement
Trousses de lecture (comprenant l’affiche, le livret d’activités et les autocollants)
Vous fournissez des données pour _<NOMBRE>_ de bibliothèques/succursales.
Veuillez indiquer le nombre de ces points de service qui ont répondu « Oui » et « Non », et si certains points de service n'ont pas fournit d'information, veuillez indiquer ce nombre sous « Aucune information fournie ».
Avez-vous fonctionné suivant le principe de la porte ouverte?
Oui Non Aucune information
fournie
Avez-vous administré le programme comme un club? (p. ex., réunions à heures fixes) (Les deux formules sont possibles.)
Oui Non Aucune information
fournie
Veuillez entrer le total de toutes les bibliothèques du réseau pour lequel vous faites rapport. S'il vous manque des données pour cette question pour certains réseaux, veuillez inclure des estimations pour ces bibliothèques dans vos totaux.
LAC – TD Summer Reading Club 2011 Summary Report of Program Statistics
Si noté, nombre total d’enfants qui ont obtenu les 9 autocollants
Si noté, total de livres pour lesquels des comptes rendus de lecture ont été produits
Si noté, total des livres lus
Si noté, total des heures de lecture
PROMOTION DU PROGRAMME
Cumul des formulaires d’inscription à transcrire dans le tableau ci-dessous (comptez une méthode par participant) :
Combien de participants ont appris l'existence du CLÉ TD par les méthodes suivantes?
Total
1. Exposé du personnel de la bibliothèque dans les écoles
2. Exposé du personnel de la bibliothèque dans les camps de jour, les services de garde, les projets communautaires, les ensembles de logements publics, les programmes confessionnels, etc.
3. Promotion par le personnel dans les succursales
4. Bouche-à-oreille
5. Invitations des écoles
6. Participation au CLÉ TD l’été dernier
7. Médias (radio, journaux, sites Web, guide des programmes de la bibliothèque, annonces dans les transports en commun)
8. Autres – Prière de préciser :
Vous fournissez des données pour _<NOMBRE>_ de bibliothèques/succursales. Veuillez indiquer le nombre de ces points de service qui ont répondu « Oui » et « Non », et si certains points de service n'ont pas fournit d'information, veuillez indiquer ce nombre sous « Aucune information fournie ».
Le personnel de la bibliothèque a-t-il fait des visites dans les écoles, les camps de jour, les garderies, les projets communautaires, les ensembles de logements publics, les programmes confessionnels, etc.?
Oui Non Aucune information
fournie
LAC – TD Summer Reading Club 2011 Summary Report of Program Statistics
Veuillez évaluer votre degré de satisfaction à l’égard des aspects suivants du programme :
Vous fournissez des données pour _<NOMBRE>_ de bibliothèques/succursales. Pour chaque énoncé, veuillez indiquer le nombre de points de service qui ont répondu pour chaque niveau de satisfaction. Si certains points de service n'ont pas fournit d'information, veuillez indiquer ce nombre sous « Aucune information fournie ».
À titre d'exemple, si vous fournissez des données pour quatre points de service, et que deux d'entre eux sont très satisfaits et que les deux autres sont satisfaits de l'« Affiche du programme », veuillez indiquer le chiffre 2 dans les colonnes « Satisfait » et « Très satisfait » de la rangée « Affiche du programme ».
Très insatisfait
Insatisfait Indifférent Satisfait Très satisfait
Satisfaction globale à l’égard du thème
Représentation graphique du thème dans la documentation
Qualité du livret d’activités
Pertinence du contenu du livret d’activités
Affiche du programme
Pertinence du contenu du guide d’animation
Matériel promotionnel
Menus et navigation sur le site Web www.td-club-td.ca
Contenu du site Web
Matériel offert sur le site Web
Le site Web « Pour jeunes »
Satisfaction globale à l’égard du site Web
LAC – TD Summer Reading Club 2011 Summary Report of Program Statistics
Avez-vous des indicateurs qui montrent si les enfants ont pris plus de plaisir à lire? S’ils lisent mieux? S’ils ont changé d’attitude envers la lecture? (Max. 60 mots)
Avez-vous des témoignages de parents, d’accompagnateurs ou d’enseignants indiquant une amélioration des capacités de lecture de l’enfant? (Max. 60 mots)
SUGGESTIONS AU SUJET DU PROGRAMME
Avez-vous des suggestions de thèmes pour les programmes à venir? (Max. 20 mots)
Avez-vous des suggestions sur la façon d'améliorer ou de faciliter le processus de rapport des statistiques du programme ou de le rendre plus précis? (Max. 70 mots)
Avez-vous des suggestions générales au sujet du CLÉ TD? (Max. 70 mots)
BIBLIOTHÈQUE ET ARCHIVES CANADA VOUS REMERCIE DE VOTRE COLLABORATION
LAC – TD Summer Reading Club 2011 Summary Report of Program Statistics
Ontario Program Statistics Response Rate The participating libraries within these three Ontario regions were asked to tally the results of participants in the summer reading club for all of their subsidiary branches. Of the 342 library systems in all three regions, 316 responded, resulting in an overall submission rate of 92%. Within all systems, 771 of the 820 individual libraries submitted their results, representing an overall response rate of 94%.
Figure 1. Response Rate
Ontario TPL SOLS OLS-N
(A) Total Participating Libraries 820 97 619 104
(B) Total Responded to Survey 771 97 589 85
(C) Survey Response Rate 94% 100% 95% 82%
Source: Row (A) provided by Library and Archives Canada. Rows (B) and (C) represent data collected by Harris/Decima.
LAC – TD Summer Reading Club 2011 Summary Report of Program Statistics – Ontario
Number of Children The first section of the Statistics and Evaluation Form asked librarians to indicate the total number of children registered for the TDSRC 2011. This reflects the number of children who registered on the sign-up sheet, with the intent to read books as part of the TD Summer Reading Club.
In Ontario, an estimated 153,779 children registered for the TDSRC 2011 program. This represents a slight increase from 2010 in Ontario, but only Toronto actually showed an increase in 2011. Girls comprise 85,049, or 55%, of the participants, while the 68,730 boys represent 45% of the participants.
Figure 2. Percentage of Participating Children by Gender
54%
54%
55%
55%
55%
55%
55%
46%
46%
45%
45%
45%
45%
45%
0% 20% 40% 60% 80% 100%
2005
2006
2007
2008
2009
2010
2011
Girls Boys
Figure 2.1 Number of Participating Children by Ontario Region
Region 2011 2010 Ontario 153,779 153,003
SOLS 113,490 114,861 OLS-North 5,078 5,377 Toronto 35,211 32,765
Ontario Totals: 153,779 153,003
Base: All localities that submitted results (n=771). Data is weighted to reflect all localities that participated in the TDSRC programm (n=820). Source: Q3-Q10. Total number of children who registered for the TDSRC 2011.
LAC – TD Summer Reading Club 2011 Summary Report of Program Statistics – Ontario
Of the girls, 29% fall in the 0-5 age group, 39% are aged 6-8, 30% are aged 9-12, and 3% are 13 years or older. Among the boys, 32% are aged 0-5, 40% are aged 6-8, 26% are aged 9-12, and 2% are aged 13 and older. These results are almost identical to the results in 2010.
Figure 3.1 Percentage of Participating Children by Gender and Age
Base: All localities that submitted results (n=771). Data is weighted to reflect all localities that participated in the TDSRC program (n=820). Source: Q3-Q10. Total number of children who registered for the TDSRC 2011.
Figure 3 below summarizes the participation rate for Ontario by gender and age based on 2006 census data.
Base: All localities that submitted results (n=771). Data is weighted to reflect all localities that participated in the TDSRC program (n=820). Source: Columns (A) through (C) provided by Statistics Canada Census 2006. Column (D) through (F) represents data collected by Harris/Decima.
LAC – TD Summer Reading Club 2011 Summary Report of Program Statistics – Ontario
Programs and Activities Organized Around the Club Theme To help gauge the success of the TDSRC, libraries were asked to indicate the total number of programs and activities organized around this year’s club theme as well as their total attendance, if recorded.
When reviewing these numbers, several points need to be kept in mind:
• Every child who registered for the reading club with the library is considered to have attended an activity.
• It is possible that a child did not register for the TDSRC, but attended one or more of the activities;
• Attendance was calculated on a per activity basis. It is possible that a child attended more than one activity, and thus is represented more than once in total attendance.
A total of 18,558 organized programs and activities were scheduled in libraries across Ontario over the months of July and August 2011. Total attendance amounted to 311,730 children. This translates to an approximate average of 17 children per activity.
Regionally, SOLS organized 15,731 theme-related activities and 235,587 children attended, averaging to 15 children per activity. OLS-North organized 1,323 activities, with a total of 18,223 children in attendance, translating to approximately 14 children per activity. The Toronto Public Library organized 1,504 activities and claimed a total of 57,920 children in attendance, which averages to 39 children per activity.
LAC – TD Summer Reading Club 2011 Summary Report of Program Statistics – Ontario
Drop-Ins versus Clubs Around one in three (35%) of the localities in Ontario ran the summer reading club both as a drop-in and as a club. A total of 41% of localities ran their summer reading club exclusively as a drop-in program, whereas 18% of the systems ran theirs solely as a reading club (this was far more likely in Northern Ontario). The remaining 6% used neither approach or did not report data.
The distribution of drop-ins and clubs organized across the regions of Ontario are detailed in Figure 4.
Figure 4. Percentage of Drop-ins and Clubs by Province and Region
Base: All localities that submitted results (n=771). Data is weighted to reflect all localities that participated in the TDSRC program (n=820). Source: Q17. Did you run this as a drop-in program? / Q18. Did you run the program as a club? (e.g. with distinct meeting times).
LAC – TD Summer Reading Club 2011 Summary Report of Program Statistics – Ontario
Program Successes Depending on how libraries implemented the program, they tracked the impact of their program on reading habits and learning using a variety of metrics. These included:
Total number of children who collected all nine stickers;
Total number of books reported on;
Total number of books read; and
Total number of hours read.
Stickers Collected Stickers were used by many of the libraries as incentives for children to read more books. The ultimate goal was to collect all nine stickers. In the province of Ontario, 74% of the libraries used stickers as incentives for children to read more books. Among these systems, 78,286 children reached the target of collecting all nine stickers. The breakdown across regions is as follows:
SOLS: 70% of libraries used stickers as incentives, and 68,178 children collected all nine stickers;
OLS-North: 64% used stickers as incentives; 1,257 children collected all nine stickers;
TPL: 87% used stickers as incentives; 8,851 children collected all nine stickers.
LAC – TD Summer Reading Club 2011 Summary Report of Program Statistics – Ontario
The average number of books read per child translates to a total of 1,475,047 books read within Ontario as part of the summer reading club. The regional breakdown is as follows:
SOLS: 994,026 books read;
OLS-North: 27,297 books read;
TPL: 162,122 books read.
Promotion of Program
School and Daycare Visits by Library Staff Librarians were asked to indicate if anyone from their library branch made any visits to the local schools and daycares in order to promote the program.
The great majority of libraries (72%) indicate that their library staff made visits to schools and daycares to promote the summer reading club. In total, 4,575 visits were made to schools and daycares, and 215,431 children were reached by these means.
The distribution by region is detailed in Figure 5.
Figure 5. School and Daycare Visits by Staff by Province and Region
Base: All localities that submitted results (n=771). Data is weighted to reflect all localities that participated in the TDSRC program (n=820). Source: Q24. School/daycare visits by library staff; Q25. If yes, total number of visits; Q26. If yes, total number of children reached.
LAC – TD Summer Reading Club 2011 Summary Report of Program Statistics – Ontario
Impact of School and Daycare Visits Ontario’s library systems made school and daycare visits, reaching a total of 215,431 children. Among these systems, a total of 110,499 children participated in the TDSRC, representing 51% of children reached.
Among these same library systems, 28,657 children indicated that they first heard of the TDSRC via a school or daycare visit, representing 26% of the total participants.
The distribution of the impact of school and daycare visits by region is detailed in Figure 6.
Base: All localities that submitted results (n=771). Data is weighted to reflect all localities that participated in the TDSRC program (n=820). Source: Q26. If yes, total number of children reached. Q23A/B. Number of participants that first heard about the TDSRC by a school/ summer day camps/ daycare/ community of public presentations by library staff.
LAC – TD Summer Reading Club 2011 Summary Report of Program Statistics – Ontario
Method of Promotion Promotional aspects were further investigated by asking librarians to tally, from the registration forms, how the participants first heard about the program.
Roughly 53,500 (35%) participants first heard of the TDSRC through staff promotion in the branch, while approximately 36,800 (24%) heard through a presentation at their school or daycare. A total of around 32,500 (21%) were aware of the event from participating in 2010 and 12,600 (8%) heard through word-of-mouth. Around 7,700 participants became aware because of school invitations (5%). The media was mentioned by almost 6,600 children (4%), and other sources represented about 3%. Details are provided in Figure 7.
Figure 7. How Participants First Heard About the Program
53,463
36,816
32,486
12,618
7,661
6,585
4,150
55,221
33,655
33,007
12,868
8,973
5,445
3,832
53,246
35,457
32,983
15,360
13,849
5,186
5,194
0 10,000 20,000 30,000 40,000 50,000 60,000
Staff promotion in branch
School / Daycare presentation
Joined last year
Word-of-mouth
School invitations
Media
Other
Total Number of Responses
2011 2010 2009
35%36%33%
24%22%22%
21%22%20%
8%8%10%
5%6%9%
4%4%3%
3%3%3%
% of Cases
Base: All localities that submitted results (n=771). Data is weighted to reflect all localities that participated in the TDSRC program (n=820). Source: Number of participants that first heard about the TDSRC by the following methods: Q23A. Schools; Q23B. Summer day camps, daycare centres, community/public housing projects, faith-based program presentation by library staff; Q23C. Staff promotion in branch; Q23D. Word-of-mouth; Q23E. School invitations; Q23F. Joined last year; Q23G. Media (radio, newspaper, website, library program guide, Transit ads); Q23H. Other.
LAC – TD Summer Reading Club 2011 Summary Report of Program Statistics – Ontario
Satisfaction with Program Elements The 2011 Statistics and Evaluation Form included questions that asked respondents to rate their level of satisfaction with more specific elements of the program.
By and large, satisfaction levels in Ontario were similar to those of 2010. Top two box scores (the sum of “very satisfied” and “satisfied” responses) reveal that localities in Ontario appreciated the theme (94%), the visual representation of the theme in the materials, and the quality of the logbook (91% each). Satisfaction with the relevance of the logbook content (90%) was also high, but there was also much more satisfaction with the program poster in 2011 than in previous years.
Figure 9. Satisfaction with Program Elements
59%67%
58%
55%46%48%
52%55%
50%
48%50%
44%
54%45%47%
35%27%
35%
36%44%42%
39%38%
46%
42%41%
48%
36%35%
39%
5%5%
4%
7%6%
8%
7%6%
3%
9%8%8%
6%11%
11%
0% 25% 50% 75% 100%
201120102009
201120102009
201120102009
201120102009
201120102009
Very satisfied Satisfied Neutral
Top 2 Box
91%93%96%
94%94%93%
91%90%90%
90%80%86%
90%91%92%
Base: All localities that submitted results (n=771). Data is weighted to reflect all localities that participated in the TDSRC program (n=820). Source: Q27A-Q27E. Rate your level of satisfaction with the program elements below.
Program Poster
Overall Appreciation of the Theme
Quality of the Logbook
Relevance of Content in Logbook
Visual Representation of the Theme in the Materials
LAC – TD Summer Reading Club 2011 Summary Report of Program Statistics – Ontario
Libraries also rated their level of satisfaction with other program materials, such as various aspects of the website, promotional materials and the Staff Manual.
Top two box scores reveal that 81% of libraries in Ontario were satisfied overall with the website consistent with 2010’s results. 85% were satisfied with the promotional material, 83% with the material available on the website, and 82% with the content of the website. Four in ten were satisfied with the menus and navigation on the website, and just slightly fewer people were satisfied with the relevance of the content of the staff manual (79%), and satisfaction with the kid’s website (78%).
Figure 10. Satisfaction with Support Material
29%33%33%
36%36%35%
31%34%34%
31%35%36%
32%31%31%
42%39%
52%
29%31%
37%
52%48%
54%
49%45%
56%
52%47%
51%
51%46%
49%
48%49%
52%
37%48%
41%
49%42%
43%
18%18%
12%
11%16%
9%
15%16%
14%
17%18%
14%
18%18%
16%
19%10%
6%
21%25%
20%
0% 25% 50% 75% 100%
201120102009
201120102009
201120102009
201120102009
201120102009
201120102009
201120102009
Very satisfied Satisfied Neutral
Top 2 Box
81%81%87%
83%81%85%
85%81%91%
79%87%93%
82%81%85%
78%73%80%
80%80%83%
Base: All localities that submitted results (n=771). Data is weighted to reflect all localities that participated in the TDSRC program (n=820). Source: Q27A-Q27E. Rate your level of satisfaction with the program elements below.
Relevance of Content in Staff Manual
Content of Website
Promotional Material
Menus and Navigation on Website
Materials Available on the Website
Overall Satisfaction With Website
Kid’s Website
LAC – TD Summer Reading Club 2011 Summary Report of Program Statistics – Ontario
Program Reading Outcomes Indicators of Success Libraries were asked to indicate whether they had any indicators of a child’s increased enjoyment of reading, reading successes or changes in attitudes toward reading. The most common indicator was that children got involved and had fun and enjoyed the program (33%), but many also mentioned by 22% of respondents that the children were proud of their accomplishments. One in five (20%) reported increased reading habits and 19% mentioned children discussing and reporting on books. A further 17% mention the activities/games and the prizes/games which were part of the program.
Figure 11. Indicators of Success
33%
22%
20%
19%
17%
0% 5% 10% 15% 20% 25% 30% 35%
Getting involved/hooked/interested in reading/sharing books
Children enjoyed it/were proud of their accomplishments
Increased reading habits/number of books read
Discussion/talking/reporting about books read
Activities/games/prizes/stickers
Base: Library systems that provided a response (n=178).
Source: Q33. Do you have any indicators of a child's increased enjoyment of reading? Of reading successes? Changes in attitude toward reading?
LAC – TD Summer Reading Club 2011 Summary Report of Program Statistics – Ontario
Testimonials Libraries were also asked whether they had any testimonials from parents, caregivers or teachers that might indicate an improvement in reading level. In total, more than one in four (27%) said that children are reading more, that children enjoyed the program/theme, and general positive feedback about the program (26% each). Just under one in four (24%) mentioned that the program improved the reading skills/vocabulary of children, and in a similar vein, 14% stated that the program made the transition back to school easier.
Figure 12. Testimonials
27%
26%
26%
24%
14%
0% 5% 10% 15% 20% 25% 30%
Children like to read more
Children enjoy the program/theme
Positive feedback/good/worthwhile/useful program
Improves reading skills/vocabulary of children
Good for back-to-school/easier transition/maintained ability
Base: Library systems that provided a response (n=135).
Source: Q34. Do you have any testimonials from parents, caregivers or teachers that may indicate an improvement in reading level?
LAC – TD Summer Reading Club 2011 Summary Report of Program Statistics – Ontario
Suggestions Future Themes Libraries were asked to provide suggestions for future program themes. Almost one in three respondents mentioned multiculturalism/other countries (32%), making it the most commonly mentioned theme. A quarter suggested themes which revolve around fantasy/adventure (25%), and 21% mention themes about animals/pets. History themes were suggested by 17% and nature themes (15%) were also quite popular.
Figure 13. Suggestions for Future Themes
32%
25%
21%
17%
15%
0% 5% 10% 15% 20% 25% 30% 35%
Multiculturalism/other cultures/countries
Fantasy/adventure
Animals/pets/bugs/insects
History
Nature
Base: All library systems that provided a response (n=143). Source: Q35. Do you have any suggestions on the program’s future themes?
LAC – TD Summer Reading Club 2011 Summary Report of Program Statistics – Ontario
TDSRC Statistics Collection Libraries were asked to provide suggestions on how to improve the collection of program statistics. As in the national report, while the majority of libraries did not have any specific suggestions (65% overall either didn’t have a response or felt the process did not need improvement), among those who did give a response to this question, 29% of them recommended getting the forms earlier. The two next most popular suggestions were to standardize the forms and to provide more instruction and that the process did not require any changes (16% each). Others mentioned enabling the online form for all libraries (including those within larger systems – 9%) and clarifying the survey questions (8%). The most common responses are listed below.
Figure 14. Suggestions for Data Collection
Suggestions For Improving Reporting 2011Provide survey/forms/reports earlier 29%Standardize forms/provide suggestions/more instructions 16%Fine/easy/straightforward/no need for improvement 16%Enable online form/reporting/registration 9%Clarify/specify survey questions 8%Provide forms (general) 7%Enable Excel spreadsheet/database registration 7%Difficult/time consuming to keep counts 5%Allow/require weekly/daily reporting 2%Do not track/require stats on gender 2%
Base: Localities/library systems that provided a response. (n=129). Source: Q37. Do you have any suggestions on how the reporting of program statistics could be improved or made easier/more accurate?
LAC – TD Summer Reading Club 2011 Summary Report of Program Statistics – Ontario
TDSRC Overall Libraries were asked to provide suggestions on the TDSRC overall. In total, 23% suggested improving the design of the materials. A further 12% suggested a better variety of materials, 11% said more age-appropriate materials and 8% requested receiving the materials/info about the theme sooner. 6% asked for an improved/updated website.
Figure 15. Suggestions for TDSRC Overall
23%
12%
11%
8%
6%
0% 5% 10% 15% 20% 25%
Improve/better design of materials/forms
Provide us with more/variety of materials
More age-appropriate material
Let us know theme sooner/send the materials earlier
Improve/update website
Base: Library systems that provided a response (n=166). Source: Q36. Do you have any suggestions on the TDSRC overall?
Quebec Program Statistics Response Rate The participating libraries in Quebec were asked to tally the results of participants in the summer reading club for all of their subsidiary branches. Of the 56 library systems 43 responded, resulting in an overall submission rate of 77%. Within all systems, 270 of the 340 participating individual libraries submitted their results, representing an overall response rate of 79%.
Figure 1. Response Rate
Quebec BPQ RBQ
(A) Total Participating Libraries 340 112 228
(B) Total Responded to Survey 270 94 176
(C) Survey Response Rate 79% 84% 77%
Source: Row (A) provided by Library and Archives Canada. Rows (B) and (C) represent data collected by Harris/Decima.
LAC – TD Summer Reading Club 2011 Summary Report of Program Statistics – Quebec (English)
Number of Children The first section of the Statistics and Evaluation Form asked librarians to indicate the total number of children registered for the TDSRC 2011. This reflects the number of children who registered on the sign-up sheet, with the intent to read books as part of the TD Summer Reading Club.
In Quebec, an estimated 27,391 children registered for the TDSRC 2011 program, a very slight increase over 2010. This is up from an estimated 24,276 in 2008, but still not as high as the 2009 peak of 29,812. Girls comprise 15,449, or 56%, of the participants, while the 11,942 boys represent 44% of the participants, virtually unchanged from previous years.
Figure 2. Percentage of Participating Children by Gender
56%
55%
57%
56%
56%
56%
56%
44%
45%
43%
44%
44%
44%
44%
0% 20% 40% 60% 80% 100%
2005
2006
2007
2008
2009
2010
2011
Girls Boys
Base: All localities that submitted results (n=270). Data is weighted to reflect all localities that participated in the TDSRC program (n=340). Source: Q3-Q10. Total number of children who registered for the TDSRC 2011.
LAC – TD Summer Reading Club 2011 Summary Report of Program Statistics – Quebec (English)
Figure 3.1 below shows the age breakdown of participating children. For the summer 2011, 18% of the girls were in the 0-5 age group, 38% were 6-8, 40% were 9-12, and 5% were 13 years or older. The boys tended to be younger than the girls again in 2011, with 20% aged 0-5, 40% aged 6-8, 38% aged 9-12, and 3% aged 13 and older.
Figure 3.1. Percentage of Participating Children by Gender and Age
Base: All localities that submitted results (n=270). Data is weighted to reflect all localities that participated in the TDSRC program (n=340). Source: Q3-Q10. Total number of children who registered for the TDSRC 2011.
Figure 3 below summarizes the participation rate for Quebec by age and gender based on 2006 census data. Participation rates were similar to 2010 levels (a slight increase overall of .02%) with higher participation in the 6-8 and 9-12 age categories.
Figure 3. Number of Participating Children
2006 CENSUS 2011 TD SRC PARTICIPANTS % PARTICIP. CHILDREN
Base: All localities that submitted results (n=270). Data is weighted to reflect all localities that participated in the TDSRC program (n=340). Source: Columns (A) through (C) provided by Statistics Canada Census 2006. Column (D) through (F) represents data collected by Harris/Decima.
LAC – TD Summer Reading Club 2011 Summary Report of Program Statistics – Quebec (English)
Reading Kits and Posters The libraries were also asked to indicate the total number of reading kits and posters that were given out to children coming into the library, including those given to daycares and other agencies that came in to pick up reading kits or posters for their group. Anyone who came to a branch and asked for a full reading kit or poster was eligible to receive one. Registration for the TDSRC was not necessary and staff could choose how to distribute the material. In total, 30,530 reading kits were distributed across Quebec, as well as 20,799 posters, an increase in both categories.
Program Statistics
Programs and Activities Organized Around the Club Theme To help gauge the success of the TDSRC, libraries were asked to indicate the total number of programs and activities organized around this year’s club theme as well as their total attendance, if recorded.
When reviewing these numbers, several points need to be kept in mind:
• Every child who registered for the reading club with the library is considered to have attended an activity.
• It is possible that a child did not register for the TDSRC, but attended one or more of the activities;
• Attendance was calculated on a per activity basis. It is possible that a child attended more than one activity, and thus is represented more than once in total attendance.
A total of 2,384 organized programs and activities were scheduled in libraries across Quebec over the months of July and August 2011. This represents a negligible difference from 2010. Similarly, the total attendance at these activities was 37,430, a very slight decrease since 2010. This translates to an average of 16 children per activity.
BPQ organized 1,343 theme-related activities and 24,627 children attended; an average of 18 children per activity. RBQ organized 1,041 activities and reported a total attendance of 12,803 children; an average of 12 children per activity.
LAC – TD Summer Reading Club 2011 Summary Report of Program Statistics – Quebec (English)
Drop-Ins versus Clubs Libraries had the option to run the program as a drop-in program or as a club with distinct meeting times. 37% of the localities in Quebec ran the summer reading club as a drop-in only. A similar proportion of libraries, however, ran their summer reading club as both a club and a drop-in program (32%). Only 6% reported running it as a club only, and 25% either did not give this information or did not use either approach.
The distribution of drop-ins and clubs organized across the segments of Quebec are detailed in Figure 4.
Figure 4. Percentage of Drop-ins and Clubs by Segment
Base: All localities that submitted results (n=270). Data is weighted to reflect all localities that participated in the TDSRC program (n=340). Source: Q17. Did you run this as a drop-in program? / Q18. Did you run the program as a club? (e.g. with distinct meeting times).
Program Successes Depending on how libraries implemented the program, they tracked the impact of their program on reading habits and learning using a variety of metrics. These included:
Total number of children who collected all nine stickers;
Total number of books reported on;
Total number of books read; and
Total number of hours read.
Stickers Collected Stickers were used by many of the libraries as incentives for children to read more books. The ultimate goal was to collect all nine stickers. In total, 72% of the libraries used stickers as incentives for children. This is similar to the 68% who used stickers in 2010. The percentage of children who collected all 9 stickers was also quite similar. Among the systems that used stickers as incentives 18,197 children reached the target of collecting all nine, virtually unchanged from in 2010 (18,415) The breakdown across segments is as follows:
BPQ: 68% of libraries used stickers as incentives, and within these libraries 13,174 children (81%) collected all nine stickers;
RBQ: 83% used stickers as incentives; 5,022 children (61%) collected all nine stickers.
LAC – TD Summer Reading Club 2011 Summary Report of Program Statistics – Quebec (English)
The average number of books read per child translates to a total of 256,092 books read within the province of Quebec as part of the summer reading club. The breakdown by segment is as follows:
BPQ: 170,357 books read;
RBQ: 85,734 books read.
Promotion of Program
School and Daycare Visits by Library Staff Librarians were asked to indicate if anyone from their library branch made any visits to the local schools and daycares in order to promote the program.
43% of libraries indicate that their library staff had made visits to schools and daycares to promote the summer reading club. In total, 763 visits were made to schools and daycares, and 37,705 children were reached by these visits.
The distribution by segment is detailed in Figure 5.
Figure 5. Total Number of Visits and Children Reached by Segment
Base: All localities that submitted results (n=270). Data is weighted to reflect all localities that participated in the TDSRC program (n=340). Source: Q24. School/daycare visits by library staff; Q25. If yes, total number of visits; Q26. If yes, total number of children reached.
LAC – TD Summer Reading Club 2011 Summary Report of Program Statistics – Quebec (English)
Impact of School and Daycare Visits Many of the systems made school and daycare visits, reaching a total of 37,705 children. Among the systems that made visits, a total of 13,156 children participated in the TDSRC, representing 35% of the children reached.
Among these same library systems, 4,423 children indicated that they first heard of the TDSRC via a school or daycare visit, representing 34% of the total participants.
The distribution of the impact of school and daycare visits by segment is detailed in Figure 6.
Base: All localities that submitted results (n=270). Data is weighted to reflect all localities that participated in the TDSRC program (n=340). Source: Q26. If yes, total number of children reached. Q23A/B. Number of participants that first heard about the TDSRC by a school/ summer day camps/ daycare/ community of public presentations by library staff.
LAC – TD Summer Reading Club 2011 Summary Report of Program Statistics – Quebec (English)
Method of Promotion Promotional aspects were further investigated by asking librarians to tally, from the registration forms, how the participants first heard about the program. Roughly 7,900 participants (29%) first heard of the TDSRC through a school or day care presentation, a jump of 10% since 2010. 6,150 children knew about the program because they joined last year, another increase in proportion over previous years (19% to 22%). Although approximately 4,800 children knew about the program because of staff promotion in a branch, this is a decline from previous years (18% from 25%). School invitations were mentioned by around 4,000 participants (15%) and other sources such as the media (8%) and word-of-mouth (6%). Details are provided in Figures 7 and 8.
Figure 7. How Participants First Heard About the Program
7,907
6,159
4,816
4,028
2,260
1,552
669
5,042
5,060
6,776
4,663
1,228
3,217
1,083
5,358
4,418
7,479
9,180
985
2,019
374
0 5,000 10,000
School / Daycare presentation
Joined last year
Staff promotion in branch
School invitations
Media
Word-of-mouth
Other
Total Number of Responses
2011 2010 2009
29%19%18%
22%19%15%
18%25%25%
15%17%31%
8%5%3%
6%12%7%2%4%1%
% of Cases
Base: : All localities that submitted results (n=270). Data is weighted to reflect all localities that participated in the TDSRC program (n=340). Source: Number of participants that first heard about the TDSRC by the following methods: Q23A. Schools; Q23B. Summer day camps, daycare centres, community/public housing projects, faith-based program presentation by library staff; Q23C. Staff promotion in branch; Q23D. Word-of-mouth; Q23E. School invitations; Q23F. Joined last year; Q23G. Media (radio, newspaper, website, library program guide, Transit ads); Q23H. Other.
LAC – TD Summer Reading Club 2011 Summary Report of Program Statistics – Quebec (English)
Figure 8. How Participants First Heard About the Program by
Segment
Base: All localities that submitted results (n=270). Data is weighted to reflect all localities that participated in the TDSRC program (n=340). Source: Number of participants that first heard about the TDSRC by the following methods: Q23A. Schools; Q23B. Summer day camps, daycare centres, community/public housing projects, faith-based program presentation by library staff; Q23C. Staff promotion in branch; Q23D. Word-of-mouth; Q23E. School invitations; Q23F. Joined last year; Q23G. Media (radio, newspaper, website, library program guide, Transit ads); Q23H. Other.
Satisfaction with Program Elements The 2011 Statistics and Evaluation Form included questions that asked respondents to rate their level of satisfaction with more specific elements of the program. Beginning last year, an option was made available which allowed large systems to enter the number of libraries that had entered their responses individually in this section instead of simply entering one response. The first set of questions looked at the program materials.
Satisfaction levels remain extremely high for the province of Quebec. Top two box scores (the sum of “very satisfied” and “satisfied” responses) reveal that the vast majority of localities (95%) in Quebec were satisfied with the theme overall, and an even greater number were satisfied with the quality of the logbook (98%). The same is true of the relevance of the content in the logbook (97%), the program poster and the visual representation of the theme in the materials (96% each). Satisfaction was very similar to the levels recorded in 2010.
Figure 9. Satisfaction with Program Elements
48%52%51%
46%44%44%
47%41%40%
50%50%
44%
49%51%
40%
47%45%
45%
52%53%
50%
50%54%
51%
46%48%
45%
47%46%
52%
3%1%
1%
2%1%
3%
2%3%
7%
3%0%
3%
3%1%
4%
0% 25% 50% 75% 100%
201120102009
201120102009
201120102009
201120102009
201120102009
Very satisfied Satisfied Neutral
Top 2 Box
97%95%91%
95%97%96%
98%97%94%
96%97%92%
96%98%89%
Base: All localities that submitted results (n=270). Data is weighted to reflect all localities that participated in the TDSRC program (n=340). Source: Q27A-Q27E. Rate your level of satisfaction with the program elements below.
Relevance of Content in Logbook
Quality of the Logbook
Overall Appreciation of the Theme
Visual Representation of Theme in Materials
Program Poster
LAC – TD Summer Reading Club 2011 Summary Report of Program Statistics – Quebec (English)
Libraries also rated their level of satisfaction with other program materials, such as various aspects of the website, promotional materials and the Staff Manual.
Top two box scores reveal that 89% of libraries in Quebec were satisfied overall with the website. The vast majority were satisfied with promotional materials (95%) and the relevance of the content in the Staff Manual (90%). More than four in five were satisfied with the materials available on the website (89%), the content of the website (88%), and the menus and navigation of the website (87%). More than three in four were satisfied with the kids’ website (77%). Satisfaction was fairly consistent with 2010, with the only real drop being satisfaction with the kids’ website (down 6%).
Figure 10. Satisfaction with Support Material
28%24%
30%
44%38%
56%
43%33%
38%
27%31%
45%
31%31%
44%
27%29%
47%
22%23%
32%
61%65%
56%
51%56%
38%
47%60%
56%
62%55%
41%
57%60%
40%
60%58%
39%
55%60%
51%
9%9%
11%
3%4%
2%
6%5%5%
9%11%12%
10%9%
13%
10%11%
11%
21%16%14%
0% 25% 50% 75% 100%
201120102009
201120102009
201120102009
201120102009
201120102009
201120102009
201120092009
Very satisfied Satisfied Neutral
Top 2 Box89%89%86%
90%93%94%
95%94%94%
87%87%86%
89%86%86%
77%83%83%
88%91%84%
Base: All localities that submitted results (n=270). Data is weighted to reflect all localities that participated in the TDSRC program (n=340). Source: Q27F-Q27L. Rate your level of satisfaction with the program elements below.
Promotional Materials
Relevance of Content in Staff Manual
Kids' Website
Menus and Navigation of Website
Overall Satisfaction With Website
Content of Website
Materials Available on Website
LAC – TD Summer Reading Club 2011 Summary Report of Program Statistics – Quebec (English)
Program Reading Outcomes Indicators of Success Libraries were asked to indicate whether they had any indicators of a child’s increased enjoyment of reading, reading successes or changes in attitudes toward reading. The top seven responses are indicated in the graph below. The most common indicator was children getting involved/interested in reading (38%). A third also reported increased reading habits and number of books read. Just under a quarter (24%) mentioned that children were proud of their accomplishments or mentioned the prizes/stickers. 19% mentioned their children’s improved reading comprehension and skills, and that they are reading more on their own. Finally, 14% reported increased library visits and membership.
Figure 11. Indicators of Success
38%
33%
24%
24%
19%
19%
14%
0% 5% 10% 15% 20% 25% 30% 35% 40%
Getting involved/hooked/interested in reading/sharing books
Increased reading habits/number of books read
Children enjoyed it/were proud of their accomplishments
Activities/games/prizes/stickers
Improved reading/comprehension/reporting skills
Continued reading on their own/taking initiative to read
Increased library visitors and membership
Base: Library systems that provided a response (n=21).
Source: Q33. Do you have any indicators of a child's increased enjoyment of reading? Of reading successes? Changes in attitude toward reading?
LAC – TD Summer Reading Club 2011 Summary Report of Program Statistics – Quebec (English)
Testimonials Libraries were also asked whether they had any testimonials from parents, caregivers or teachers that might indicate an improvement in reading level. In total, more than a third of the reporting libraries (36%) mentioned that the children liked to read more. A little more than a quarter (27%) gave positive feedback about the program itself while just under a quarter (23%) said it made the transition to school easier. 14% reported that children enjoyed the program/theme and 9% said it improves the reading skills of children.
Figure 12. Testimonials
36%
27%
23%
14%
9%
0% 10% 20% 30% 40%
Children like to read more
Positive feedback/good/worthwhile/useful program
Good for back-to-school/easier transition/maintained ability
Children enjoy the program/theme
Improves reading skills/vocabulary of children
Base: Library systems that provided a response (n=22).
Source: Q34. Do you have any testimonials from parents, caregivers or teachers that may indicate an improvement in reading level?
LAC – TD Summer Reading Club 2011 Summary Report of Program Statistics – Quebec (English)
Suggestions Future Themes Libraries were asked to provide suggestions for future program themes. A wide variety of themes were proposed, but the most common were themes about multiculturalism and other countries, mentioned by more than half of libraries (52%). Fantasy/adventure themes were also common, with 48% mentioning them. Themes revolving around nature (38%), sports (29%), animals/bugs (19%) and history (19%) were also mentioned by libraries.
Figure 13. Suggestions for Future Themes
52%
48%
38%
29%
19%
19%
0% 10% 20% 30% 40% 50% 60%
Multiculturalism/other cultures/countries
Fantasy/adventure
Nature
Sports
Animals/pets/bugs/insects
History
Base: All library systems that provided a response (n=21). Source: Q35. Do you have any suggestions on the program’s future themes?
LAC – TD Summer Reading Club 2011 Summary Report of Program Statistics – Quebec (English)
Suggestions for Data Collection Libraries were asked to provide suggestions on the collection of data for the TDSRC. There were few responses, to this question (79% did not give a suggestion), but among those who did gave suggestions the most common revolved around standardizing forms (30%) and enabling online reporting for all individual libraries (20%). The responses given are summarized in the table below.
Figure 14. Suggestions for Data Collection
Suggestions For Improving Reporting 2011 Standardize forms/provide suggestions/more instructions 30% Enable online form/reporting/registration 20% Fine/easy/straightforward/no need for improvement 10% Provide forms 10% Allow/require weekly/daily reporting 10% Keep stats by age/gender 10% Other 20%
Base: Library systems that provided a response (n=10).
Source: Q37. Do you have any suggestions on how the reporting of program statistics could be improved or made easier/more accurate?
LAC – TD Summer Reading Club 2011 Summary Report of Program Statistics – Quebec (English)
Suggestions for TDSRC Overall Libraries were asked to provide suggestions on the TDSRC overall. The most common suggestion was to improve or update the website, mentioned by more than a third of libraries (35%). More than a quarter (26%) suggested a better design to the materials and forms. 13% suggested providing a better variety of materials and to send information about the theme/materials earlier. Another 9% also mentioned better marketing/publicity.
Figure 15. Suggestions for TDSRC Overall
35%
26%
13%
13%
9%
0% 5% 10% 15% 20% 25% 30% 35% 40%
Improve/update website
Improve/better design of materials/forms
Provide us with more/variety of materials
Let us know theme sooner/send the materials earlier
More/better marketing/publicity
Base: Library systems that provided a response (n=23). Source: Q36. Do you have any suggestions on the TDSRC overall?
Statistiques du programme pour le Québec Taux de réponse Les bibliothèques participantes du Québec devaient compiler les résultats relatifs aux participants du club de lecture d’été pour toutes leurs succursales. Parmi les 56 réseaux de bibliothèques, 43 réseaux ont répondu à l’appel, ce qui représente un taux de soumission global de 77 %. Dans tous les réseaux, 270 des 340 bibliothèques individuelles participantes ont communiqué leurs résultats, ce qui représente un taux de réponse global de 79 %.
Figure 1. Taux de réponse
Québec BPQ RBQ
(A) Nombre de bibliothèques participantes
340 112 228
(B) Nombre de répondants 270 94 176
(C) Taux de réponse au sondage 79% 84% 77%
Source : Les données de la ligne (A) sont fournies par Bibliothèque et Archives Canada. Les données des lignes (B) et (C) représentent les données recueillies par Harris/Décima.
BAC – Club de lecture d’été TD – 2011 Rapport sommaire des statistiques du programme – Québec (français)
Nombre d'enfants Dans la première section du formulaire d’évaluation et de statistiques, les bibliothécaires devaient indiquer le nombre total d'enfants inscrits au programme CLÉ TD 2011. Cette donnée indique le nombre d’enfants qui ont ajouté leur nom à la liste d’inscription et qui avaient l’intention de lire des livres dans le cadre du Club de lecture d’été TD. Au Québec, environ 27 391 enfants se sont inscrits au programme CLÉ TD 2011, soit une très faible augmentation par rapport à 2010. Les inscriptions sont plus nombreuses qu’en 2008 (environ 24 276), même si elles sont encore une fois inférieures au sommet atteint en 2009 (29 812). Cette année, le programme comptait 15 449 filles, soit 56 % des participants, et 11 942 garçons, soit 44 % des participants, et ces pourcentages demeurent pratiquement inchangés par rapport aux années précédentes.
Figure 2. Pourcentage de filles et de garçons qui ont participé
56%
55%
57%
56%
56%
56%
56%
44%
45%
43%
44%
44%
44%
44%
0% 20% 40% 60% 80% 100%
2005
2006
2007
2008
2009
2010
2011
Filles Garçons
Échantillon : Toutes les bibliothèques locales qui ont fourni des résultats (n=270). Les données sont pondérées pour refléter toutes les bibliothèques locales qui ont participé au CLÉ TD (n=340). Source : Q3-Q10. Nombre total d'enfants inscrits au programme CLÉ TD 2011.
BAC – Club de lecture d’été TD – 2011 Rapport sommaire des statistiques du programme – Québec (français)
La figure 3.1 ci-dessous présente la répartition des filles et des garçons qui ont participé en fonction de leur âge. À l’été 2011, 18 % des participantes étaient âgées de 0 à 5 ans, 38 %, de 6 à 8 ans, 40 %, de 9 à 12 ans et 5 %, de 13 ans et plus. Les garçons étaient encore une fois généralement plus jeunes que les filles en 2011 : 20 % d’entre eux étaient âgés de 0 à 5 ans, 40 %, de 6 à 8 ans, 38 %, de 9 à 12 ans et 3 %, de 13 ans et plus.
Figure 3.1. Pourcentage de filles et de garçons qui ont participé en fonction de leur âge
GARÇONS 2011 2010 2009 2008 2007 2006 20050 à 5 ans 20% 23% 18% 19% 17% 19% 20%6 à 8 ans 40% 39% 41% 41% 41% 39% 39%
9 à 12 ans 38% 35% 39% 38% 38% 38% 37%13 ans et plus 3% 3% 2% 2% 4% 4% 4%
FILLES 2011 2010 2009 2008 2007 2006 20050 à 5 ans 18% 18% 17% 18% 15% 16% 18%6 à 8 ans 38% 37% 38% 39% 37% 38% 36%9 à 12 ans 40% 39% 42% 40% 43% 42% 42%
13 ans et plus 5% 7% 3% 3% 5% 5% 4%
Échantillon : Toutes les bibliothèques locales qui ont fourni des résultats (n=270). Les données sont pondérées pour refléter toutes les bibliothèques locales qui ont participé au CLÉ TD (n=340). Source : Q3-Q10. Nombre total d’enfants inscrits au programme CLÉ TD 2011.
BAC – Club de lecture d’été TD – 2011 Rapport sommaire des statistiques du programme – Québec (français)
La figure 3 ci-dessous résume le taux de participation pour le Québec par sexe et par âge en fonction des données du recensement de 2006. Les taux de participation sont sensiblement les mêmes qu’en 2010 (une légère augmentation de 0,02 % globalement), avec une participation accrue des 6 à 8 ans et des 9 à 12 ans.
Figure 3. Nombre d’enfants qui ont participé
RECENSEMENT DE 2006 PARTICIPANTS AU CLÉ TD 2011 % D'ENFANTS QUI ONT PARTICIPÉ
Échantillon : Toutes les bibliothèques locales qui ont fourni des résultats (n=270). Les données sont pondérées pour refléter toutes les bibliothèques locales qui ont participé au CLÉ TD (n=340). Source : Les données des colonnes (A) à (C) proviennent du recensement de 2006 de Statistique Canada. Les colonnes (D) à (F) présentent les données recueillies par Harris/Décima.
BAC – Club de lecture d’été TD – 2011 Rapport sommaire des statistiques du programme – Québec (français)
Trousses de lecture et affiches Les bibliothèques devaient également indiquer le nombre total de trousses de lecture et d’affiches distribuées aux enfants à la bibliothèque, incluant celles remises aux garderies et autres agences qui sont venues en chercher pour leurs groupes. Toute personne qui se présentait à la succursale et demandait une trousse de lecture complète ou l’affiche pouvait les obtenir. Il n’était pas nécessaire de s’inscrire au CLÉ TD et les employés pouvaient distribuer le matériel à leur guise. En tout, 30 530 trousses de lecture ont été distribuées partout au Québec, de même que 20 799 affiches, ce qui représente une hausse dans les deux cas.
Statistiques relatives au programme
Programmes et activités organisés autour du thème du club Pour aider à mesurer la réussite du CLÉ TD, les bibliothèques devaient indiquer le nombre de programmes et d’activités organisés autour du thème annuel du club de lecture ainsi que le nombre total de participants, si elles l’avaient noté.
La lecture de ces données nécessite certaines mises au point :
• Chaque enfant qui s’est inscrit au club de lecture d’une bibliothèque est considéré comme ayant participé à une activité;
• Il est possible qu’un enfant ne se soit pas inscrit au CLÉ TD, mais qu’il ait participé à une ou plusieurs activités;
• Le taux de participation est calculé en fonction de chacune des activités. Il est possible qu’un enfant ait participé à plus d’une activité et qu’il ait donc été comptabilisé plus d’une fois.
En tout, 2 384 programmes et activités ont été organisés dans les bibliothèques partout au Québec au cours des mois de juillet et août 2011. Il s’agit d’une différence négligeable par rapport à 2010. De même, le nombre total de participants à ces activités est de 37 340, soit une très légère diminution par rapport à 2010. Le nombre moyen d’enfants par activité est de 16.
Les BPQ ont organisé 1 343 activités autour du thème du CLÉ TD et 24 627 enfants y ont participé, ce qui représente une moyenne de 18 enfants par activité. Le Réseau BIBLIO a organisé 1 041 activités et a rapporté qu’en tout, 12 803 enfants y avaient participé, soit une moyenne de 12 enfants par activité.
BAC – Club de lecture d’été TD – 2011 Rapport sommaire des statistiques du programme – Québec (français)
Porte ouverte et club de lecture Les bibliothèques avaient la possibilité d’administrer le programme suivant le principe de la porte ouverte ou du club de lecture (avec des réunions à heures fixes). Au Québec, 37 % des bibliothèques locales ont uniquement fonctionné selon le principe de la porte ouverte. Toutefois, un pourcentage similaire de bibliothèques ont fonctionné à la fois selon le principe du club de lecture et selon celui de la porte ouverte (32 %). À peine 6 % des bibliothèques ont rapporté avoir administré le programme uniquement suivant le principe du club de lecture, et 25 % d’entre elles n’ont pas fourni ce renseignement ou n’ont utilisé aucune de ces approches.
La figure 4 présente les détails de la répartition des bibliothèques au Québec qui ont fonctionné selon le principe de la porte ouverte et de celles qui ont administré le programme comme un club.
Figure 4. Pourcentage de portes ouvertes et de clubs de lecture par segment
Échantillon : Toutes les bibliothèques locales qui ont fourni des résultats (n=270). Les données sont pondérées pour refléter toutes les bibliothèques locales qui ont participé au CLÉ TD (n=340). Source : Q17. Avez-vous fonctionné suivant le principe de la porte ouverte?/Q18. Avez-vous administré le programme comme un club? (p. ex., réunions à heures fixes).
BAC – Club de lecture d’été TD – 2011 Rapport sommaire des statistiques du programme – Québec (français)
Réussite du programme Selon la mise en œuvre privilégiée, les bibliothèques ont mesuré l’effet du programme sur les habitudes et les habiletés de lecture à l’aide de plusieurs paramètres, notamment :
Nombre total d’enfants qui ont obtenu les 9 autocollants;
Total de livres pour lesquels des comptes rendus de lecture ont été
produits;
Total des livres lus;
Total des heures de lecture.
Autocollants à collectionner Nombre de bibliothèques ont eu recours aux autocollants pour inciter les enfants à lire davantage. Pour les enfants, le but ultime était de collectionner les 9 autocollants. En tout, 72 % des bibliothèques ont eu recours aux autocollants pour inciter les enfants à lire. Ce pourcentage est semblable à celui enregistré en 2010, alors que 68 % des bibliothèques ont eu recours aux autocollants. Le pourcentage des enfants qui ont obtenu les 9 autocollants est également assez semblable. Au sein des réseaux qui ont eu recours aux autocollants, 18 197 enfants ont réussi à collectionner les 9 autocollants, soit pratiquement le même nombre qu’en 2010 (18 415 enfants). La répartition par segment est la suivante :
BPQ : 68 % des bibliothèques ont utilisé les autocollants comme incitatifs, et au sein de ces bibliothèques, 13 174 enfants (81 %) ont réussi à collectionner les neuf autocollants;
Réseau BIBLIO : 83 % des bibliothèques ont utilisé les autocollants comme incitatifs et 5 022 enfants (61 %) ont réussi à collectionner les neuf autocollants.
BAC – Club de lecture d’été TD – 2011 Rapport sommaire des statistiques du programme – Québec (français)
Livres lus et comptes rendus de lecture Dans les réseaux de bibliothèques qui ont recueilli ces statistiques, chaque enfant a en moyenne :
• Rédigé 1,2 compte rendu de lecture; • Lu 9,2 livres; • Consacré 5,6 heures à la lecture.
La moyenne de livres par enfant se traduit par 256 092 livres lus dans le cadre du club de lecture d’été. Voici la répartition selon les segments :
BPQ : 170 357 livres lus;
Réseau BIBLIO : 85 734 livres lus.
Promotion du programme
Visites des employés des bibliothèques dans les écoles et les garderies Les bibliothécaires devaient indiquer si certains employés de la bibliothèque avaient visité des écoles et des garderies de la région pour faire la promotion du club de lecture.
43 % des bibliothèques ont indiqué que leurs employés avaient visité des écoles et des garderies pour faire la promotion du club de lecture. En tout, ils ont fait 763 visites dans les écoles et les garderies et ainsi joint 37 705 enfants.
La figure 5 présente la répartition par segment.
Figure 5. Visites du personnel dans les écoles et les garderies selon le segment
Échantillon : Toutes les bibliothèques locales qui ont fourni des résultats (n=270). Les données sont pondérées pour refléter toutes les bibliothèques locales qui ont participé au CLÉ TD (n=340). Source : Q24. Visites par le personnel de la bibliothèque dans les écoles ou les garderies; Q25. Si oui, nombre de visites; Q26. Si oui, nombre d’enfants joints.
BAC – Club de lecture d’été TD – 2011 Rapport sommaire des statistiques du programme – Québec (français)
Effet des visites dans les écoles et les garderies Les employés de bon nombre de réseaux de bibliothèques ont fait des visites dans les écoles et les garderies et ont joint 37 705 enfants. Dans les réseaux qui ont effectué des visites, 13 156 enfants ont participé au programme CLÉ TD, ce qui représente 35 % des enfants joints.
Dans ces réseaux de bibliothèques, 4 423 enfants ont indiqué qu’ils avaient d’abord entendu parler du CLÉ TD lors d’une visite à l’école ou à la garderie, ce qui représente 34 % du nombre total de participants.
La figure 6 présente la répartition de l’effet des visites dans les écoles et les garderies selon le segment.
Figure 6. Effet des visites dans les écoles et les garderies
Région Nombre total
d'enfants joints par les visites
Nombre total de participants provenant
des écoles et des garderies visitées
Taux de participation des enfants
visités
En ont d'abord entendu parler lors de la visite du personnel
Échantillon : Toutes les bibliothèques locales qui ont fourni des résultats (n=270). Les données sont pondérées pour refléter toutes les bibliothèques locales qui ont participé au CLÉ TD (n=340). Source : Q26. Si oui, nombre d’enfants joints. Q23A/B. Nombre de participants qui ont appris l’existence du CLÉ TD par un exposé du personnel de la bibliothèque dans les écoles/les camps de jour/la communauté.
BAC – Club de lecture d’été TD – 2011 Rapport sommaire des statistiques du programme – Québec (français)
Méthode de promotion Comme il fallait obtenir de plus amples renseignements sur les aspects promotionnels du programme, les bibliothécaires devaient relever, au moyen des formulaires d’inscription, comment les participants avaient d’abord entendu parler du programme. Environ 7 900 participants (29 %) ont appris l’existence du CLÉ TD lors d’un exposé du personnel dans leur école ou leur garderie, soit un bond de 10 % par rapport 2010. 6 150 enfants connaissaient le programme parce qu’ils avaient participé l’an dernier, ce qui représente également une augmentation par rapport aux années précédentes (de 19 % à 22 %). Même si environ 4 800 enfants connaissaient le programme en raison de la promotion effectuée par le personnel dans une succursale, il s’agit d’une baisse par rapport aux années précédentes (18 % comparativement à 25 %). Environ 4 000 participants (15 %) mentionnent les invitations des écoles. Les médias (8 %) et le bouche-à-oreille (6 %) font également partie des sources rapportées. Les figures 7 et 8 présentent les résultats en détail.
Figure 7. Façon dont les participants ont d’abord entendu parler du programme
7 907
6 159
4 816
4 029
2260
1 551
669
5 042
5 060
6 776
4 663
1 228
3 217
1 083
5 358
4 418
7 479
9 180
985
2 019
374
0 5 000 10 000
Présentation du personnel à l'école ou à la garderie
Participation au club l'été dernier
Promotion par le personnel dans les succursales
Invitations des écoles
Médias
Bouhe-à-oreille
Autre
Nombre total de réponses
2011 2010 2009
29%19%18%
22%19%15%
18%25%25%
15%17%31%
8%5%3%
6%12%7%2%4%1%
En %
Échantillon : Toutes les bibliothèques locales qui ont fourni des résultats (n=270). Les données sont pondérées pour refléter toutes les bibliothèques locales qui ont participé au CLÉ TD (n=340). Source : Le nombre de participants qui ont appris l’existence du CLÉ TD par les méthodes suivantes : Q23A. Écoles; Q23B Exposé du personnel de la bibliothèque dans les camps de jour, les services de garde, les projets communautaires, les ensembles de logements publics, les programmes confessionnels; Q23C. Promotion par le personnel dans les succursales; Q23D. Bouche-à-oreille; Q23E. Invitations des écoles; Q23F. Participation au CLÉ TD l’été dernier; Q23G. Médias (radio, journaux, sites Web, guide des programmes de la bibliothèque, annonces dans les transports en commun); Q23H. Autres.
BAC – Club de lecture d’été TD – 2011 Rapport sommaire des statistiques du programme – Québec (français)
Satisfaction à l’égard des aspects du programme Le formulaire d’évaluation et de statistiques 2011 comprenait des questions qui demandaient aux répondants d’évaluer leur degré de satisfaction à l’égard d’aspects plus précis du programme. Depuis l’an dernier, une option permet aux grands réseaux d’inscrire le nombre de bibliothèques qui ont elles-mêmes entré leurs réponses dans cette section au lieu de simplement inscrire une réponse. Les premières questions portaient sur le matériel du programme.
Les degrés de satisfaction demeurent extrêmement élevés dans la province de Québec. Les deux cotes supérieures (la somme des réponses « très satisfait(e) » et « satisfait(e) ») révèlent que la vaste majorité (95 %) des bibliothèques locales du Québec sont satisfaites du thème dans l’ensemble, et un pourcentage encore plus élevé d’entre elles sont satisfaites de la qualité du livret d’activités (98 %). Il en va de même pour la pertinence du contenu du livret d’activités (97 %), l’affiche du programme et la représentation graphique du thème dans la documentation (96 % pour chaque aspect). Les niveaux de satisfaction sont très semblables à ceux enregistrés en 2010.
Figure 9. Satisfaction à l’égard des aspects du programme
48%52%51%
46%44%44%
47%41%40%
50%50%
44%
49%51%
40%
47%45%
45%
52%53%
50%
50%54%
51%
46%48%
45%
47%46%
52%
3%1%
1%
2%1%
3%
2%3%
7%
3%
3%
3%1%
4%
0% 25% 50% 75% 100%
201120102009
201120102009
201120102009
201120102009
201120102009
Très satisfait(e) Satisfait(e) Neutre
2 cotes supérieures
95%97%96%
98%97%94%
97%95%91%
96%98%89%
96%97%92%
Échantillon : Toutes les bibliothèques locales qui ont fourni des résultats (n=270). Les données sont pondérées pour refléter toutes les bibliothèques locales qui ont participé au CLÉ TD (n=340). Source : Q27A-Q27E. Veuillez évaluer votre degré de satisfaction à l’égard des aspects suivants du programme.
Pertinence du contenu du livret d’activités
Qualité du livret d’activités
Satisfaction globale à l’égard du thème
Représentation graphique du thème dans la documentation
Affiche du programme
BAC – Club de lecture d’été TD – 2011 Rapport sommaire des statistiques du programme – Québec (français)
Les bibliothèques ont également évalué leur degré de satisfaction à l’égard de certains éléments du matériel utilisé dans le cadre du programme, par exemple divers aspects du site Web, le matériel promotionnel et le guide d’animation.
Les deux cotes supérieures révèlent que 89 % des bibliothèques du Québec sont satisfaites du site Web dans son ensemble. La vaste majorité d’entre elles sont satisfaites du matériel promotionnel (95 %) et de la pertinence du contenu du guide d’animation (90 %). Plus de quatre bibliothèques sur cinq sont satisfaites du matériel offert sur le site Web (89 %), du contenu du site Web (88 %) ainsi que des menus et de la navigation sur le site Web (87 %). Plus de trois bibliothèques sur quatre sont satisfaites du site Web « Pour jeunes » (77 %). La satisfaction est passablement constante par rapport à 2011, la seule chute réelle étant la satisfaction à l’égard du site Web « Pour jeunes » (en baisse de 6 %).
Figure 10. Satisfaction à l’égard du matériel d’appoint
28%24%
30%
44%38%
56%
43%33%
38%
27%31%
45%
31%31%
44%
27%29%
47%
22%23%
32%
61%65%
56%
51%56%
38%
47%60%
56%
62%55%
41%
57%60%
40%
60%58%
39%
55%60%
51%
9%9%
11%
3%4%
2%
6%5%5%
9%11%12%
10%9%
13%
10%11%
11%
21%16%14%
0% 25% 50% 75% 100%
201120102009
201120102009
201120102009
201120102009
201120102009
201120102009
201120092009
Très satisfait(e) Satisfait(e) Neutre
2 cotes supérieures
89%89%86%
95%94%94%90%93%94%
89%86%86%
88%91%84%
87%87%86%
77%83%83%
Échantillon : Toutes les bibliothèques locales qui ont fourni des résultats (n=270). Les données sont pondérées pour refléter toutes les bibliothèques locales qui ont participé au CLÉ TD (n=340). Source : Q27F-Q27L. Veuillez évaluer votre degré de satisfaction à l’égard des aspects suivants du programme.
Matériel promotionnel
Pertinence du contenu du guide d’animation
Site Web « Pour jeunes »
Menus et navigation sur le site Web
Satisfaction globale à l’égard du site Web
Contenu du site Web
Matériel offert sur le site Web
BAC – Club de lecture d’été TD – 2011 Rapport sommaire des statistiques du programme – Québec (français)
Influence du programme sur la lecture Indicateurs de réussite Les bibliothèques devaient indiquer si elles avaient eu recours à des indicateurs pour démontrer que les enfants ont plus de plaisir à lire, lisent mieux ou ont changé d’attitude envers la lecture. Le graphique ci-dessous présente les sept réponses les plus fréquentes. L’indicateur que les bibliothèques nomment le plus souvent est que les enfants s’impliquent/s’intéressent à la lecture (38 %). Le tiers des bibliothèques font également état du développement des habitudes de lecture et de l’augmentation du nombre de livres lus. Un peu moins du quart des bibliothèques (24 %) rapportent que les enfants sont fiers de leurs accomplissements ou parlent des prix/autocollants. 19 % des bibliothèques indiquent que les enfants ont amélioré leurs habileté de lecture et de compréhension de texte et qu’ils lisent davantage d’eux-mêmes. Enfin, 14 % des bibliothèques mentionnent l’augmentation des visiteurs et des abonnés de la bibliothèque.
Figure 11. Indicateurs de réussite
38%
33%
24%
24%
19%
19%
14%
0% 5% 10% 15% 20% 25% 30% 35% 40%
Les enfants s'impliquent/deviennent accros/s'intéressent à la lecture/au partage de livres
Le développement des habitudes de lecture/L'augmentation du nombre de livres lus
Les enfants ont aimé le programme/étaient fiers de leurs accomplissements
Activités/Jeux/Prix/Autocollants
L'amélioration des habiletés (lecture, compréhension de texte, rédaction de comptes-rendus)
Les enfants continuent à lire d'eux-mêmes/prennent l'initiative de lire
L'augmentation des visiteurs et des abonnés de la bibliothèque
Échantillon : Les réseaux de bibliothèques qui ont fourni une réponse (n=21).
Source : Q33. Avez-vous des indicateurs qui montrent si les enfants ont pris plus de plaisir à lire? S’ils lisent mieux? S’ils ont changé d’attitude envers la lecture?
BAC – Club de lecture d’été TD – 2011 Rapport sommaire des statistiques du programme – Québec (français)
Témoignages Les bibliothèques devaient mentionner si elles avaient reçu des témoignages de parents, d’accompagnateurs ou d’enseignants indiquant une amélioration des capacités de lecture de l’enfant. En tout, plus du tiers (36 %) des bibliothèques qui ont répondu à la question mentionnent que les enfants prennent plus plaisir à lire. Un peu plus du quart (27 %) des bibliothèques formulent des commentaires positifs par rapport au programme lui-même, alors qu’un peu moins du quart (23 %) d’entre elles indiquent que le programme facilite le retour en classe. 14 % des bibliothèques rapportent que les enfants aiment le programme/le thème et 9 %, que le programme développe les habiletés de lecture des enfants.
Figure 12. Témoignages
36%
27%
23%
14%
9%
0% 10% 20% 30% 40%
Les enfants prennent plus plaisir à lire
Commentaires positifs/Bon programme/Programme qui en vaut la
peine/utile
Bon pour le retour en classe/Transition plus facile/Maintient les compétences
Les enfants aiment le programme/le thème
Développe les habiletés de lecture/Enrichit le vocabulaire des enfants
Échantillon : Les réseaux de bibliothèques qui ont fourni une réponse (n=22).
Source : Q34. Avez-vous des témoignages de parents, d’accompagnateurs ou d’enseignants indiquant une amélioration des capacités de lecture de l’enfant?
BAC – Club de lecture d’été TD – 2011 Rapport sommaire des statistiques du programme – Québec (français)
Suggestions Thèmes à explorer Les bibliothèques devaient suggérer des thèmes pour les programmes à venir. Elles proposent un vaste éventail de thèmes, mais ceux qui reviennent le plus souvent touchent le multiculturalisme et les autres pays, que mentionnent plus de la moitié des bibliothèques (52 %). Le fantastique et l’aventure sont également des thèmes qui reviennent fréquemment (48 %). Les bibliothèques proposent également des thèmes qui s’articulent autour de la nature (38 %), du sport (29 %), des animaux/bestioles (19 %) et de l’histoire (19 %).
Figure 13. Suggestions de thèmes à explorer
52%
48%
38%
29%
19%
19%
0% 10% 20% 30% 40% 50% 60%
Le multiculturalisme/Les cultures et pays étrangers
Le fantastique/L'aventure
La nature
Le sport
Les animaux/Les animaux de compagnie/Les bestioles/Les insectes
L'histoire
Échantillon : Les réseaux de bibliothèques qui ont fourni une réponse (n=21). Source : Q35. Avez-vous des suggestions de thèmes pour les programmes à venir?
BAC – Club de lecture d’été TD – 2011 Rapport sommaire des statistiques du programme – Québec (français)
Suggestions pour la collecte de données Les bibliothèques devaient formuler des suggestions à propos de la collecte de données effectuée dans le cadre du CLÉ TD. Les suggestions ont été peu nombreuses (79 % des bibliothèques n’en ont formulé aucune), mais parmi les bibliothèques qui ont émis des suggestions, les plus courantes sont de standardiser les formulaires (30 %) et de permettre à toutes les bibliothèques locales de remplir le rapport en ligne (20 %). Les réponses données sont résumées dans le tableau ci-dessous.
Figure 14. Suggestions pour la collecte de données
Suggestions pour améliorer le rapport des statistiques 2011 Standardiser les formulaires/Fournir des suggestions/Plus de directives 30% Pouvoir remplir le formulaire/le rapport/les inscriptions en ligne 20% Bien/Facile/Clair/Aucune amélioration requise 10% Fournir des formulaires 10% Autoriser/Exiger des rapports hebdomadaires/quotidiens 10% Calculer les statistiques en fonction de l'âge/du sexe 10% Autre 20%
Échantillon : Les réseaux de bibliothèques qui ont fourni une réponse (n=10).
Source : Q37. Avez-vous des suggestions sur la façon d'améliorer ou de faciliter le processus de rapport des statistiques du programme ou de le rendre plus précis?
BAC – Club de lecture d’été TD – 2011 Rapport sommaire des statistiques du programme – Québec (français)
Suggestions pour l’ensemble du programme CLÉ TD Les bibliothèques devaient faire des suggestions à l’égard de l’ensemble du programme CLÉ TD. La suggestion la plus courante, mentionnée par plus du tiers des bibliothèques (35 %), est d’améliorer le site Web. Plus du quart (26 %) des bibliothèques suggèrent que le matériel et les formulaires soient mieux conçus. 13 % d’entre elles proposent de fournir du matériel plus varié et de s’y prendre plus tôt pour envoyer des renseignements sur le thème/le matériel. 9 % des bibliothèques mentionnent également qu’il faudrait améliorer le marketing/la publicité.
Figure 15. Suggestions pour l’ensemble du programme CLÉ TD
35%
26%
13%
13%
9%
0% 5% 10% 15% 20% 25% 30% 35% 40%
Améliorer/Mettre à jour le site Web
Améliorer/Mieux concevoir le matériel/les formulaires
Fournir plus de matériel/du matériel plus varié
Nous informer plus tôt au sujet du thème/Expédier le matériel plus tôt
Plus de marketing et de publicité/Amélioration du marketing et de la publicité
Échantillon : Les réseaux de bibliothèques qui ont fourni une réponse (n=23). Source : Q36. Avez-vous des suggestions générales au sujet du CLÉ TDTD?
Manitoba Program Statistics Response Rate The 41 participating library systems were asked to tally the results of participants in the summer reading club for all of their subsidiary branches. In total, all 38 library systems entered their data, with 79 of the 82 participating library branches within these systems submitted their results. Accordingly, the overall submission rate for Manitoba was 93%, and the overall response rate was 96%.
Figure 1. Response Rate
Manitoba
(A) Total Participating Libraries 82
(B) Total Responded to Survey 79
(C) Survey Response Rate 96%
Source: Row (A) provided by Library and Archives Canada. Rows (B) and (C) represent data collected by Harris/Decima Research.
LAC – TD Summer Reading Club 2011 Summary Report of Program Statistics – Manitoba
Number of Children The first section of the Statistics and Evaluation Form asked librarians to indicate the total number of children registered for the TDSRC 2011. This reflects the number of children who registered on the sign-up sheet, with the intent to read books as part of the TD Summer Reading Club.
In Manitoba, an estimated 10,997 children registered for the TDSRC 2011 program, up from last year (9,550) and the previous year (9,722). Girls comprise 5,997, or 55%, of the participants, while the 5,000 boys represent 45% of the participants, similar to proportions in previous years.
Figure 2. Percentage of Participating Children by Gender
53%
55%
54%
55%
54%
55%
55%
47%
45%
46%
45%
46%
45%
45%
0% 20% 40% 60% 80% 100%
2005
2006
2007
2008
2009
2010
2011
Girls Boys
Base: All localities that submitted results (n=79). Data is weighted to reflect all localities that participated in the TDSRC program (n=82). Source: Q3-Q10. Total number of children who registered for the TDSRC 2011.
LAC – TD Summer Reading Club 2011 Summary Report of Program Statistics – Manitoba
Of the girls, 27% fall in the 0-5 age group, 39% are aged 6-8, 31% are aged 9-12, and 3% are 13 years or older. The boys follow a similar distribution by age, with 31% aged 0-5, 42% aged 6-8, 26% aged 9-12, and 2% aged 13 and older.
Figure 3.1 Percentage of Participating Children by Gender and Age
Base: All localities that submitted results (n=79). Data is weighted to reflect all localities that participated in the TDSRC program (n=82). Source: Q3-Q10. Total number of children who registered for the TDSRC 2011.
Figure 3 below summarizes the participation rate for Manitoba by gender and age based on 2006 census data. Participation in Manitoba in 2011 was up from previous years with 4.53% of children participating.
Figure 3.2 Number of Participating Children
% PARTICIP. CHILDREN
% PARTICIP. CHILDREN
% PARTICIP. CHILDREN
(A) (B) (C) (D) (E) (F) 2011 2010 2009
Province / Territory
Total Children Total Boys Total Girls Total Children Total Boys Total Girls Total Children Total Children Total Children
Base: All localities that submitted results (n=79). Data is weighted to reflect all localities that participated in the TDSRC program (n=82). Source: Columns (A) through (C) provided by Statistics Canada Census 2006. Column (D) through (F) represents data collected by Harris/Decima Research.
LAC – TD Summer Reading Club 2011 Summary Report of Program Statistics – Manitoba
Reading Kits and Posters The libraries were also asked to indicate the total number of reading kits and posters that were given out to children coming into the library, including those given to daycares and other agencies that came in to pick up reading kits or posters for their group. Anyone who came to a branch and asked for a full reading kit or poster was eligible to receive one. Registration for the TDSRC was not necessary and staff could choose how to distribute the material. In total, 11,278 reading kits were distributed across Manitoba, as well as 3,107 posters.
Program Statistics
Programs and Activities Organized Around the Club Theme To help gauge the success of the TDSRC, libraries were asked to indicate the total number of programs and activities organized around this year’s club theme as well as their total attendance, if recorded.
When reviewing these numbers, several points need to be kept in mind:
• Every child who registered for the reading club with the library is considered to have attended an activity.
• It is possible that a child did not register for the TDSRC, but attended one or more of the activities;
• Attendance was calculated on a per activity basis. It is possible that a child attended more than one activity, and thus is represented more than once in total attendance.
A total of 1,071 organized programs and activities were scheduled in libraries across Manitoba over the months of July and August 2011. Total attendance amounted to 21,656 children. This translates to an approximate average of 20 children per activity.
Drop-Ins versus Clubs Libraries had the option to run the program as a drop-in program or as a club with distinct meeting times. As in 2011, most of the localities in Manitoba (55%) ran the summer reading club as a drop-in only, while 22% ran theirs solely as a club. About the same number (23%) of the libraries ran theirs as both a drop-in and a club.
LAC – TD Summer Reading Club 2011 Summary Report of Program Statistics – Manitoba
Program Successes Depending on how libraries implemented the program, they tracked the impact of their program on reading habits and learning using a variety of metrics. These included:
Total number of children who collected all nine stickers;
Total number of books reported on;
Total number of books read; and
Total number of hours read.
Stickers Collected Stickers were used by many of the libraries as incentives for children to read more books. The ultimate goal was to collect all nine stickers. In total, 45% of the libraries used stickers as incentives for children. Among these systems, 3,101 children reached the target of collecting all nine stickers (90%).
Books Read and Reported on Among the library systems that collected these statistics, each child on average10:
The average number of books read per child translates to a total of 253,118 books read within the province of Manitoba as part of the summer reading club, a very high number when comparing to other provinces.
10 These estimates are based on a limited number of responses, and should be viewed with caution.
LAC – TD Summer Reading Club 2011 Summary Report of Program Statistics – Manitoba
School and Daycare Visits by Library Staff Librarians were asked to indicate if anyone from their library branch made any visits to the local schools and daycares in order to promote the program.
Four out of five Manitoba libraries (68%) indicate that their staff had made visits to schools and daycares to promote the summer reading club. In total, 360 visits were made to schools and daycares, and 16,924 children were reached by these means.
Impact of School and Daycare Visits Among the systems that made visits, a total of 7,250 children participated in the TDSRC, representing about a third of children reached (43%).
Among these same library systems, 1,509 children indicated that they first heard of the TDSRC via a school or daycare visit, representing 21% of the total participants.
LAC – TD Summer Reading Club 2011 Summary Report of Program Statistics – Manitoba
Method of Promotion Promotional aspects were further investigated by asking librarians to tally, from the registration forms, how the participants first heard about the program. 4,316 participants (39%) first heard through staff promotion in the branch and 2,351 (or 21%) heard it through a presentation at school or daycamp. Another 2,195 knew about the program because they joined last year (20%) and 952 found out about the program from a school invitation (9% a steady continuing decline in importance). Word-of-mouth (6%) was the other major method of learning about the program with the media (3%) and all other methods (1%) accounting for the rest.
Figure 4. How Participants First Heard About the Program
4,316
2,351
2,195
952
707
375
101
3,506
1,612
1,839
1,553
760
208
71
2,658
1,521
1,501
3,308
525
131
78
0 1,000 2,000 3,000 4,000 5,000
Staff promotion in branch
School /daycamp presentation
Joined last year
School invitations
Word-of-mouth
Media
Other
Total Number of Responses
2011 2010 2009
39%37%27%
21%17%16%
20%19%15%9%16%34%6%8%5%3%2%1%
1%1%1%
% of Cases
Base: All localities that submitted results (n=79). Data is weighted to reflect all localities that participated in the TDSRC program (n=82). Source: Number of participants that first heard about the TDSRC by the following methods: Q23A. Schools; Q23B. Summer day camps, daycare centres, community/public housing projects, faith-based program presentation by library staff; Q23C. Staff promotion in branch; Q23D. Word-of-mouth; Q23E. School invitations; Q23F. Joined last year; Q23G. Media (radio, newspaper, website, library program guide, Transit ads); Q23H. Other.
LAC – TD Summer Reading Club 2011 Summary Report of Program Statistics – Manitoba
Satisfaction with Program Elements The 2011 Statistics and Evaluation Form asked respondents to rate their level of satisfaction with more specific elements of the program. The first set of questions looked at the program materials.
By and large, satisfaction levels remain high for the province of Manitoba, although it was down somewhat on all measures from last year. Top two box scores (the sum of “very satisfied” and “satisfied” responses) reveal that a large majority of localities in Manitoba (89%) were satisfied with the theme in 2011 (representing a small decline from 2010 and 2009). The quality of the logbook was seen to be very good as well with 91% satisfied. Nine out of ten (90%) were happy with the visual representation of the theme in the materials and with the relevance of the content in the logbook (89%). A large majority were also satisfied with the program poster (81%).
LAC – TD Summer Reading Club 2011 Summary Report of Program Statistics – Manitoba
Libraries also rated their level of satisfaction with other program materials, such as various aspects of the website, promotional materials and the Staff Manual.
Top two box scores reveal that 78% of libraries in Manitoba were satisfied overall with the website. A sizeable majority (82%) were also satisfied with the promotional materials in 2011 as well. Four out of five libraries were satisfied with the relevance of the content in the staff manual and the materials available on the website (80% each). Greater than three quarters were satisfied with the content of the website (79%), while just under three quarters were happy with the menus and navigation of the website (74%). The kid’s website was again the element with the least satisfaction (72%) but it is higher than in 2010 (+9 points) and 2009 (+15%).
Figure 6. Satisfaction with Support Materials
43%30%
7%
53%34%
15%
51%30%
34%
44%32%
12%
45%30%
17%
44%27%
21%
46%27%
10%
35%52%
73%
29%49%
68%
29%48%
58%
36%47%
70%
34%48%
61%
30%50%
55%
26%36%
47%
21%14%18%
8%13%14%
16%13%
5%
19%17%
14%
18%17%
19%
23%20%
21%
26%36%
36%
0% 25% 50% 75% 100%
201120102009
201120102009
201120102009
201120102009
201120102009
201120102009
201120102009
Very satisfied Satisfied Neutral
Top 2 Box
78%82%80%
80%79%82%
82%83%83%
74%77%76%
80%79%82%
72%63%57%
79%78%78%
Base: All localities that submitted results (n=79). Data is weighted to reflect all localities that participated in the TDSRC program (n=82). Source: Q27F-Q27L. Rate your level of satisfaction with the program elements below.
Promotional materials
Materials Available on Website
Relevance of Content in Staff Manual
Kids' Website
Menus and Navigation on Website
Overall Satisfaction With Website
Content of Website
LAC – TD Summer Reading Club 2011 Summary Report of Program Statistics – Manitoba
Program Reading Outcomes Indicators of Success Libraries were asked to indicate whether they had any indicators of a child’s increased enjoyment of reading, reading successes or changes in attitudes toward reading. The most common indicator was that children got involved, were more interested in books and shared them (33%). 29% mentioned increased reading habits and more books read, while just under a quarter (24%) said that children were discussing and talking about books. Finally, 19% reported that children enjoyed the program and were proud of their accomplishments.
Figure 7. Indicators of Success
33%
29%
24%
19%
% 5% 10% 15% 20% 25% 30% 35%
Getting involved/hooked/interested in reading/sharing books
Increased reading habits/number of books read
Discussion/talking/reporting about books read
Children enjoyed it/were proud of their accomplishments
Base: Library systems that provided a response (n=21).
Source: Q33. Do you have any indicators of a child's increased enjoyment of reading? Of reading successes? Changes in attitude toward reading?
LAC – TD Summer Reading Club 2011 Summary Report of Program Statistics – Manitoba
Testimonials Libraries were also asked whether they had any testimonials from parents, caregivers or teachers that might indicate an improvement in reading level. In total, a third of the libraries reported receiving positive feedback about the usefulness of the program. A third of the libraries also mentioned improved reading skills/vocabulary among the children. 22% of libraries also mentioned each of the following: that children were reading more, that the children enjoyed the program, and that the program was good for preparing kids to go back to school.
Figure 8. Testimonials
33%
33%
22%
22%
22%
% 5% 10% 15% 20% 25% 30% 35%
Positive feedback/good/worthwhile/useful program
Improves reading skills/vocabulary of children
Children like to read more
Children enjoy the program/theme
Good for back-to-school/easier transition/maintained ability
Base: Library systems that provided a response (n=9).
Source: Q34. Do you have any testimonials from parents, caregivers or teachers that may indicate an improvement in reading level?
LAC – TD Summer Reading Club 2011 Summary Report of Program Statistics – Manitoba
Suggestions Future Themes Libraries were asked to provide suggestions for future program themes. A number of different themes were proposed among libraries in Manitoba, the most common revolving around nature (31%). Multiculturalism and animals/pets were both mentioned be a quarter of the libraries. 13% mentioned both history and sci-fi.
Figure 9. Suggestions for Future Themes
31%
25%
25%
13%
13%
% 5% 10% 15% 20% 25% 30% 35%
Nature
Multiculturalism/other cultures/countries
Animals/pets/bugs/insects (general)
History
Sci-f i
Base: All library systems that provided a response (n=16). Source: Q35. Do you have any suggestions on the program’s future themes?
LAC – TD Summer Reading Club 2011 Summary Report of Program Statistics – Manitoba
Suggestions for Data Collection Libraries were asked to provide suggestions on the collection of data for the TDSRC. There were few responses to this question (79% did not have a suggestion or said it did not need improvement) and they were not very consistent. Among those who had a suggestion, the most common was to provide the forms and materials earlier (40%). 20% mentioned that the process did not need improvement or suggested the possibility of allowing weekly/daily reporting. 10% suggested that the forms be standardized, that individual libraries who are part of a system could report it themselves, and that survey questions be clarified.
Figure 10. Suggestions for Data Collection
Suggestions For Improving Reporting 2011 Provide survey/forms/reports earlier 40% Fine/easy/straightforward/no need for improvement 20% Allow/require weekly/daily reporting 20% Standardize forms/provide suggestions/more instructions 10% Enable online form/reporting/registration 10% Clarify/specify survey questions 10%
Base: Library systems that provided a response (n=10).
Source: Q37. Do you have any suggestions on how the reporting of program statistics could be improved or made easier/more accurate?
LAC – TD Summer Reading Club 2011 Summary Report of Program Statistics – Manitoba
TDSRC Overall Libraries were asked to provide suggestions on the TDSRC overall. The most common response was to send the materials for the program earlier (20%). 13% of the libraries suggested improving the forms used. 7% suggested more age-appropriate material and to provide a better variety of materials.
Figure 11. Suggestions for TDSRC Overall
20%
13%
7%
7%
% 5% 10% 15% 20% 25%
Let us know theme sooner/send the materials earlier
Improve/better design of materials/forms
More age-appropriate material
Provide us with more/variety of materials
Base: Library systems that provided a response (n=15). Source: Q36. Do you have any suggestions on the TDSRC overall?
Saskatchewan Program Statistics Response Rate The 10 participating library systems were asked to tally the results of participants in the summer reading club for all of their subsidiary branches. All 10 of the 10 participating systems and 230 of the 243 individual libraries within Saskatchewan submitted their results. This results in an overall submission rate of 100% and an overall response rate of 95%.
Figure 1. Response Rate
Saskatchewan
(A) Total Participating Libraries 243
(B) Total Responded to Survey 230
(C) Survey Response Rate 95%
Source: Row (A) provided by Library and Archives Canada. Rows (B) and (C) represent data collected by Harris/Decima.
LAC – TD Summer Reading Club 2011 Summary Report of Program Statistics – Saskatchewan
Number of Children The first section of the Statistics and Evaluation Form asked librarians to indicate the total number of children registered for the TDSRC 2011. This reflects the number of children who registered on the sign-up sheet, with the intent to read books as part of the TD Summer Reading Club.
In Saskatchewan, an estimated 20,527 children registered for the TDSRC 2011 program11, a increase from 2010 when an estimated 15,098 registered.
Girls comprise 11,265, or 55%, of the participants, while the 9,262 boys represent 45% of the participants, similar to national proportions.
Figure 2. Percentage of Participating Children by Gender
56%
57%
54%
56%
55%
56%
55%
44%
43%
46%
44%
45%
44%
45%
0% 20% 40% 60% 80% 100%
2005
2006
2007
2008
2009
2010
2011
Girls Boys
Base: All localities that submitted results (n=230). Data is weighted to reflect all localities that participated in the TDSRC program (n=243).
Source: Q3-Q10. Total number of children who registered for the TDSRC 2011.
11 Based on the 230 libraries that submitted their information, extrapolations have been made to represent all 243 participating localities.
LAC – TD Summer Reading Club 2011 Summary Report of Program Statistics – Saskatchewan
Of the girls, 27% fall in the 0-5 age group, 39% are aged 6-8, 31% are aged 9-12, and 2% are 13 years or older. The boys follow a similar distribution by age, with 30% aged 0-5, 41% aged 6-8, 28% aged 9-12, and 1% aged 13 and older.
Figure 3.1 Percentage of Participating Children by Gender and Age
Base: All localities that submitted results (n=230). Data is weighted to reflect all localities that participated in the TDSRC program (n=243). Source: Q3-Q10. Total number of children who registered for the TDSRC 2011
Figure 3 below summarizes the participation rate for Saskatchewan by gender and age based on 2006 census data.
Figure 3. Number of Participating Children
2006 CENSUS 2011 TD SRC REGISTRANTS % PARTICIP. CHILDREN
% PARTICIP. CHILDREN
% PARTICIP. CHILDREN
(A) (B) (C) (D) (E) (F) 2011 2010 2009
Province / Territory Total Children Total Boys Total Girls Total
Base: All localities that submitted results (n=230). Data is weighted to reflect all localities that participated in the TDSRC program (n=243). Source: Columns (A) through (C) provided by Statistics Canada Census 2001. Column (D) through (F) represents data collected by Harris/Decima.
LAC – TD Summer Reading Club 2011 Summary Report of Program Statistics – Saskatchewan
Reading Kits and Posters The libraries were also asked to indicate the total number of reading kits and posters that were given out to children coming into the library, including those given to daycares and other agencies that came in to pick up reading kits or posters for their group. Anyone who came to a branch and asked for a full reading kit or poster was eligible to receive one. Registration for the TDSRC was not necessary and staff could choose how to distribute the material. In total, 21,577 reading kits were distributed across Saskatchewan, as well as 2,127 posters.
Program Statistics
Programs and Activities Organized Around the Club Theme To help gauge the success of the TDSRC, libraries were asked to indicate the total number of programs and activities organized around this year’s club theme as well as their total attendance, if recorded.
When reviewing these numbers, several points need to be kept in mind:
• Every child who registered for the reading club with the library is considered to have attended an activity.
• It is possible that a child did not register for the TDSRC, but attended one or more of the activities;
• Attendance was calculated on a per activity basis. It is possible that a child attended more than one activity, and thus is represented more than once in total attendance.
A total of 2,334 organized programs and activities were scheduled in libraries across Saskatchewan over the months of July and August 2011. Total attendance amounted to 35,902 children. This translates to an approximate average of 15 children per activity.
Drop-Ins versus Clubs Libraries had the option to run the program as a drop-in program or as a club with distinct meeting times. A little over a third of the localities (37%) in Saskatchewan ran the summer reading club as both a drop-in and a club. A total of 46% ran theirs as a drop-in only, 1% as a club only and 15% used neither approach or did not report data.
LAC – TD Summer Reading Club 2011 Summary Report of Program Statistics – Saskatchewan
Program Successes Depending on how libraries implemented the program, they tracked the impact of their program on reading habits and learning using a variety of metrics. These included:
Total number of children who collected all nine stickers;
Total number of books reported on;
Total number of books read; and
Total number of hours read.
Stickers Collected Stickers were used by many of the libraries as incentives for children to read more books. The ultimate goal was to collect all nine stickers. In total, almost all (90%) of the libraries used stickers as incentives for children. Among these systems, 16,386 children reached the target of collecting all nine stickers.
Books Read and Reported on Among the library systems that collected these statistics, each child on average:
The average number of books read per child translates to a total of 137,446 books read within the province of Saskatchewan as part of the summer reading club.
LAC – TD Summer Reading Club 2011 Summary Report of Program Statistics – Saskatchewan
School and Daycare Visits by Library Staff Librarians were asked to indicate if anyone from their library branch made any visits to the local schools and daycares in order to promote the program.
More than half of the libraries (53%) in Saskatchewan indicated that their library staff had made visits to schools and daycares to promote the summer reading club. In total, 365 visits were made to schools and daycares, and 27,906 children were reached by these means.
Impact of School and Daycare Visits Among the systems that made visits, a total of 11,080 children participated in the TDSRC, representing 40% of children reached by these means.
Among these same library systems, 2,377 children indicated that they first heard of the TDSRC via a school or daycare visit, representing 21% of the total participants.
LAC – TD Summer Reading Club 2011 Summary Report of Program Statistics – Saskatchewan
Method of Promotion Promotional aspects were further investigated by asking librarians to tally, from the registration forms, how the participants first heard about the program. 7,672 participants (37%) first heard of the TDSRC through staff promotion in the branch, by far the most popular method. Another 4,512 (22%) knew of the program because they participated in the past. School or daycare presentations were also popular with 4,464 participants mentioning them (22%). Almost one in ten heard of the program through school invitations (8%) and word-of-mouth (7%). The less popular methods were through the media (2%) and other methods (2%).
Figure 4. How Participants First Heard About the Program
7,672
4,512
4,464
1,554
1,458
469
398
6,132
3,108
2,313
1,404
1,429
283
428
6,601
2,634
3,388
2,213
1,529
767
415
0 2,000 4,000 6,000 8,000
Staff promotion in branch
Joined last year
School / Daycare presentation
School invitations
Word-of-mouth
Other
Media
Total Number of Responses2011 2010 2009
37%41%38%
22%21%15%
22%15%19%8%9%13%
7%9%9%
2%2%4%
2%3%2%
% of Cases
Base: All localities that submitted results (n=230). Data is weighted to reflect all localities that participated in the TDSRC program (n=243). Source: Number of participants that first heard about the TDSRC by the following methods: Q23A. Schools; Q23B. Summer day camps, daycare centres, community/public housing projects, faith-based program presentation by library staff; Q23C. Staff promotion in branch; Q23D. Word-of-mouth; Q23E. School invitations; Q23F. Joined last year; Q23G. Media (radio, newspaper, website, library program guide, Transit ads); Q23H. Other.
LAC – TD Summer Reading Club 2011 Summary Report of Program Statistics – Saskatchewan
Satisfaction with Program Elements The 2011 Statistics and Evaluation Form asked respondents to rate their level of satisfaction with more specific elements of the program. The first set of questions looked at the program materials.
By and large, satisfaction levels remain very high in the province of Saskatchewan. Top two box scores (the sum of “very satisfied” and “satisfied” responses) reveal that the great majority of localities in Saskatchewan (94%) were satisfied with the theme overall, the quality of the logbook (93%), and the relevance of the content in the logbook (90%). Nearly as many (87%) were satisfied with the visual representation of the theme and with the program poster (86%).
Figure 5. Satisfaction with Program Elements
58%60%
32%
48%55%
31%
49%53%
39%
51%53%
31%
44%51%
35%
36%34%
51%
45%38%
53%
41%42%
49%
36%37%
44%
42%43%
51%
5%5%
15%
6%6%
14%
9%5%
10%9%
12%6%
12%
0% 25% 50% 75% 100%
201120102009
201120102009
201120102009
201120102009
201120102009
Very satisf ied Satisf ied Neutral
Top 2 Box
90%95%88%
94%94%83%
93%93%84%
86%94%86%
87%90%75%
Base: All localities that submitted results (n=230). Data is weighted to reflect all localities that participated in the TDSRC program (n=243). Source: Q27A-Q27E. Rate your level of satisfaction with the program elements below.
Relevance of Content in Logbook
Quality of the Logbook
Overall appreciation of Theme
Visual Representation of Theme in Materials
Program Poster
LAC – TD Summer Reading Club 2011 Summary Report of Program Statistics – Saskatchewan
Libraries also rated their level of satisfaction with other program materials, such as various aspects of the website, promotional materials and the Staff Manual.
The majority of the libraries in Saskatchewan (84%) are satisfied overall with the website. A strong majority of libraries are also satisfied with the promotional materials (87%), and the materials available on the website (82%). That same percentage (82%) is satisfied with the content of the website and the menus and navigation on the website. Similar proportions (80%) are satisfied with the relevance of the content in the staff manual. Although satisfaction with the kid’s website is the lowest of the elements tested, three in four libraries are satisfied (74%).
Figure 6. Satisfaction with Support Materials
34%41%
22%
38%43%
22%
41%44%
29%
34%36%
20%
31%23%
6%
31%39%
23%
27%34%
15%
50%46%
52%
49%45%
55%
41%41%
49%
48%51%
48%
51%47%
59%
49%47%
47%
47%43%
42%
14%12%
25%
12%11%
21%
13%13%
21%
16%12%
28%
16%27%
35%
18%13%
27%
25%23%
41%
0% 25% 50% 75% 100%
201120102009
201120102009
201120102009
201120102009
201120092008
201120102009
201120102009
Very satisfied Satisfied Neutral
Top 2 Box
84%87%74%
82%85%78%
87%88%77%
80%86%70%
74%77%57%
82%86%70%
82%87%68%
Base: All localities that submitted results (n=230). Data is weighted to reflect all localities that participated in the TDSRC program (n=243). Source: Q27F-Q27L. Rate your level of satisfaction with the program elements below.
Promotional Materials
Kids' Website
Menus and Navigation on Website
Overall Satisfaction With Website
Content of Website
Materials Available on the Website
Relevance of Content in Staff Manual
LAC – TD Summer Reading Club 2011 Summary Report of Program Statistics – Saskatchewan
Program Reading Outcomes Indicators of Success Libraries were asked to indicate whether they had any indicators of a child’s increased enjoyment of reading, reading successes or changes in attitudes toward reading. The top responses were that the children were proud of their accomplishments as well as their increased reading habits (38% each). The activities/games/prizes and increased library visits and membership were also mentioned (25%).
Figure 7. Indicators of Success
38%
38%
25%
25%
% 10% 20% 30% 40%
Children enjoyed it/were proud of their accomplishments
Increased reading habits/number of books read
Activities/games/prizes/stickers
Increased library visitors and membership
Base: Library systems that provided a response (n=6).
Source: Q33. Do you have any indicators of a child's increased enjoyment of reading? Of reading successes? Changes in attitude toward reading?
LAC – TD Summer Reading Club 2011 Summary Report of Program Statistics – Saskatchewan
Testimonials Libraries were also asked whether they had any testimonials from parents, caregivers or teachers that might indicate an improvement in reading level. A large portion of libraries (67%) reported that the children liked to read more. A third of libraries also mentioned that it improves the children’s reading skills and vocabulary, that it helps with the transition back to school, and that the children were reading to win the prizes. 11% also mentioned that parents reported that their kids enjoyed the program.
Figure 8. Testimonials
67%
33%
33%
33%
11%
% 10% 20% 30% 40% 50% 60% 70%
Children like to read more
Improves reading skills/vocabulary of children
Good for back-to-school/easier transition/maintained ability
Children reading to win prizes
Children enjoy the program/theme
Base: Library systems that provided a response (n=8).
Source: Q34. Do you have any testimonials from parents, caregivers or teachers that may indicate an improvement in reading level?
LAC – TD Summer Reading Club 2011 Summary Report of Program Statistics – Saskatchewan
Suggestions Future Themes Libraries were asked to provide suggestions for future program themes. A number of different themes were proposed among libraries in Saskatchewan, the most common being fantasy/adventure (60%). Multiculturalism and history were also commonly mentioned by libraries (40%). 30% of libraries also suggested themes about animals/pets, nature, sci-fi, and pirates. The most popular suggestions are given below in Figure 9.
Figure 9. Suggestions for Future Themes
60%
40%
40%
30%
30%
30%
30%
% 10% 20% 30% 40% 50% 60% 70%
Fantasy/adventure
Multiculturalism/other cultures/countries
History
Animals/pets/bugs/insects
Nature
Sci-f i
Pirates
Base: All library systems that provided a response (n=10). Source: Q35. Do you have any suggestions on the program’s future themes?
LAC – TD Summer Reading Club 2011 Summary Report of Program Statistics – Saskatchewan
Suggestions for Data Collection Libraries were asked to provide suggestions on the collection of data for the TDSRC. 40% of libraries did not have any suggestions to give (or said that it did not need improvement), but among those who did, half suggested standardizing the forms and providing more instruction. Other libraries mentioned providing the forms earlier, enabling online reporting for all individual libraries, allowing (or requiring) weekly or daily reporting, and not tracking gender statistics (17% each).
Figure 10. Suggestions for Data Collection
Suggestions For Improving Reporting 2011 Standardize forms/provide suggestions/more instructions 50% Provide survey/forms/reports earlier 17% Enable online form/reporting/registration 17% Allow/require weekly/daily reporting 17% Do not track/require stats on gender 17%
Base: Library systems that provided a response (n=6).
Source: Q37. Do you have any suggestions on how the reporting of program statistics could be improved or made easier/more accurate?
LAC – TD Summer Reading Club 2011 Summary Report of Program Statistics – Saskatchewan
TDSRC Overall Libraries were asked to provide suggestions on the TDSRC overall. Responses varied, with a quarter of all libraries mentioning: Improved design for the materials/forms, more age-appropriate material, sending info and materials about the theme earlier, and more games/activities/prizes for children taking part in the program.
Figure 11. Suggestions for TDSRC Overall
25%
25%
25%
25%
% 5% 10% 15% 20% 25% 30%
Improve/better design of materials/forms
More age-appropriate material
Let us know theme sooner/send the materials earlier
More games/activities/prizes/incentives/stickers
Base: Library systems that provided a response (n=8). Source: Q36. Do you have any suggestions on the TDSRC overall?
Alberta Program Statistics Response Rate The 16 participating library systems were asked to tally the results of participants in the summer reading club for all of their subsidiary branches. In total, all of the participating systems and 248 of the 268 individual libraries within those systems submitted their results. This results in an overall submission rate of 100% and an overall response rate of 93%.
Figure 1. Response Rate
Alberta
(A) Total Participating Libraries 268
(B) Total Responded to Survey 248
(C) Survey Response Rate 93%
Source: Row (A) provided by Library and Archives Canada. Rows (B) and (C) represent data collected by Harris/Decima.
LAC – TD Summer Reading Club 2011 Summary Report of Program Statistics – Alberta
Number of Children The first section of the Statistics and Evaluation Form asked librarians to indicate the total number of children registered for the TDSRC 2011. This reflects the number of children who registered on the sign-up sheet, with the intent to read books as part of the TD Summer Reading Club.
In Alberta, an estimated 49,683 children registered for the TDSRC 2011 program12. This is up significantly from last year’s 36,637. Girls comprise 27,223 or 55%, of the participants, while the 22,460 boys represent 45% of the participants, similar to proportions in previous years.
Figure 2. Percentage of Participating Children by Gender
55%
54%
55%
56%
55%
54%
55%
45%
46%
45%
44%
45%
46%
45%
0% 20% 40% 60% 80% 100%
2005
2006
2007
2008
2009
2010
2011
Girls Boys
Base: All localities that submitted results (n=248). Data is weighted to reflect all localities that participated in the TDSRC program (n=268). Source: Q3-Q10. Total number of children who registered for the TDSRC 2011.
12 Based on the 248 libraries that submitted their information, extrapolations have been made to represent all 268 participating localities.
LAC – TD Summer Reading Club 2011 Summary Report of Program Statistics – Alberta
Of the girls, 26% fall in the 0-5 age group, 38% are aged 6-8, 32% are aged 9-12, and only 3% are 13 years or older. The boys follow a relatively similar distribution by age, with 29% aged 0-5, 40% aged 6-8, 28% aged 9-12, and 3% aged 13 and older.
Figure 3.1 Percentage of Participating Children by Gender
Base: All localities that submitted results (n=248). Data is weighted to reflect all localities that participated in the TDSRC program (n=268). Source: Q3-Q10. Total number of children who registered for the TDSRC 2011.
Figure 3 below summarizes the participation rate for Alberta by gender and age based on 2006 census data.
Base: All localities that submitted results (n=148). Data is weighted to reflect all localities that participated in the TDSRC program (n=268). Source: Columns (A) through (C) provided by Statistics Canada Census 2006. Column (D) through (F) represents data collected by Harris/Decima.
LAC – TD Summer Reading Club 2011 Summary Report of Program Statistics – Alberta
Reading Kits and Posters The libraries were also asked to indicate the total number of reading kits and posters that were given out to children coming into the library, including those given to daycares and other agencies that came in to pick up reading kits or posters for their group. Anyone who came to a branch and asked for a full reading kit or poster was eligible to receive one. Registration for the TDSRC was not necessary and staff could choose how to distribute the material. In total, 48,366 reading kits were distributed across Alberta, as well as 7,379 posters.
Program Statistics
Programs and Activities Organized Around the Club Theme To help gauge the success of the TDSRC, libraries were asked to indicate the total number of programs and activities organized around this year’s club theme as well as their total attendance, if recorded.
When reviewing these numbers, several points need to be kept in mind:
• Every child who registered for the reading club with the library is considered to have attended an activity.
• It is possible that a child did not register for the TDSRC, but attended one or more of the activities;
• Attendance was calculated on a per activity basis. It is possible that a child attended more than one activity, and thus is represented more than once in total attendance.
A total of 6,789 organized programs and activities were scheduled in libraries across Alberta over the months of July and August 2011, an increase over 2009 and 2010. Total attendance amounted to 128,346 children in 2011, a 40% increase over last year. This translates to an approximate average of 19 children per activity, an increase over 2009 and 2010 on both counts.
Drop-Ins versus Clubs Libraries had the option to run the program as a drop-in program or as a club with distinct meeting times. Almost two thirds (65%) of the localities in Alberta ran the summer reading club both as a drop-in and as a club. One in ten (10%) of localities ran their summer reading program exclusively as a drop-in program, while another 6% of the systems ran theirs solely as a reading club. One in five (20%) reported using neither approach or did not report data.
LAC – TD Summer Reading Club 2011 Summary Report of Program Statistics – Alberta
Program Successes Depending on how libraries implemented the program, they tracked the impact of their program on reading habits and learning using a variety of metrics. These included:
Total number of children who collected all nine stickers;
Total number of books reported on;
Total number of books read; and
Total number of hours read.
Stickers Collected Stickers were used by many of the libraries as incentives for children to read more books. The ultimate goal was to collect all nine stickers. In total, 75% of the library systems used stickers as incentives for children. Among these systems, 24,849 children reached the target of collecting all nine stickers.
Books Read and Reported on Among the library systems that collected these statistics, each child on average:
The average number of books read per child translates to a total of 236,600 books read within the province of Alberta as part of the summer reading club.
LAC – TD Summer Reading Club 2011 Summary Report of Program Statistics – Alberta
School and Daycare Visits by Library Staff Librarians were asked to indicate if anyone from their library branch made any visits to the local schools and daycares in order to promote the program.
Around two thirds (78%) of libraries indicate that their library staff had made visits to schools and daycares to promote the summer reading club. In total, 2,058 visits were made to schools and daycares, and 154,018 children were reached by these means.
Impact of School and Daycare Visits Among the systems that made visits, a total of 44,152 children participated in the TDSRC, representing almost three in ten (29%) children reached.
Among these same library systems, 13,864 children indicated that they first heard of the TDSRC via a school or daycare visit, representing 31% of the total participants.
LAC – TD Summer Reading Club 2011 Summary Report of Program Statistics – Alberta
Method of Promotion Promotional aspects were further investigated by asking librarians to tally, from the registration forms, how the participants first heard about the program. The plurality of participants (14,830) first heard of the TDSRC through school or daycare presentations (30%), 13,394 heard through staff promotion in the branch (27%) and 8,139 (16%) knew about the program because they participated last year. The media, with 5,016 or 10% was much more popular than in previous years. 4,342 (9%) became aware through word-of-mouth while approximately 3,378 (7%) heard about the program through school invitations (7%). All other methods were mentioned 584 times (1%).
Figure 4. How Participants First Heard About the Program
14,830
13,394
8,139
5,016
4,342
3,378
584
9,509
9,382
4,621
1,430
4,248
7,089
358
8,650
8,269
6,284
1,542
3,482
6,206
2,360
0 5,000 10,000 15,000 20,000
School / Daycare presentation
Staff promotion in branch
Joined last year
Media
Word-of-mouth
School invitations
Other
Total Number of Responses
2011 2010 2009
30%26%24%27%26%22%
16%13%17%
10%4%4%9%12%9%
7%19%17%
1%1%6%
% of Cases
Base: All localities that submitted results (n=248). Data is weighted to reflect all localities that participated in the TDSRC program (n=268). Source: Number of participants that first heard about the TDSRC by the following methods: Q23A. Schools; Q23B. Summer day camps, daycare centres, community/public housing projects, faith-based program presentation by library staff; Q23C. Staff promotion in branch; Q23D. Word-of-mouth; Q23E. School invitations; Q23F. Joined last year; Q23G. Media (radio, newspaper, website, library program guide, Transit ads); Q23H. Other.
LAC – TD Summer Reading Club 2011 Summary Report of Program Statistics – Alberta
Satisfaction with Program Elements The 2011 Statistics and Evaluation Form asked respondents to rate their level of satisfaction with more specific elements of the program. The first set of questions looked at the program materials.
Satisfaction levels are very high in Alberta in recent years. Top two box scores (the sum of “very satisfied” and “satisfied” responses) reveal that 94% of localities in Alberta were satisfied with the program theme overall. Large majorities were satisfied with the visual representation of the theme in the materials (94%), the quality of the logbook (92%), and the program poster (90%). Just below nine in ten libraries were happy with the relevance of the content in the logbook (88%).
Figure 5. Satisfaction with Program Elements
50%65%
43%
52%54%
37%
53%55%
42%
53%52%
34%
43%47%
35%
44%33%
50%
42%40%
50%
39%35%
41%
37%41%
44%
45%42%
45%
5%1%
5%
5%4%
11%
7%7%
15%
9%5%
20%
11%11%
18%
0% 25% 50% 75% 100%
201120102009
201120102009
201120102009
201120102009
201120102009
Very satisf ied Satisf ied Neutral
92%90%83%
94%94%87%
88%89%80%
90%93%78%
Top 2 Box
94%98%93%
Base: All localities that submitted results (n=248). Data is weighted to reflect all localities that participated in the TDSRC program (n=268). Source: Q27A-Q27E. Rate your level of satisfaction with the program elements below.
Relevance of Content in Logbook
Quality of the Logbook
Overall Appreciation of the Theme
Visual Representation of Theme in Materials
Program Poster
LAC – TD Summer Reading Club 2011 Summary Report of Program Statistics – Alberta
Libraries also rated their level of satisfaction with other program materials, such as various aspects of the website, promotional materials and the Staff Manual.
Top two box scores reveal that fully 88% of libraries in Alberta were satisfied overall with the website. A large majority of libraries were satisfied with the promotional materials (90%), and the relevance of the content of the staff manual (86%). More than four out of five libraries were also satisfied with the content of the website (85%), the menus and navigation on the website (83%) and the materials available in the website (83%), while only slightly less (79%) were satisfied with the kid’s website. All these satisfaction measures are higher than last year.
Figure 6. Satisfaction with Support Materials
31%30%
27%
51%40%
29%
50%43%
38%
38%28%
24%
45%31%
23%
37%22%
24%
32%28%
23%
57%43%51%
39%49%
51%
36%43%
45%
47%52%
54%
39%47%
51%
46%48%
52%
47%41%
46%
11%21%
20%
8%8%
16%
12%12%
15%
13%14%20%
15%16%23%
15%24%
22%
20%26%
29%
0% 25% 50% 75% 100%
201120102009
201120102009
201120102009
201120102009
201120102009
201120102009
201120102009
Very satisfied Satisfied Neutral
Top 2 Box
88%73%78%
86%86%83%
90%89%80%
83%70%76%
85%80%78%
79%69%69%
83%78%74%
Base: All localities that submitted results (n=248). Data is weighted to reflect all localities that participated in the TDSRC program (n=268). Source: Q27F-Q27L. Rate your level of satisfaction with the program elements below. .
Promotional Materials
Materials Available on Website
Relevance of Content in Staff Manual
Kids' Website
Menus and Navigation on Website
Overall Satisfaction With Website
Content of Website
LAC – TD Summer Reading Club 2011 Summary Report of Program Statistics – Alberta
Program Reading Outcomes Indicators of Success Libraries were asked to indicate whether they had any indicators of a child’s increased enjoyment of reading, reading successes or changes in attitudes toward reading. The most common indicator was the children getting more involved and interested in reading and sharing books (54%). 31% of libraries mentioned that children enjoyed the program and were proud of their accomplishments, that their reading habits had increased, and the children’s interest in the activities/games and incentives. Another 15% reported improved reading comprehension skills.
Figure 7. Indicators of Success
54%
31%
31%
31%
15%
% 20% 40% 60%
Getting involved/hooked/interested in reading/sharing books
Children enjoyed it/were proud of their accomplishments
Increased reading habits/number of books read
Activities/games/prizes/stickers
Improved reading/comprehension/reporting skills
Base: Library systems that provided a response (n=13).
Source: Q33. Do you have any indicators of a child's increased enjoyment of reading? Of reading successes? Changes in attitude toward reading?
LAC – TD Summer Reading Club 2011 Summary Report of Program Statistics – Alberta
Testimonials Libraries were also asked whether they had any testimonials from parents, caregivers or teachers that might indicate an improvement in reading ability. Half of the libraries reported that children enjoyed the program, while almost that many (40%) reported that children liked reading more, and that the program improved the children’s reading skills and vocabulary. Other positive feedback about the program being worthwhile and useful were mentioned by 30% of the libraries in Alberta.
Figure 8. Testimonials
50%
40%
40%
30%
% 10% 20% 30% 40% 50% 60%
Children enjoy the program/theme
Children like to read more
Improves reading skills/vocabulary of children
Positive feedback/good/worthwhile/useful program
Base: Library systems that provided a response (n=10).
Source: Q34. Do you have any testimonials from parents, caregivers or teachers that may indicate an improvement in reading level?
LAC – TD Summer Reading Club 2011 Summary Report of Program Statistics – Alberta
Suggestions Future Themes Libraries were asked to provide suggestions for future program themes. A number of different themes were proposed among libraries in Alberta, the most common being history. There were multiple mentions also for multiculturalism, fantasy/adventure and sci-fi. Figure 9, below, outlines the most commonly suggested themes.
Figure 9. Suggestions for Future Themes
46%
38%
38%
38%
23%
23%
23%
23%
23%
% 10% 20% 30% 40% 50%
History
Multiculturalism/other cultures/countries
Fantasy/adventure
Sci-f i
Animals/pets/bugs/insects
Nature
Sports
Science
Wild West/cowboys
Base: All library systems that provided a response (n=13). Source: Q35. Do you have any suggestions on the program’s future themes?
LAC – TD Summer Reading Club 2011 Summary Report of Program Statistics – Alberta
Suggestions for Data Collection Libraries were asked to provide suggestions on the collection of data for the TDSRC. Although 31% did not have a suggestion on how to improve the data collection (or thought it did not need improving), several suggestions were raised in Alberta, the most common of which was to provide the forms and reports earlier (75%). Some libraries (17%) suggested clarifying the survey questions while others suggested enabling online forms and paper forms for all individual libraries, not tracking gender statistics and providing better ways to track the number of hours read. Figure 10 below lists the suggestions given.
Figure 10. Suggestions for Data Collection
Suggestions For Improving Reporting 2011 Provide survey/forms/reports earlier 75% Clarify/specify survey questions 17% Enable online form/reporting/registration 8% Provide forms to individual libraries 8% Difficult/time consuming to keep counts 8% Do not track/require stats on gender 8% Improve recording of number of hours read 8% Fine/easy/straightforward/no need for improvement 8%
Base: Library systems that provided a response (n=12).
Source: Q37. Do you have any suggestions on how the reporting of program statistics could be improved or made easier/more accurate?
LAC – TD Summer Reading Club 2011 Summary Report of Program Statistics – Alberta
TDSRC Overall Libraries were asked to provide suggestions on the TDSRC overall. The most common suggestions mentioned were to improve the design of the materials/forms, and to send the program materials earlier (38% each). Other popular suggestions included more age-appropriate material (23%), more or better marketing and easier to use registration forms (15% each).
Figure 11. Suggestions for TDSRC Overall
38%
38%
23%
15%
15%
% 5% 10% 15% 20% 25% 30% 35% 40% 45%
Improve/better design of materials/forms
Let us know theme sooner/send the materials earlier
More age-appropriate material
More/better marketing/publicity
Better/easier to collect stats/evaluation/registration forms
Base: Library systems that provided a response (n=13). Source: Q36. Do you have any suggestions on the TDSRC overall?
PEI Program Statistics Response Rate The 25 participating libraries were asked to tally the results of participants in the summer reading club for all of their subsidiary branches. In total, all 25 of the participating libraries submitted their results, representing an overall submission and response rate of 100%.
Figure 1. Response Rate
PEI
(A) Total Participating Libraries 25
(B) Total Responded to Survey 25
(C) Survey Response Rate 100%
Source: Row (A) provided by Library and Archives Canada. Rows (B) and (C) represent data collected by Harris/Decima.
LAC – TD Summer Reading Club 2011 Summary Report of Program Statistics – Prince Edward Island
Number of Children The first section of the Statistics and Evaluation Form asked librarians to indicate the total number of children registered for the TDSRC 2011. This reflects the number of children who registered on the sign-up sheet, with the intent to read books as part of the TD Summer Reading Club.
In PEI, an estimated 1,413 children registered for the TDSRC 2011 program, another slight increase over an estimated 1,371 last year and 1,260 in 2009. Girls comprise 826, or 58%, of the participants, while the 587 boys represent 42% of the participants, similar to proportions in previous years.
Figure 2. Percentage of Participating Children by Gender
57%
55%
57%
59%
55%
58%
58%
43%
45%
43%
41%
45%
42%
42%
0% 20% 40% 60% 80% 100%
2005
2006
2007
2008
2009
2010
2011
Girls Boys
Base: All localities that submitted results (n=25). Source: Q3-Q10. Total number of children who registered for the TDSRC 2011.
LAC – TD Summer Reading Club 2011 Summary Report of Program Statistics – Prince Edward Island
Of the girls, 31% fall in the 0-5 age group, 37% are aged 6-8, 29% are aged 9-12, and 3% are 13 years or older. Of the boys 35% fall in the 0-5 age group, 40% aged 6-8, 24% aged 9-12, and 1% aged 13 and older.
Figure 3.1. Percentage of Participating Children by Gender and Age
Base: All localities that submitted results (n=25). Source: Columns (A) through (C) provided by Statistics Canada Census 2006. Column (D) through (F) represents data collected by Harris/Decima.
LAC – TD Summer Reading Club 2011 Summary Report of Program Statistics – Prince Edward Island
Reading Kits and Posters The libraries were also asked to indicate the total number of reading kits and posters that were given out to children coming into the library, including those given to daycares and other agencies that came in to pick up reading kits or posters for their group. Anyone who came to a branch and asked for a full reading kit or poster was eligible to receive one. Registration for the TDSRC was not necessary and staff could choose how to distribute the material. In total, 1,424 reading kits were distributed across PEI, as well as 495 posters.
Program Statistics
Programs and Activities Organized Around the Club Theme To help gauge the success of the TDSRC, libraries were asked to indicate the total number of programs and activities organized around this year’s club theme as well as their total attendance, if recorded.
When reviewing these numbers, several points need to be kept in mind:
• Every child who registered for the reading club with the library is considered to have attended an activity.
• It is possible that a child did not register for the TDSRC, but attended one or more of the activities;
• Attendance was calculated on a per activity basis. It is possible that a child attended more than one activity, and thus is represented more than once in total attendance.
A total of 608 organized programs and activities were scheduled in libraries across PEI over the months of July and August 2011, an increase over last year (470). Total attendance amounted to 5,450 children, a moderate decrease from last year. This is largely due to smaller attendance per activity as an approximate average of 9 children attended each activity in 2011 (compared to 12 in 2010).
Drop-Ins versus Clubs Libraries had the option to run the program as a drop-in program or as a club with distinct meeting times. More than two thirds (68%) of the localities in PEI ran the summer reading club as both a drop-in and a club. About 12% of localities ran their summer reading club exclusively as a drop-in, whereas the remaining 20% of the systems ran theirs as a club only.
LAC – TD Summer Reading Club 2011 Summary Report of Program Statistics – Prince Edward Island
Program Successes Depending on how libraries implemented the program, they tracked the impact of their program on reading habits and learning using a variety of metrics. These included:
Total number of children who collected all nine stickers;
Total number of books reported on;
Total number of books read; and
Total number of hours read.
Stickers Collected Stickers were used by many of the libraries as incentives for children to read more books. The ultimate goal was to collect all nine stickers. In total, 80% of the libraries used stickers as incentives for children. Among these systems, 398 children reached the target of collecting all nine stickers.
Books Read and Reported on Among the library systems that collected these statistics, each child on average:
School and Daycare Visits by Library Staff Librarians were asked to indicate if anyone from their library branch made any visits to the local schools and daycares in order to promote the program.
The majority (80%) of libraries indicate that their library staff had made visits to schools and daycares to promote the summer reading club. In total, 68 visits were made to schools and daycares, and 6,653 children were reached by these means.
Impact of School and Daycare Visits Among the systems that made visits, a total of 1,202 children participated in the TDSRC, representing 18% of the children reached.
Among these same library systems, 524 children indicated that they first heard of the TDSRC via a school or daycare visit, representing 44% of the total participants.
LAC – TD Summer Reading Club 2011 Summary Report of Program Statistics – Prince Edward Island
Method of Promotion Promotional aspects were further investigated by asking librarians to tally, from the registration forms, how the participants first heard about the program. A total of 561 (40%) participants first heard through a school/daycare presentation, making it the most popular method. Staff promotion in the branch, (389 participants – 28%) and knowing about the program because of joining last year (214 participants – 15%) were also popular. Other sources include word-of-mouth (7%), school invitations (5%) and the media (5%).
Figure 4. How Participants First Heard About the Program
561
389
214
94
73
72
10
471
437
212
109
46
27
69
490
300
233
89
44
50
54
0 100 200 300 400 500 600
School / Daycare presentation
Staff promotion in branch
Joined last year
Word-of-mouth
School invitations
Media
Other
Total Number of Responses
2011 2010 2009
40%34%39%
28%32%24%15%15%18%
7%8%7%
5%3%3%
5%2%4%
1%5%4%
% of Cases
Base: All localities that submitted results (n=25). Source: Number of participants that first heard about the TDSRC by the following methods: Q23A. Schools; Q23B. Summer day camps, daycare centres, community/public housing projects, faith-based program presentation by library staff; Q23C. Staff promotion in branch; Q23D. Word-of-mouth; Q23E. School invitations; Q23F. Joined last year; Q23G. Media (radio, newspaper, website, library program guide, Transit ads); Q23H. Other.
LAC – TD Summer Reading Club 2011 Summary Report of Program Statistics – Prince Edward Island
Satisfaction with Program Elements The 2011 Statistics and Evaluation Form asked respondents to rate their level of satisfaction with more specific elements of the program. The first set of questions looked at the program materials.
Top two box scores (the sum of “very satisfied” and “satisfied” responses) reveal that all of the localities in PEI were satisfied with the theme overall, the quality of the log book and the relevance of the logbook content. A large majority were also satisfied with the visual representation of the theme in the materials. Satisfaction with the program poster (88%) also remained very high.
Figure 5. Satisfaction with Program Elements
44%80%
76%
56%64%
68%
48%64%
60%
52%60%
56%
64%72%
84%
56%20%
16%
44%32%
28%
52%28%
40%
44%40%
44%
24%16%
16%
8%
4%4%
8%
4%
8%4%
0% 25% 50% 75% 100%
201120102009
201120102009
201120102009
201120102009
201120102009
Very satisfied Satisfied Neutral
Top 2 Box
100%92%100%
100%100%92%
100%96%96%
88%88%100%
96% 100%100%
Base: All library systems that submitted results (n=25). Source: Q27A-Q27E. Rate your level of satisfaction with the program elements below.
Relevance of Content in the Logbook
Quality of the Logbook
Overall Appreciation of the Theme
Visual Representation of Theme in Materials
Program poster
LAC – TD Summer Reading Club 2011 Summary Report of Program Statistics – Prince Edward Island
Libraries also rated their level of satisfaction with other program materials, such as various aspects of the website, promotional materials and the Staff Manual.
Top two box scores reveal that 80% of libraries in PEI were satisfied overall with the website. The great majority of libraries were satisfied with the promotional materials, and the relevance of the content in the staff manual (100% and 92% respectively). Four in five libraries were satisfied with both the content of the website (84%) and the materials available on it (80%), while fewer (68%) were satisfied with the navigation on the website. The kid’s website scored the lowest with 60% of libraries being satisfied.
Figure 6. Satisfaction with Support Materials
36%48%
28%
40%64%
48%
40%56%
60%
36%52%
36%
32%48%
36%
32%56%
24%
28%36%
28%
44%36%
60%
60%32%
44%
52%40%
40%
48%36%
44%
48%40%
52%
36%28%
52%
32%28%44%
20%16%
12%
4%8%
8%4%
16%12%
20%
16%12%
8%
32%16%
24%
40%36%
28%
0% 25% 50% 75% 100%
201120102009
201120102009
201120102009
201120102009
201120102009
201120102009
201120102009
Very satisfied Satisfied Neutral
Top 2 Box
80%84%88%
92%96%100%
100%96%92%
68%84%76%
84%88%80%
60%64%72%
80%88%88%
Base: All library systems that submitted results (n=25). Source: Q27F-Q27L. Rate your level of satisfaction with the program elements below.
Promotional Materials
Materials Available on Website
Kids' Website
Menus and Navigation on Website
Overall Satisfaction With The Website
Content of Website
Relevance of Content in Staff Manual
LAC – TD Summer Reading Club 2011 Summary Report of Program Statistics – Prince Edward Island
Program Reading Outcomes Indicators of Success Libraries were asked to indicate whether they had any indicators of a child’s increased enjoyment of reading, reading successes or changes in attitudes toward reading. The most common response was that children were getting involved/interested in reading (36% of libraries). 27% mentioned increased visitors and membership at the library, and 18% reported increased reading habits. Others mentioned the activities/games, more reluctant readers joining the program, continued reading after the program, and good results in the program itself (9% each).
Figure 7. Indicators of Success
36%
27%
18%
9%
9%
9%
9%
% 5% 10% 15% 20% 25% 30% 35% 40%
Getting involved/hooked/interested in reading/sharing books
Increased library visitors and membership
Increased reading habits/number of books read
Activities/games/prizes/stickers
New/less-reluctant audiences/more boys/f riends of readers
Continued reading on their own/taking initiative to read
Good results/success
Base: Library systems that provided a response (n=11).
Source: Q33. Do you have any indicators of a child's increased enjoyment of reading? Of reading successes? Changes in attitude toward reading?
LAC – TD Summer Reading Club 2011 Summary Report of Program Statistics – Prince Edward Island
Testimonials Libraries were also asked whether they had any testimonials from parents, caregivers or teachers that might indicate an improvement in reading level. Two thirds of PEI libraries mentioned that parents said that their children enjoyed the program/theme (67%). Half of the libraries also reported other positive feedback about the program (worthwhile/useful) and 17% said it improved confidence in the children.
Figure 8. Testimonials
67%
50%
17%
% 10% 20% 30% 40% 50% 60% 70%
Children enjoy the program/theme
Positive feedback/good/worthwhile/useful program
Improved conf idence in children
Base: Library systems that provided a response (n=6).
Source: Q34. Do you have any testimonials from parents, caregivers or teachers that may indicate an improvement in reading level?
LAC – TD Summer Reading Club 2011 Summary Report of Program Statistics – Prince Edward Island
Suggestions Future Themes Libraries were asked to provide suggestions for future program themes. The most popular mention was for multiculturalism/other countries (29%). Fantasy/adventure and animals (18%) were also popular suggestions. Libraries also mentioned food/nutrition, pirate, and holiday themes (12%).
Figure 9. Suggestions for Future Themes
29%
18%
18%
12%
12%
12%
% 5% 10% 15% 20% 25% 30% 35%
Multiculturalism/other cultures/countries
Fantasy/adventure
Animals/pets/bugs/insects
Food/nutrition
Pirates
Holiday theme
Base: All library systems that provided a response (n=17). Source: Q35. Do you have any suggestions on the program’s future themes?
LAC – TD Summer Reading Club 2011 Summary Report of Program Statistics – Prince Edward Island
Suggestions for Data Collection Libraries were asked to provide suggestions on the collection of data for the TDSRC. Although the majority of respondents (68%) did not have a suggestion at all (or said it did not need improvement), among those who did, the most common suggestion was to enable online reporting for the individual libraries (31%). Other libraries suggested improving the way that the number of hours read is recorded (15%), as well as to standardize the forms/provide more instruction an that keeping track of all of the variables is difficult (8% each).
Figure 10. Suggestions for Data Collection
Suggestions For Improving Reporting 2011 Fine/easy/straightforward/no need for improvement 38% Enable online form/reporting/registration 31% Improve recording of number of hours read 15% Standardize forms/provide suggestions/more instructions 8% Difficult/time consuming to keep counts 8%
Base: Library systems that provided a response (n=13).
Source: Q37. Do you have any suggestions on how the reporting of program statistics could be improved or made easier/more accurate?
LAC – TD Summer Reading Club 2011 Summary Report of Program Statistics – Prince Edward Island
TDSRC Overall Libraries were asked to provide suggestions on the TDSRC overall. Among those who gave a suggestion, 13% each suggested improved design of the materials/forms and to improve the website. A variety of other suggestions were made by a small number of libraries which are given in figure 11 below.
Figure 11. Suggestions for TDSRC Overall
13%
13%
7%
7%
7%
7%
7%
7%
% 2% 4% 6% 8% 10% 12% 14%
Improve/better design of materials/forms
Improve/update website
More age-appropriate material
Provide us with more/variety of materials
More games/activities/prizes/incentives/stickers
More/better marketing/publicity
Better/easier to collect stats/evaluation/registration forms
Provide more/better training/information on the program
Base: Library systems that provided a response (n=15). Source: Q36. Do you have any suggestions on the TDSRC overall?
Nova Scotia Program Statistics Response Rate The 9 participating library systems were asked to tally the results of participants in the summer reading club for all of their subsidiary branches. In total, all 9 of the participating systems and all 99 of the 99 individual libraries within those systems submitted their results. This results in an overall submission rate and an overall response rate of 100%.
Figure 1. Response Rate
Nova Scotia
(A) Total Participating Libraries 99
(B) Total Responded to Survey 99
(C) Survey Response Rate 100%
Source: Row (A) provided by Library and Archives Canada. Rows (B) and (C) represent data collected by Harris/Decima.
LAC – TD Summer Reading Club 2011 Summary Report of Program Statistics – Nova Scotia
Number of Children The first section of the Statistics and Evaluation Form asked librarians to indicate the total number of children registered for the TDSRC 2011. This reflects the number of children who registered on the sign-up sheet, with the intent to read books as part of the TD Summer Reading Club.
In Nova Scotia, an estimated 13,348 children registered for the TDSRC 2011 program, an increase from 2010 (12,003). Girls comprise 7,636, or 57% of the participants, while the 5,712 boys represent 43% of the participants, similar to previous years.
Figure 2. Percentage of Participating Children by Gender
57%
56%
57%
58%
58%
56%
57%
43%
44%
43%
42%
42%
44%
43%
0% 20% 40% 60% 80% 100%
2005
2006
2007
2008
2009
2010
2011
Girls Boys
Base: All localities that submitted results (n=99). Source: Q3-Q10. Total number of children who registered for the TDSRC 2011.
LAC – TD Summer Reading Club 2011 Summary Report of Program Statistics – Nova Scotia
Of the girls, 19% fall in the 0-5 age group, 37% are aged 6-8, 37% are aged 9-12, and 6% are 13 years or older. The boys follow a similar distribution by age, with 23% aged 0-5, 41% aged 6-8, 31% aged 9-12, and 4% aged 13 and older.
Figure 3.1. Percentage of Participating Children by Gender and Age
Base: All localities that submitted results (n=99). Source: Q3-Q10. Total number of children who registered for the TDSRC 2011.
Figure 3 below summarizes the participation rate for Nova Scotia by gender and age based on 2006 census data.
Figure 3. Number of Participating Children
Base: All localities that submitted results (n=99). Source: Columns (A) through (C) provided by Statistics Canada Census 2006. Column (D) through (F) represents data collected by Harris/Decima.
Reading Kits and Posters The libraries were also asked to indicate the total number of reading kits and posters that were given out to children coming into the library, including those given to daycares and other agencies that came in to pick up reading kits or posters for their group. Anyone who came to a branch and asked for a full reading kit or poster was eligible to receive one. Registration for the TDSRC was not necessary and staff could choose how to distribute the material. In total, 11,368 reading kits were distributed across Nova Scotia, as well as 3,615 posters.
Program Statistics
Programs and Activities Organized Around the Club Theme To help gauge the success of the TDSRC, libraries were asked to indicate the total number of programs and activities organized around this year’s club theme as well as their total attendance, if recorded.
When reviewing these numbers, several points need to be kept in mind:
• Every child who registered for the reading club with the library is considered to have attended an activity.
• It is possible that a child did not register for the TDSRC, but attended one or more of the activities;
• Attendance was calculated on a per activity basis. It is possible that a child attended more than one activity, and thus is represented more than once in total attendance.
A total of 1,216 organized programs and activities were scheduled in libraries across Nova Scotia over the months of July and August 2011. Total attendance amounted to 25,544 children. This translates to an approximate average of 21 children per activity, up from 18 in 2010.
Drop-Ins versus Clubs Libraries had the option to run the program as a drop-in program or as a club with distinct meeting times. The majority (80%) ran their summer reading club exclusively as a drop-in program. Almost one in five localities in Nova Scotia (18%) ran the summer reading club both as a drop-in and as a club and 2% ran neither format or provided no info. No localities in Nova Scotia ran the program as a club only.
LAC – TD Summer Reading Club 2011 Summary Report of Program Statistics – Nova Scotia
Program Successes Depending on how libraries implemented the program, they tracked the impact of their program on reading habits and learning using a variety of metrics. These included:
Total number of children who collected all nine stickers;
Total number of books reported on;
Total number of books read; and
Total number of hours read.
Stickers Collected Stickers were used by many of the libraries as incentives for children to read more books. The ultimate goal was to collect all nine stickers. In total, the great majority of libraries (89%) used stickers as incentives for children. Among these systems, 6,251 children reached the target of collecting all nine stickers.
Books Read and Reported on Among the library systems that collected these statistics, each child on average:
• Reported on 3.1 books; • Read 14.1 books; • Reported an average of 5.2 hours reading.
The average number of books read per child translates to a total of 191,899 books read within the province of Nova Scotia as part of the summer reading club.
LAC – TD Summer Reading Club 2011 Summary Report of Program Statistics – Nova Scotia
School and Daycare Visits by Library Staff Librarians were asked to indicate if anyone from their library branch made any visits to the local schools and daycares in order to promote the program.
Two thirds of library systems (66%) in Nova Scotia indicate that their library staff made visits to schools and daycares to promote the summer reading club. In total, 475 visits were made to schools and daycares, and 40,642 children were reached by these means.
Impact of School and Daycare Visits Among the systems that made visits, a total of 9,137 children participated in the TDSRC, representing almost a quarter (22%) of children reached.
Among these same library systems, 3,311 children indicated that they first heard of the TDSRC via a school or daycare visit, representing 36% of the total participants.
LAC – TD Summer Reading Club 2011 Summary Report of Program Statistics – Nova Scotia
Method of Promotion Promotional aspects were further investigated by asking librarians to tally, from the registration forms, how the participants first heard about the program. A total of 3,960 participants first heard of the TDSRC through school or daycare presentations (30%), while approximately the same number 3,896 (29%) were aware of the program because they participated last year. Another 2,991 (22%) heard about the program through a staff promotion in the branch, and 1,482 (11%) became aware through word-of-mouth. Less common methods include school invitations (576 participants – 4%) and through the media (298 participants – 2%).
Figure 4. How Participants First Heard About the Program
3,960
3,896
2,991
1,482
576
298
145
3,680
3,573
2,601
1,281
490
254
122
3,911
3,573
3,155
1,468
702
272
116
0 1,000 2,000 3,000 4,000
School / Daycare presentation
Joined last year
Staff promotion in branch
Word-of-mouth
School invitations
Media
Other
Total Number of Responses
2011 2010 2009
30%31%30%
29%30%27%
22%22%24%
4%4%5%
11%11%11%
2%2%2%
1%1%1%
% of Cases
Base: All localities that submitted results (n=99). Source: Number of participants that first heard about the TDSRC by the following methods: Q23A. Schools; Q23B. Summer day camps, daycare centres, community/public housing projects, faith-based program presentation by library staff; Q23C. Staff promotion in branch; Q23D. Word-of-mouth; Q23E. School invitations; Q23F. Joined last year; Q23G. Media (radio, newspaper, website, library program guide, Transit ads); Q23H. Other.
LAC – TD Summer Reading Club 2011 Summary Report of Program Statistics – Nova Scotia
Satisfaction with Program Elements The 2011 Statistics and Evaluation Form asked respondents to rate their level of satisfaction with more specific elements of the program. The first set of questions looked at the program materials.
By and large, satisfaction levels in Nova Scotia are high. Top two box scores (the sum of “very satisfied” and “satisfied” responses) reveal that a great majority (89%) of the localities in Nova Scotia were satisfied with the theme overall. Satisfaction even higher with regard to other individual elements tested: the quality of the logbook (98%), the relevance of the content in the logbook (93%), the program poster (99%) and the visual representation of the theme in the materials (98%).
Figure 5. Satisfaction with Program Elements
52%74%
61%
51%57%
36%
53%64%
36%
49%66%
37%49%
43%
37%20%
22%
48%33%
31%
45%32%
62%
49%24%
15%
56%46%
55%
11%3%
1%
7%1%
2%2%
1%
2%7%
1%
7%2%
2%
0% 25% 50% 75% 100%
201120102009
201120102009
201120102009
201120102009
201120102009
Very satisfied Satisfied Neutral
Top 2 Box
98%96%98%
89%94%83%
99%90%67%
93%95%98%
98%90%66%
Base: All localities that submitted results (n=99). Source: Q27A-Q27E. Rate your level of satisfaction with the program elements below.
Quality of the Logbook
Overall Appreciation of Theme
Visual Representation of Theme in Materials
Program Poster
Relevance of the Content in Logbook
LAC – TD Summer Reading Club 2011 Summary Report of Program Statistics – Nova Scotia
Libraries also rated their level of satisfaction with other program materials, such as various aspects of the website, promotional materials and the Staff Manual.
Top two box scores reveal that 72% of libraries in Nova Scotia were satisfied overall with the website, which is a drop from 2009 and 2010. A majority of localities were satisfied with the relevance of the content in the staff manual (85%), the materials available on the website (72%), the promotional materials they received (70%) and the content on the website (69%) and. Around six in ten localities were also satisfied with the kid’s website (63%) and the menus and navigation on the website (60%).
Figure 6. Satisfaction with Support Material
27%19%19%
40%44%
18%
28%20%20%
36%23%23%
27%20%20%
25%16%
20%
27%21%
19%
45%59%
76%
45%45%
61%
44%60%
76%
34%56%
36%
42%60%
76%
38%16%
61%
33%51%
64%
27%22%
5%
15%11%
21%
27%19%
4%
26%16%
24%
32%20%
4%
37%24%
19%
38%17%
18%
0% 25% 50% 75% 100%
201120102009
201120102009
201120102009
201120102009
201120102009
201120102009
201120102009
Very satisfied Satisfied Neutral
Top 2 Box
72%78%95%
72%80%96%
85%89%79%
63%32%81%
70%79%59%
60%72%83%
69%80%96%
Base: All localities that submitted results (n=99). Source: Q27F-Q27L. Rate your level of satisfaction with the program elements below.
Promotional Materials
Relevance of Content in Staff Manual
Kids' Website
Menus and Navigation on Website
Overall Satisfaction With Website
Content of Website
Materials Available on Website
LAC – TD Summer Reading Club 2011 Summary Report of Program Statistics – Nova Scotia
Program Reading Outcomes Indicators of Success Libraries were asked to indicate whether they had any indicators of a child’s increased enjoyment of reading, reading successes or changes in attitudes toward reading. There were few responses to this question, and they are all listed in the table below.
Figure 7. Indicators of Success
Indicator # of Mentions
Discussion/talking/reporting about books read 2 Getting involved/hooked/interested in reading/sharing books 1 Targets/goals set by readers 1 Children enjoyed the theme 1
Base: Library systems that provided a response (n=2).
Source: Q33. Do you have any indicators of a child's increased enjoyment of reading? Of reading successes? Changes in attitude toward reading?
LAC – TD Summer Reading Club 2011 Summary Report of Program Statistics – Nova Scotia
Testimonials Libraries were also asked whether they had any testimonials from parents, caregivers or teachers that might indicate an improvement in reading level. Everything that was mentioned regarding testimonials is listed below.
Figure 8. Testimonials
Testimonial # of Mentions
Positive feedback/good/worthwhile/useful program 1 Children enjoy the program/theme 1 Children like to read more 1 Improves reading skills/vocabulary of children 1
Base: Library systems that provided a response (n=3).
Source: Q34. Do you have any testimonials from parents, caregivers or teachers that may indicate an improvement in reading level?
LAC – TD Summer Reading Club 2011 Summary Report of Program Statistics – Nova Scotia
Suggestions Future Themes Libraries were asked to provide suggestions for future program themes. A number of different themes are proposed among libraries in Nova Scotia, including fantasy/adventure and multiculturalism. All of the themes mentioned are listed below.
Suggestions for Data Collection Libraries were asked to provide suggestions on the collection of data for the TDSRC. There were very few responses, and they are all listed below.
Figure 10. Suggestions for Data Collection
Suggestions For Improving Reporting # of Mentions
Enable online form/reporting/registration for individual libraries 1 Other 1
Base: Library systems that provided a response (n=2).
Source: Q37. Do you have any suggestions on how the reporting of program statistics could be improved or made easier/more accurate?
LAC – TD Summer Reading Club 2011 Summary Report of Program Statistics – Nova Scotia
TDSRC Overall Libraries were asked to provide suggestions on the TDSRC overall. Few responses were given, with two library systems suggesting to improve the posters/stickers.
Figure 11. Suggestions for TDSRC Overall
Suggestions for TDSRC Overall # of Mentions
Improve/better design of materials/forms 2
Base: Library systems that provided a response (n=2). Source: Q36. Do you have any suggestions on the TDSRC overall?
Newfoundland & Labrador Program Statistics Response Rate The 88 participating libraries were asked to tally the results of participants in the summer reading club for all of their subsidiary branches. In total, 86 participating libraries submitted their results, representing an overall submission and response rate of 98%.
Figure 1. Response Rate
Newfoundland and Labrador
(A) Total Participating Libraries 88
(B) Total Responded to Survey 86
(C) Survey Response Rate 98%
Source: Row (A) provided by Library and Archives Canada. Rows (B) and (C) represent data collected by Harris/Decima.
LAC – TD Summer Reading Club 2011 Summary Report of Program Statistics – Newfoundland & Labrador
Number of Children The first section of the Statistics and Evaluation Form asked librarians to indicate the total number of children registered for the TDSRC 2011. This reflects the number of children who registered on the sign-up sheet, with the intent to read books as part of the TD Summer Reading Club.
In Newfoundland and Labrador, an estimated 3,148 children registered for the TDSRC 2011 program, a slight decrease from the high of 2010 (3,389). Girls comprise 1,784, or 57%, of the participants, while the 1,364 boys represent 43% of the participants.
Figure 2. Percentage of Participating Children by Gender
56%
60%
60%
59%
58%
57%
57%
44%
40%
40%
41%
42%
43%
43%
0% 20% 40% 60% 80% 100%
2005
2006
2007
2008
2009
2010
2011
Girls Boys
Base: All localities that submitted results (n=86). Data is weighted to reflect all localities that participated in the TDSRC program (n=88). Source: Q3-Q10. Total number of children who registered for the TDSRC 2011.
LAC – TD Summer Reading Club 2011 Summary Report of Program Statistics – Newfoundland & Labrador
Of the girls, 35% fall in the 0-5 age group, 35% are aged 6-8, 27% are aged 9-12, and 2% are 13 years or older. For the boys, 42% aged 0-5, 36% aged 6-8, 20% aged 9-12, and 2% aged 13 and older.
Figure 3.1. Percentage of Participating Children by Gender
Base: All localities that submitted results (n=86). Data is weighted to reflect all localities that participated in the TDSRC program (n=88). Source: Q3-Q10. Total number of children who registered for the TDSRC 2011.
Figure 3 below summarizes the participation rate for Newfoundland and Labrador by gender and age based on 2006 census data.
Figure 3. Number of Participating Children
% PARTICIP. CHILDREN
% PARTICIP. CHILDREN
% PARTICIP. CHILDREN
(A) (B) (C) (D) (E) (F) 2011 2010 2009
Province / Territory Total Children Total Boys Total Girls Total
Children Total Boys Total Girls Total Children Total Children Total Children
Base: All localities that submitted results (n=86). Data is weighted to reflect all localities that participated in the TDSRC program (n=88). Source: Columns (A) through (C) provided by Statistics Canada Census 2006. Column (D) through (F) represents data collected by Harris/Decima.
LAC – TD Summer Reading Club 2011 Summary Report of Program Statistics – Newfoundland & Labrador
Reading Kits and Posters The libraries were also asked to indicate the total number of reading kits and posters that were given out to children coming into the library, including those given to daycares and other agencies that came in to pick up reading kits or posters for their group. Anyone who came to a branch and asked for a full reading kit or poster was eligible to receive one. Registration for the TDSRC was not necessary and staff could choose how to distribute the material. In total, 4,021 reading kits were distributed across Newfoundland and Labrador, as well as 2,136 posters, a slight decrease in both measures over 2011.
Program Statistics
Programs and Activities Organized Around the Club Theme To help gauge the success of the TDSRC, libraries were asked to indicate the total number of programs and activities organized around this year’s club theme as well as their total attendance, if recorded.
When reviewing these numbers, several points need to be kept in mind:
• Every child who registered for the reading club with the library is considered to have attended an activity.
• It is possible that a child did not register for the TDSRC, but attended one or more of the activities;
• Attendance was calculated on a per activity basis. It is possible that a child attended more than one activity, and thus is represented more than once in total attendance.
A total of 798 organized programs and activities were scheduled in libraries across Newfoundland and Labrador over the months of July and August 2011. Total attendance amounted to 8,172 children. This translates to an approximate average of 10 children per activity.
Drop-Ins versus Clubs Libraries had the option to run the program as a drop-in program or as a club with distinct meeting times. In Newfoundland and Labrador, 44% of the localities ran the summer reading club as a club only while 36% ran it exclusively as a drop-in program. On the other hand, 16% of the localities ran it as both a club and a drop-in program. Only 3% did not use either format or did not report information.
LAC – TD Summer Reading Club 2011 Summary Report of Program Statistics – Newfoundland & Labrador
Program Successes Depending on how libraries implemented the program, they tracked the impact of their program on reading habits and learning using a variety of metrics. These included:
Total number of children who collected all nine stickers;
Total number of books reported on;
Total number of books read; and
Total number of hours read.
Stickers Collected Stickers were used by many of the libraries as incentives for children to read more books. The ultimate goal was to collect all nine stickers. In total, 77% of the library systems used stickers as incentives for children to read more books. Among these systems, 1,503 children reached the target of collecting all nine stickers.
Books Read and Reported on Among the library systems that collected these statistics, each child on average:
The average number of books read per child translates to a total of 25,989 books read within the province of Newfoundland and Labrador as part of the summer reading club.
LAC – TD Summer Reading Club 2011 Summary Report of Program Statistics – Newfoundland & Labrador
School and Daycare Visits by Library Staff Librarians were asked to indicate if anyone from their library branch made any visits to the local schools and daycares in order to promote the program.
Around half of the library systems in Newfoundland and Labrador (57%) indicate that their library staff made visits to schools and daycares to promote the summer reading club. In total, 168 visits were made to schools and daycares, and 6,303 children were reached by these means.
Impact of School and Daycare Visits Among the systems which made visits to the local schools and daycares, a total of 2,101 children participated in the TDSRC, representing a third (33%) of the children reached.
Among the same library systems, 318 children indicated that they first heard of the TDSRC via a school or daycare visit, representing 15% of the total participants.
LAC – TD Summer Reading Club 2011 Summary Report of Program Statistics – Newfoundland & Labrador
Method of Promotion Promotional aspects were further investigated by asking librarians to tally, from the registration forms, how the participants first heard about the program.
By a wide margin, the most popular method with which participants first heard of the TDSRC was through staff promotion in the branch, with 1,732 (55%) respondents hearing about it this way – a large increase compared to 2010. Having participated last year (439 participants, 14%) was the second most popular method, and school/daycare presentations were third (384 participants, 12%). Word-of-mouth fell in importance in 2011 to 7%, as did school invitations (6%). The media (4%) and all other methods were similar in importance compared to 2010. Details are provided in Figure 4.
Figure 4. How Participants First Heard About the Program
1,732
439
384
235
188
115
55
1,559
410
416
427
365
129
82
1,330
339
329
506
213
123
72
0 500 1,000 1,500 2,000
Staff promotion in branch
Joined last year
School / Daycare presentation
Word-of-mouth
School invitations
Media
Other
Total Number of Responses
2011 2010 2009
55%46%46%
14%12%12%
12%12%11%
7%13%17%
6%11%7%
4%4%4%
2%2%2%
% of Cases
Base: All localities that submitted results (n=86). Data is weighted to reflect all localities that participated in the TDSRC program (n=88). Source: Number of participants that first heard about the TDSRC by the following methods: Q23A. Schools; Q23B. Summer day camps, daycare centres, community/public housing projects, faith-based program presentation by library staff; Q23C. Staff promotion in branch; Q23D. Word-of-mouth; Q23E. School invitations; Q23F. Joined last year; Q23G. Media (radio, newspaper, website, library program guide, Transit ads); Q23H. Other.
LAC – TD Summer Reading Club 2011 Summary Report of Program Statistics – Newfoundland & Labrador
Satisfaction with Program Elements The 2011 Statistics and Evaluation Form asked respondents to rate their level of satisfaction with more specific elements of the program. The first set of questions looked at the program materials.
By and large, satisfaction levels are higher than in previous years. Top two box scores (the sum of “very satisfied” and “satisfied” responses) reveal that 95% of localities in Newfoundland and Labrador were satisfied with the theme overall, and 94% were happy with the visual representation of the theme in the materials. 89% of the libraries were satisfied with both the program poster and the quality of the logbook. Although a lower level of satisfaction than 2010, more than four out of five libraries (82%) were satisfied with the relevance of the content in the logbook.
Figure 5. Satisfaction with Program Elements
44%47%49%
36%40%
38%
36%37%
44%
33%40%
43%
31%36%
43%
51%45%
38%
58%49%
50%
53%56%
49%
56%51%
48%
51%54%41%
3%8%
14%
5%10%11%
7%7%6%
10%10%9%
16%10%
15%
0% 25% 50% 75% 100%
201120102009
201120102009
201120102009
201120102009
201120102009
Very satisfied Satisfied Neutral
Top 2 Box
89%93%93%
95%92%87%
94%89%88%
82%90%84%
89%91%91%
Base: All localities that submitted results (n=86). Data is weighted to reflect all localities that participated in the TDSRC program (n=88). Source: Q27A-Q27E. Rate your level of satisfaction with the program elements below.
Relevance of Content in Logbook
Quality of the Logbook
Overall Appreciation of Theme
Visual Representation of Theme in Materials
Program Poster
LAC – TD Summer Reading Club 2011 Summary Report of Program Statistics – Newfoundland & Labrador
Libraries also rated their level of satisfaction with other program materials, such as various aspects of the website, promotional materials and the Staff Manual.
Top two box scores reveal that 89% of libraries in Newfoundland and Labrador were satisfied overall with the website, a decrease of 8% since 2010. 90% were satisfied with the content of the website, and 89% with the promotional materials. 88% of the libraries were satisfied with the relevance of the content of the staff manual, the materials available on the website, and the menus and navigation on the website. Four in five libraries were satisfied with the kids’ website. These results show a decrease in satisfaction compared to 2010 and are more similar to the levels recorded in 2009.
Figure 6. Satisfaction with Support Material
33%40%
43%
33%38%
41%
30%36%
39%
36%38%
46%
35%42%
38%
30%38%
43%
31%31%
38%
56%57%
45%
57%55%
43%
59%57%
49%
52%57%
44%
53%52%
46%
58%57%
43%
49%60%46%
10%3%
13%
8%7%
16%
9%7%
10%
9%4%
9%
9%5%
15%
9%4%
15%
19%9%
16%
0% 25% 50% 75% 100%
201120102009
201120102009
201120102009
201120102009
201120102009
201120102009
201120102009
Very satisfied Satisfied Neutral
Top 2 Box
89%97%88%
89%93%88%
90%93%84%
88%95%86%
88%95%90%
80%91%84%
88%94%84%
Base: All localities that submitted results (n=86). Data is weighted to reflect all localities that participated in the TDSRC program (n=88). Source: Q27F-Q27L. Rate your level of satisfaction with the program elements below.
Promotional Materials
Relevance of Content in Staff Manual
Kids' Website
Menus and Navigation on Website
Overall Satisfaction With Website
Content of Website
Materials Available on Website
LAC – TD Summer Reading Club 2011 Summary Report of Program Statistics – Newfoundland & Labrador
Program Reading Outcomes Indicators of Success Libraries were asked to indicate whether they had any indicators of a child’s increased enjoyment of reading, reading successes or changes in attitudes toward reading. The most common indicator was that kids were becoming interested in reading and in sharing books (21%). 15% of libraries also reported increased reading habits and increased library membership and visits. Another 12% mentioned the activities/games, that more reluctant children were participating, and that the children who participated enjoyed the theme.
Figure 7. Indicators of Success
21%
15%
15%
12%
12%
12%
% 5% 10% 15% 20% 25%
Getting involved/hooked/interested in reading/sharing books
Increased reading habits/number of books read
Increased library visitors and membership
Activities/games/prizes/stickers
New/less-reluctant audiences/more boys/friends of readers
Children enjoyed the theme
Base: Library systems that provided a response (n=34).
Source: Q33. Do you have any indicators of a child's increased enjoyment of reading? Of reading successes? Changes in attitude toward reading?
LAC – TD Summer Reading Club 2011 Summary Report of Program Statistics – Newfoundland & Labrador
Testimonials Libraries were also asked whether they had any testimonials from parents, caregivers or teachers that might indicate an improvement in reading level. A full third of the libraries reported that children were reading more as a result of the program. Almost as many libraries reported (28%) mentioned that children enjoyed the program, and that the program was worthwhile and useful. Just less than a quarter (22%) stated that it improved the skills and vocabulary of the children. Others mentioned that the program made the transition back to school easier (17%) and that it improved the children’s confidence (6%).
Figure 8. Testimonials
33%
28%
28%
22%
17%
6%
% 10% 20% 30% 40%
Children like to read more
Children enjoy the program/theme
Positive feedback/good/worthwhile/useful program
Improves reading skills/vocabulary of children
Good for back-to-school/easier transition/maintained ability
Improved conf idence in children
Base: Library systems that provided a response (n=18).
Source: Q34. Do you have any testimonials from parents, caregivers or teachers that may indicate an improvement in reading level?
LAC – TD Summer Reading Club 2011 Summary Report of Program Statistics – Newfoundland & Labrador
Suggestions Future Themes Libraries were asked to provide suggestions for future program themes. Responses were varied, but more than a quarter (28%) suggested animals/pets, and just less than a quarter (22%) suggested fantasy/adventure. Multiculturalism/other countries and sci-fi were also popular (17%) along with nature and sports (11%).
Figure 9. Suggestions for Future Themes
28%
22%
17%
17%
11%
11%
% 5% 10% 15% 20% 25% 30%
Animals/pets/bugs/insects
Fantasy/adventure
Multiculturalism/other cultures/countries
Sci-f i
Nature
Sports
Base: All library systems that provided a response (n=18). Source: Q35. Do you have any suggestions on the program’s future themes?
LAC – TD Summer Reading Club 2011 Summary Report of Program Statistics – Newfoundland & Labrador
Suggestions for Data Collection Libraries were asked to provide suggestions on the collection of data for the TDSRC. There were few responses to this question (89% did not have a response or felt no improvement was necessary) but among those who responded, 23% requested that the forms be provided earlier. 15% requested daily or weekly reporting and 8% requested an online forum where they can track their stats on throughout as well as requesting that stats not be kept by gender.
Figure 10. Suggestions for Data Collection
Suggestions For Improving Reporting 2011 Fine/easy/straightforward/no need for improvement 31% Provide survey/forms/reports earlier 23% Allow/require weekly/daily reporting 15% Enable online form/reporting/registration 8% Keep stats by age/gender 8%
Base: Library systems that provided a response (n=13).
Source: Q37. Do you have any suggestions on how the reporting of program statistics could be improved or made easier/more accurate?
LAC – TD Summer Reading Club 2011 Summary Report of Program Statistics – Newfoundland & Labrador
TDSRC Overall Libraries were asked to provide suggestions on the TDSRC overall. 10% requested more age-appropriate material, and another 10% requested a greater variety of materials. 7% requested an improved website and more games/prizes.
Figure 11. Suggestions for TDSRC Overall
10%
10%
7%
7%
% 2% 4% 6% 8% 10% 12%
More age-appropriate material
Provide us with more/variety of materials
Improve/update website
More games/activities/prizes/incentives/stickers
Base: Library systems that provided a response (n=29). Source: Q36. Do you have any suggestions on the TDSRC overall?
Nunavut, Yukon, and Northwest Territories Program Statistics Response Rate The library branches were asked to tally the results of participants in the summer reading club. Within the three Territories, a total of 11 libraries participated, and all 11 reported their data. This represents an overall submission and response rate of 100%.
Figure 1. Response Rate
Territories NWT NU YK
(A) Total Participating Libraries 11 3 1 7
(B) Total Responded to Survey 11 3 1 7
(C) Survey Response Rate 100% 100% 100% 100%
Source: Row (A) provided by Library and Archives Canada. Rows (B) and (C) represent data collected by Harris/Decima.
LAC – TD Summer Reading Club 2011 Summary Report of Program Statistics – NWT, Yukon & Nunavut
Number of Children The first section of the Statistics and Evaluation Form asked librarians to indicate the total number of children registered for the TDSRC 2011. This reflects the number of children who registered on the sign-up sheet, with the intent to read books as part of the TD Summer Reading Club.
In the territories, an estimated 1,300 children registered for the TDSRC 2011 program, a large increase over 2010’s registration of 761. Girls comprise 756, or 58%, of the participants, while the 544 boys represent 42% of the participants.
Figure 2. Percentage of Participating Children by Gender
51%
64%
66%
46%
57%
58%
58%
49%
36%
34%
54%
43%
42%
42%
0% 20% 40% 60% 80% 100%
2005
2006
2007
2008
2009
2010
2011
Girls Boys
Base: All localities that submitted results (n=11). Data is weighted to reflect all localities that participated in the TDSRC program (n=11). Source: Q3-Q10. Total number of children who registered for the TDSRC 2011.
LAC – TD Summer Reading Club 2011 Summary Report of Program Statistics – NWT, Yukon & Nunavut
Of the boys, 28% fall in the 0-5 age group, 42% are aged 6-8, 28% are aged 9-12, and 2% are 13 years or older. The boys skew slightly older, with 25% aged 0-5, 39% aged 6-8, 32% aged 9-12, and 4% aged 13 and older.
Figure 3.1. Percentage of Participating Children by Gender and Age
Base: All localities that submitted results (n=11). Data is weighted to reflect all localities that participated in the TDSRC program (n=11). Source: Q3-Q10. Total number of children who registered for the TDSRC 2011.
Figure 3 below summarizes the participation rate for the Territories by gender and age based on 2006 census data.
Figure 3. Number of Participating Children
% PARTICIP. CHILDREN
% PARTICIP. CHILDREN
% PARTICIP. CHILDREN
(A) (B) (C) (D) (E) (F) 2011 2010 2009
Province / Territory
Total Children Total Boys Total Girls Total
Children Total Boys Total Girls Total Children Total Children Total Children
Base: All localities that submitted results (n=11). Data is weighted to reflect all localities that participated in the TDSRC program (n=11). Source: Columns (A) through (C) provided by Statistics Canada Census 2006. Column (D) through (G) represents data collected by Harris/Decima.
LAC – TD Summer Reading Club 2011 Summary Report of Program Statistics – NWT, Yukon & Nunavut
Reading Kits and Posters The libraries were also asked to indicate the total number of reading kits and posters that were given out to children coming into the library, including those given to daycares and other agencies that came in to pick up reading kits or posters for their group. Anyone who came to a branch and asked for a full reading kit or poster was eligible to receive one. Registration for the TDSRC was not necessary and staff could choose how to distribute the material. In total, 1,261 reading kits were distributed across the Territories, as well as 1,057 posters.
Program Statistics
Programs and Activities Organized Around the Club Theme To help gauge the success of the TDSRC, libraries were asked to indicate the total number of programs and activities organized around this year’s club theme as well as their total attendance, if recorded.
When reviewing these numbers, several points need to be kept in mind:
• Every child who registered for the reading club with the library is considered to have attended an activity.
• It is possible that a child did not register for the TDSRC, but attended one or more of the activities;
• Attendance was calculated on a per activity basis. It is possible that a child attended more than one activity, and thus is represented more than once in total attendance.
A total of 294 organized programs and activities were scheduled in libraries across Nunavut, Yukon and NWT over the months of July and August 2011. Total attendance amounted to 2,554 children. This translates to an approximate average of 9 children per activity.
Drop-Ins versus Clubs Libraries had the option to run the program as a drop-in program or as a club with distinct meeting times. 27% of the localities ran the summer reading club as a club only, and 27% ran it as a drop-in only. 45% ran it as both a drop-in and a club.
LAC – TD Summer Reading Club 2011 Summary Report of Program Statistics – NWT, Yukon & Nunavut
Program Successes Depending on how libraries implemented the program, they tracked the impact of their program on reading habits and learning using a variety of metrics. These included:
Total number of children who collected all nine stickers;
Total number of books reported on;
Total number of books read; and
Total number of hours read.
Stickers Collected Stickers were used by many of the libraries as incentives for children to read more books. The ultimate goal was to collect all nine stickers. 36% of the libraries responding used stickers as incentives for children. Among these libraries, 65 children reached the target of collecting all nine stickers.
Books Read and Reported on Among the libraries that collected these statistics, each child on average:
School and Daycare Visits by Library Staff Librarians were asked to indicate if anyone from their library branch made any visits to the local schools and daycares in order to promote the program.
45% of libraries indicate that their library staff had made visits to schools and daycares to promote the summer reading club. In total, 31 visits were made to schools and daycares, and 770 children were reached by these means.
Impact of School and Daycare Visits Among the libraries that made visits, a total of 1,053 children participated in the TDSRC, which is actually greater than the 770 children reached by visits to schools and daycares. A total of 311 children indicated that they first heard of the TDSRC via a school or daycare visit, representing 30% of children.
LAC – TD Summer Reading Club 2011 Summary Report of Program Statistics – NWT, Yukon & Nunavut
Method of Promotion Promotional aspects were further investigated by asking librarians to tally, from the registration forms, how the participants first heard about the program. The responses in 2011 were more like those of 2009, with staff promotion in the branch being the most common method (31% of participants). School/daycare presentations were the next most popular with more than a quarter (26%). Having joined last year was given by 15% of 2011 participants, with word-of-mouth and school invitations given by 10%.The media was mentioned by 6% and all other methods accounted for 2%. Details are provided in Figure 4.
Figure 4. How Participants First Heard About the Program
405
333
199
129
126
83
25
101
156
18
268
35
185
220
164
127
81
83
36
33
0 100 200 300 400 500
Staff promotion in branch
School / Daycare presentation
Joined last year
Word-of-mouth
School invitations
Media
Other
Total Number of Responses
2011 2010 2009
31%13%30%
26%20%22%15%2%17%
10%35%11%
10%5%11%
6%24%5%
2%0%4%
% of Cases
Base: All localities that submitted results (n=11). Data is weighted to reflect all localities that participated in the TDSRC program (n=11). Source: Number of participants that first heard about the TDSRC by the following methods: Q23A. Schools; Q23B. Summer day camps, daycare centres, community/public housing projects, faith-based program presentation by library staff; Q23C. Staff promotion in branch; Q23D. Word-of-mouth; Q23E. School invitations; Q23F. Joined last year; Q23G. Media (radio, newspaper, website, library program guide, Transit ads); Q23H. Other.
LAC – TD Summer Reading Club 2011 Summary Report of Program Statistics – NWT, Yukon & Nunavut
Satisfaction with Program Elements The 2011 Statistics and Evaluation Form asked respondents to rate their level of satisfaction with more specific elements of the program. The first set of questions looked at the program materials.
By and large, satisfaction levels were high among the branches in the Territories. Top two box scores (the sum of “very satisfied” and “satisfied” responses) reveal that 91% of all localities were satisfied with the overall theme and the program poster. Just over four in five (82%) were satisfied with the visual representation of the theme in the materials. Just under three quarters (73% of libraries) were satisfied with the relevance of the content in the logbook and the quality of the logbook. Overall, satisfaction was lower than in 2010, but sample sizes are very small.
Figure 5. Satisfaction with Program Elements
36%63%
14%
36%50%
36%48%
27%28%
18%67%
55%25%
29%
55%50%
43%
45%52%
57%
45%45%
29%
55%33%
57%
9%13%
43%
9%
29%
18%
43%
18%
29%
18%
43%
0% 25% 50% 75% 100%
201120102009
201120102009
201120102009
201120102009
201120102009
Very satisfied Satisfied Neutral
Top 2 Box
91%88%43%
91%100%71%
82%100%57%
73%73%43%
73%100%57%
Base: All localities that submitted results (n=11). Data is weighted to reflect all localities that participated in the TDSRC program (n=11). Source: Q27A-Q27E. Rate your level of satisfaction with the program elements below.
Relevance of Content in Logbook
Quality of the Logbook
Overall Appreciation of Theme
Visual Representation of Theme in Materials
Program Poster
LAC – TD Summer Reading Club 2011 Summary Report of Program Statistics – NWT, Yukon & Nunavut
Libraries also rated their level of satisfaction with other program materials, such as various aspects of the website, promotional materials and the Staff Manual.
The level of satisfaction with the website (63%) slipped when compared to 2010 along with most other measures. Satisfaction with promotional materials was the highest of any area at 81%. Just less than two thirds (63%) were satisfied with the menus and navigation of the website, the kid’s website, the materials available on the website, and the content to the website. The libraries were least satisfied with the relevance of the content of the staff manual (54%).
Figure 6. Satisfaction with Support Material
18%23%
36%
27%23%
14%
27%23%
14%
18%23%
57%
18%23%
18%28%
45%55%
29%
45%68%
29%
36%
36%25%
14%
45%65%
0%
45%40%29%
36%50%
57%
36%23%
43%
18%10%
71%
36%28%
29%
36%53%
57%
36%13%
29%
36%38%
43%
45%23%
29%
0% 25% 50% 75% 100%
201120102009
201120102009
201120102009
201120102009
201120102009
201120102009
201120102009
Very satisfied Satisfied Neutral
Top 2 Box
63%78%57%
81%90%29%
63%73%57%
63%48%29%
63%88%57%
63%63%57%
54%78%71%
Base: All localities that submitted results (n=11). Data is weighted to reflect all localities that participated in the TDSRC program (n=11). Source: Q27F-Q27L. Rate your level of satisfaction with the program elements below.
Promotional Materials
Relevance of Content in Staff Manual
Kids' Website
Menus and Navigation on Website
Overall Satisfaction With Website
Content of Website
Materials Available on Website
LAC – TD Summer Reading Club 2011 Summary Report of Program Statistics – NWT, Yukon & Nunavut
Indicators of Success Libraries were asked to indicate whether they had any indicators of a child’s increased enjoyment of reading, reading successes or changes in attitudes toward reading. The indicators mentioned were:
• Getting involved/hooked/interested in reading/sharing books • Increased reading habits/number of books read • Activities/games/prizes/stickers • Children enjoyed it/were proud of their accomplishments
Testimonials Libraries were also asked whether they had any testimonials from parents, caregivers or teachers that might indicate an improvement in reading level. The responses are given below:
• Children like to read more • Children enjoy the program/theme • Improves reading skills/vocabulary of children
LAC – TD Summer Reading Club 2011 Summary Report of Program Statistics – NWT, Yukon & Nunavut
Future Themes Libraries were asked to provide suggestions for future program themes. The themes suggested were sports, animals/pets/bugs, sci-fi, history, science and a holiday theme.
TDSRC Data Collection Libraries were asked to provide suggestions on the TDSRC overall. The only suggestions were to not track/require stats on gender and to provide survey/forms/reports earlier.
TDSRC Overall Libraries were asked to provide suggestions on the TDSRC overall. There were no suggestions given by libraries in the Territories.