Teacher Imbalances and Segregation in India Sonja Fagernäs - Department of Economics, University of Sussex Panu Pelkonen - Department of Economics, University of Sussex, Centre for the Economics of Education (CEE) at LSE, IZA 5 September 2016 Abstract An important dimension of public service delivery concerns the spatial distribution of staff, but systematic studies on the allocation of teachers in a developing country context are scarce. With the use of an administrative database for India between 2006-2012, we document how the quality of teacher allocation across districts in the country is connected with workplace segregation of teachers by caste and gender. By using the legal school- specific pupil-teacher ratio norms introduced by the Right to Education Act (2009) as an external event, we show that the segregation of teachers, especially by caste, acts as a constraint for improvements in the needs-based allocation of teachers. Keywords: Teachers, Public service delivery, Gender segregation, Caste segregation, India, Right to Education Act. JEL Codes: H75, I24, J45, M54 Contact details: Sonja Fagernäs: [email protected], Panu Pelkonen: [email protected]Acknowledgments: We would like to thank the staff at NUEPA for providing us with the DISE database and for very helpful discussions; in particular Vimala Ramachandran, Arun Mehta, Naveen Bhatia and Pranati Panda. We would like to thank Suman Bhattacharyya at the ASER Centre for providing us with the ASER data. We are grateful to our colleagues at Sussex and seminar participants at ESOP, Oslo for useful comments. We acknowledge financial support from the British Academy. We are fully responsible for any remaining errors. 1
Transcript
Teacher Imbalances and Segregation in India
Sonja Fagernäs - Department of Economics, University of Sussex
Panu Pelkonen - Department of Economics, University of Sussex, Centre for the Economics
of Education (CEE) at LSE, IZA
5 September 2016
Abstract
An important dimension of public service delivery concerns the spatial distribution of staff,
but systematic studies on the allocation of teachers in a developing country context are
scarce. With the use of an administrative database for India between 2006-2012, we
document how the quality of teacher allocation across districts in the country is connected
with workplace segregation of teachers by caste and gender. By using the legal school-
specific pupil-teacher ratio norms introduced by the Right to Education Act (2009) as an
external event, we show that the segregation of teachers, especially by caste, acts as a
constraint for improvements in the needs-based allocation of teachers.
Keywords: Teachers, Public service delivery, Gender segregation, Caste segregation, India,
Right to Education Act. JEL Codes: H75, I24, J45, M54
Acknowledgments: We would like to thank the staff at NUEPA for providing us with the DISE database and for very helpful discussions; in particular Vimala Ramachandran, Arun Mehta, Naveen Bhatia and Pranati Panda. We would like to thank Suman Bhattacharyya at the ASER Centre for providing us with the ASER data. We are grateful to our colleagues at Sussex and seminar participants at ESOP, Oslo for useful comments. We acknowledge financial support from the British Academy. We are fully responsible for any remaining errors.
The persistence of low levels of learning, despite increases in enrollment and school
resources, has led to the need to understand more about the management of school systems
and the motivation of teachers in many developing countries (e.g. Pritchett et al., 2013).
Recent research, for instance by Bloom et al. (2015) shows that the quality of school
management is strongly connected with learning in multiple countries.
This study highlights an overlooked dimension of school management: the spatial
distribution of public sector teachers. We study this question in the Indian context. Teachers
are a key educational resource and well functioning school systems should be able to
distribute teachers in proportion to the students across areas and schools. Large deviations
from this aim could be considered evidence of inefficient management of personnel, which is
likely to influence the effectiveness of the delivery of education.
While the distribution of health workers has received some attention (see e.g.
Lemière et al., 2013 and Munga and Maestad, 2009), quantitative, large-scale studies on
imbalances in the distribution of teachers and their correlates are scarce in the context of
developing countries.1 Studies have highlighted inefficiencies driven by high teacher absence
rates (e.g. Chaudhury et al., 2006, Kremer et al., 2005, Muralidharan et al., 2014) and the role
of incentives in service delivery (e.g. Dal Bó et al., 2003, Muralidharan and Sundararaman,
2011, Ashraf et al., 2016). In developing countries, highly educated teachers and public sector
workers are often averse to remote areas (see e.g. Serneels et al., 2010, Fagernäs and
Pelkonen, 2012 and Lemière et al., 2013). However, more fundamental societal divisions,
1 See e.g. Zhang and Kanbur (2005) for a more general analysis on spatial inequalities in the provision of health and education in China. Jaramillo (2012) studies the determinants of the location of a teacher's first job in two regions of Peru.
2
relating to caste and gender roles, may also constrain the allocation of public servants at an
aggregate level for instance due to differing individual preferences.
Our study contributes to the gap in the literature by examining imbalances in the
distribution of Indian public sector teachers. We rely on a large register database of Indian
public sector primary schools, the District Information System for Education (DISE), that
covers the entire India. We use a panel data set for the 2006-2012 period. With these data, we
construct several indicators to study how equally public sector primary school teachers are
allocated within districts, including a novel indicator. In addition, we measure the degree of
segregation of teachers by gender and caste across districts. We then test the hypothesis that
the need, or desire of formal teachers to segregate can constrain the allocation of formal
teachers across schools within districts, and pose a constraint to rules on pupil-teacher ratios.
Regular Indian public primary school teachers are civil servants, who are hired and
employed by Indian states on permanent contracts. Pay is relatively inflexible, and the
location of employment can be considered an important non-pecuniary aspect of work. In this
context, the characteristics of individual teachers are likely to matter for the allocation of
teachers, through a combination of factors such as preferences, policy or bargaining power.2
The actual allocation and transfer of teachers usually takes place at a sub-state level.
Typically in larger states, transfers take place either within a district, or sometimes within a
block (see e.g. NUEPA, 2016).3 While there is some variation, a district is the most
appropriate unit to study the distribution of teachers.
The period of our study coincides with the implementation of The Right of Children
2 The role of politics in the postings and transfers has also been highlighted for instance by Béteille (2009) and Kingdon and Muzammil (2009). The DISE database does not include indicators on political connections of teachers. 3 A district is an administrative sub-unit of a state and a block an administrative sub-unit of a district.
3
to Free and Compulsory Education Act (RTE) of 2009, which came into force in April 2010.4
This is a major education initiative by the Indian government which sets a number of
requirements for the provision of schooling, including rules on pupil-teacher ratios in schools.
We begin by analyzing the allocation of teachers and whether the allocation has
responded to the RTE Act. In addition to pupil-teacher ratios and the RTE allocation rules, we
study the allocation of teachers using a more ‘objective’ self-constructed index to assess how
equally teachers are allocated with respect to pupil numbers at the level of districts. Our
analysis reveals fairly significant differences in how pupil-teacher ratios are distributed across
schools within districts. While pupil-teacher ratios have improved with the RTE, and the
allocation has moved towards meeting the RTE norms, more objectively measured
imbalances in teacher allocation have not improved.
We also find evidence of significant and varying segregation of formal teachers with
respect to caste and gender. To measure the segregation of formal public sector teachers, we
use adjusted dissimilarity indexes, which reflect the similarity of teachers within schools in a
district in terms of gender and caste. Segregation can derive from a number of factors such as
history, preferences and policy. However, it will at least partly reflect the preferences, or will
of specific teachers to work in a particular type of location, or in a particular type of
community.5 Segregation is found to correlate with female progressiveness, urbanization and
pupil segregation. It is also geographic to a degree, for instance with the presence of female
teachers declining sharply with the remoteness of a school.
Teacher segregation has received rather little attention in the literature, especially in
developing countries (see e.g. Frankenberg, 2009). We find that in the period since the
4 See e.g. http://righttoeducation.in/. Last accessed 16th August 2016.5 Earlier research has shown that location preferences of teachers can vary dramatically by gender or caste of teachers in India (Fagernäs and Pelkonen, 2012).
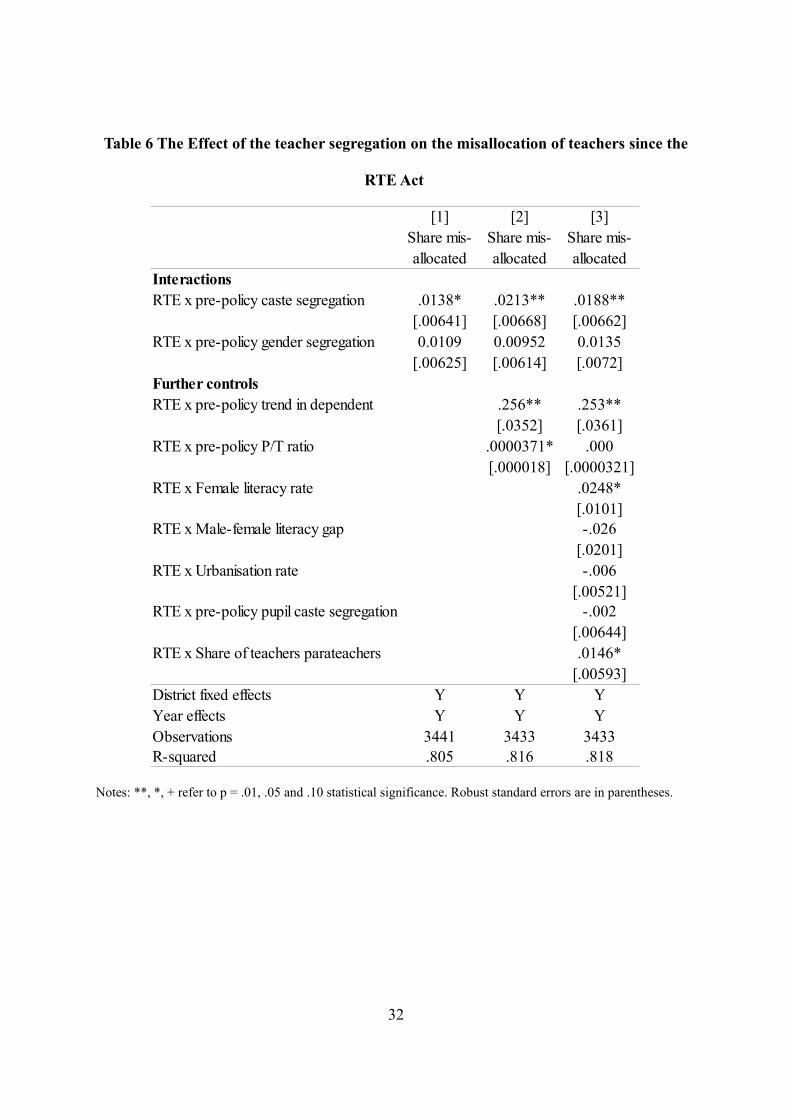
implementation of RTE, districts with a higher degree of pre-RTE segregation of teachers by
caste or gender are less likely to meet the RTE allocation rules on pupil-teacher ratios. Caste
segregation is also associated with a higher degree of misallocated teachers in the post-RTE
period, according to the more objective measures. At a more general level our results indicate
that the effectiveness of policies aiming to improve the allocation of teachers may be
hindered by high levels of segregation.
From a broader perspective, our findings on segregation can be connected with the
literature on the role that a gender or caste match between pupils and teachers has on learning
(see e.g. Dee, 2005, Dee, 2007, Rawal and Kingdon, 2010, Muralidharan and Sheth, 2015,
Karachiwalla, 2015). The geographic segregation of teachers is significant enough for urban
pupils to be much more likely to be taught by women, and remote rural pupils by men. While
the focus is on teachers, the study can also be connected with the literature on the role of
social fractionalization in the provision of public goods (see e.g. Banerjee et al., 2005).
We begin with a description of the data (Section 2), which is followed by a
description of the indicators used to measure the equality of teacher allocation across districts
(Section 3). Section 4 describes the geographic imbalances and Section 5 the segregation of
teachers in terms of gender and caste. Finally, we explore the association between the
equality of teacher allocation and teacher segregation (Section 6). Section 7 concludes and
discusses the broader implications of our findings for policy and related research.
2 Data
The data used in this study come from a register database of all Indian public-sector primary
schools, the District Information System for Education (DISE) by the National University of
5
Education and Planning (NUEPA). We utilize the data for the academic years of 2006/07 to
2012/13. This is an unbalanced panel database of schools and includes a separate file for
teachers in the schools. For teachers, the database includes information on the name, age,
caste, gender, date of birth, starting point of career as a teacher and indicators on educational
qualifications. The database also includes variables on school resources and management, but
it does not include reliable, or comparable data on learning. It covers all public sector schools
as well as teachers, and is thus a promising source for studying the composition and
distribution of teachers in the Indian primary education sector. A short discussion of the
quality of the database can be found in the Appendix. The data are collected in the latter half
of a calendar year, around September.
Our main sample covers all regular or para-teachers who teach lower primary school
students in all Indian states. These teachers teach grades 1 to 5, and in some states, grades 1
to 4.6 Regular teachers are civil servants, generally with permanent contracts. In addition to
regular teachers, many states hire temporary contract (para) teachers to staff schools that lack
teachers. Para-teachers tend to be local to the areas, less likely to have teacher training and
work on short-term contracts and lower pay (see e.g. Kingdon and Sipahimalani-Rao, 2010).
The use of para-teachers itself can be indicative of challenges in the equal allocation of
formal teachers. Our indicators on pupil-teacher ratios and the allocation of teachers include
both types of teachers. Summary statistics for the main variables of interest for our sample of
schools are shown in Table 1.
6 Teachers may be in schools that include classes above lower primary ones, but only teachers who report teaching “primary” or “mostly” lower primary grades are included in the sample. In schools that include both lower and upper primary levels, the following categories have been reported for the classes taught by the teachers: “Primary”, “Mostly primary” “Upper primary” or “Mostly upper primary”. In such schools, we include only pupils in grades 1-5 (1-4 in some states), and teachers who report that they teach “Primary” or “Mostly primary”, and exclude teachers who teach “Upper primary” or “Mostly upper primary”
6
TABLE 1
3 Measuring the equality of teacher allocation
Teachers are employed by states, that make the core decisions on hiring, but the allocation
and transfers of teachers generally take place at the sub-state level. The geographic unit for
the allocation and transfer of teachers can vary to some extent by state. It is often the district,
but in some cases, it may be sub-district level and in small states, state level. (See e.g.
NUEPA, 2016). We study the allocation at the level of districts, which is still arguably the
most natural level of focus. The district is often also the level at which the training of teachers
takes place in the so called DIETs (District Institute for Education and Training).
Transfers of primary school teachers can take place due to administrative reasons,
such as the rationalization of teacher-pupil ratios, upon the request of teachers, in the form of
mutually agreed transfers, or on disciplinary grounds, but many states lack clear transfer rules
(NUEPA, 2016, Ramachandran et al., 2005 and 2008, and Sharma and Ramachandran, 2009).
The recommended pupil-teacher ratio (PTR) under earlier government guidelines (Sarva
Shiksha Abhiyan) was set at 40:1. Since the Right to Education Act (or RTE), these norms
changed and a legal requirement was established. For smaller schools, the new norm is 30:1
pupils per teacher, and the minimum number of teachers in any school is two. However, for
larger schools, the required PTR is 40:1 (NUEPA, 2016, RTE Forum, 2015). The precise RTE
norms on the number of teachers per pupils can be found in the Appendix, Table A2. They
have been applicable from April 2010 onwards.
Our first indicator for the allocation of teachers is based on the RTE norms. These
7
requirements set clearly defined norms on pupil-teacher ratios for which administrators such
as the District Education Officers could be held accountable. We measure the compliance of
districts with these pupil-teacher ratio norms by computing the proportion of schools in a
district that have at least the required number of teachers, for a specific number of pupils.
The RTE norms do not minimize the variance of pupil-teacher ratios across schools,
as they do not uniformly require the pupil-teacher ratio to be at 30:1, and can lead to very low
pupil teacher ratios in the smallest schools, which are supposed to have two teachers.
A more objective manner of allocating teachers would be to aim to equalize PTRs
across schools.7 We construct an indicator to study the inequality of teacher allocation within
districts. It is labeled the 'Share of misallocated teachers'. It describes the share of teachers
that could be moved to minimize the variability of PTRs across schools. To our knowledge,
this measure has not been used in the education literature before.
We calculate the proportion of teachers that could be transferred within a district, so
as to minimize the variability in pupil-teacher ratios across schools within the district. The
deficiency (or surplus) of teachers in each school (s) in a given year (t) is defined as the
number of teachers the school would need to gain (or lose if negative), Δst, in order to have
the same pupil-teacher ratio as the district (d) on average:
(1) Pst
T st+Δst
=Pdt
T dt
⇒Δst=P stT dt
Pdt
−T st ,
where P refers to pupils and T to teachers. The sum of deficits across the schools equals the
7 If one assumes that lowering the pupil-teacher (P/T) ratio brings diminishing marginal benefits in terms of learning, the equality of P/T-ratios across schools also implies efficiency in the sense that it maximises total learning. In practice, a more important argument for the equality for P/T ratios across schools is the aim for equality in the quality of public service provision.
8
sum of surpluses across schools. As such, the potential within-district transfers, or the number
of misallocated teachers (Mdt) is the sum of the deficits
(2) M dt=∑nΔst∣Δst>0 ,
where the sum is taken over all n schools within district d in year t. This measure is further
divided by the total number of teachers in the district to give our measure of the rate, or
proportion of teachers that could be moved
(3) MRdt=M dt
T dt
.
This indicator is informative of how teachers are distributed in practice at the district
level. It is important to note that this is a measure of imbalance across schools, not of the
degree of teacher shortages as such. The assumption is that in a well functioning state, the
hiring and distribution of teachers should be needs based: the state should aim to maintain
similar pupil-teacher ratios across districts, and districts (or lower levels) aim to distribute
teachers across schools in similar proportion to enrollment, so that the pupil-teacher ratios
would be roughly equal across schools.8
Figure 1 shows the distribution of this measure for cross sections of districts in 2006
and 2012. For comparison, Figure 1 also shows the distribution of corresponding numbers
calculated for primary schools of 150 Local Education Authorities (LEA) in England for
8 In this study, we overlook the possibility that the desirable pupil-teacher ratio across schools may vary dueto issues such as special educational needs.
9
2015.
Since pupil-teachers ratios are never precisely similar across schools, districts will,
perhaps unfairly, always be labeled by this index as having a certain proportion of
misallocated teachers. We therefore carry out a simple simulation exercise with hypothetical
districts, where the distribution of pupil numbers across schools is drawn from a Poisson
distribution with the means varying between 100-200. We then apply a varying maximum
class size cut-off of 30 to 50 pupils per teacher in different simulations.9 For these 'perfectly
managed' cases, the share of 'misallocated' teachers would be between .03-.12, which is in the
same range as for England in Figure 1.
FIGURE 1
Figure 1 shows that the overall quality of teacher allocation in India has not changed
much from 2006 to 2012. We will return to this observation below. Table 2 summarizes the
average pupil-teacher ratios and our indicators for the equality of teacher allocation, the
proportion of schools that meet the requirements of the RTE Act on the numbers of teachers
per pupils and the share of misallocated teachers. Table 2 shows the averages for pre- and
post-RTE years, and show that there is a decline in the PTR from 38 to 31.5 pupils per
teacher, and an increase in the proportion of schools that satisfy the PTR norms of the RTE,
from 52 to 66 percent.
TABLE 2
9 If the number of pupils is below the cut-off, say 30, the school has one teacher. The next teacher is broughtin when the pupil numbers exceed the next threshold in multiples of 30, so that a school with 31 pupils will havetwo teachers.
10
Our indicators for teacher allocation include both regular and para-teachers. However,
the use of para-teachers can be a reactionary measure to difficulties of filling specific posts
with regular teachers. Therefore, the imbalances in the allocation of teachers would be
somewhat larger if para-teachers were to be excluded from the figures.
To our knowledge, no systematic descriptions of the quality of teacher allocation are
available for India or for most other major developing countries. Given that the DISE
database does not include reliable data on learning, we cannot credibly explore the
connection between imbalances and learning in detail. However, to provide some indication
of the association, we describe the correlation between our indicator for the share of
misallocated teachers and the levels of learning.
Figure 2 shows a scatter plot of districts in 2010 with the proportion of misallocated
teachers, and the share of rural government school pupils between the age of 9-11, who are
able to read a story.10 The data source for the learning outcomes is the ASER 2010 household
survey, which tests children at home.11 The ASER survey is restricted to rural areas, and
therefore the comparison with the misallocation measure is not entirely valid, since it is
computed for both rural and urban areas. An unequal distribution of teachers can also
potentially benefit many pupils, but overall, Figure 2 suggests a negative average correlation
(r = -0.20). While the correlation is not very strong, across Indian districts, a more unequal
allocation of teachers is associated with lower levels of learning on average.
FIGURE 2
10 Ages 9-11 correspond to the typical ages at the end of the primary school.
4 Teacher allocation and the Right to Education Act
Recent assessments of the RTE (for example RTE Forum, 2015) uniformly suggest that pupil-
teacher ratios have declined significantly. Less is known about the extent to which the
distribution of teachers has improved.
For an indication of developments over time, we estimate an OLS regression model,
where the four teacher allocation indicators summarized in Table 1 are explained with year
dummies and district fixed effects. The model takes the following form
(4) Outcomedt=λd+θt+edt t pre−RTE∈[2006,2009] , tRTE∈[2010,2012]
The results are shown in Table 3. In all of the models, the years are divided into pre- and
post-RTE years. The RTE came into force in April 2010. The first year in our database for
which the RTE norms of teachers per pupils are applicable is the year 2010, given that the
DISE data are recorded in late 2010. The year 2009 is the reference year and years 2006-2008
are treated as pre-RTE years.
TABLE 3
Column 1 of Table 3 shows that there is a declining trend in pupil-teacher ratios,
which is evident in both the pre- and post-RTE period. The dependent variable in column 2 is
the proportion of schools that have at least the number of teachers required by the national
RTE norms. Again, an improving trend is visible both before and after the RTE, which
12
logically follows from the increased number of teachers per pupil. The largest improvement
takes place between 2010 and 2011, suggesting that the states have started to react to the
norms. It is worth noting that satisfying the RTE norms will be more difficult for those states
that start with larger PTRs.12
Column 3 shows the development in the more ‘objective’ teacher allocation measure,
based on the variability of the school-specific PTRs around the district mean PTRs.
Significant improvements in this measure should be possible for most Indian districts even
without improvements in the PTRs. However, this indicator show no substantial improvement
from the pre-RTE years to 2012; a pattern that is already visually detectable in Figure 1.
There are a few potential reasons why the objective distribution of teachers may not
have improved, despite the sensible requirements of the RTE norms. Firstly, the RTE norms
do not aim for the minimization of the variability in the PTRs: large and small schools aim
for different PTRs (either 40 or 30), and very small schools are still always required to have
two teachers.13 Secondly, it is possible that some administrators aim to maximise the share of
complying schools by creating some schools with poor PTRs.
5 Teacher segregation and geographic imbalances of teachers by
characteristics
A study of the full array of reasons behind the misallocation of teachers is beyond the
scope of this article. In the Sections that follow, we focus on one aspect; the segregation of
teachers within schools by gender and schools. Section 5.1 provides some stylized facts on
12 Table A3 in the Appendix describes the indicators for teacher allocation by state for the panel of districts over 2006-2012.13 The precise teacher norms are in Appendix table A2.
13
the geographic distribution of teachers and Section 5.2 describes indexes of caste and gender
segregation of teachers and their correlates. In Section 6, we show that the ability of states to
meet the RTE norms and the equality of teacher allocation are constrained by such
segregation of teachers.
5.1 Geography and teacher characteristics
We focus on the spatial distribution of teachers with respect to two characteristics: gender and
caste.14 In the data there are two variables to capture the geographic remoteness of a school:
whether the school is in an urban area, and the school's distance to the block headquarters.15
As Table 1 shows, 6.8% of the schools in the sample are urban schools, and the average
distance to the block headquarters is 16 km.
Figure 3 shows the percentage of female teachers by the distance of the school from
the block headquarters. It is evident that the presence of women declines steadily with the
remoteness of the school. In addition to gender, there is also a geographic pattern in the caste
distribution of teachers. We simplify the analysis on caste by focusing on two broader
categories; general caste and lower caste (scheduled caste, scheduled tribe and other
backward class - SC/ST/OBC16) teachers. Lower caste teachers are more likely to be found in
remote locations than general caste teachers (Figure 4). This gradient by distance is nearly as
steep as that for gender; moving from 0 to 40 km from the block headquarters increases the
share of lower caste teachers by about 20 percentage points, and a similar change in Figure 3
14 A further dimension that could be explored is education, but the majority of formal teachers are graduates with teacher training, and the data do not suggest a strong degree of segregation with respect to education.15 While the DISE database has GIS codes for some schools, the coverage varies by state and is not yet veryreliable.16 Other backward class (OBC) also includes ‘other reserved groups’.
14
would increase the proportion of male teachers by about 30 percentage points.17 These facts
will be known to educational practitioners in India, but their precise scope is not well
documented. The preference of female teachers against remote rural areas in India has been
documented experimentally with teacher trainees by Fagernäs and Pelkonen (2012).
FIGURES 3 AND 4
Figures 3 and 4 together show that any segregation of teachers by gender and caste
within schools will be at least partly driven by geographic remoteness of schools. Next, we
turn to more formal measures of segregation.
5.2 Segregation measures and correlates
In order to calculate measures of teacher segregation, we construct district level indexes for
the segregation of teachers across schools by gender and caste, using the DISE teacher level
database, annually between 2006-2012.
To measure segregation, we calculate the commonly used Index of Dissimilarity
across schools. This index measures degree of similarity of teachers by gender and caste in
schools in a district. The higher the degree of similarity, the more segregated are the teachers
in the district. The properties of this index, and a number of alternatives in measuring school
segregation are discussed for example by Allen and Vignoles (2007). For gender segregation,
the index is calculated as
17 The graphs refer to formal teachers, but the distribution of para-teachers by gender and caste andremoteness is similar as for formal teachers.
15
(5) D=12∑s | f
F−
mM| ,
where s and d refer to school and district respectively, f and m refer to the number of female
and male teachers in a school respectively, and F and M refer to the number of female and
male teachers in a district respectively. The sum is computed over all schools in the district.
The index ranges between [0,1], where zero indicates that all schools have the same
proportion of female teachers, and one means that teachers are perfectly segregated by
schools.
Since the number of teachers in schools can be small, even a random allocation of
teachers by gender or caste will lead to a positive index of segregation. For example, if
female teachers account for 50% of teachers and are randomly allocated to two-teacher
schools, 50% of the schools will have teachers of both genders {F,M}, and another 50% will
be 'perfectly segregated' with combinations {M,M} or {F,F}, leading to an Index of
Dissimilarity of 0.5. We therefore adjust the index of dissimilarity as in Carrington and
Troske (1997), and compute an adjusted index of dissimilarity (Da) as follows
(6) Da = (D – Dr) / (1 – Dr) if D > Dr
= (D – Dr) / Dr if D < Dr ,
where D is the observed Index of Dissimilarity and Dr is the randomly occurring
dissimilarity. Dr is computed by Monte Carlo simulation taking into account the size
distribution of schools.18 The values for the adjusted index lie between the range of [-1,1], and
18 We take the number of teachers in schools as given. We then draw the gender of each teacher randomlyfrom a binomial distribution, where the likelihood of being female is the same as in the district as a whole in that
16
the positive figures indicate the share of the possible segregation that takes place over and
beyond the randomly occurring segregation. Negative values on the other hand suggest that
there is less segregation than expected.
Table 4 shows that in the case of gender segregation, the average simulated value for
the index of dissimilarity in the panel of districts is .502.19 The average value for the actual
dissimilarity index is .612. The value for the adjusted index of .223 suggests that 22.3% of
possible teacher gender segregation takes place in a typical Indian school district, but this
figure ranges from negative segregation (possible attempts to match men with women) to
high levels of gender segregation. Gender and caste segregation are not correlated in the
panel of districts. For example, for the pooled pre-RTE panel of 2006-2009, the correlation is
-0.05.
TABLE 4
To provide some potential explanations for the segregation of teachers, we estimate
simple district level OLS regressions with district level explanatory variables and state fixed
effects and state trends. Table A4 in the Appendix shows the results. The results show that a
lower level of female literacy, which also proxies for the level of development, is associated
with a higher degree of segregation by gender and caste. Caste segregation of teachers is
associated further with pupil caste segregation, while gender segregation is associated with a
higher rate of urbanization and larger use of para-teachers. In the last case, it is likely that
large use of para-teachers and gender segregation are both partly driven by presence of
year. We then compute the segregation index for the district-year cell. This is repeated 100 times and the averageindex over the randomisations is used as the final Dr.19 The value for the randomly occurring index can be above 0.5 when the proportion of women deviates from50%.
17
remote areas in the district that especially formal female teachers are averse of.
6 Does teacher segregation constrain the equality of teacher allocation?
In this Section we test the hypothesis that caste and gender segregation of teachers poses a
possible constraint for the allocation of teachers. Teachers are known to have strong
preferences with respect to location, and those preferences vary by gender and caste. Teachers
may influence their own initial postings and subsequent transfers in both legitimate or
illegitimate ways, depending on how the states and districts function in practice. The
preferences or constraints of teachers can therefore create a challenge to the administrators
attempting to fill schools with a sufficient numbers of teachers.
The Right to Education Act of 2009 (RTE) created requirements for states to comply
with specific teacher-pupil ratios. Therefore, the years 2010-2012 in our data set can be
considered ones in which more effort was made to rationalize the allocation of teachers,
mainly to satisfy the requirements of the RTE. In the estimations that follow, we utilize the
onset of the RTE, together with the degree of pre-RTE variation in the degree of gender and
caste segregation of teachers to identify whether the allocation of teachers is constrained by
teacher segregation. We rely on a district level panel data set, and the dependent variables of
interest are the district-level shares of schools that satisfy the minimum requirements of the
RTE norms on PTRs and the more objective measures of teacher allocation.
Figure 5 provides a simple graphical association between the levels of caste and
gender segregation and the quality of teacher allocation, as measured by the share of
misallocated teachers. The scatter plots use the last pre-RTE year, 2009. The correlation of
caste segregation with the misallocation is strongly positive, with a correlation coefficient of
18
0.32. The graph suggests that the uncondiational level of teacher misallocation is minimised
at a small positive level of segregation. For gender segregation however, the correlation with
misallocation is only -0.03, with no discernible pattern.
FIGURE 5
In the estimation framework, we allow the effect of the RTE policy to vary with
respect to the pre-policy levels of teacher segregation. Effectively we study whether districts
with a higher degree of segregation have a lower rate of improvement in the PTRs than those
with a lower degree of segregation, as the RTE is implemented trhoughout the country. We
(2005). Teacher Motivation in India. Educational Resource Unit, New Delhi.
Ramachandran, Vimala, Suman Bhattacharjea and K.M. Sheshagiri (2008). Primary School
Teachers. The Twists and Turns of Everyday Practice. Educational Resource Unit, New
Delhi.
Rawal, Shenila and Geeta Kingdon (2010). Akin to My Teacher: Does Caste, Religious or
Gender Distance Between Student and Teacher Matter? Some Evidence from India.
Department of Quantitative Social Science Working Paper 1018, Institute of Education,
University of London.
RTE Forum (2015). Status of Implementation of the Right of Children to Free and
26
Compulsory Education Act, 2009: Year Five (2014-15), March 2015.
Serneels Pieter, Jose Garcia-Montalvo, Gunilla Pettersson, Tomas Lievens, Jean Damascene
Butera, Aklilu Kidanu (2010). Who Wants to Work in a Rural Health Post? The Role of
Intrinsic Motivation, Rural Background and Faith-Based Institutions in Ethiopia and Rwanda.
Bulletin of the World Health Organisation, 88(5): 342–349.
Sharma, Rashmi and Vimala Ramachandran (2009). The Elementary Education System in
India. Routledge, New Delhi.
UNESCO (2006). The Impact of Women Teachers on Girls’ Education. Advocacy Brief.
UNESCO Bangkok, 2006.
Zhang, Xiaobo and Ravi Kanbur (2005). Spatial Inequality in Education and Health Care in
China. China Economic Review, 16(1): 189-204.
27
Table 1 Summary statistics on public sector primary schools, panel data for 2006-2012
Notes: Source DISE 2006-2012. SC/ST/OBC = Scheduled caste, Scheduled tribe, Other backward class (the last category also includes other reserved groups). A block is an administrative sub-unit of a district. HQ refers to Headquarters. Outliers have been removed (see appendix), as well as districts with less than 30 primary schools.
Table 2 Summary Statistics for District level data set, measures of teacher allocation
2006-2012
Notes: The measures of imbalances are computed using school level data for each district and year. The share of
misallocated teachers refers to equation 3. Sample has been restricted to districts which have not split during the
period.
28
Obs. Mean SD Min MaxNumber of teachers 5903148 2.87 1.83 1 239Number of formal teachers 5903148 2.35 1.88 0 239Number of parateachers 5903148 .446 .827 0 26Required RTE teacher norm satisfied 5903148 .466 .499 0 1Share of SC/ST/OBC caste teachers 5900916 .659 .377 0 1Share of female teachers 5903090 .375 .363 0 1Urban school 5903032 .068 .253 0 1Distance to Block HQ (km) 5872827 16.0 13.3 0 90Enrolment 5902981 104.3 95.3 0 819Share of pupils SC/ST/OBC caste 5755188 .770 .308 0 1
N = 3441 Pre-RTE (2006-09) Post-RTE (2010-12) Mean SD Min Max Mean SD Min MaxMeasures of teacher allocationPupil / Teacher ratio 38.0 14.8 4.3 99.6 31.5 14.2 2.9 133.9Share of schools that satisfy RTE norms .523 .248 0 1 .657 .237 0 1Share of misallocated teachers .216 .045 .073 .484 .212 .045 .093 .386
Table 3 Development of teacher allocation in a panel of districts over 2006-2012
Notes: The reference year is 2009. All models include district fixed effects. ‘RTE’ refers to years when the Right
to Education act is in force. **, *, + refer to p = .01, .05 and .10 statistical significance. Robust standard errors
are in parentheses.
29
[1] [2] [3] P/T % Satisfy
ratio RTE norms allocatedYear 2006 6.57** .00568**
Table A1 Sample selection due to data cleaning, teacher level data 2006-2012
Notes: The 'Raw data' is restricted to formal lower primary schools and teachers who report that they teach in
such schools.
Table A2 Pupil-teacher ratio norms under the Right to Education Act.
Notes: Source: RTE Forum (2015)
38
Raw data Outliers Final sampleObservations 7198460 71808 5903148Year 2009.1 2009.4 2009.0Share women .376 .472 .375Share SC/ST/OBC .66 .72 .66Urban school .072 .166 .068
Admitted children Number of required teachersUp to 60 261-90 391-120 4121-200 5Above 200 One per forty children
Table A3 Descriptive statistics of teacher allocation by state, district averages, 2006-
2012.
Notes: All figures are means of district-level values over 2006-2012. MR refers to the share of misallocated teachers. All numbers include both formal and parateachers. ‘RTE Norms’ refers to the share of schools that satisfy the minimum number of teachers as required by RTE norms. The sample has been restricted to districts that have not split over 2006-2012.