56
Final Team: Jeffrey C. Lucher Robert Jenkins Binh Duong Krzysztof Koson Fin 684 Fall 2007 1
Final
Team: Jeffrey C. Lucher
Robert Jenkins Binh Duong
Krzysztof Koson
Fin 684 Fall 2007
1

Table of Contents
Company Mission Statement: “The Guiding Principles” ............................................. 4 Business Description & History:...................................................................................... 6 Industry Analysis: ........................................................................................................... 16
Competition: ................................................................................................................ 19 SWOT analysis .............................................................................................................. 20 Poter’s 5 forces:........................................................................................................... 22
Fundamental analysis:.................................................................................................... 23 Short-Term Liquidity Ratios......................................................................................... 23 Asset Utilization Ratios ................................................................................................ 26 Return on Investment (ROI) Analysis .......................................................................... 28
Valuation: ........................................................................................................................ 30 Technical Analysis: ......................................................................................................... 33 Investment risks: ............................................................................................................. 51 CONCLUSIONS: ............................................................................................................ 54 RECOMMENDATIONS: .............................................................................................. 54 Appendix A ...................................................................................................................... 56
2

Executive Summary:
ExxonMobil, the largest publicly traded integrated petroleum and natural gas company in
the world, was selected to be a part of Finance 684’s portfolio. Our recommendation was
based mostly on its growth potential, valuation analysis as well as its number one
position in the marketplace. The team believes ExxonMobil company is well positioned
financially and most able to take advantage of the of the fluctuating petroleum industry.
Though the company’s stock is now valued at $90.92, close to its 52 week high,
purchasing additional shares would not add any significant risk to the Graduate fund’s
portfolio.
In order to persuade the investment committee we have decided to conduct an analysis of
ExxonMobil’s business operations, financial statements and business environment as a
whole. We believe ExxonMobil still has growth potential believe additional shares should
be purchased for the following reasons:
• Increased corporate activity in the world’s market
• Increased investments in new gas and oil plants
• Increased demand for gas and oil
• Good overall financial results & standing
3

Company Mission Statement: “The Guiding Principles”
ExxonMobil Corporation is committed to being the world's premier petroleum and
petrochemical company. To that end, we must continuously achieve superior financial
and operating results while adhering to the highest standards of business conduct. These
unwavering expectations provide the foundation for our commitments to those with
whom we interact:
Shareholders
We are committed to enhancing the long-term value of the investment dollars entrusted to
us by our shareholders. By running the business profitably and responsibly we expect our
shareholders to be rewarded with superior returns. This commitment drives the
management of our company.
Customers
Success depends on our ability to consistently satisfy ever-changing customer
preferences. We pledge to be innovative and responsive, while offering high quality
products and services at competitive prices.
Employees
The exceptional quality of our workforce is a valuable competitive edge. To build on this
advantage we will strive to hire and retain the most qualified people available and
maximize their opportunities for success through training and development. We are
committed to maintaining a safe work environment enriched by diversity and
characterized by open communication, trust, and fair treatment.
4

Communities
We pledge to be a good corporate citizen in all the places we operate worldwide. We will
maintain the highest ethical standards, obey all applicable laws and regulations, and
respect local and national cultures. Above all other objectives, we are dedicated to
running safe and environmentally responsible operations.
To be successful, ExxonMobil must be at the leading edge of competition in every aspect
of our business. This requires that the Corporation's substantial resources - financial,
operational, technological, and human - be employed wisely and evaluated regularly.
While we maintain flexibility to adapt to changing conditions, the nature of our business
requires a focused, long-term approach. We will consistently strive to improve efficiency
and productivity through learning, sharing and implementing best practices. We will be
disciplined and selective in evaluating the range of capital investment opportunities
available to us. We will seek to develop proprietary technologies that provide a
competitive edge.
We will achieve our goals by flawlessly executing our business plans and by strictly
adhering to these guiding principles along with our more comprehensive Standards of
Business Conduct.
5

Business Description & History:
Since its formation, ExxonMobil has evolved from a domestic refiner and distributor of
kerosene to a large multinational corporation, involved at every level of oil and gas
exploration, production, refining and marketing, and petrochemicals manufacturing.
ExxonMobil is the world’s largest publicly traded international oil and gas company,
holding an industry-leading inventory of global oil and gas resources. They are also the
world’s largest refiner and marketer of petroleum products. ExxonMobil markets 11.2
billion cubic feet per day of natural gas in 28 countries to a wide variety of customers,
including power companies, industrial users, and distributors and is is the world’s No. 1
supplier of lube basestocks and a leader in marketing finished lubricants and specialty
products. Additionally, ExxonMobil manages over one million barrels per day of natural
gas liquids and significant production of power and helium. The company has nearly
34,000 retail service stations, and provides services through its three business-to-business
segments — Industrial and Wholesale, Aviation, and Marine — to over one million
customers worldwide. Long-term planning is critical to its success which is why each
year ExxonMobil prepares a detailed long-term energy supply and demand outlook. This
assessment is used by ExxonMobil as part of its business planning. The report, which
extends to 2030, incorporates data and input from a variety of respected sources,
including the International Energy Agency and the U.S. Department of Energy.
6

Timeline:
1859 Colonel Edwin Drake and Uncle Billy Smith drill the first successful oil well in Titusville,
Pennsylvania. John D. Rockefeller The name Standard is chosen to signify high, uniform quality.
1870 Rockefeller and his associates form the Standard Oil Company (Ohio), with combined facilities
constituting the largest refining capacity of any single firm in the world.
Vacuum Oil building Matthew Ewing and Hiram Bond Everest founded Vacuum Oil Company
in 1866 upon patenting a new method of distilling kerosene in a vacuum that produced a high-
quality lubricant.
1879 Standard Oil Co. purchases a three-quarters interest in Vacuum Oil Company for $200,000. As a
lubricants pioneer, Vacuum Oil introduces a number of popular products, including the
revolutionary Gargoyle 600-W Steam Cylinder Oil.
Standard Oil logo
1882 Standard Oil lubricates Thomas Edison's first central generating system. Also in this year,
Standard Oil Trust forms to include the Standard Oil Company of New Jersey (Jersey Standard)
and the Standard Oil Company of New York (Socony).
Standard Oil building
1885 The Standard Oil Trust moves its headquarters to 26 Broadway, New York City. The nine-story
office building becomes a landmark.The same year, Vacuum develops Gargoyle Arctic engine
oils for newly designed generators and motors that operate at speeds of up to 1,000 rpm.
1906 Socony gains a strong foothold in the vast market for kerosene in China by developing small
lamps that burned kerosene efficiently. The lamps become known as Mei-Foo, from the Chinese
symbols for Socony, meaning "beautiful confidence."
1911 Following a landmark U.S. Supreme Court decision, Standard Oil breaks up into 34 unrelated
7

companies, including Jersey Standard, Socony and Vacuum Oil.
The year also marks the first time Jersey Standard's sales of kerosene are surpassed by gasoline, a
product that in the early days had often been discarded as a nuisance.
Ralph De Palma winning the Indianapolis 500
1919 Jersey Standard acquires a 50 percent interest in Humble Oil & Refining Company of Texas. It
was during this year that Humble, led by its pioneering Chief Geologist Wallace Pratt, employed
micropaleontology, the study of microscopic fossils contained in cuttings and core samples from
drilling, as an aid in finding oil.
1920 Jersey Standard researchers produce rubbing alcohol, or isopropyl alcohol — the first
commercial petrochemical.
1926 Embodying the phonetic rendition of the initials ‘S’ and ‘O’ in Standard Oil, Jersey Standard
brings out a new blend of fuel under the trade name Esso.
Oil field This field is the first in the U.S. to be discovered by using the technique of seismic
surveying, and the first fairly deep salt dome to be discovered by the use of geophysical
instruments.
1927 Humble geophysicists use a refraction seismograph and discover an oil field in Sugarland, Texas.
1936 First commercial unit in a cat-cracking refinery begins operation at Socony-Vacuum’s Paulsboro,
New Jersey, refinery. The unit used a process developed by French scientist Eugene P. Houdry
with the financial backing of Socony-Vacuum. The process added a clay-like catalyst to the
cracking process to boost gasoline yields and octane rating.
Woman producing butyl
1937 Jersey Standard researchers produce an artificial rubber, butyl. Today, butyl is used in the
creation of tires, surgical tapes, protective coatings and more.
Chemist
8

1938 The world's first commercial production of alkylate begins at a Humble plant in Baytown, Texas.
Alkylation made possible the manufacturing of iso-octane, used as a blending agent to produce
100-octane aviation gasoline.
The “Four Horsemen” demonstrating their fluid catalytic cracking process.
1942 The world’s first fluid catalytic cracker goes onstream at Louisiana Standard’s Baton Rouge
refinery. The process, developed by four Jersey Standard researchers known as the “four
horsemen,” improved on the Houdry method for cat cracking and eventually became the industry
standard for producing gasoline. Fortune magazine called it “the most revolutionary chemical-
engineering achievement of the last 50 years.”
Uniflo motor oil can
1952 Jersey Standard introduces Uniflo motor oil, the first multigrade motor oil recommended for both
summer and winter use.
Esso Education Foundation booklet
1955 Jersey Standard establishes the Esso Education Foundation, a program that gives financial aid to
private colleges and universities.
1959 An advertising copywriter in Chicago comes up with the advertising slogan “Put a tiger in your
tank.”
1963 Humble invents 3-D seismic technology, a revolution that completely changes the way the
industry searches for oil and gas resources.
Cover of 'A Brief History of Mobil' brochure
1966 Mobil celebrates 100 years since the founding of the Vacuum Oil Company in 1866 and changes
its name to Mobil Oil Corporation. The company launches a wide-reaching identity program to
emphasize the Mobil trade name.
1972 Jersey Standard officially changes its name to Exxon Corporation. The name change is approved
by Jersey Standard shareholders in a special shareholders’ meeting.
Mobil 1 Oil Can
9

1974 Mobil introduces a synthetic automotive engine lubricant — Mobil 1. Today, Mobil 1 is the
world’s leading synthetic motor oil.
Beryl Alpha, world's first concrete production platform.
1976 Mobil invents a process for converting methanol into high-octane gasoline through the use of the
company’s versatile ZSM-5 catalyst.
1986 Exxon Research and Engineering invents a powerful new imaging technique called 3-D
microtomography to study the internal structure of opaque objects without damaging them.
1989 On March 24, 1989 the tanker Exxon Valdez runs aground in Prince William Sound in Alaska.
Exxon introduces Exxpol, a single-site metallocene catalyst used to produce consistent,
controllable molecular structures that make plastic and rubber products tougher and impact-
resistant, with less haze and with excellent organoleptics (low off-taste and odor).
Bengal tigers
1999 On November 30, 1999, Exxon and Mobil join to form ExxonMobil Corporation. "This merger
will enhance its ability to be an effective global competitor in a volatile world economy and in an
industry that is more and more competitive," said Lee Raymond and Lou Noto, chairmen and
chief executive officers of Exxon and Mobil, respectively.
SCANfining pellets
2001 ExxonMobil Research & Engineering Company (EMRE) develops the SCANfining process,
which uses a new proprietary catalyst to selectively remove more than 95 percent of the sulfur
from gasoline while minimizing octane loss.
2002 ExxonMobil, joined by other sponsors, initiates the Global Climate and Energy Project (GCEP)
at Stanford University — a pioneering research effort to identify technologies that can meet
energy demand with dramatically lower greenhouse gas emissions.
2005 Qatar 2005 ExxonMobil and Qatar Petroleum, with other joint-venture partners, expand
development of the giant North Field offshore Qatar, the largest nonassociated gas field in the
10

world.
2007 Exxon Neftegas Limited (a subsidiary of ExxonMobil Corporation) completes the drilling of the
Z-11 well, the longest measured depth extended-reach drilling (ERD) well in the world.
11

Executive, Directors & Insider Interests:
Officers
R.W. Tillerson Chairman of the Board*
D.D. Humphreys Senior Vice President and Treasurer*
S.R. McGill Senior Vice President*
J.S. Simon Senior Vice President*
L.J. Cavanaugh Vice President – Human Resources
A.T. Cejka Vice President*
K.P. Cohen Vice President – Public Affairs
H.R. Cramer Vice President*
M.J. Dolan Vice President*
M.E. Foster Vice President*
H.H. Hubble Vice President – Investor Relations and Secretary*
G.L. Kohlenberger Vice President*
C.W. Matthews Vice President and General Counsel*
P.T. Mulva Vice President and Controller*
R.D. Nelson Vice President – Washington Office
S.D. Pryor Vice President*
J.M. Spellings General Manager – Corporate Planning
S.K. Stuewer Vice President – Safety, Health and Environment
P.E. Sullivan Vice President and General Tax Counsel*
A.P. Swiger Vice President*
12

Functional and Service Organizations:
Upstream
A.T. Cejka President, ExxonMobil Exploration Company*
M.W. Albers President, ExxonMobil Development Company*
M.E. Foster President, ExxonMobil Production Company*
A.P. Swiger President, ExxonMobil Gas & Power Marketing Company*
S.M. Cassiani. President, ExxonMobil Upstream Research Company
Downstream
S.D. Pryor President, ExxonMobil Refining & Supply Company*
H.R. Cramer President, ExxonMobi Fuels Marketing Company*
G.L. Kohlenberger President, ExxonMobil Lubricants & Petroleum Specialties
R.V. Pisarczyk. President, ExxonMobil Research and Engineering Company
Chemical
M.J. Dolan President, ExxonMobil Chemical Company*
Other
T.J. Hearn Chairman of the Board, Imperial Oil Limited
T.R. Walters President, ExxonMobil Global Services Company
13

Insider Ownership
Owner Title Shares
SANDERS DANIEL S Vice President 5,077,185
MATTHEWS CHARLES W Vice President & Gen. Counsel 5,037,999
LIPPINCOTT PHILIP Director 4,981,438
HOWELL WILLIAM R Director 4,685,694
GEORGE WILLIAM W Director 4,251,320
SHIPLEY WALTER V Director 4,116,387
BOSKIN MICHAEL J Director 4,094,206
SULLIVAN PAUL E Vice Pres. & Gen. Tax Counsel 3,557,246
KOHLENBERGER
GERALD L Vice President 2,949,677
NELSON MARILYN C Director 2,640,902
HUMPHREYS DONALD D Sr. Vice President & Treasurer 2,327,413
GALANTE EDWARD G Senior Vice President 2,058,656
PRYOR STEPHEN D Vice President 1,735,001
LASALA STEPHEN R Vice Pres and Gen Tax Counsel 1,683,153
SIMON J STEPHEN Senior Vice President 1,361,347
SWIGER ANDREW P Vice President 1,310,793
KING REATHA C Director 1,085,196
FITES DONALD V Director 1,038,431
KAPLAN HELENE L Director 741,948
14

CRAMER HAROLD R Vice President 654,334
DOLAN MICHAEL JAMES Vice President 627,809
CEJKA A TIMOTHY Vice President 600,730
MCKINNELL HENRY A Director 590,379
HOUGHTON JAMES R Director 462,100
MCGILL STUART R Senior Vice President 295,744
MULVA PATRICK T Vice President and Controller 295,744
PALMISANO SAMUEL J Director 200,736
TILLERSON REX W Chairman and President 166,356
REINEMUND STEVEN Director 108,594
DUFFIN NEIL W Executive Officer 53,696
HUBBLE HENRY H Vice President and Secretary 52,495
RAYMOND LEE R Chairman 30,036
FOSTER MORRIS E Vice President 22,828
LONGWELL HARRY J Executive Vice President 10,166
ALBERS MARK W Senior Vice President 1,386
15

Industry Analysis:
The Petroleum (Integrated) Industry
The petroleum industry demand growth is a function of population growth and world
industrialization and development. Current daily world usage consists of basis 85-86
million barrels a day. Assuming the growth rate matches the world population growth
rate of 1% a year, we would be at 95 million barrels within a decade. Economic
development of the Asian pacific nations is increasing the need for petroleum based
products at an even faster pace. With no new major oil fields being discovered we have to
assume oil supplies will remain as a constant number; meaning that as we deplete current
oil supply, the oil finds we are discovering & exploiting world wide will not create excess
reserves. Development of oil fields in Russia, Canada, Artic and deep sea drilling are
currently the best outlook for the industry. Instead what we find replaces what is
currently being used at a slower slowing pace. So if we keep supply as a constant and
increase demand we have the basis for a very good outlook for the industry for years to
come.
Technology improvements will stretch current supply further and further every day. As
cars and heating systems become more efficient less oil is needed to produce the same
result. However such advancement does not come quickly and almost always comes
when the need is already ever present. The United States currently has enacted gas
mileage goals for the nation (35 miles per gallon) that do not have to be met until 2012.
As the automobile has been used for 100 years this is a shining example of the slow
movement of progress in this area,
16

Technology also aids our company’s ability to find and exploit new oil in the world.
Areas like the Artic circle are high potential regions that were currently undeveloped due
to harsh weather conditions. New drilling and heating technologies will make it possible
to explore these regions for a more exacting and detailed look at what it represents to the
industry. Additionally once unreachable deposits deep in the ocean, underneath miles of
sea bed are now able to be reached with the modern oil rigs.
Canadian development also provides a great prospect for future development. Currently
producing just one million barrels a day from the oil sand fields, the setting up of a better
filtration and refining process that takes the thick, tar like oil found there, can potentially
produce additional expansion. Adding in the fact it is a friendly neighbor nation, makes
Canada one of our best prospects for a safe and stable source of oil years to come.
The petroleum refinery infrastructure has not been expanded in decades. This creates
what we call a funnel effect for the industry. Regardless of how much oil is actually
being produced world wide, the capacity to turn that oil into usable products for the
general public and marketplace has stayed the same. Refiners enjoy large margins during
hurricane season when storms threaten to and indeed do shut down capacity. When the
ability to produce usable products is reduced, prices for oil & gas products spike. We
import over 1 million barrels a day because we can not refine enough oil to meet our own
domestic demand. Efforts to boost refining production do not currently include the one
solution that guarantees sustained increases in output; the building of new oil refining
platforms. The reason? It is not just the billions in estimated cost to build just one
17

platform. When looking at the profits currently being generated by the industry, such
complaints seem more of a cover for controling the current market conditions within the
industry. With an estimated dollar per barrel margin for refiners approaching 16 dollars,
there is less and less incentive to expand refining capacity and decrease earnings, when it
is more profitable to keep the status quo in this one aspect of the market.
OPEC’s recent increase of production quotas had no affect on the price per barrel of oil
and gas. OPEC member nations have a national mandate to develop their petroleum
reserves in such a way that benefits their community, not the world. This often has the
result of pumping less to control the price at inflationary levels. The president of OPEC
recently stated repeated statements by industrialized countries to reduce dependence on
oil could lead to a reduction in supplies from the cartel. He said at an energy conference
‘‘Policy announcements could translate into scarcity of supplies in the future’’. This
illustrates oil can not be depended on to come from this region at a steady pace. Also, the
age of the working oil fields in the middle east shows that they peaked sometime in the
mid 1990’s and only Saudi Arabia and Kuwait have moved to expand their search for
new supply.
Our conclusion is that the rising price of oil is justifiable on the basis of supply and
demand. Rising petroleum demand and limitations of supply additions as the current
supply is depleted will support ever increasing long term pricing. Adding in the lack of
certainty of the supply coming from OPEC, and the ever increasing risks involved with
not expanding our refinery capacity spells out a very profitable future for the Petroleum
18

industry. In September 2007, Alan Greenspan stated that a per barrel price of 100 dollars
is foreseeable within the next few years at our current pace. A five year investment plan
should yield very high returns for the patient investor not scared by the choppy short term
seasonal movement of oil prices.
Competition:
Data as of 10/25/07 Price Market Cap ($Mil)
ExxonMobil Corp. (XOM) 92.09 512311.2
List of Main Competitors
Company Name Price Market Cap ($Mil)
BP PLC ADR (BP) 71.05 231036.8
Chevron Corp. (CVX) 94.17 200743
ConocoPhillips (COP) 88.41 143859.4
Frontier Oil (FTO) 45 4841.64
Hess Corp. (HES) 66.4 21114.6
Holly Corp. (HOC) 65.28 3588.637
Marathon Oil Corp. (MRO) 58.34 39745.58
Murphy Oil Corp. (MUR) 68.8 12969.01
Occidental Petroleum (OXY) 63.88 53067.93
Petroleo Brasileiro ADR (PBR) 70.63 154928.2
Repsol-YPF ADR (REP) 35.88 43804.56
19

Royal Dutch Shell 'A' (RDS/A) 84.2 270235.3
Sunoco, Inc. (SUN) 74.87 9011.353
Tesoro Corp. (TSO) 48.9 6691.085
Total ADR (TOT) 82.03 185762.4
Valero Energy (VLO) 70.09 38781.64
SWOT analysis
Strength:
• ExxonMobil has a strong resource base, with ownership in electrical power
generation facilities. ExxonMobil is the world’s largest traded energy company.
It dominates the industry with a market capitlization of US$512.31 billion, more
than double the second largest player in the field – British Petroleum. This
position makes it easy for ExxonMobil to be the first choice of consumers.
• Involved in all phases of petroleum development; from exploration and
production of oil and gas to the manufacturing and sale of refined products,
chemicals, petroleum specialties such as waxes, process oils, and asphalt.
• Has divisions and affiliate companies all over the world. ExxonMobil operates
and sells its products in the United States and approximately 200 other countries.
• The company has a highly centralized decision making process, made at the very
top.
Weakness:
• With extensive international operations, ExxonMobil’s subject to the geopolitical
risks of unstable regions of the world.
20

• Its inflexibility costs its failure in bargaining with oil-rich countries such as
Kazakhstan.
• A highly centralized decision process may impede advancement in some areas.
Opportunities:
• The industry has low spare production and refining capacity, providing
ExxonMobil a lot of growth opportunities.
• No significant replacement for oil.
• Growing of Asian countries gives ExxonMobil a profitable market. To expand
into.
Threats:
• Must find replacement for the 1.3 billion barrels of oil equivalents, including
crude oil and natural gas that it draws from its well each year as these wells are
drying out.
• Sector-leading profitability could be eroded if it is charged at high-tax products
initiatives.
• Slowdown down or contraction of the world economy could lessen the demand
for oil products.
• Congressional legislation could mandate price caps on refined petroleum products
in the future.
21

Poter’s 5 forces:
• Rivals: ExxonMobil faces intense rivalry. Though it has the largest market
cap, its existing rivals, such BP and Chevron, can create problems for Exxon
as it attempts to expand its market share. The lack of differentiation creates
additional pressure for Exxon. The growing market and the potential for high
profits attracts new firms into the market which causes a short term increase in
perceived supply. But since there is no currently viable replacement for
petroleum products this is not a concern.
• Buyer Power: The power of Exxon’s client (the consumer) is weak. There is
no viable alternative that they can easily switch to. Also, as the world grows,
the need for energy production increases, so the demand for petroleum based
products outpaces supply.
• Supplier Power: The power of Exxon’s Partner Suppliers is high. There are a
limited number of countries that have oil, and political relations can create
artificial constraints to doing business with US companies.
• Threat of Entry: Even though the profitability of the market seems to be
attractive for new companies, there are barriers that make the attempt very
difficult. First, the starting cost of creating oil development platforms and
refineries is very high. Second, the industry requires lobbying of governments
to reduce the risk of creating excessive regulations. And the last is what we
call “Economies of Scale”. This gives ExxonMobil a great advantage over
new and existing companies.
22

Fundamental analysis:
Block #1: Short-Term Liquidity Ratios
No. Measure Q2-2007
Q1-2007 2006 2005 2004
Chevron 2006
Conoco 2006
1 Current ratio 1.555 1.543 1.552 1.584 1.405 1.278 0.948 2 Acid-test ratio 1.230 1.229 1.266 1.312 1.128 1.023 0.565
3 Accounts receivable turnover 12.954 13.586 11.792 10.588
14.1
4 Inventory turnover 18.223 19.696 15.097 29.202 26.788 5 Days' sales in receivables 28.177 26.866 30.953 34.47 25.886 6 Days' sales in inventories 16.827 15.753 20.712 12.50 13.626
10 Working capital (in millions) 28,804 27,475 26,960 27,035 17,396 7,895
-1,365
11 Days' purchases in accounts payable 75.183 66.886 78.922 46.64
41.29
12 Average net trade cycle -27.0 -21.5 -23.8 0.33 -1.778
13
Cash provided by operations to average current liabilities (%) 103.63 107.83 99.67 91.06
90.044
- Current ratio of ExxonMobil has been very steady, it stayed at a high rate of 1.5
for the past two year and will probably keep the record for this year. This ratio is
higher than 1.3 of Chevron. To take a deeper look at the short-term liquidity of
the company we will examine its acid-test ratio, all ratios are higher than 1.1
meaning that the company have more cash or cash equivalent to pay off its current
liabilities while Chevron is struggling at 1 and Conoco is lower than 1. In other
words, ExxonMobil is very liquidity.
- The reason for this plenty of cash of the company is not “Window Dress”, but it
rather came from its surplus cash flow from operating activities. The big inflow of
cash from its operation had not only offset its negative cash flow from investing
but also from financing by buying back billion dollars worth of treasury stocks.
23

- The cash flows provided by operations to current liabilities have been at record
high of 100% or higher against the 40% benchmark. And this ratio of Exxon is
also much higher than 91% of its biggest competitor Chevron and 90% of
Conoco.
- The short-term financial situation of Exxon is very healthy since its tax payable
which consider more dangerous current liabilities only accounts around 4% of
total assets while cash and cash equivalents took around 13% of the total assets.
- Its negative net trade cycle of more than 20 days means that the company has the
advantage of buying materials needed for its operation in account from suppliers.
This adds up to the company short-term liquidity which is already very positive.
Its competitor Chevron does not have such advantage, its operating cycle merely
met days in account payable. Conoco even worse, its operating cycle merely did
not meet days in account payable, so it needed financing .
Block #2: Capital structure and long-term solvency Ratios
No. Measure Q2-2007
Q1-2007 2006 2005 2004
Chevron 2006
Conoco 2006
1 Total debt to equity 0.962 0.957 0.924 0.874 0.919 0.924 0.979 2 Total debt ratio 0.490 0.489 0.480 0.466 0.479 0.480 0.49
3 Long-term debt to Total Assets 0.03 0.03 0.03 0.03 0.026 0.056
0.14
4 Earnings to fixed charges 166.76 138.37 93.38 105.53 57.87 62.47 32.21 5 Cash flow to fixed charges 347.58 205.56 119.02 145.03 89.50 87.83 32.554
6 Financial Leverage Index (FLI) 1.915 1.878 1.833 1.840 1.845 1.93
1.92
7 Financial Leverage Ratio 1.96 1.94 1.899 1.895 1.928 1.96 2.01 Note: Effective income tax rate for ExxonMobil for 2006, 2005, and 2004 is 43%, 41% and 40% respectively. For quarter 1 and 2 of 2007, tax rate is 44%; for Chevron, it is 46% in 2006; for Conoco, it is 45% in 2006
24

- Exxon’s earnings to fixed charges and cash flow to fixed charge ratios are
surprisingly high and much higher than Chevron’s and three times that of Conoco.
In long-term, they can pay their liabilities very easily because they earn a lot from
its operation comparing to its fixed charges.
- The Financial Leverage Index of Exxon had remain almost the same for the last
three year, it stayed at slightly over 1.8. It means that after tax, the total return on
assets of Exxon is almost double its cost of debt. So we can say that the firm is
effectively using its debt.
- Exxon’s Equity is more than its Debt.
- Standard & Poor Crediting Rate had given ExxonMobil AAA which meant that
Exxon does not have any loan default. This rate is the highest that is assigned to
any companies. Therefore, Exxon has low risk in crediting.
Altman Z score: ExxonMobil’s Z-score in 2006 Z-score
= 1.2 x Working capital/ Total assets = 1.2 x 0.123
+ 1.4 x Retained earnings/ Total assets + 1.4 x 0.89
+ 3.3 x EBIT/ Total assets + 3.3 x 0.308
+ 0.6 x Market value of equity/ Book value of debt+ 0.6 x 1.082
+ 1.0 x Sales/ Total assets + 1.0 x 1.669
= 4.7
25

This estimate of bankruptcy for publicly-held companies depends on the resulting score
of Altman's Z-Score formula, which the score is divided into four categories:
Less than 1.8: Bankruptcy risk is high
Between 1.8 and 2.7: Bankruptcy risk is fair
Between 2.7 and 3.0: Bankruptcy risk is possible, but not likely in
the near-future
Higher than 3.0: Bankruptcy risk is low
With a Z score of 4.774 for the year ending 2006 we can clearly see that ExxonMobil’s
financial health is secure for many years to come.
Block #3: Asset Utilization Ratios
No. Measure Q2-2007
Q1-2007 2006 2005 2004
Chevron 2006
Conoco 2006
1 Sales to receivables 3.28 2.98 12.95 13.59 11.73 10.59 13.36 2 Sales to inventories 7.46 7.22 36.48 38.17 31.58 46.69 41.38 3 Sales to working capital 3.30 3.06 13.56 13.28 16.74 23.80 N/A 4 Sales to fixed assets 0.83 0.74 3.31 3.33 2.73 3.09 2.61 5 Sales to other assets 3.04 2.78 12.70 13.23 11.75 25.98 4.26 6 Sales to total assets 0.42 0.38 1.71 1.78 1.58 1.59 1.11
26
- Sales to receivables had experienced a little drop in 2006 to 12.95 but still much
higher than 10.59 of Chevron.
- Sales to inventories also slightly decreased in 2006 to 36.48. But the price of oil
surprisingly increased making these inventories more value. While Chevron sold
out the product faster made their ratio standing high at 46.69 and Conoco at
41.38.
- Sales to working capital of Exxon is much lower than Chevron due to their
surplus in current assets while Conoco suffered a negative working capital.
- Sales to fixed assets did not change much from year 2005 to year 2006 stayed at
3.3 and still slightly higher than 3.09 of Chevron and much higher than 2.61 of
Conoco. Sales to total assets slightly decreased from 1.78 to 1.71 in 2006 but
again still higher than 1.59 of Chevron and much higher than 1.11 of Conoco. It
means that Exxon tends to make better use of its assets.
Block #4: Operating Performance Analysis
No. Measure Q2-2007
Q1-2007 2006 2005 2004
Chevron 2006
Conoco 2006
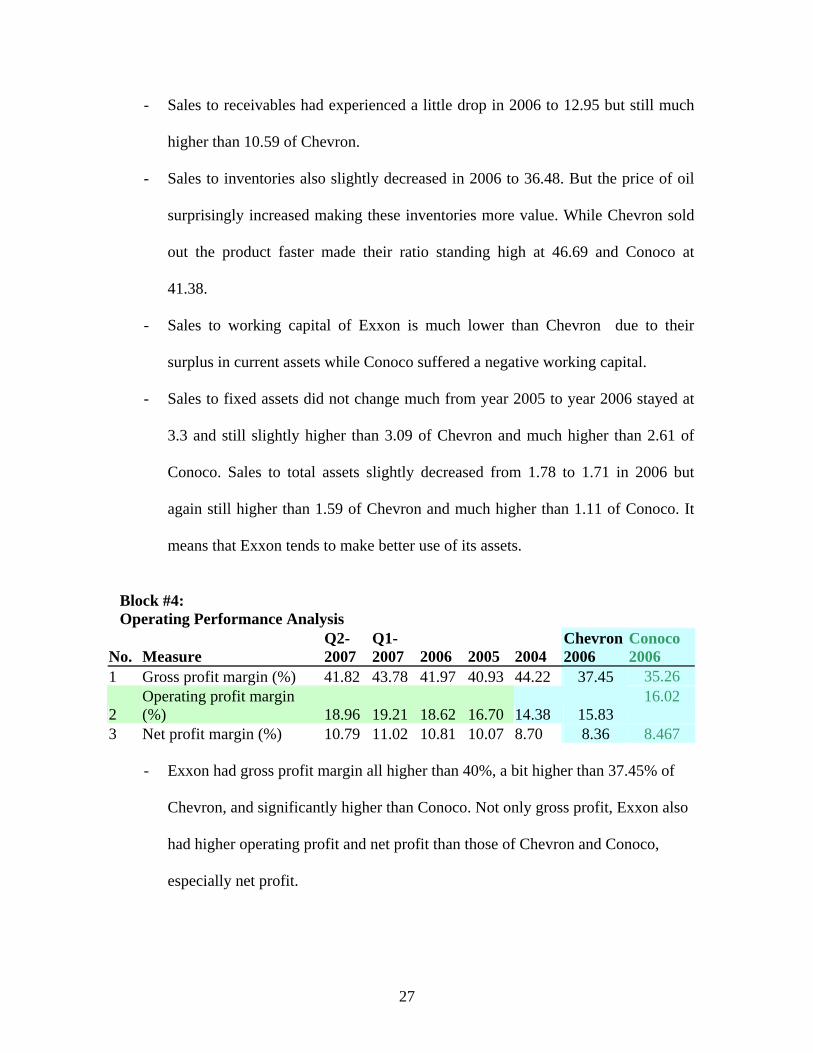
1 Gross profit margin (%) 41.82 43.78 41.97 40.93 44.22 37.45 35.26
2 Operating profit margin (%) 18.96 19.21 18.62 16.70 14.38 15.83
16.02
3 Net profit margin (%) 10.79 11.02 10.81 10.07 8.70 8.36 8.467
- Exxon had gross profit margin all higher than 40%, a bit higher than 37.45% of
Chevron, and significantly higher than Conoco. Not only gross profit, Exxon also
had higher operating profit and net profit than those of Chevron and Conoco,
especially net profit.
27

- In the last 3 year, 2004 had the highest Gross profit margin but also had the
lowest net profit margin. However, this trend had been replaced in the 2005 and
2006. In these two years, Exxon had lower gross profit margin but much higher
net profit margin of more than 10%.
- Operating profit margin of Exxon has been dramatically increased during the
period from 14.38 in 2004 to 19 in 2007. This rise was in line with the net profit
which also rose from 8.7 in 2004 to almost 11 in 2007.
Block #5: Return on Investment (ROI) Analysis
No. Measure Q2-2007
Q1-2007 2006 2005 2004
Chevron 2006
Conoco 2006
1 Return on assets (ROA) (%) 4.65 4.34 19.15 18.44 14.32 13.50
11.94
2 Return on common equity (ROCE) (%) 8.90 8.14 35.11 33.93 26.43 26.04
22.97
3 Return on long-term debt and equity (%) 8.61 7.94 34.40 33.19 26.27 23.14
19.17
4 Equity growth rate (%) 5.50 6.48 28.11 26.91 19.01 19.75 19.61
5 Disaggregation of return on common equity (%)
Adjusted (net) profit margin (%) 10.79 11.02 10.81 10.07 8.70 8.36
8.47
X x x x x x x Asset turnover 0.42 0.38 1.71 1.78 1.58 1.59 1.11 X x x x x x x Financial leverage ratio 1.960 1.940 1.899 1.895 1.928 1.96 2.01 8.88 8.12 35.10 33.97 26.50 26.05 18.90
- Return on assets (ROA) has increased tremendously over the last 3 year and in the
year 2006, ROA of Exxon is about 1.5 time of Chevron’s and even higher than
1.5 times of Conoco’s.
28

- Return on common equity (ROCE) also has been rising dramatically and again, in
2006, 50% higher than its competitors Chevron and Conoco.
- Exxon paid high attention to stockholder’s equity by pushing up the growth rate
of equity dramatically from 19% in 2004 to 28% in 2006.
- Based on the disaggregation of return on common equity, we can notice that
slightly rise on profit margin and better use of assets while maintaining the
financial leverage ratio had helped Exxon to increase its return on equity
significantly.
Here we have chosen to compare ExxonMobil (XOM) to two of its larger rivals to show
how the firm stands up compared to its competition. In every ratio stated above
ExxonMobil soundly outperforms Chevron and Conoco. ExxonMobil’s revenues are
increasing very steadily annually. Due to the increasing price of oil per barrel, the 2nd
Quarter revenue of ExxonMobil reached $98.35 billion higher than expected and
increased $11 billion for the first quarter. Their first and second quarterly profit margin
have outpaced Chevron and Conoco and the industry in regards to annual margin for
2006. They have a large cash reserve, $30.315 billion, including restricted cash. This is
more than half the amount of its total current liability of $52 billion. This paints a very
healthy picture of the company.
The stock price reflects the increasing growth of a healthy firm. Its highest price last year
was $79. The 52 week high has been broken four times this year, and is currently at
95.27. The price will continue to rise long term if the company stays on track, oil prices
increase.
29

Valuation:
Relative Valuation:
With relative valuation we analyzed three key ratios, P/E ratio, ROE ratio and EPS. We
begin with the most important being the P/E ratio, which reflects the amount of money an
investor is willingly to pay for a dollar or earnings. ExxonMobil’s P/E of 13.01 is
considered to be a fair value. It indicates the stock is neither undervalued nor overvalued,
and the company's earnings are not considered to be in decline. We can see from the table
below that the P/E is much better than ExxonMobil’s main competitors and the industry
whose average is 12.27. Another ratio is Return on Equity (ROE). It is equal to a fiscal
year's net income (after preferred stock dividends but before common stock dividends)
divided by total equity and is expressed as a percentage. ROE measures a firm's
efficiency at generating profits from every dollar of net assets, and shows how well a
company uses investment dollars to generate earnings growth. Once again ExxonMobil
has a better ratio than its three main competitors and the industry. The last ratio that we
will use is the Earnings per Share (EPS) ratio. It is the earnings returned on the initial
investment amount. The portion of a company's profit allocated to each outstanding share
of common stock. EPS serves as an indicator of a company's profitability.
30

Valuation Comparison
No. Measure Q2-2007
Q1-2007 2006 2005 2004
Chevron 2006
Conoco 2006
1 Earning per share (diluted) 1.83 1.62 6.62 5.71 3.89 7.80 9.66 2 Dividend 0.35 0.32 1.28 1.14 1.06 2.01 1.44 3 Book Value 20.70 19.97 19.87 18.21 15.90 31.85 48.89 4 Stock Price: High 83.55 75.61 79.00 65.96 52.05 76.20 74.89 Low 75.53 69.28 56.63 49.25 39.91 53.76 54.90 5 P/E Ratio: High 11.93 11.55 13.38 9.77 7.75 Low 8.55 8.63 10.26 6.89 5.68 “Higher risk means higher return” – the famous motto of Finance Industry – that we all
know. However, we also know that an investment may look good for you may not look
good for me. As an investor for our school, we need to be on the safer side of any
investment. Look at the above table, a risk taker immediately found out that
ConocoPhillips seems to be a good deal as its EPS was much higher than not only
ExxonMobil but also Chevron, thus its P/E ratio were lower. But after taking a
considerable time analyzing all the facts and financial figures of ExxonMobil, we can
realize that a P/E ratio is not the only indicator for a good investment. Some companies
have high P/E ratios but still considered as good investments, hence their stock prices are
increasing such as Apple or Google. Investors usually look for further and stable growth
in the company to justify their investment not only just P/E ratio. ExxonMobil with its
steady growth of equity should be considered a better investment. Its book value
significantly increases time by time from 15.90 in 2004 to 20.70 in quarter 2 of 2007. Its
EPS also experienced dramatically increasing from 3.89 in 2004 to 6.62 in 2006.
31

Furthermore, the P/E ratio of ExxonMobil even though is still higher than its competitors
is slightly decreasing. That signalizes the company is on the right track to fulfill its goal:
to reduce the P/E ratio.
32

Technical Analysis:
Exxon-Mobil has seen constant, strong growth and has been trending upward since
January 2004. The trend analysis chart trends upward across 4 years, 12 months and 30
days. Assuming a market required return of 8.6%, for the period of January 1, 2004 to
today ExxonMobil has a beta of 0.945 and a required return is 8.13%, for a 52 week
period the beta is 1.2405 and the required return is 10.66% and for a 30 day period the
beta is 1.2405 and the required return is 8.66%. Exxon-Mobil had a lower required return
than the market for the period beginning in January, and was only slightly higher for the
30 day period. This means not only does ExxonMobil have significant growth
opportunities but that it is not significantly more risky than the market as a whole. Its
Moving Average shows strong upward growth
• Capital Asset Pricing Model
• Moving Averages
• Trend Line Analysis – shows strong upward growth
• Bowlinger Bands
33

Capital Asset Pricing Model (CAPM)
k = req return risk market = 8.6 From jan' 04 k = Rf + ß (Rm - Rf) Beta 0.945 moves similar to mkt
R2 45.24% variance of stock is not very related to variance of S&P
RF Rate 4.54% Rm 8.60% k 8.38%
52wks k = Rf + ß (Rm - Rf) Beta 1.2405 moves similar to mkt
R2 53.87% variance of stock is not very related to variance of S&P
RF Rate 4.54% Rm 8.60% k 9.58%
30 days
k = Rf + ß (Rm - Rf) Beta 1.007 moves similar to mkt R2 66.99% variance of stock related to variance of S&P RF Rate 4.54% Rm 8.60% k 8.63%
Exxon vs S&P (Jan '04 - Today)
y = 0.945x + 0.0005R2 = 0.4524
-0.1
-0.05
0
0.05
0.1
0.15
-0.06 -0.04 -0.02 0 0.02 0.04 0.06 0.08
34

Exxon vs S&P (52wk)
y = 1.2405x + 0.0008R2 = 0.5387
-0.06
-0.04
-0.02
0
0.02
0.04
0.06
-0.04 -0.03 -0.02 -0.01 0 0.01 0.02 0.03 0.044
Moving Averages:
30
40
50
60
70
80
90
100
1/2/
2004
4/2/
2004
7/2/
2004
10/2
/200
4
1/2/
2005
4/2/
2005
7/2/
2005
10/2
/200
5
1/2/
2006
4/2/
2006
7/2/
2006
10/2
/200
6
1/2/
2007
4/2/
2007
7/2/
2007
DailySMA 50SMA 100
The current SMA that covers 3.5 years of data indicates that the current pricing of
ExxonMobil stock price at over 90 dollars per share is not currently in a sell position but
rather a hold. Coupled with the economic data of the firm we see this as an indication that
the ExxonMobil should be purchased at any level between 88 and 94 dollars per share.
35

Trend Line Analysis
Trend Analysis (30 day)
30
40
50
60
70
80
90
100
14-A
ug-0
7
16-A
ug-0
7
18-A
ug-0
7
20-A
ug-0
7
22-A
ug-0
7
24-A
ug-0
7
26-A
ug-0
7
28-A
ug-0
7
30-A
ug-0
7
1-Sep
-07
3-Sep
-07
5-Sep
-07
7-Sep
-07
9-Sep
-07
11-S
ep-0
7
13-S
ep-0
7
15-S
ep-0
7
17-S
ep-0
7
19-S
ep-0
7
21-S
ep-0
7
23-S
ep-0
7
25-S
ep-0
7
Trend Analysis
30
40
50
60
70
80
90
100
2-Ja
n-04
2-M
ar-0
4
2-M
ay-0
4
2-Ju
l-04
2-Sep
-04
2-Nov
-04
2-Ja
n-05
2-M
ar-0
5
2-M
ay-0
5
2-Ju
l-05
2-Sep
-05
2-Nov
-05
2-Ja
n-06
2-M
ar-0
6
2-M
ay-0
6
2-Ju
l-06
2-Sep
-06
2-Nov
-06
2-Ja
n-07
2-M
ar-0
7
2-M
ay-0
7
2-Ju
l-07
2-Sep
-07
Based on a comparison of trending price data for ExxonMobil over the short term period,
as well as a 3.5 year time frame, we have found strong upward trending movement for
XOM. Data would tend to indicate a steady support over the next three months of a price
in the low to mid 90’s for the stock as well as a price target of 110 over the next 12
months.
36

Bowlinger bands are one of the most powerful concepts available to the analyst but they
do not, as is commonly believed, give absolute buy and sell signals based on price
touching the bands. What they do is answer is whether prices are high or low on a relative
basis. We have interpreted a strong buy for the company in August and it is still currently
riding that trend.
37
Bowlinger Bands
Bollinger 50 (52 weeks)
60
65
70
75
80
85
90
95
100
006
006
006
006
007
007
007
007
007
007
007
8/26
/200
7
9/26
/200
7
9/26
/2
10/2
6/2
11/2
6/2
12/2
6/2
1/26
/2
2/26
/2
3/26
/2
4/26
/2
5/26
/2
6/26
/2
7/26
/2
DailyHigh BandLow Band

38
Common Sized Statements Projections & Assumptions EXXON MOBIL CORP
Income Statement COMMON - SIZE ANALYSIS OF CONSOLIDATED STATEMENTS OF INCOME (% REVENUE)
Q2-2007 Q1-2007 2006 2005 2004 (millions of dollars)
Revenues and other income Sales and other operating revenue (1) (2) $ 95,059 % 100.00 $ 84,174 % 100.00 $ 365,467 % 100.00 $ 358,955 % 100.00 $ 291,252 % 100.00Income from equity affiliates 2,015 2.12 1,915 2.28 6,985 1.91 7,583 2.11 4,961 1.70 Other income 1,276 1.34 1,134 1.35 5,183 1.42 4,142 1.15 1,822 0.63
Total revenues and other income $ 98,350 % 103.46 $ 87,223 % 103.62 $ 377,635 % 103.33 $ 370,680 % 103.27 $ 298,035 % 102.33
Costs and other deductions Crude oil and product purchases $ 47,627 % 50.10 $ 40,042 % 47.57 $ 182,546 % 49.95 $ 185,219 % 51.60 $ 139,224 % 47.80Production and manufacturing expenses 7,678 8.08 7,283 8.65 29,528 8.08 26,819 7.47 23,225 7.97 Selling, general and administrative expenses 3,788 3.98 3,392 4.03 14,273 3.91 14,402 4.01 13,849 4.75 Depreciation and depletion 2,994 3.15 2,942 3.50 11,416 3.12 10,253 2.86 9,767 3.35 Exploration expenses, including dry holes 353 0.37 272 0.32 1,181 0.32 964 0.27 1,098 0.38 Interest expense 96 0.10 103 0.12 654 0.18 496 0.14 638 0.22 Sales-based taxes (1) 7,810 8.22 7,284 8.65 30,381 8.31 30,742 8.56 27,263 9.36 Other taxes and duties 9,888 10.40 9,591 11.39 39,203 10.73 41,554 11.58 40,954 14.06 Income applicable to minority and preferred interests 188 0.20 250 0.30 1,051 0.29 799 0.22 776 0.27
Total costs and other deductions $ 80,422 % 84.60 $ 71,159 % 84.54 $ 310,233 % 84.89 $ 311,248 % 86.71 $ 256,794 % 88.17
Income before income taxes $ 17,928 % 18.86 $ 16,064 % 19.08 $ 67,402 % 18.44 $ 59,432 % 16.56 $ 41,241 % 14.16Income taxes 7,668 8.07 6,784 8.06 27,902 7.63 23,302 6.49 15,911 5.46
Net income $ 10,260 % 10.79 $ 9,280 % 11.02 $ 39,500 % 10.81 $ 36,130 % 10.07 $ 25,330 % 8.70
Net income per common share (dollars) 1.85 1.64 6.68 5.76 3.91 Net income per common share assuming dilution (dollars) $ 1.83 $ 1.62 $6.62 $5.71 $3.89

39
EXXON MOBIL CORP Balance Sheet COMMON SIZE ANALYSIS OF CONSOLIDATED STATEMENTS OF FINANCIAL POSITION
Jun. 30 Mar. 31 Dec. 31 Dec. 31 Dec. 31 2007
2007 2006
2005
2004
(in million dollars) Assets Current assets Cash and cash equivalents $ 28,959 % 12.68 $ 29,994 % 13.43 $ 28,244 % 12.90 $ 28,671 % 13.76 $ 18,531 % 9.49Cash and cash equivalents restricted 4,604 2.02 4,604 2.06 4,604 2.10 4,604 2.21 4,604 2.36
Notes and accounts receivable, less estimated doubtful amounts 30,315 13.28 27,582 12.35 28,942 13.21 27,484 13.19 25,359 12.99 Inventories: 0.00 0.00 0.00 0.00 0.00 Crude oil, products and merchandise 10,866 4.76 10,759 4.82 8,979 4.10 7,852 3.77 8,136 4.17 Materials and supplies 2,029 0.89 1,846 0.83 1,735 0.79 1,469 0.71 1,351 0.69 Prepaid taxes and expenses 3,947 1.73 3,280 1.47 3,273 1.49 3,262 1.57 2,396 1.23
Total current assets $ 80,720 % 35.35 $ 78,065 % 34.96 $ 75,777 % 34.60 $ 73,342 % 35.20 $ 60,377 % 30.92Property, plant and equipment, at cost, less accumulated depreciation and depletion 116,058 50.83 114,201 51.14 113,687 51.91 107,010 51.36 108,639 55.64 Investments and Other assets, including intangibles, net 31,537 13.81 31,033 13.90 29,551 13.49 27,983 13.43 26,240 13.44
Total assets $ 228,315 % 100.00 $ 223,299 % 100.00 $ 219,015 % 100.00 $ 208,335 % 100.00 $ 195,256 % 100.00

40
6,220
Liabilities Current liabilities
Notes and loans payable $ 2,033 % 0.89 $ 2,006 % 0.90 $ 1,702 % 0.78 $ 1,771 % 0.85 $ 3,280 % 1.68Accounts payable and accrued liabilities 41,247 18.07 38,923 17.43 39,082 17.84 36,120 17.34 31,763 16.27 Income taxes payable 8,636 3.78 9,661 4.33 8,033 3.67 8,416 4.04 7,938 4.07
Total current liabilities $ 51,916 % 22.74 $ 50,590 % 22.66 $ 48,817 % 22.29 $ 46,307 % 22.23 $ 42,981 % 22.01Long-term debt 6,757 2.96 6,758 3.03 6,645 3.03 2.99 5,013 2.57 Postretirement benefits reserves 13,931 10,220 10,850 Accrued liabilities 7,116 6,434 6,279 Deferred income tax liabilities 21,548 9.44 21,010 9.41 20,851 9.52 20,878 10.02 21,092 10.80 Deferred credits and other long-term obligations 13.9031,744 30,831 13.81 4,007 1.83 3,563 1.71 3,333 1.71 Equity of minority and preferred shareholders in affiliated companies 3,804 3,527 3,952
Total liabilities $ 111,965 % 49.04 $ 109,189 % 48.90 $ 105,171 % 48.02 $ 97,149 % 46.63 $ 93,500 % 47.89
Commitments and contingencies
Shareholders equity
Common stock without par value $ 4,795 % 2.10 $ 4,530 % 2.03 $ 4,786 % 2.19 $ 4,477 % 2.15 $ 4,053 % 2.08(9,000 million shares authorized, 8,019 million shares issued) Earnings reinvested 211,283 % 92.54 202,984 % 90.90 195,207 % 89.13 163,335 % 78.40 134,390 % 68.83Accumulated other nonowner changes in
equity Cumulative foreign exchange translation
5,381 % 2.36 4,156 % 1.86 3,733 % 1.70 979 % 0.47 3,598 % 1.84
adjustment Postretirement benefits reserves adjustment (6,655) -2.91 (6,702) -3.00 (6,495) -2.97 Minimum pension liability adjustment (2,258) -1.08 (2,499) -1.28Unrealized gains/(losses) on stock investments 428 0.22Common stock held in treasury (2,290 million -43.12(98,454) (90,858)
-40.69 (83,387)
-38.07 (55,347)
-26.57 (38,214)
-19.57
shares in 2006; 1,886 million shares
in 2005; 1,618 million shares in 2004)
Total shareholders equity $ 116,350 % 50.96 $ 114,110 % 51.10 $ 113,844 % 51.98 $ 111,186 % 53.37 101,756 % 52.11
Total liabilities and shareholders equity $ 228,315 % 100.00 $ 223,299 % 100.00 $ 219,015 % 100.00 $ 208,335 % 100.00 195,256 % 100.00

41
EXXON MOBIL CORP Cash Flows COMMON-SIZE ANALYSIS OF CONSOLIDATED STATEMENTS OF CASH FLOWS (% OF REVENUE)
Q2-2007 Q1-
2007 2006 2005 2004 (millions of dollars)
Cash flows from operating activities
Net income $
19,540 % 20.56 $
9,280
% 11.02 $
40,551 % 11.10 $
36,929 % 10.29 $
26,106 % 8.96
- Accruing to ExxonMobil shareholders 39,500 10.81 36,130 10.07 25,330 8.70- Accruing to minority and preferred interests 1,051 0.29 799 0.22 776 0.27 Adjustments for noncash transactions
Depreciation and depletion 5,936 6.24 2,942 3.50 11,416 3.12 10,253 2.86 9,767 3.35 Deferred income tax charges/(credits) 1,717 0.47 (429) -0.12 (1,134) -0.39Postretirement benefits expense in excess of/(less than) payments (1,787) -0.49 254 0.07 886 0.30Accrued liability provisions in excess of/(less than) payments
(666)
-0.18
398
0.11
806
0.28
Dividends received greater than/(less than) equity in current earnings of equity companies (579) -0.16 (734) -0.20 (1,643) -0.56Changes in operational working capital, excluding cash and debt (366) -0.39 1,843 2.19 (1,366) -0.37 1,467 0.41 5,763 1.98 Reduction/(increase) Notes and accounts receivable (181) -0.05 (3,700)
-1.03 (472) -0.16
Inventories (1,057) -0.29 (434) -0.12 (223) -0.08Prepaid taxes and expenses (385) -0.11 (7) 0.00 11 0.00Increase/(reduction) Accounts and other payables 1,160 0.32 7,806 2.17 6,333 2.17 Net (gain) on asset sales (1,531) -0.42 (1,980) -0.55 (268) -0.09All other items net 494 0.52 221 0.26 628 0.17 (218) -0.06 382 0.13
Net cash provided by operating activities $ 25,604 % 26.93 $ 14,286 % 16.97 $ 49,286 % 13.49 $ 48,138 % 13.41 $ 40,551 % 13.92

42%
Q2-2007 Q1-
2007 2006 2005 2004 (millions of dollars)
Cash flows from investing activities
Additions to property, plant and equipment $ (6,892)
% -7.25 $ (3,106) % -3.69 $ (15,462) %-
4.23 $ (13,839) %-
3.86 $ (11,986) %-
4.12 Sales of subsidiaries, investments and property, plant and equipment 1,673 1.76 538 0.64 3,080 0.84 6,036 1.68 2,754 0.95
Other investing activities - net (1,104) -1.16 (670) -0.80 (1,848) -
0.51 (2,467) -
0.69 (5,678) -
1.95
Net cash used in investing activities $ (6,323) % -6.65 $ (3,238) % -3.85 $ (14,230) %-
3.89 $ (10,270) %-
2.86 $ (14,910) %-
5.12
Cash flows from financing activities
Additions to long-term debt $ 99 % 0.10 $ 93 % 0.11 $ 318 % 0.09 $ 195 % 0.05 $ 470 % 0.16
Reductions in long-term debt (75) -0.08 (36) -0.04 (33) -
0.01 (81) -
0.02 (562) -
0.19
Additions/(Reductions) to short-term debt 246 0.26 274 0.33 (117) -
0.03 (310) -
0.09 (1,793) -
0.62 Additions/(reductions) in debt with less than 90-day maturity (95)
-0.03 (1,306)
-0.36 (66)
-0.02
Cash dividends to ExxonMobil shareholders (3,786) -3.98 (1,825) -2.17 (7,628) -
2.09 (7,185) -
2.00 (6,896) -
2.37
Cash dividends to minority interests (142) -0.15 (74) -0.09 (239) -
0.07 (293) -
0.08 (215) -
0.07 Changes in minority interests and sales/(purchases) of affiliate stock (319) -0.34 (149) -0.18 (493)
-0.13 (681)
-0.19 (215)
-0.07
Tax benefits related to stock-based awards 237 0.00 0.00 462 0.00
Common stock acquired (15,421) -
16.22 (7,788) -9.25 (29,558) -
8.09 (18,221) -
5.08 (9,951) -
3.42 Common stock sold 1,173 0.32 941 0.26 960 0.33
Net cash used in financing activities $ (19,161) %-
20.16 $ (9,505) %-
11.29 $ (36,210) %-
9.91 $ (26,941) %-
7.51 $ (18,268) %-
6.27
Effects of exchange rate changes on cash $ 595 % 0.63 $ 207 % 0.25 $ 727 % 0.20 $ (787) %-
0.22 532 % 0.18
Increase/(decrease) in cash and cash equivalents $ 715 % 0.75 $ 1,750 % 2.08 $ 427 % 0.12 $ 10,140 % 2.82 7,905 % 2.71 Cash and cash equivalents at beginning of year 28,244 29.71 28,244 33.55 28,671 7.85 18,531 5.16 10,626 3.65
Cash and cash equivalents at end of period $ 28,959 % 30.46 $ 29,994 35.63 $ 28,244 % 7.73 $ 28,671 % 7.99 $ 18,531 % 6.36

Income Statement & Balance Sheet Notes:
Initial Assessment: Revenue rose significantly over the past 3 years from 2004-2006, and
total revenue of the first two quarter of 2007 was accounted about half of total 2006
revenue. And the pattern for net income is the same as revenue. Thus the earning per
share also was rising from $3.91 in 2004 to $6.68 in 2006.
Income Statement:
From the common-size income statement of ExxonMobil we see that net income has
risen dramatically. Thus, the percentage of net income over revenue has slightly
increased from 8.7% in 2006 to 10.8% in 2006. And this number for 2007 will probably
beeven higher since the number of its first two quarters is around 11%. The reason for
this significant rise seems to be higher oil prices. However, the high and unstable oil
price also contributed to the fluctuation of the cost of oil purchase that accounted for
around 50% of ExxonMobil revenue (ExxonMobil purchases some of the oil used in its
upstream operation). This purchase resulted in a substantially rise in 2005 but it declined
slightly in 2006 and 2007. Nearly all of ExxonMobil’s other operating expenses rose at a
slower rate than sales. Only crude oil and production / manufacturing expenses rose at a
faster rate. Selling, general and administrative expense was virtually a fixed cost, as was
exploration expense. Since the oil price increased dramatically and probably will
continue to rise, the exploration expense should rise and not remain almost unchanged
like as seen in the income statement.
Balance Sheet:
The total assets of the company have increased dramatically from $195,256 million in
2004 to $219,015 million in 2006 and slightly in the first two quarters of 2007.
Assets:
Cash and cash equivalents rose from 9.49% in 2004 to 13.76% in 2005 but had a small
drop off of 1.5% in 2006. Accounts Receivable stayed around 13%, indicating the
company paying customer base.
43

The rise in both crude oil inventory and materials and supplies are considerably faster
than either sales or assets. The increase of oil price had pushed up these inventories in
value. It is expected that the company decided to keep its inventories to sell at higher
price in the future.
Property and equipment after a big decrease from 55.64% in 2004 to 51.36% in 2005,
stayed almost unchanged. Investments and other assets was steady around 13.5% of total
assets.
Liabilities:
Most of Exxon current liabilites are considered friendly liabilites, including account
payable, note and loan payable. These abilities took about 20% in term of percentage of
total assets. Notes and loans payable got a big decline of 50% from 1.68% in 2004 to
0.85% in 2005. After that it continue to slight drop in 2006. However, it seems to rise
again in 2007. Accounts payable slightly increased faster than sales and assets but in line
with the growth in inventories. Total current liabilities grew at approximately the same
rate as total assets.
About long-term liabilities, long-term debt grew a bit faster than total assets, while
deferred tax liabilities declined. The most significant change related to postretirement
benefit, which increased 36.3% year/year and represented 6.36% of total assets in 2006
compared with just 4.91% in 2005. The reason for this increase is that in 2006 there was
primarily a change in accounting principles of Exxon. “ Effective December 31, 2006,
Exxon Mobil Corporation implemented FASB Statement No. 158, “Employers’
Accounting for Defined Benefit Pension and Other Postretirement Plans” (FAS 158),
which requires an employer to recognize the overfunded or underfunded status of a
44

defined benefit postretirement plan as an asset or liability in its statement of financial
position and to recognize changes in that funded status in the year in which the changes
occur through other nonowner changes in equity. In 2006, the amounts recorded in other
nonowner changes in equity for net actuarial losses and prior service costs are required by
FAS 158. For 2005, FASB Statement No. 87, “Employers’ Accounting for Pensions,”
required an employer to recognize a liability in its statement of financial position that was
at least equal to the unfunded accumulated benefit obligation for defined benefit pension
plans.” The pension plans did not change, only the way they are recognized on the
financial statements. In 2005, Exxon did not have to record its entire shortfall (the
difference between the current value that it is expected to pay out in future benefits and
the assets available to cover the expenses) on the balance sheet. In 2006 and in future
years, it must.
The sudden increase in Deferred credits and other long-term obligations in the first two
quarters of 2007 to almost 14% from 1.83% in 2006 had contributed to the rise of total
liabilities. This is accounted for 49% of its total assets.
Stockholders’ Equity:
In 2006 Exxon Mobil issued new stock, increasing its common equity by $309 million to
8,019 million. This amount most likely reflected changes resulting from stock based
compensation. The company repurchased $28 billion worth of stock for the treasury
account in 2006 and additional amount of $8 billion in each quarter of 2007. The
significant share buyback negated most of the other contributions to shareholder equity,
resulting in a modest increase for total shareholder equity. As a percentage of assets,
45

shareholder equity declined from 53.37% in 2005 to 52% in 2006 and now stands at 51%.
However, it still represents the largest source of capital for the firm.
Cash Flow:
ExxonMobil had extremely large inflow cash from its operating activities but always had
outflow money from investing and financing activities for the last 3 years and first two
quarters of 2007.
The negative cash flow in investing suggested that the company spent money on
investment, it can be considered as positive action. While the negative cash flow in
financing due to re-purchasing its common stocks in the market. The company generated
more than $49 billion in cash from operations in 2006, but it used nearly $30 billion to
repurchase shares, $7 billion for dividends and $15 billion to invest in equipment. In the
first two quarters of 2007, the company continued to spend more than half of its operating
cash flow in buying back its common stocks.
As a percentage of revenue, the cash flow from operating activities has increased
dramatically in 2007, double the number of 2006. This was in line with the dramatically
increases of money spent in investing and financing activities.
46
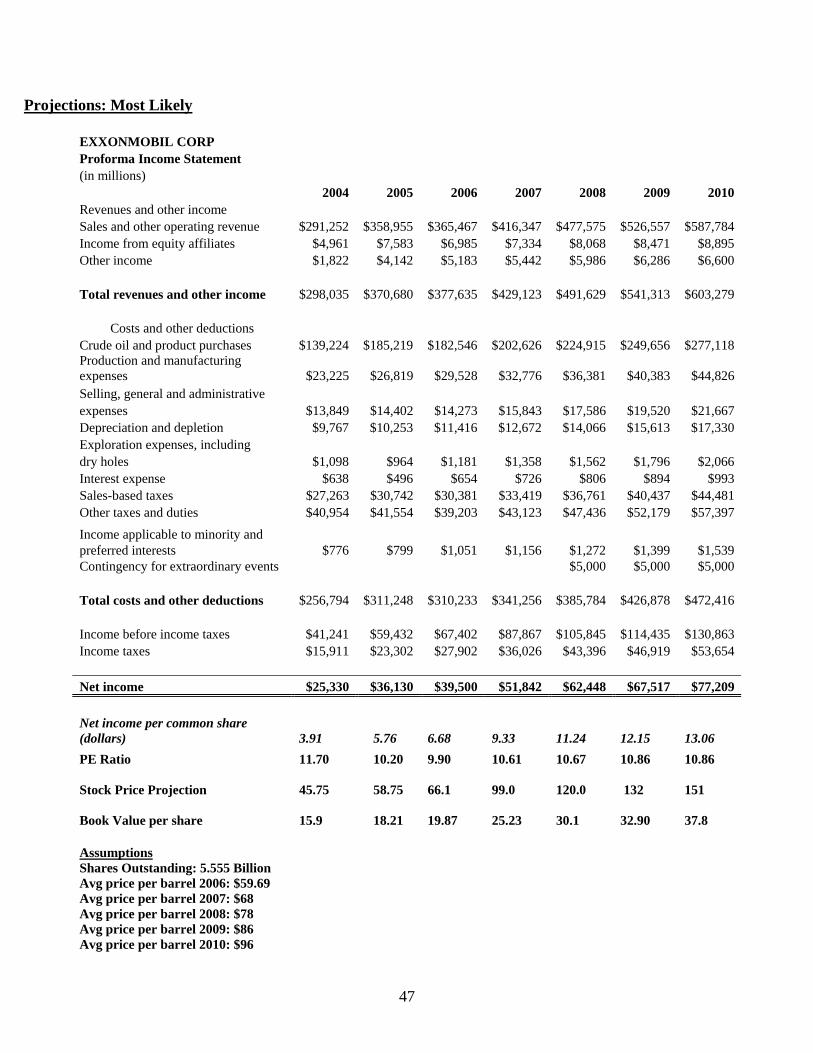
Projections: Most Likely
EXXONMOBIL CORP Proforma Income Statement (in millions)
2004 2005 2006 2007 2008 2009 2010 Revenues and other income Sales and other operating revenue $291,252 $358,955 $365,467 $416,347 $477,575 $526,557 $587,784 Income from equity affiliates $4,961 $7,583 $6,985 $7,334 $8,068 $8,471 $8,895 Other income $1,822 $4,142 $5,183 $5,442 $5,986 $6,286 $6,600
Total revenues and other income $298,035 $370,680 $377,635 $429,123 $491,629 $541,313 $603,279
Costs and other deductions
Crude oil and product purchases $139,224 $185,219 $182,546 $202,626 $224,915 $249,656 $277,118 Production and manufacturing expenses $23,225 $26,819 $29,528 $32,776 $36,381 $40,383 $44,826 Selling, general and administrative expenses $13,849 $14,402 $14,273 $15,843 $17,586 $19,520 $21,667 Depreciation and depletion $9,767 $10,253 $11,416 $12,672 $14,066 $15,613 $17,330 Exploration expenses, including dry holes $1,098 $964 $1,181 $1,358 $1,562 $1,796 $2,066 Interest expense $638 $496 $654 $726 $806 $894 $993 Sales-based taxes $27,263 $30,742 $30,381 $33,419 $36,761 $40,437 $44,481 Other taxes and duties $40,954 $41,554 $39,203 $43,123 $47,436 $52,179 $57,397
Income applicable to minority and preferred interests $776 $799 $1,051 $1,156 $1,272 $1,399 $1,539 Contingency for extraordinary events $5,000 $5,000 $5,000
Total costs and other deductions $256,794 $311,248 $310,233 $341,256 $385,784 $426,878 $472,416
Income before income taxes $41,241 $59,432 $67,402 $87,867 $105,845 $114,435 $130,863 Income taxes $15,911 $23,302 $27,902 $36,026 $43,396 $46,919 $53,654
Net income $25,330 $36,130 $39,500 $51,842 $62,448 $67,517 $77,209
Net income per common share (dollars) 3.91 5.76 6.68
9.33
11.24 12.15 13.06
PE Ratio 11.70 10.20 9.90 10.61 10.67 10.86 10.86
Stock Price Projection 45.75 58.75 66.1
99.0
120.0 132 151
Book Value per share 15.9 18.21 19.87
25.23
30.1
32.90
37.8
Assumptions Shares Outstanding: 5.555 Billion Avg price per barrel 2006: $59.69 Avg price per barrel 2007: $68 Avg price per barrel 2008: $78 Avg price per barrel 2009: $86 Avg price per barrel 2010: $96
47

EXXONMOBIL CORP Proforma Statement of Cashflows (in millions) 2006 2007 2008 2009 2010
Sales 365,467
416,347
477,575
526,557
587,784
Change in Receivables (1,458)
(1,457)
(1,456)
(1,455)
(1,454)
Cash From Sales 364,009
414,890
476,119
525,102
586,330
Cost of Sales 310,233
341,256
385,784
426,878
472,416
Change in Payables 2,962 (503)
772 787 803
Change in Inventory (1,393)
(214)
141
(216)
(220)
Cash Cost of Sales 311,802
340,539
386,696
427,449
472,999
Net Cash From Operations 52,207
74,351
89,423
97,652
113,331
Income Taxes (27,902)
(36,026)
(43,396)
(46,919)
(53,654)
Interest Expense (654)
(726)
(806)
(894)
(993)
Investment and Financing Transactions
Sale of (Purchase) Plant Other long-term liabilities 5,114 - - - -
Issue (Retire) Stock Total Nonoperating Cash Changes
Net Cash 28,765
37,599
45,220
49,840
58,685
48

Projections: Worst Case
EXXONMOBIL CORP Proforma Income Statement (in millions)
2004 2005 2006 2007 2008 2009 2010 Revenues and other income Sales and other operating revenue $291,252 $358,955 $365,467 $416,347 $440,838 $489,820 $514,311 Income from equity affiliates $4,961 $7,583 $6,985 $7,334 $8,068 $8,471 $8,895 Other income $1,822 $4,142 $5,183 $5,442 $5,986 $6,286 $6,600
Total revenues and other income $298,035 $370,680 $377,635 $429,123 $454,892 $504,577 $529,806
Costs and other deductions
Crude oil and product purchases $139,224 $185,219 $182,546 $202,626 $218,836 $236,343 $255,250 Production and manufacturing expenses $23,225 $26,819 $29,528 $32,776 $35,398 $38,230 $41,288 Selling, general and administrative expenses $13,849 $14,402 $14,273 $15,843 $17,110 $18,479 $19,958 Depreciation and depletion $9,767 $10,253 $11,416 $12,672 $13,686 $14,780 $15,963 Exploration expenses, including dry holes $1,098 $964 $1,181 $1,358 $1,467 $1,584 $1,711 Interest expense $638 $496 $654 $726 $784 $847 $914 Sales-based taxes $27,263 $30,742 $30,381 $33,419 $36,093 $38,980 $42,098 Other taxes and duties $40,954 $41,554 $39,203 $43,123 $46,573 $50,299 $54,323
Income applicable to minority and preferred interests $776 $799 $1,051 $1,156 $1,249 $1,348 $1,456 Contingency for extraordinary events $5,000 $5,000 $5,000
Total costs and other deductions $256,794 $311,248 $310,233 $341,256 $376,195 $405,891 $437,962
Income before income taxes $41,241 $59,432 $67,402 $87,867 $78,697 $98,686 $91,843 Income taxes $15,911 $23,302 $27,902 $36,026 $32,266 $40,461 $37,656
Net income $25,330 $36,130 $39,500 $51,842 $46,431 $58,225 $54,188
Net income per common share (dollars) 3.91 5.76 6.68 9.33 8.36 10.48
9.75
PE Ratio 11.70 10.20 9.90 10.29 11.01 10.30 11.17
Stock Price Projection 45.75 58.75 66.1
96.0 93.0 108.0 110.0
Book Value per share 15.9 18.21 19.87 25.23 21.74 27.60
25.10
Assumptions Shares Outstanding: 5.555 Billion Avg price per barrel 2006: $59.69 Avg price per barrel 2007: $68 Avg price per barrel 2008: $72 Avg price per barrel 2009: $80 Avg price per barrel 2010: $84
49

EXXONMOBIL CORP Proforma Statement of Cashflows (in millions) 2006 2007 2008 2009 2010 Sales
Change in Receivables 365,467
416,347
440,838
489,820
514,311
Cash From Sales (1,458)
(1,457)
(1,456)
(1,455)
(1,454)
364,009
414,890
439,382
488,365
512,857
Cost of Sales 310,233
341,256
376,195
405,891
437,962
Change in Payables 2,962
(503) 772
787
803
Change in Inventory (1,393)
(214) 141
(216)
(220)
Cash Cost of Sales 311,802
340,539
377,108
406,462
438,545
Net Cash From Operations 52,207 74,351 62,274
81,903
74,312
Income Taxes (27,902)
(36,026)
(32,266)
(40,461)
(37,656)
Interest Expense (654)
(726)
(784)
(847)
(914)
Investment and Financing Transactions Sale of (Purchase) Plant
Other long-term liabilities 5,114 - - - -
Issue (Retire) Stock Total Nonoperating Cash Changes
Net Cash 28,765 37,599 29,225
40,595
35,742
50

Notes: When coming up with logic for the proforma projections we looked into what
affects ExxonMobil’s operations. Our conclusion is that the price of oil per barrel has the
largest over all affect on their financial results. Profits from their chemical and
automotive lubricant businesses were negligible in comparison. Therefore we linked
expected revenues to their oil output and projected an average price per barrel every year
as shown at the bottom of each income statement. We also increased expenses, as well as
created an allowance for unexpected expenses to compensate for possible legal or
hurricane related issues.
Investment risks:
Depending on the nature of the investment, the type of investment risk will vary,
Companies cannot eliminate investment risk, but they can understand it and take steps to
keep it at acceptable levels. We will focus on four main investment risks that the
company may face:
• Currency risk
• Market risk
• Legal risk
• Political risk
Currency risk is the risk that a business' operations or an investment's value will be
affected by changes in exchange rates. For example, if money must be converted into a
different currency to make a certain investment, changes in the value of the currency
relative to the American dollar will affect the total loss or gain on the investment when
the money is converted back. The biggest concern is in the decreasing value of American
Dollar. Four years ago 1 Euro was worth .75 US Dollar; now 1 Euro is worth 1.41 US
Dollar, so the value of US currency to European Currency has declined 50%. If
51

ExxonMobil would decide to invest money in the European market they will have to pay
twice the amount they would have two years ago for the same investment. On the other
hand if they have already invested in Europe and they will receive money from their
investment in Euros. When they convert their income into US Dollars they will make
more money because of the positive Euro to US Dollar exchange rate. However this is
also a strength for ExxonMobil since oil futures contracts are priced and traded in the
U.S. Dollar. If interest rates decrease and a devaluation of the dollar occurs, the price of
oil per barrel will increase to compensate. This has occurred within the last two weeks.
This should ultimately balance out the risks traditionally associated with currency risk
and is a good hedge against such moments.
Market risk is the risk that the value of an investment will decrease due to moves in
market factors. Because petroleum is a non-renewable natural resource the industry will
face an eventual shortage of world’s oil supply some day in the future. The prospective
life span of reserves in the Middle East is 88 years, for Latin America 37 years, and fo
North America only16 years. Oil exploration alone will not prevent future shortages of
the resource. Resource economists argue that oil prices will rise as demand increases
relative to supply. A shift in supply will only benefit ExxonMobil. Another market risk
that may influence ExxonMobil is development of renewable energy source. Climate
changes with high oil prices and increasing government support are driving increasing
renewable energy legislation, incentives and commercialization. The European Union
decided energy produced from renewable fuels should reach 20% by 2020. ExxonMobil
invested $80 billion in 2005 and $100 billion in 2006 into renewable energy projects.
52

What may be a big concern for the ExxonMobil is that the major competitors such as BP,
GE and Shell have also started to invest money in the renewable energy sector.
Legal actions are one of the largest potential exposures of the company. On January 25,
2007 the allied co-plaintiffs of Riverkeeper, local activists, and elected officials
announced the initiation of a new legal action against ExxonMobil over the massive 17-
million gallon Greenpoint Oil Spill. The co-plaintiffs are currently suing ExxonMobil in
federal court over the spill. The spill was first detected in September 1978 that extended
52 acres under the Greenpoint area. More than 9 million gallons of oil have been
recovered from the spill area, with progress ongoing, the area still has millions of gallons
of oil in the ground and it may cost the company billions of dollars to clean the spill and
pay the associated penalties.
Political Risk is another issue and may have very bad implications because most of the
oil reserves lie in relatively unstable political regions and regions antagonistic towards
the United States. Recently ExxonMobil Company was forced to exit Venezuelan
market. This may turn to huge loss for Exxon’s balance sheet by as much as $750
million. ExxonMobil could not agree to a new deal giving the Venezuelan state oil
company 60 to 83 percent interests in their ventures. This nationalization move can be
taken by a number of countries in order to reclaim the fields owned by the ExxonMobil
Corporation. This is all due to the rising prices of the oil. These countries may try to use
oil to make more money for themselves and directly affect the American market, where
oil plays a large role.
53

CONCLUSIONS:
Our conclusion is an easy one. ExxonMobil (XOM) is a very healthy company, in an
industry that has a hammerlock on supplying the world with a substance it is addicted to:
Petroleum products. This is a blue chip stock with global demand for its product. With
global growth and demand outpacing predicted supply rates, price for its product can only
increase over time. ExxonMobil is moving forward aggressively to replace eroding
supply chains by developing future sites like invest in natural gas production in northwest
Colorado. Their newest investment will boost production from 55 million cubic feet per
day to about 250 millions cubic feet per day. Along with being the industry leader in deep
water offshore drilling, which is seen as the salvation of the industry, ExxonMobil is in a
better position to replace existing stockpiles faster than their competition. Oil hitting
record prices per barrel and every indicator shows that it willonly go up. ExxonMobil’s
position is secure. Being the market leader with record profits as well as positioned to
take advantage of the expanding demand in the marketplace, makes for a strong long
term buy recommendation by our team
RECOMMENDATIONS:
Our team recommends the following course of action: A purchase of 200 shares, which
increases the currently held position of ExxonMobil from 200 shares to 400 shares.
Purchase should be made at market levels since profits justify a far higher price per share.
A sale of the spider ETF to finance the purchase would be the best course of action.
Approximately 20,000 dollars will be needed to execute the transaction. We suggest
holding the stock for a period of five years to lessen the exposure to short term
54

fluctuations in price that can be generated by various factors including seasonality of
demand, weather patterns and political instability.
55

Appendix A
Response to meeting with investment committee
Why did XOM miss its earnings, if the price of the security is tied into the price of a barrel of oil?
The price is indeed linked to the price per barrel. Earnings estimates were set at 1.75 per share. Exxon reported EPS as 1.70 or 2.7% below expectations. Exxon reported record revenues for the quarter ending 9/30/07 with $102.3 Billion primarily due to the increase of the average price per barrel as expected. While revenues met expectations due to this increase in oil prices, what was unexpected was higher related costs in refining the petroleum they produced. This higher than expected cost cut into Exxon’s profit margin slightly. Also a reserve for potential loss due to political actions in Venezuela which could result in PP & E losses also cut into profits slightly. These two things resulted in Exxon missing its projection. It does not signal any problem or issue with the company or its overall health. Since revenues and not cost is the driving force for the link between per barrel oil pricing and the share price of Exxon, the earnings slip can be explained and does not represent a causal relationship problem.
Elaborate on the Dividend ($1.00 a share?) given by XOM - is the dividend fixed?
The dividend is not fixed. In fiscal 2006 the annual dividend was $1.28 per share (.32 per quarter). In 2007 the company increased the annual dividend to $1.4 per share (.35 per quarter). The company’s has increased its annual dividend every year for the last ten years.
What’s the dividend yield on the security?
Dividend yield = Annual Dividends per share / Price per share
As of 12/12/07
1.52% = $1.4 / $91.92
56


![Crude Assay Report · 15 Vacuum Gas Oil Cuts - Gas Oil [325-370°C] 15 16 Vacuum Gas Oil Cuts - Gas Oil 1[370 - 540°C] 16 17 Vacuum Gas Oil Cuts - Heavy Vacuum Gas Oil [370 - 548°C]](https://static.documents.pub/doc/80x56/5e68681c2598ff04995c67bc/crude-assay-report-15-vacuum-gas-oil-cuts-gas-oil-325-370c-15-16-vacuum-gas.jpg)


