TeamLease Employment Outlook Report Quarter-23, July-September 2012 A comprehensive and in-depth analysis of Employment and Business Outlook for the forthcoming quarter. Includes statistics for 8 cities and 8 sectors, literature review insights and depth-survey findings inTouch analytics http://be-in-touch.com
Transcript
TeamLease Employment Outlook Report Quarter-23, July-September 2012
A comprehensive and in-depth analysis of Employment and Business Outlook for the forthcoming quarter. Includes statistics for 8 cities and 8 sectors, literature review insights and depth-survey findings
inT
ou
ch an
alytics http://be-in-touch.com
Team
Leas
eEm
ploy
men
tOut
look
Repo
rt
1
Preface
The quarterly TeamLease Employment Outlook Report is a forward looking tool for human resource policy and decision makers, reflecting business sentiment for hiring across cities and sectors. The report carries a snapshot of business hiring sentiment for the immediate next three months with survey and analysis being carried out in the preceding quarter.
The Employment Outlook Survey spans eight industry sectors and eight cities across India. The survey covers small, medium and large companies across these sectors, studies attrition and employment trends, and gleans information on hiring sentiments, all this covering different locations, hierarchical levels and functional areas.
The current edition of the Employment Outlook Report revisits and validates the forecasts made in the immediate past reports, with the help of an extensive secondary research exercise. In addition to this, we have set out to invite thoughts on hiring and talent retention from respondents that go beyond hiring and business sentiment inputs we usually solicit from them.
With the most critical drivers that influence hiring being tracked quarter on quarter, the Employment Outlook Report is the only one of its kind seeking to deliver high impact hiring decision support to its stakeholders – Business & HR heads, Senior Management as well as industry policy makers.
Team
Leas
eEm
ploy
men
tOut
look
Repo
rt
2
Contents
1. Executive Summary 2. Project Objectives 3. Index definitions
3.1. Employment Outlook Index 3.2. Business Outlook Index
4. Employment Outlook 4.1. Net Employment Outlook 4.2. Net Employment Outlook Growth – by sector 4.3. Net Employment Outlook Growth – by city
5. Business Outlook 5.1. Net Business Outlook 5.2. Net Business Outlook Growth – by sector 5.3. Net Business Outlook Growth – by city
6. Hiring Intent 6.1. Hiring Intent by Location 6.2. Hiring Intent by Hierarchy 6.3. Hiring Intent by Functional Area
7. Other Trends 7.1. Employment Outlook Index – city-sector drilldown 7.2. Business Outlook Index – city-sector drilldown 7.3. Attrition trends by sector 7.4. Attrition trends by city
8. Annexure: Research Methodology 8.1. Sample Design 8.2. Respondent Selection 8.3. Data Collection 8.4. Secondary Sources
9. Sample Distribution 9.1. City-wise breakup 9.2. Business size-wise breakup
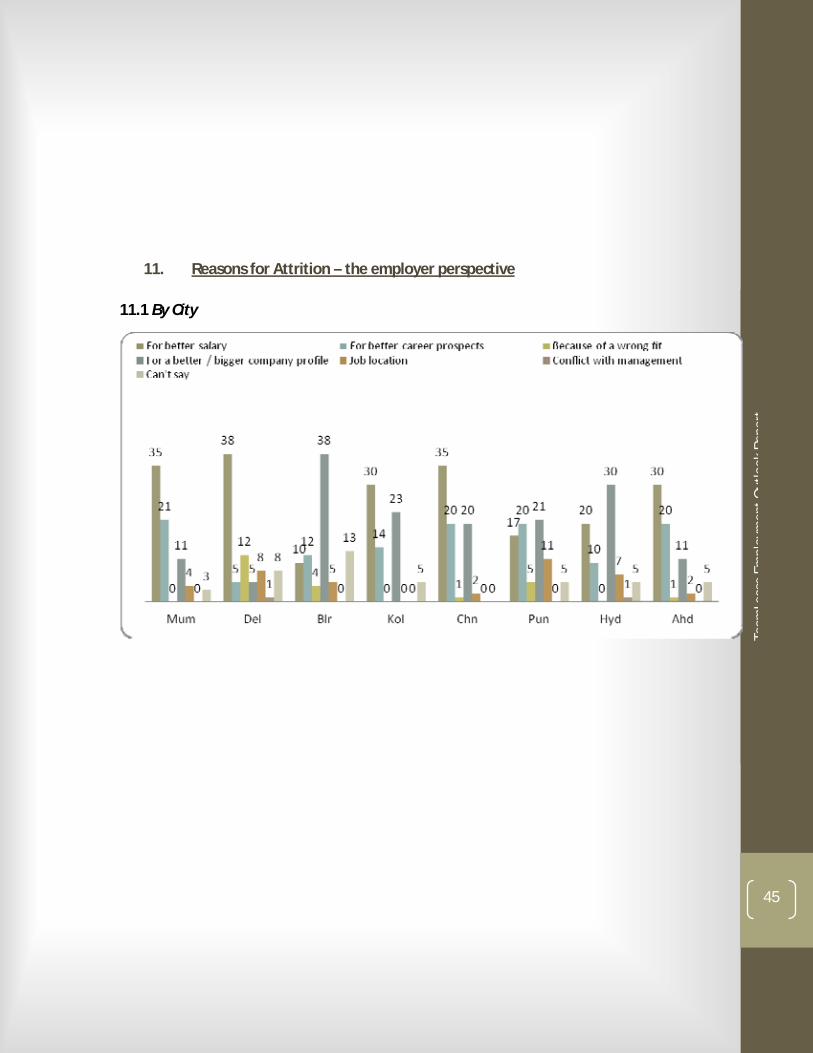
10. Literature Research findings – Business Growth trends 11. Reasons for Attrition – the employer perspective
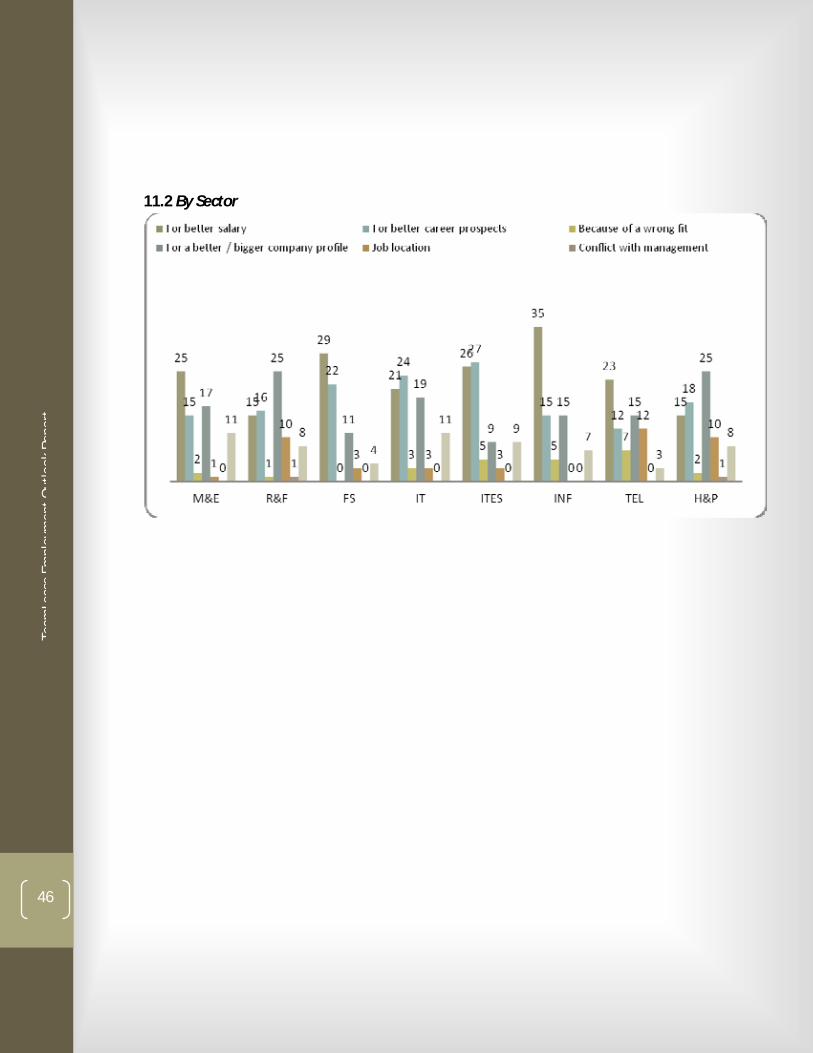
11.1. By city 11.2. By sector
Team
Leas
eEm
ploy
men
tOut
look
Repo
rt
3
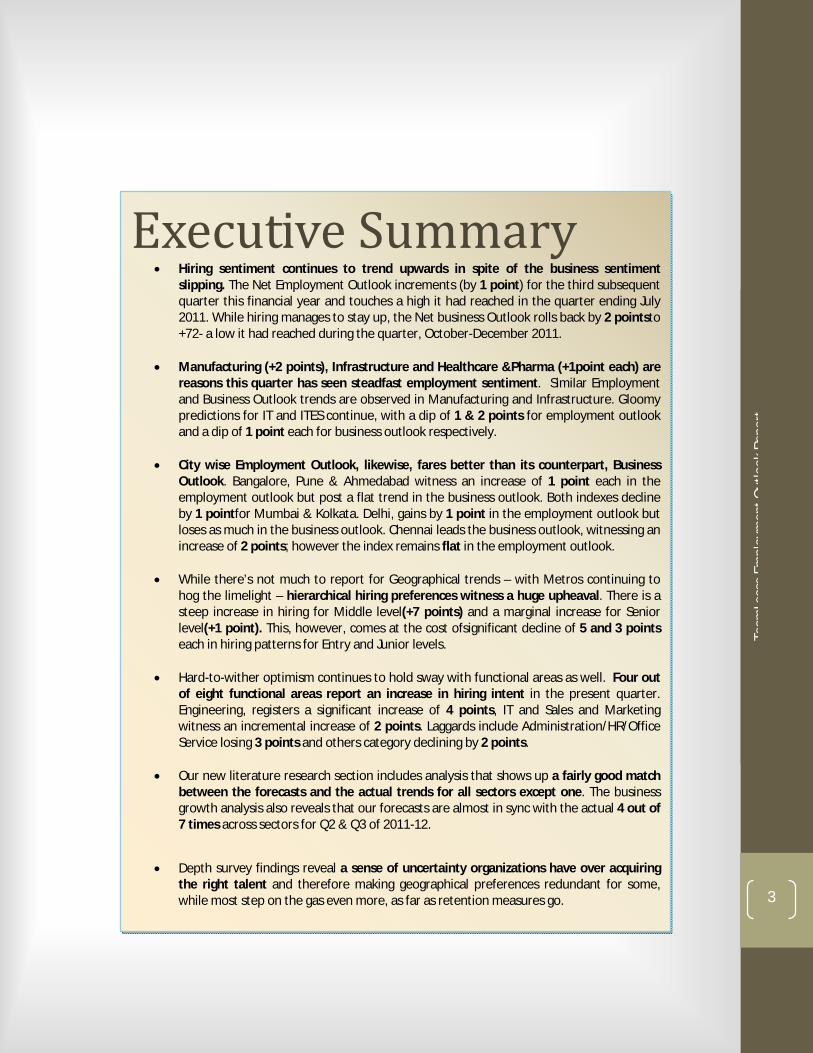
Executive Summary Hiring sentiment continues to trend upwards in spite of the business sentiment
slipping. The Net Employment Outlook increments (by 1 point) for the third subsequent quarter this financial year and touches a high it had reached in the quarter ending July 2011. While hiring manages to stay up, the Net business Outlook rolls back by 2 pointsto +72- a low it had reached during the quarter, October-December 2011.
Manufacturing (+2 points), Infrastructure and Healthcare &Pharma (+1point each) are
reasons this quarter has seen steadfast employment sentiment. Similar Employment and Business Outlook trends are observed in Manufacturing and Infrastructure. Gloomy predictions for IT and ITES continue, with a dip of 1 & 2 points for employment outlook and a dip of 1 point each for business outlook respectively.
City wise Employment Outlook, likewise, fares better than its counterpart, Business
Outlook. Bangalore, Pune & Ahmedabad witness an increase of 1 point each in the employment outlook but post a flat trend in the business outlook. Both indexes decline by 1 pointfor Mumbai & Kolkata. Delhi, gains by 1 point in the employment outlook but loses as much in the business outlook. Chennai leads the business outlook, witnessing an increase of 2 points; however the index remains flat in the employment outlook.
While there’s not much to report for Geographical trends – with Metros continuing to
hog the limelight – hierarchical hiring preferences witness a huge upheaval. There is a steep increase in hiring for Middle level(+7 points) and a marginal increase for Senior level(+1 point). This, however, comes at the cost ofsignificant decline of 5 and 3 points each in hiring patterns for Entry and Junior levels.
Hard-to-wither optimism continues to hold sway with functional areas as well. Four out
of eight functional areas report an increase in hiring intent in the present quarter. Engineering, registers a significant increase of 4 points, IT and Sales and Marketing witness an incremental increase of 2 points. Laggards include Administration/HR/Office Service losing 3 points and others category declining by 2 points.
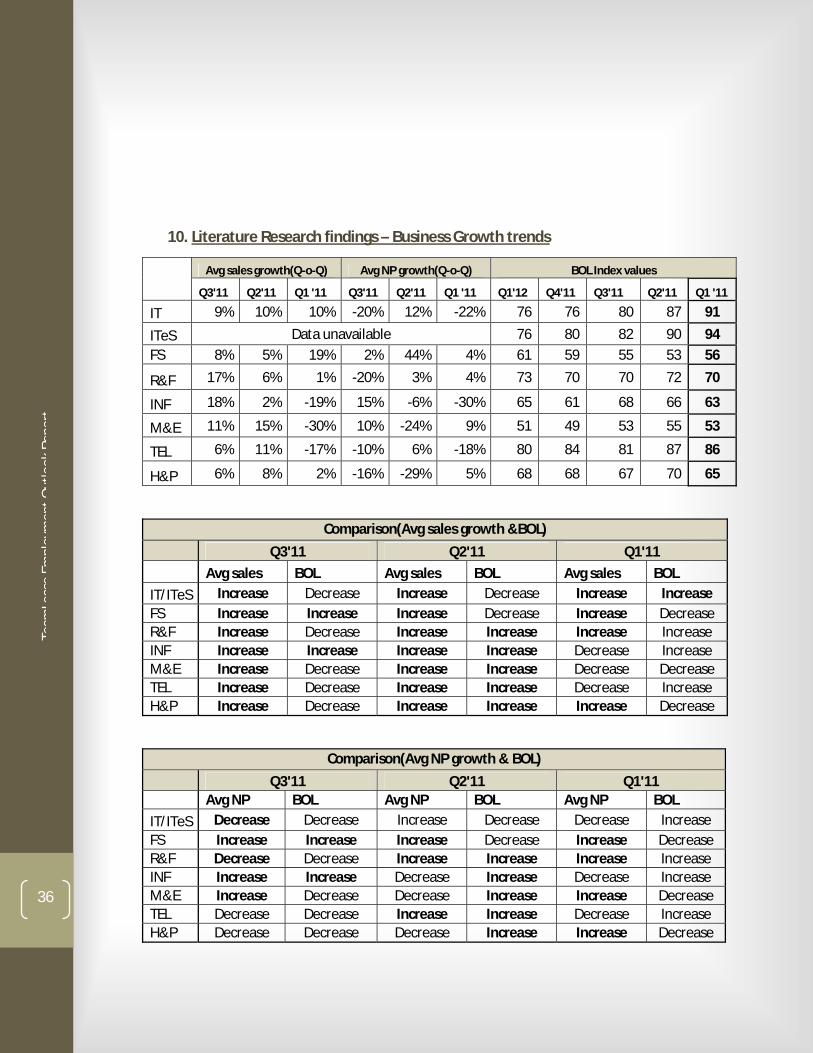
Our new literature research section includes analysis that shows up a fairly good match
between the forecasts and the actual trends for all sectors except one. The business growth analysis also reveals that our forecasts are almost in sync with the actual 4 out of 7 times across sectors for Q2 & Q3 of 2011-12.
Depth survey findings reveal a sense of uncertainty organizations have over acquiring the right talent and therefore making geographical preferences redundant for some, while most step on the gas even more, as far as retention measures go.
Team
Leas
eEm
ploy
men
tOut
look
Repo
rt
4
Project ObjectivesThe Employment Outlook Report aims at –
Providing forward looking estimates of hiring sentiment and thus enabling its users with a tool to make effective hiring / people decisions for the immediate next quarter.
Providing *Hiring Sentiment Intelligence* for different industry sectors, business sizes and geographies, as well as across hierarchical levels and functional areas.
Index Definitions Employment Outlook Index: The Employment Outlook Index is computed as the
difference in the proportion of respondents who report an increase in hiring needs and those who report a decline in hiring needs over the next three months.
Business Outlook Index: The Business Outlook Index is computed by subtracting the percentage respondents who say business in the next three months is likely to decrease from the percentage who say it will increase.
Team
Leas
eEm
ploy
men
tOut
look
Repo
rt
5
Team
Leas
eEm
ploy
men
tOut
look
Repo
rt
6
4.1 Net Employment Outlook
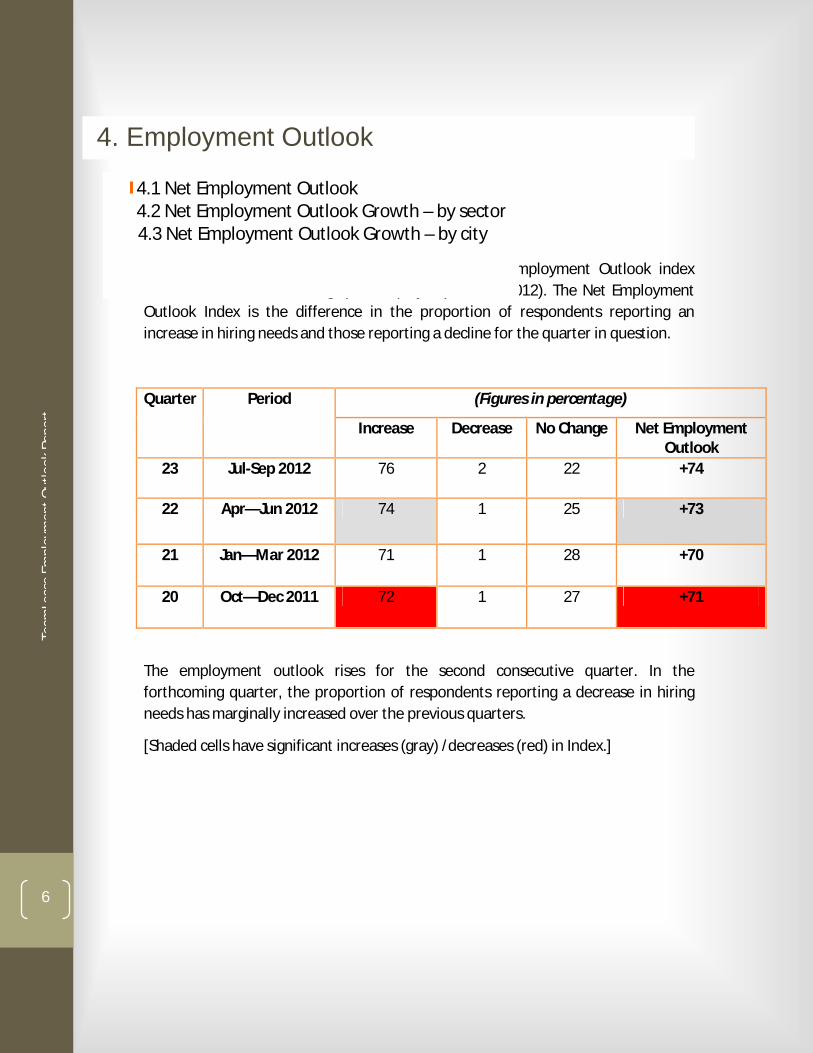
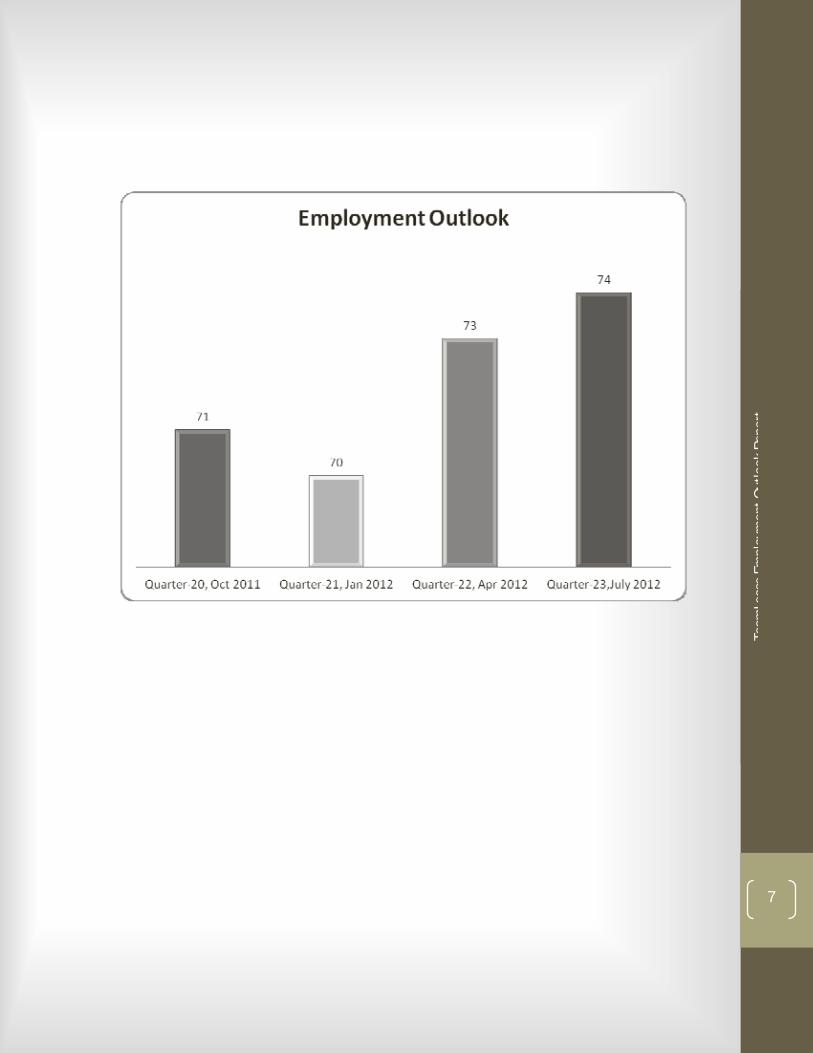
There is a 1 percentage point increase in the Net Employment Outlook index forecast for the forthcoming quarter (July-September 2012). The Net Employment Outlook Index is the difference in the proportion of respondents reporting an increase in hiring needs and those reporting a decline for the quarter in question.
(Figures in percentage) Quarter Period
Increase Decrease No Change Net Employment Outlook
23 Jul-Sep 2012 76 2 22 +74
22 Apr—Jun 2012 74 1 25 +73
21 Jan—Mar 2012 71 1 28 +70
20 Oct—Dec 2011 72 1 27 +71
The employment outlook rises for the second consecutive quarter. In the forthcoming quarter, the proportion of respondents reporting a decrease in hiring needs has marginally increased over the previous quarters.
[Shaded cells have significant increases (gray) /decreases (red) in Index.]
4. Employment Outlook
4.1 Net Employment Outlook4.2 Net Employment Outlook Growth – by sector
4.3 Net Employment Outlook Growth – by city
Team
Leas
eEm
ploy
men
tOut
look
Repo
rt
7
Team
Leas
eEm
ploy
men
tOut
look
Repo
rt
8
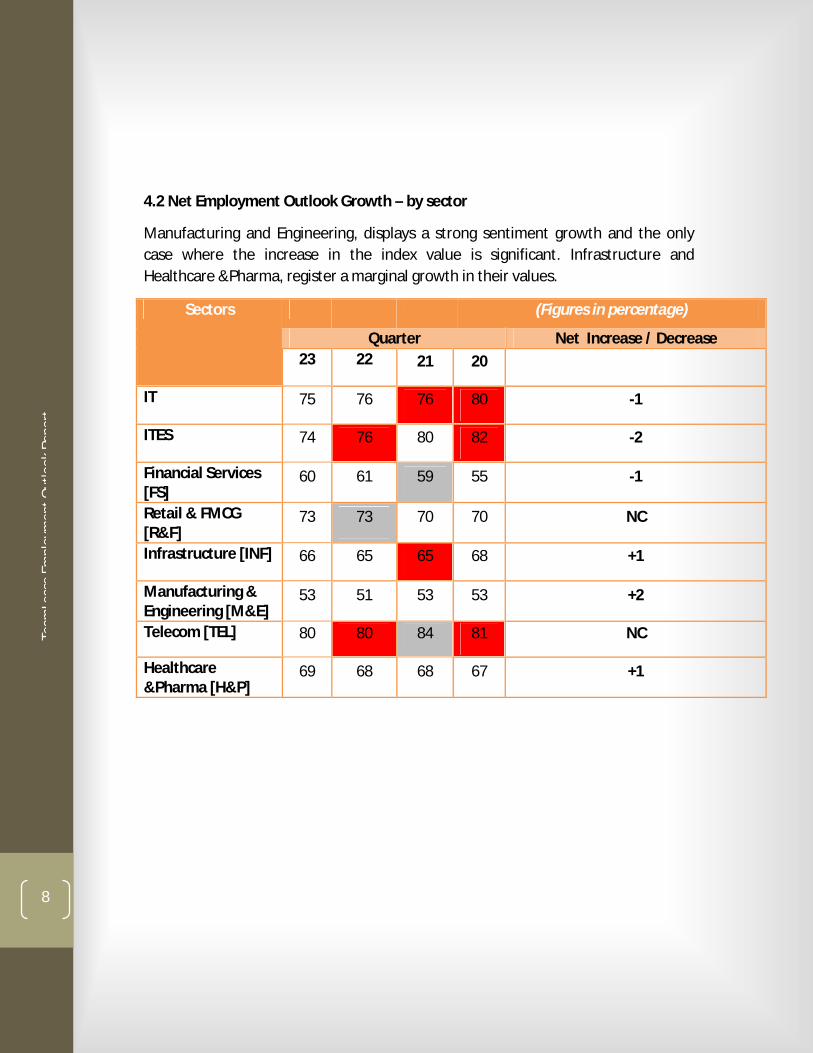
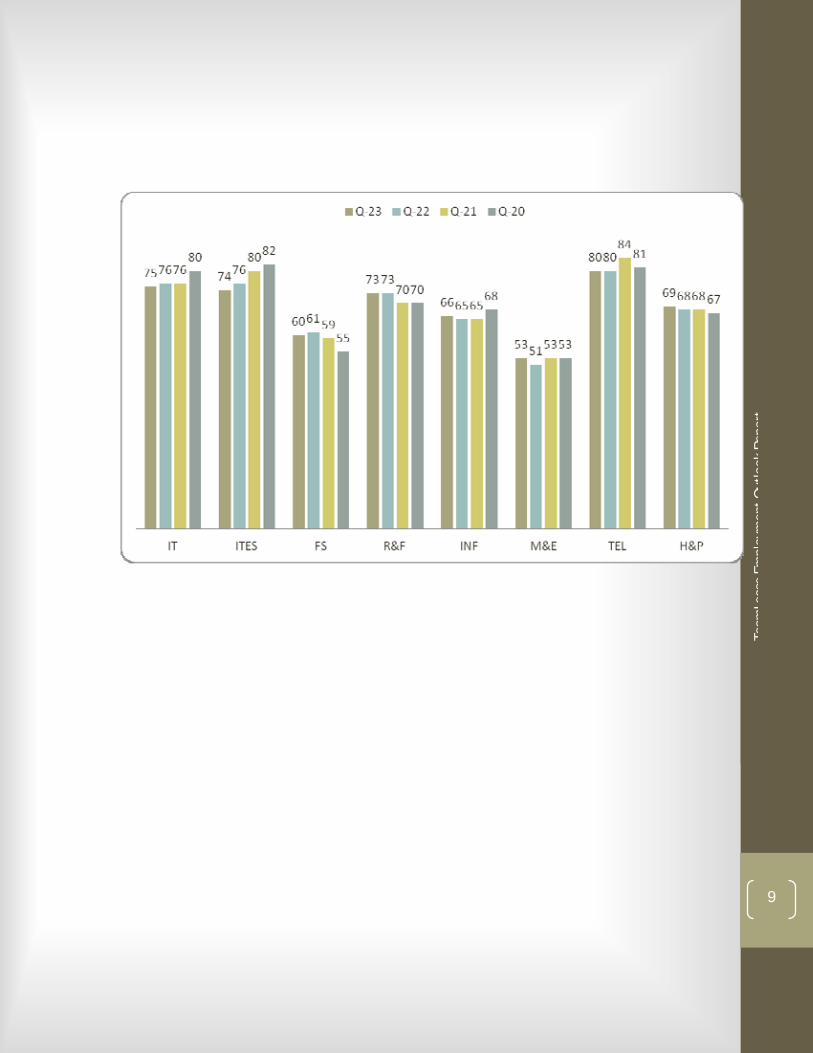
4.2 Net Employment Outlook Growth – by sector
Manufacturing and Engineering, displays a strong sentiment growth and the only case where the increase in the index value is significant. Infrastructure and Healthcare &Pharma, register a marginal growth in their values.
(Figures in percentage)
Quarter Net Increase / Decrease
Sectors
23 22 21 20
IT 75 76 76 80 -1
ITES 74 76 80 82 -2
Financial Services [FS]
60 61 59 55 -1
Retail & FMCG [R&F]
73 73 70 70 NC
Infrastructure [INF] 66 65 65 68 +1
Manufacturing & Engineering [M&E]
53 51 53 53 +2
Telecom [TEL] 80 80 84 81 NC
Healthcare &Pharma [H&P]
69 68 68 67 +1
Team
Leas
eEm
ploy
men
tOut
look
Repo
rt
9
Team
Leas
eEm
ploy
men
tOut
look
Repo
rt
10
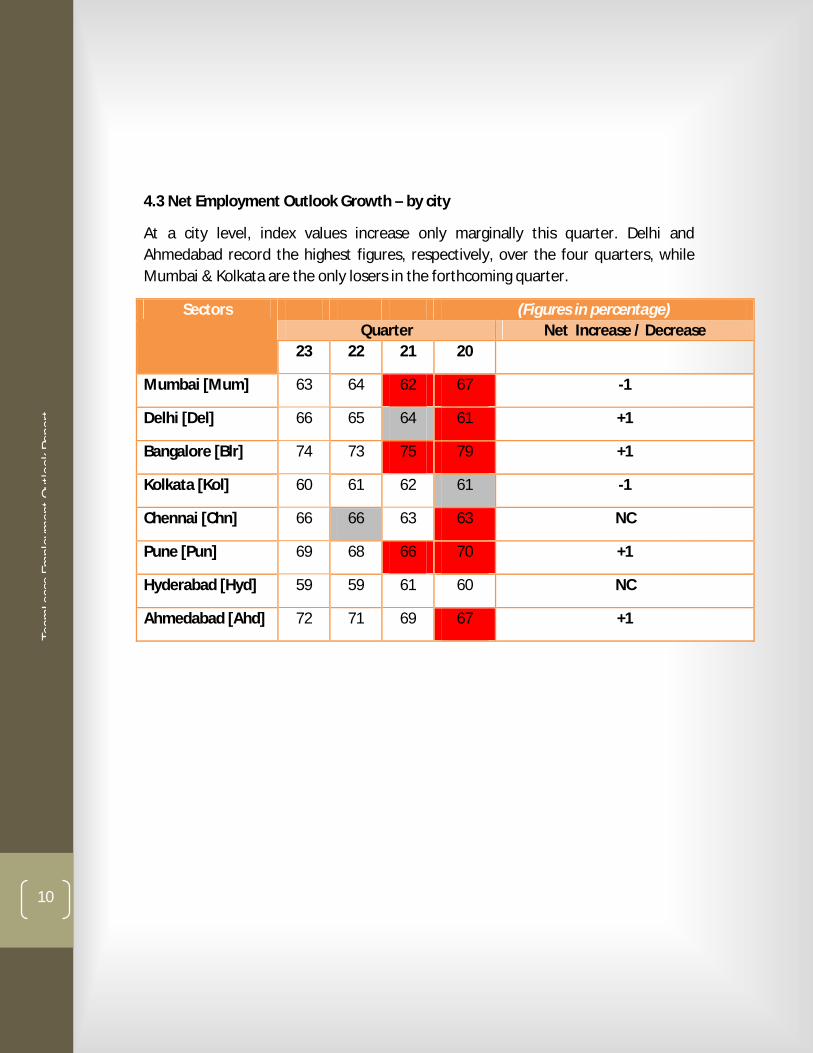
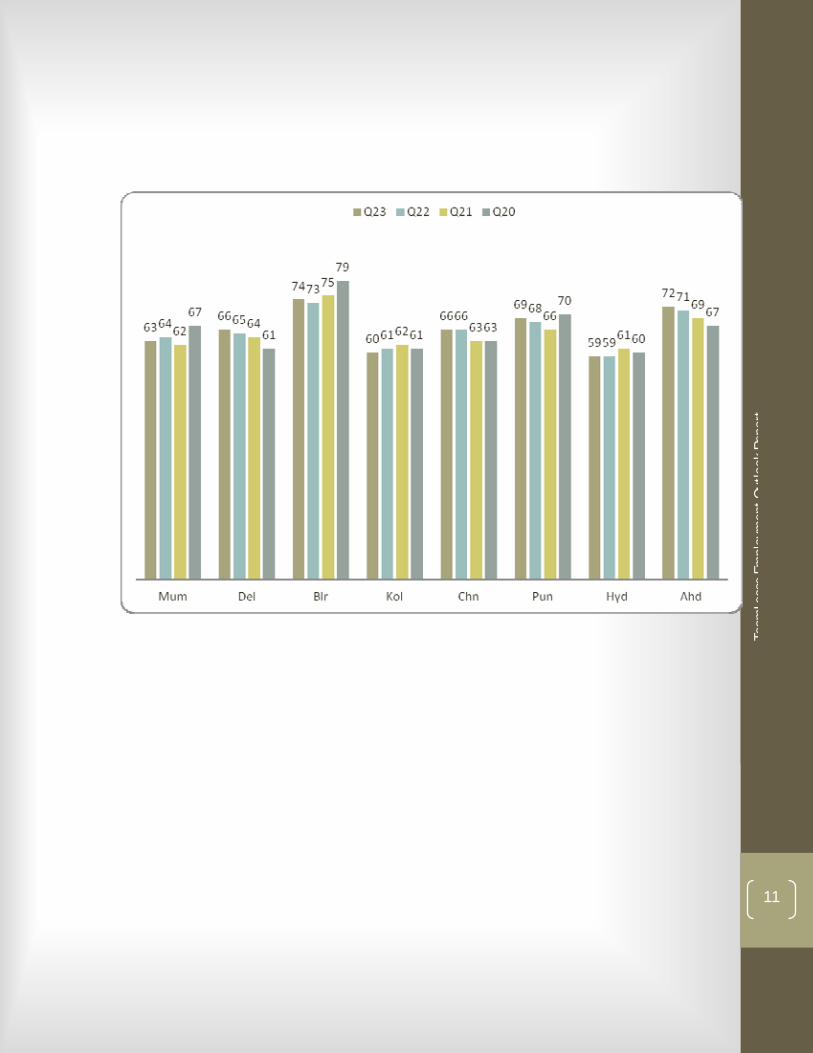
4.3 Net Employment Outlook Growth – by city
At a city level, index values increase only marginally this quarter. Delhi and Ahmedabad record the highest figures, respectively, over the four quarters, while Mumbai & Kolkata are the only losers in the forthcoming quarter.
(Figures in percentage) Quarter Net Increase / Decrease
Sectors
23 22 21 20
Mumbai [Mum] 63 64 62 67 -1
Delhi [Del] 66 65 64 61 +1
Bangalore [Blr] 74 73 75 79 +1
Kolkata [Kol] 60 61 62 61 -1
Chennai [Chn] 66 66 63 63 NC
Pune [Pun] 69 68 66 70 +1
Hyderabad [Hyd] 59 59 61 60 NC
Ahmedabad [Ahd] 72 71 69 67 +1
Team
Leas
eEm
ploy
men
tOut
look
Repo
rt
11
Team
Leas
eEm
ploy
men
tOut
look
Repo
rt
12
5. Business Outlook
5.1 Net Business Outlook5.2 Net Business Outlook Growth – by sector
5.3 Net Business Outlook Growth – by city
Team
Leas
eEm
ploy
men
tOut
look
Repo
rt
13
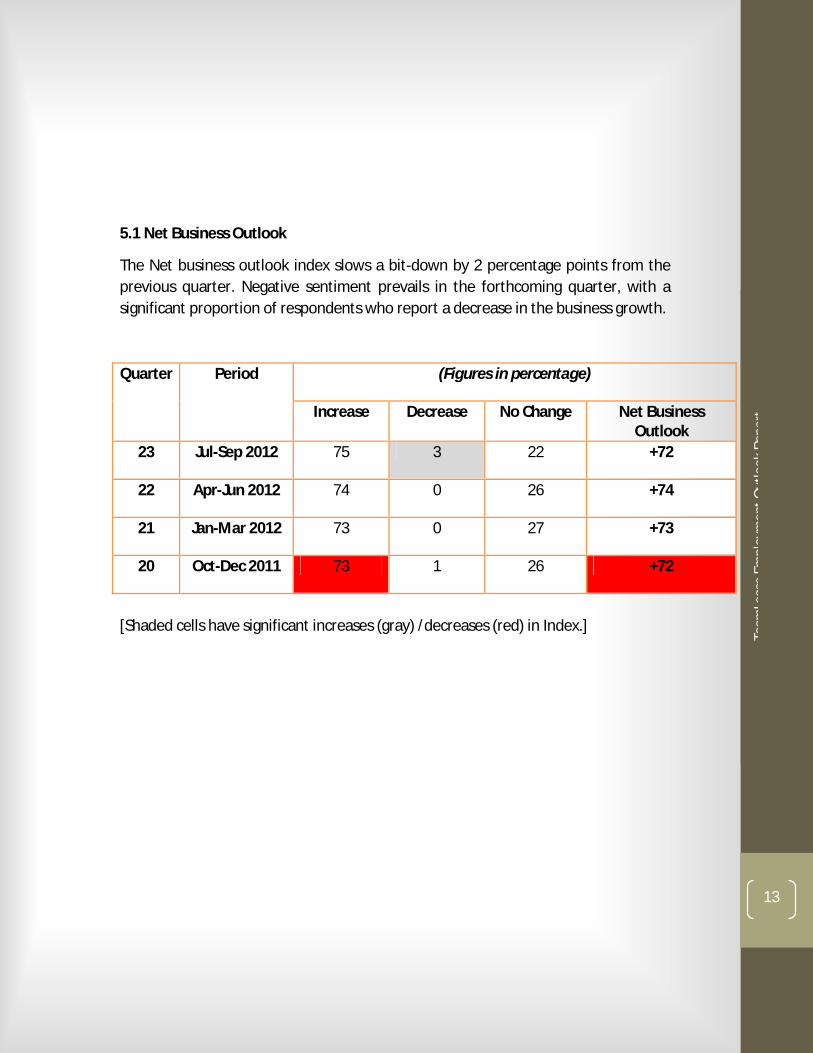
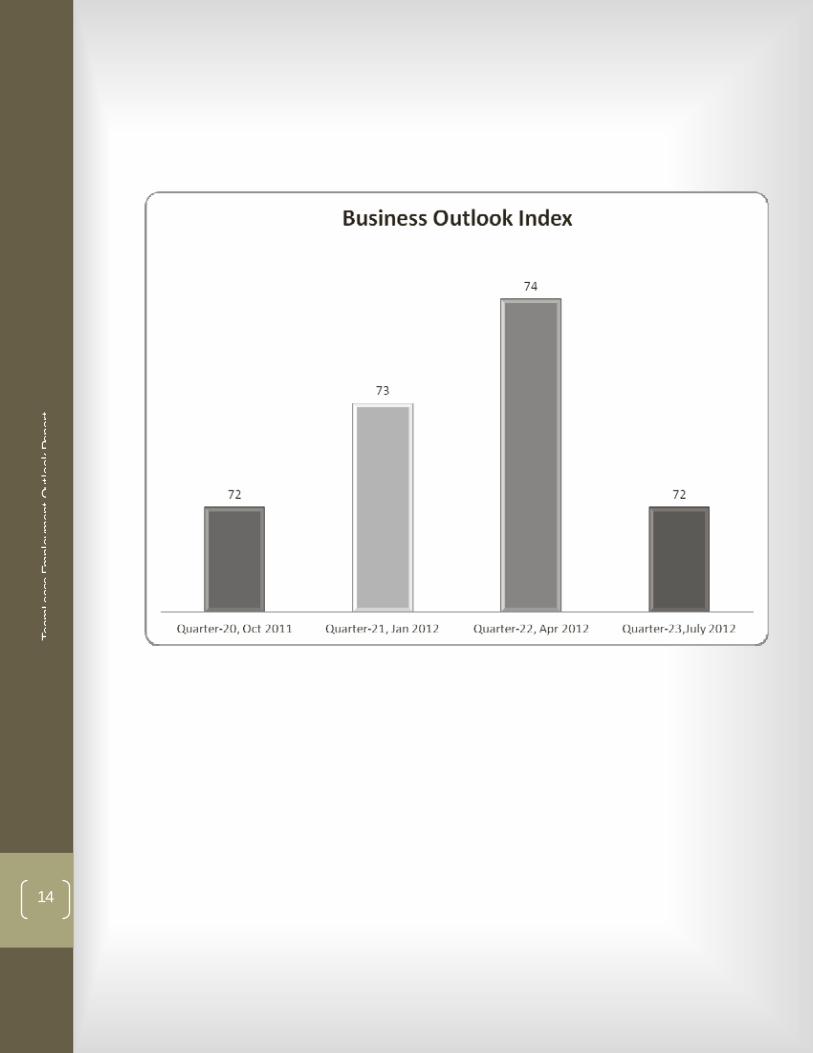
5.1 Net Business Outlook
The Net business outlook index slows a bit-down by 2 percentage points from the previous quarter. Negative sentiment prevails in the forthcoming quarter, with a significant proportion of respondents who report a decrease in the business growth.
(Figures in percentage) Quarter Period
Increase Decrease No Change Net Business Outlook
23 Jul-Sep 2012 75 3 22 +72
22 Apr-Jun 2012 74 0 26 +74
21 Jan-Mar 2012 73 0 27 +73
20 Oct-Dec 2011 73 1 26 +72
[Shaded cells have significant increases (gray) /decreases (red) in Index.]
Team
Leas
eEm
ploy
men
tOut
look
Repo
rt
14
Team
Leas
eEm
ploy
men
tOut
look
Repo
rt
15
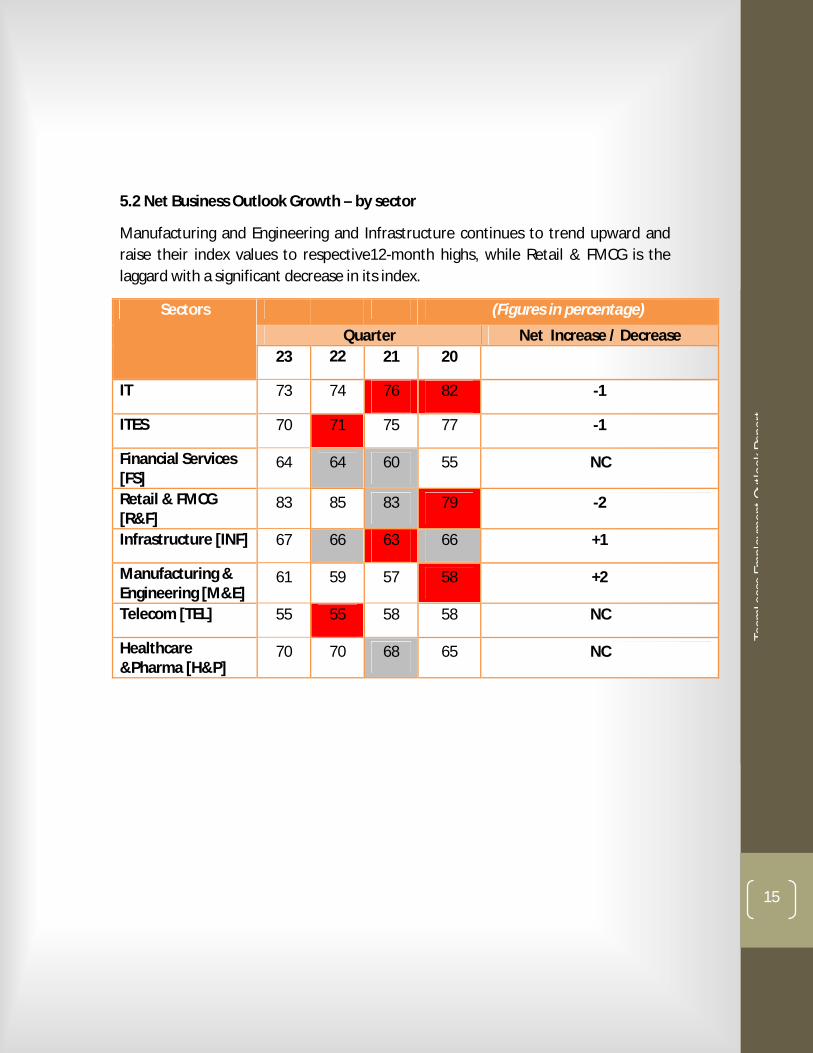
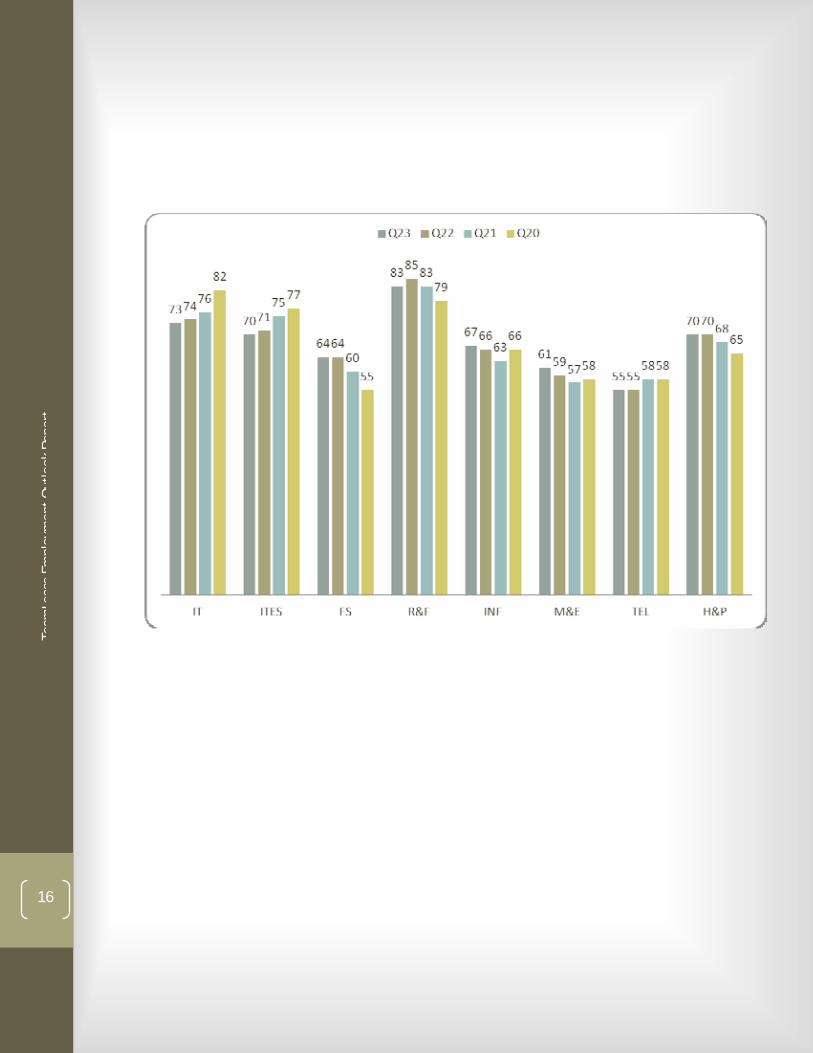
5.2 Net Business Outlook Growth – by sector
Manufacturing and Engineering and Infrastructure continues to trend upward and raise their index values to respective12-month highs, while Retail & FMCG is the laggard with a significant decrease in its index.
(Figures in percentage)
Quarter Net Increase / Decrease
Sectors
23 22 21 20
IT 73 74 76 82 -1
ITES 70 71 75 77 -1
Financial Services [FS]
64 64 60 55 NC
Retail & FMCG [R&F]
83 85 83 79 -2
Infrastructure [INF] 67 66 63 66 +1
Manufacturing & Engineering [M&E]
61 59 57 58 +2
Telecom [TEL] 55 55 58 58 NC
Healthcare &Pharma [H&P]
70 70 68 65 NC
Team
Leas
eEm
ploy
men
tOut
look
Repo
rt
16
Team
Leas
eEm
ploy
men
tOut
look
Repo
rt
17
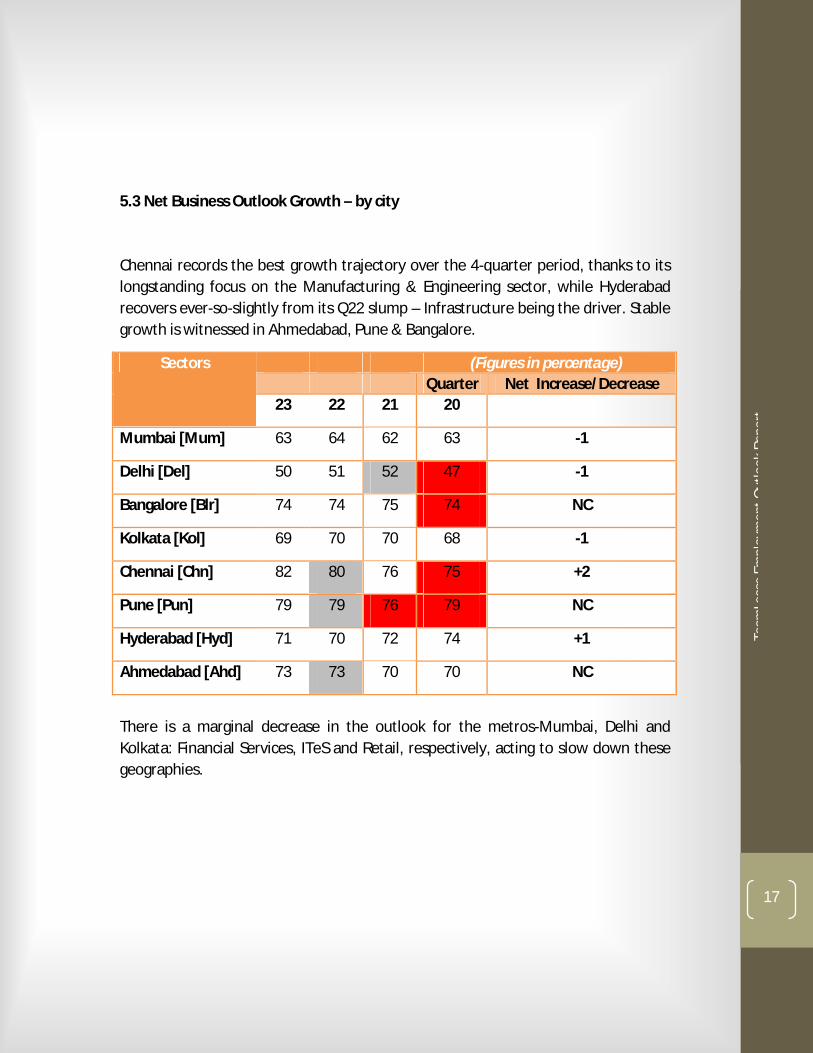
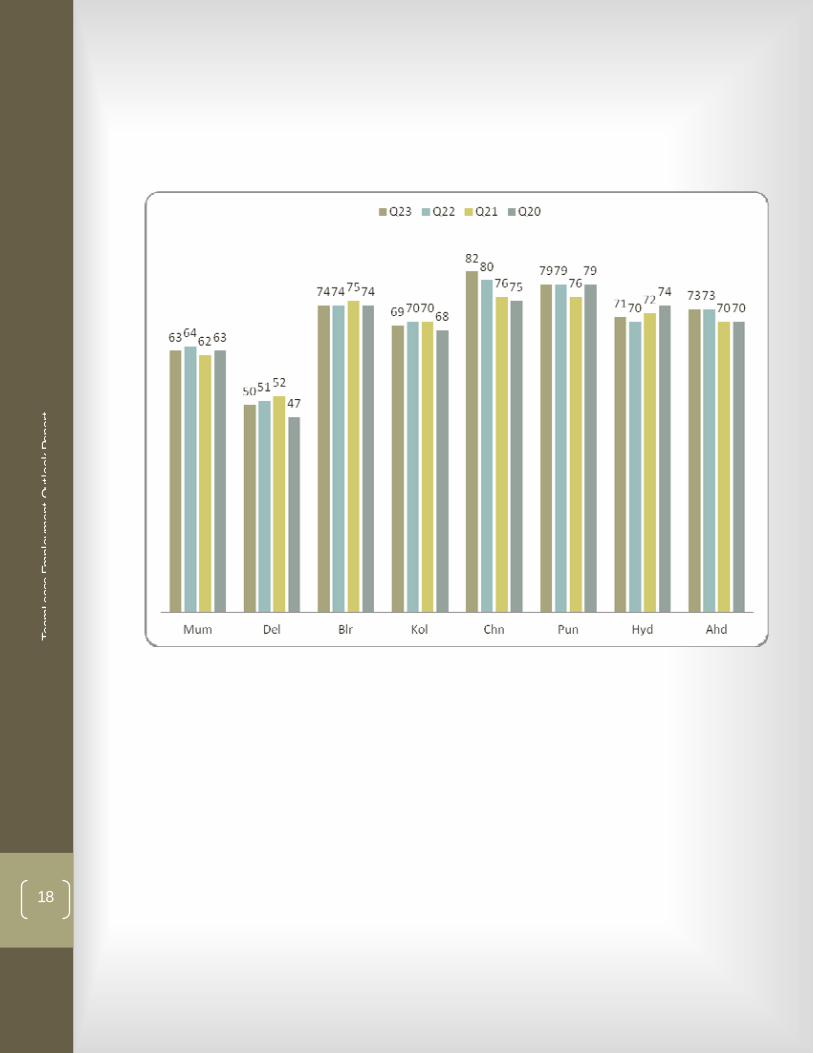
5.3 Net Business Outlook Growth – by city
Chennai records the best growth trajectory over the 4-quarter period, thanks to its longstanding focus on the Manufacturing & Engineering sector, while Hyderabad recovers ever-so-slightly from its Q22 slump – Infrastructure being the driver. Stable growth is witnessed in Ahmedabad, Pune & Bangalore.
(Figures in percentage) Quarter Net Increase/Decrease
Sectors
23 22 21 20
Mumbai [Mum] 63 64 62 63 -1
Delhi [Del] 50 51 52 47 -1
Bangalore [Blr] 74 74 75 74 NC
Kolkata [Kol] 69 70 70 68 -1
Chennai [Chn] 82 80 76 75 +2
Pune [Pun] 79 79 76 79 NC
Hyderabad [Hyd] 71 70 72 74 +1
Ahmedabad [Ahd] 73 73 70 70 NC
There is a marginal decrease in the outlook for the metros-Mumbai, Delhi and Kolkata: Financial Services, ITeS and Retail, respectively, acting to slow down these geographies.
Team
Leas
eEm
ploy
men
tOut
look
Repo
rt
18
Team
Leas
eEm
ploy
men
tOut
look
Repo
rt
19
6. Hiring Intent
6.1 Hiring Intent by Geography6.2 Hiring Intent by Hierarchy 6.3Hiring Intent by Functional Area
Team
Leas
eEm
ploy
men
tOut
look
Repo
rt
20
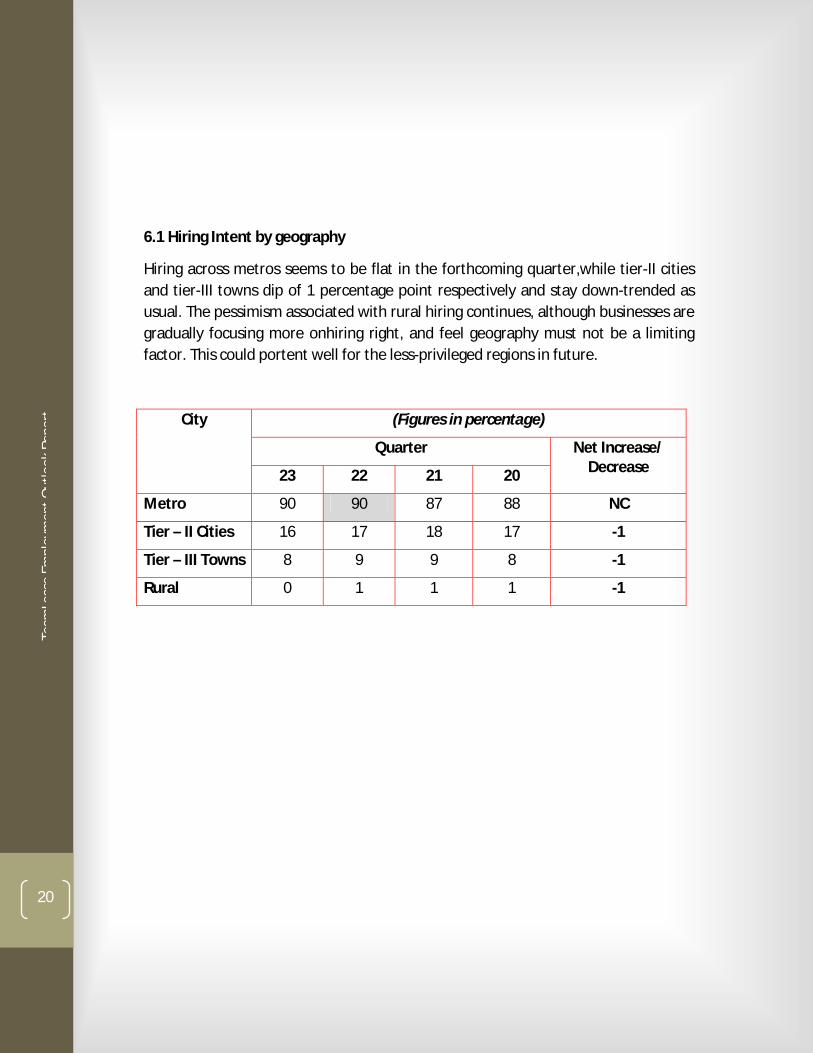
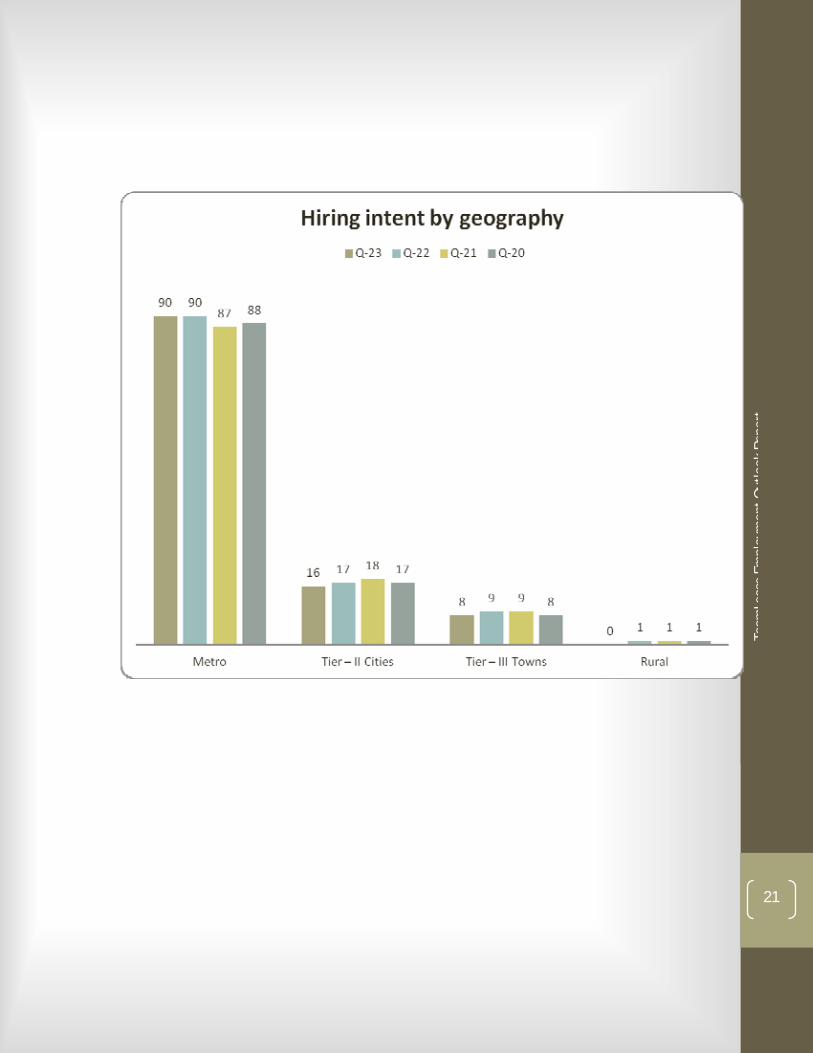
6.1 Hiring Intent by geography
Hiring across metros seems to be flat in the forthcoming quarter,while tier-II cities and tier-III towns dip of 1 percentage point respectively and stay down-trended as usual. The pessimism associated with rural hiring continues, although businesses are gradually focusing more onhiring right, and feel geography must not be a limiting factor. This could portent well for the less-privileged regions in future.
(Figures in percentage)
Quarter
City
23 22 21 20
Net Increase/ Decrease
Metro 90 90 87 88 NC
Tier – II Cities 16 17 18 17 -1
Tier – III Towns 8 9 9 8 -1
Rural 0 1 1 1 -1
Team
Leas
eEm
ploy
men
tOut
look
Repo
rt
21
Team
Leas
eEm
ploy
men
tOut
look
Repo
rt
22
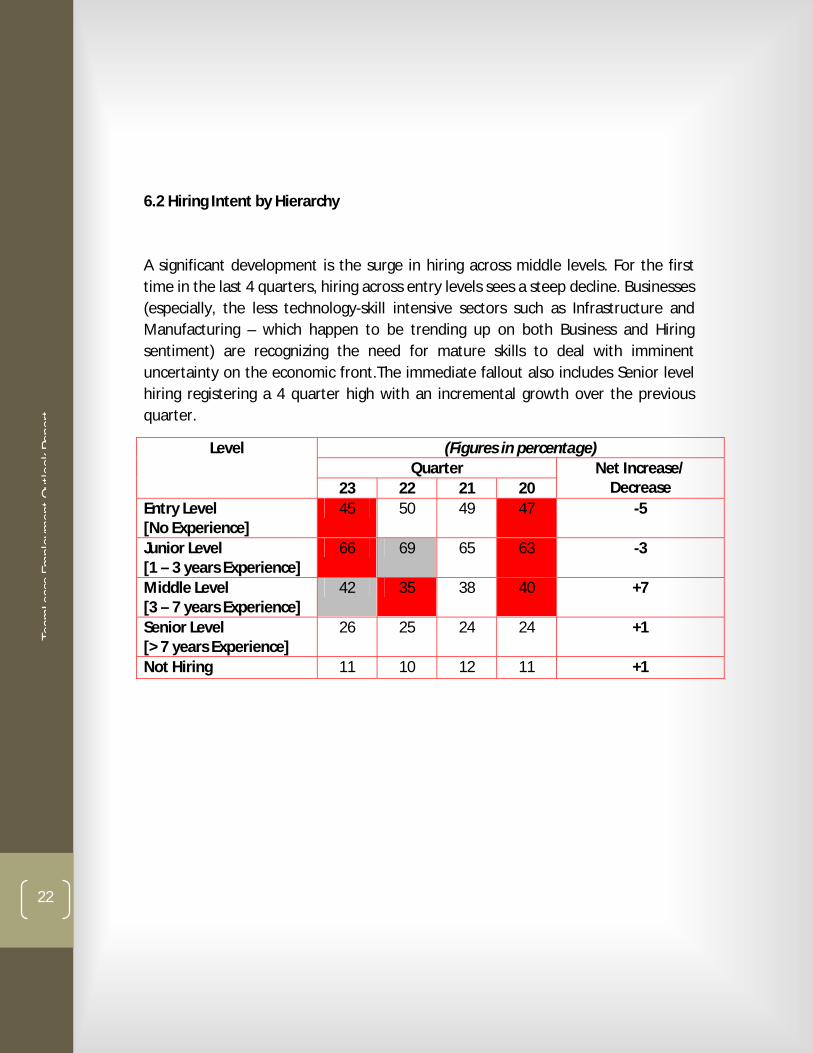
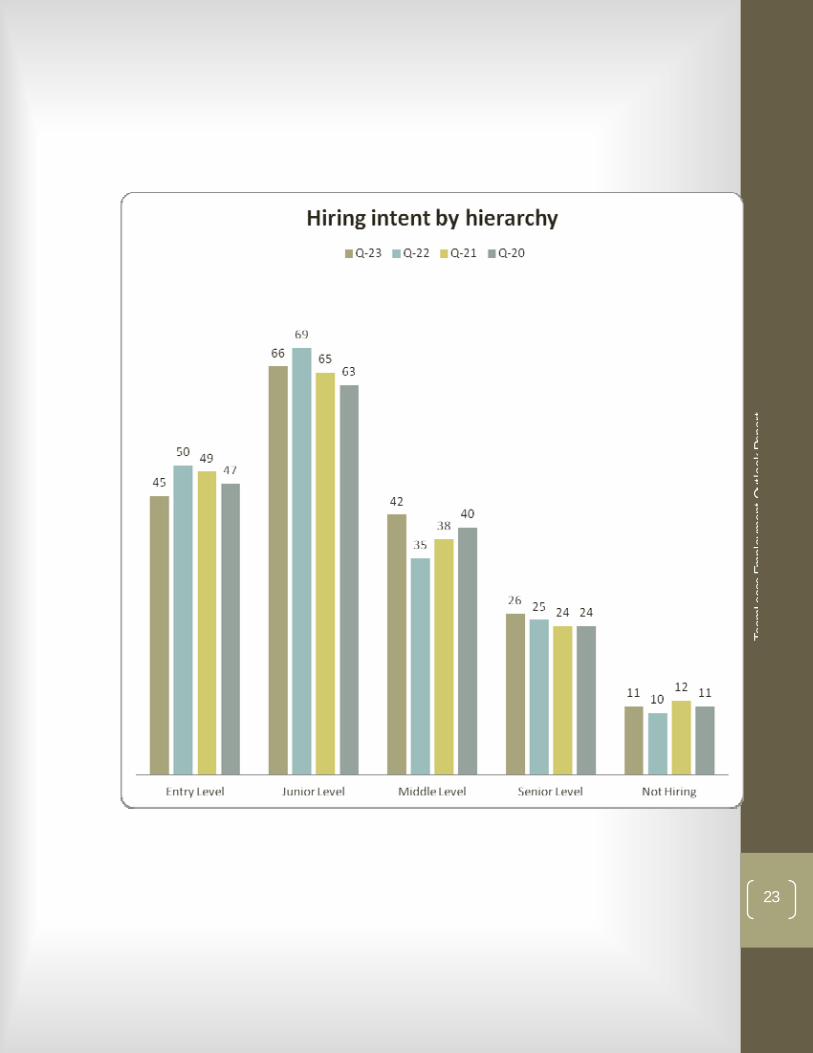
6.2 Hiring Intent by Hierarchy
A significant development is the surge in hiring across middle levels. For the first time in the last 4 quarters, hiring across entry levels sees a steep decline. Businesses (especially, the less technology-skill intensive sectors such as Infrastructure and Manufacturing – which happen to be trending up on both Business and Hiring sentiment) are recognizing the need for mature skills to deal with imminent uncertainty on the economic front.The immediate fallout also includes Senior level hiring registering a 4 quarter high with an incremental growth over the previous quarter.
(Figures in percentage) Quarter
Level
23 22 21 20 Net Increase/
Decrease Entry Level [No Experience]
45 50 49 47 -5
Junior Level [1 – 3 years Experience]
66 69 65 63 -3
Middle Level [3 – 7 years Experience]
42 35 38 40 +7
Senior Level [> 7 years Experience]
26 25 24 24 +1
Not Hiring 11 10 12 11 +1
Team
Leas
eEm
ploy
men
tOut
look
Repo
rt
23
Team
Leas
eEm
ploy
men
tOut
look
Repo
rt
24
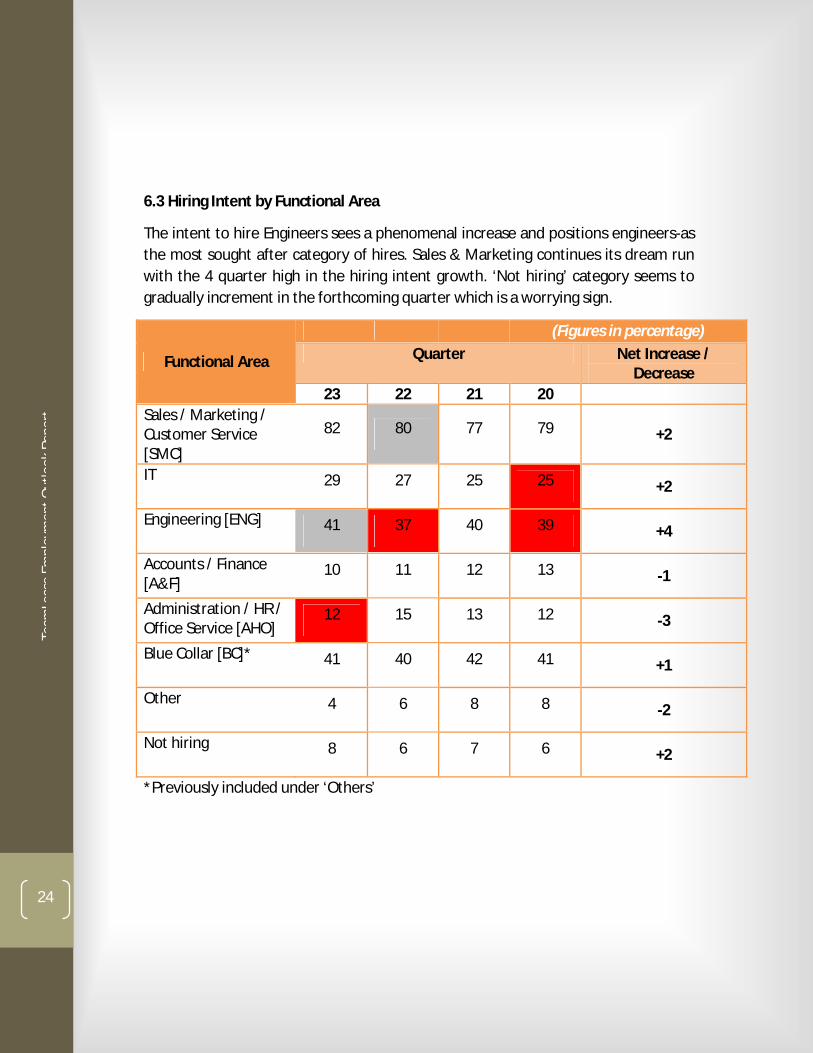
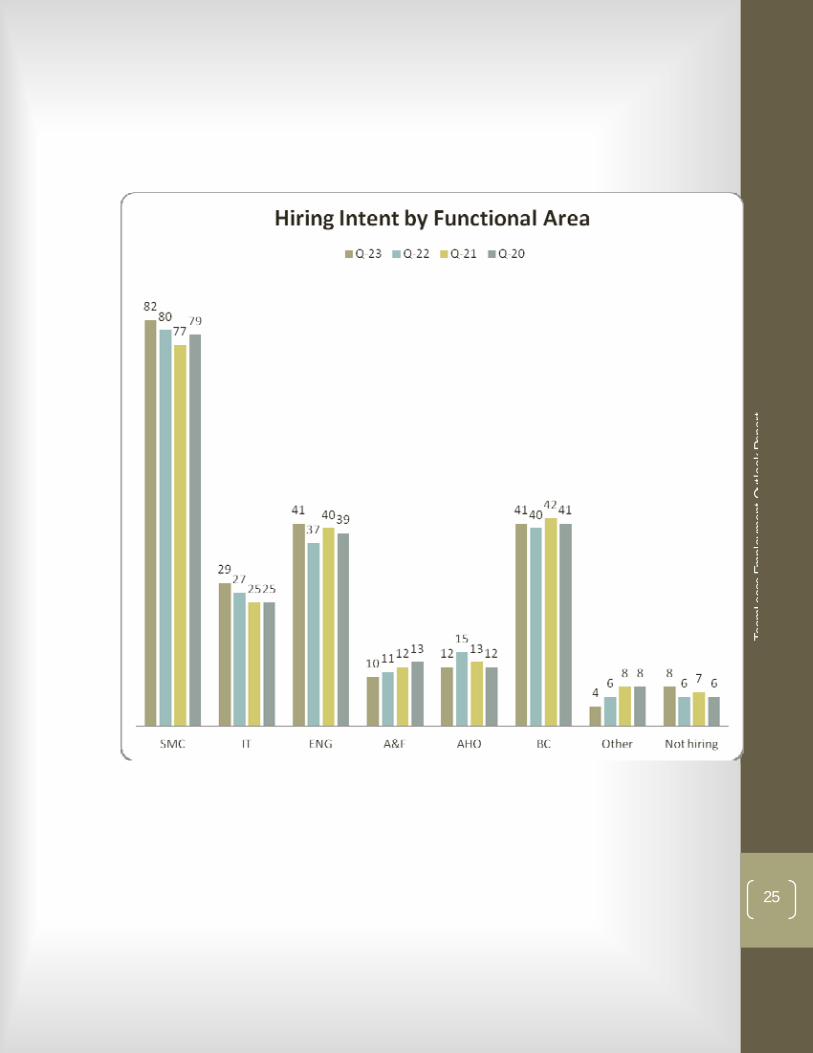
6.3 Hiring Intent by Functional Area
The intent to hire Engineers sees a phenomenal increase and positions engineers-as the most sought after category of hires. Sales & Marketing continues its dream run with the 4 quarter high in the hiring intent growth. ‘Not hiring’ category seems to gradually increment in the forthcoming quarter which is a worrying sign.
7.1 Employment Outlook Index – city-sector drilldown 7.2 Business Outlook Index – city-sector drilldown 7.3 Attrition trends by sector 7.4 Attrition trends by city
Team
Leas
eEm
ploy
men
tOut
look
Repo
rt
27
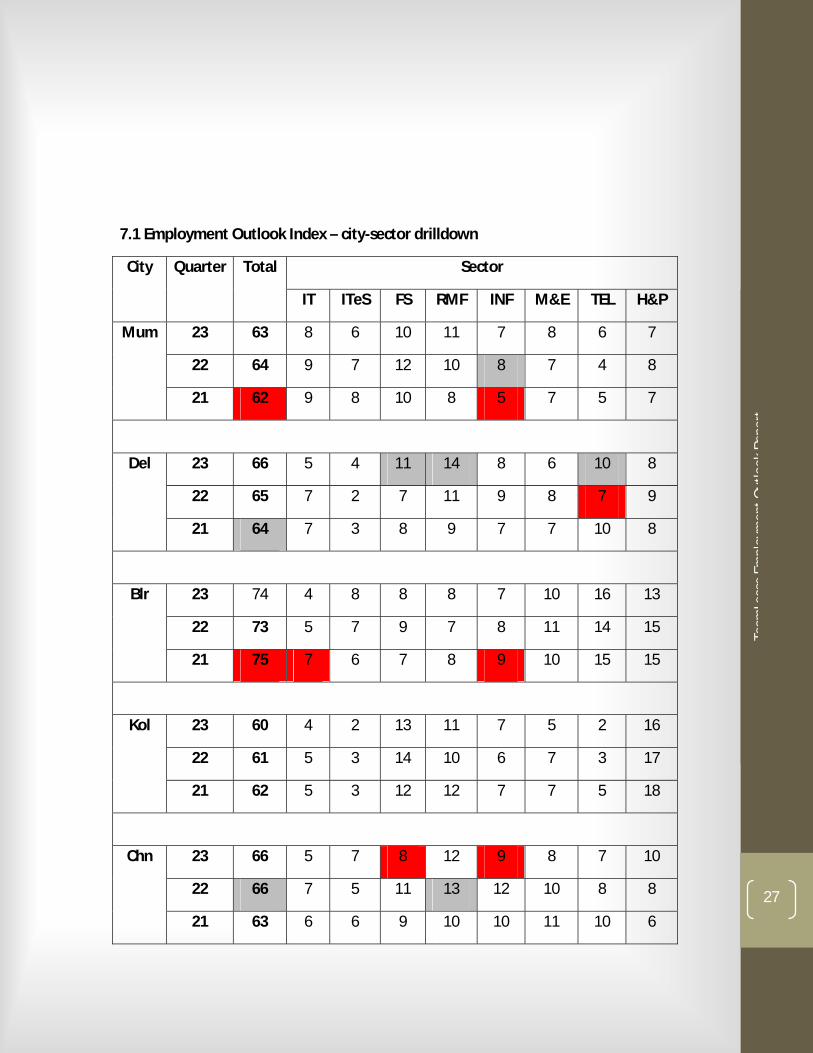
7.1 Employment Outlook Index – city-sector drilldown
Sector City Quarter Total
IT ITeS FS RMF INF M&E TEL H&P
23 63 8 6 10 11 7 8 6 7
22 64 9 7 12 10 8 7 4 8
Mum
21 62 9 8 10 8 5 7 5 7
23 66 5 4 11 14 8 6 10 8
22 65 7 2 7 11 9 8 7 9
Del
21 64 7 3 8 9 7 7 10 8
23 74 4 8 8 8 7 10 16 13
22 73 5 7 9 7 8 11 14 15
Blr
21 75 7 6 7 8 9 10 15 15
23 60 4 2 13 11 7 5 2 16
22 61 5 3 14 10 6 7 3 17
Kol
21 62 5 3 12 12 7 7 5 18
23 66 5 7 8 12 9 8 7 10
22 66 7 5 11 13 12 10 8 8
Chn
21 63 6 6 9 10 10 11 10 6
Team
Leas
eEm
ploy
men
tOut
look
Repo
rt
28
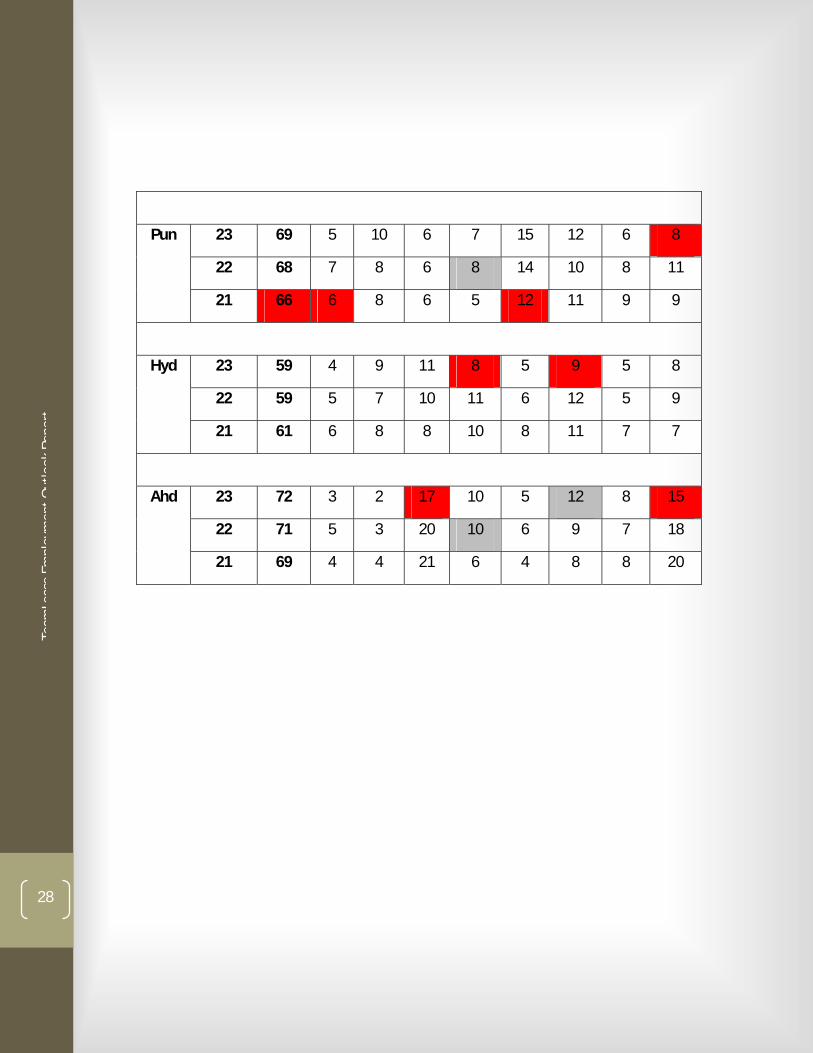
23 69 5 10 6 7 15 12 6 8
22 68 7 8 6 8 14 10 8 11
Pun
21 66 6 8 6 5 12 11 9 9
23 59 4 9 11 8 5 9 5 8
22 59 5 7 10 11 6 12 5 9
Hyd
21 61 6 8 8 10 8 11 7 7
23 72 3 2 17 10 5 12 8 15
22 71 5 3 20 10 6 9 7 18
Ahd
21 69 4 4 21 6 4 8 8 20
Team
Leas
eEm
ploy
men
tOut
look
Repo
rt
29
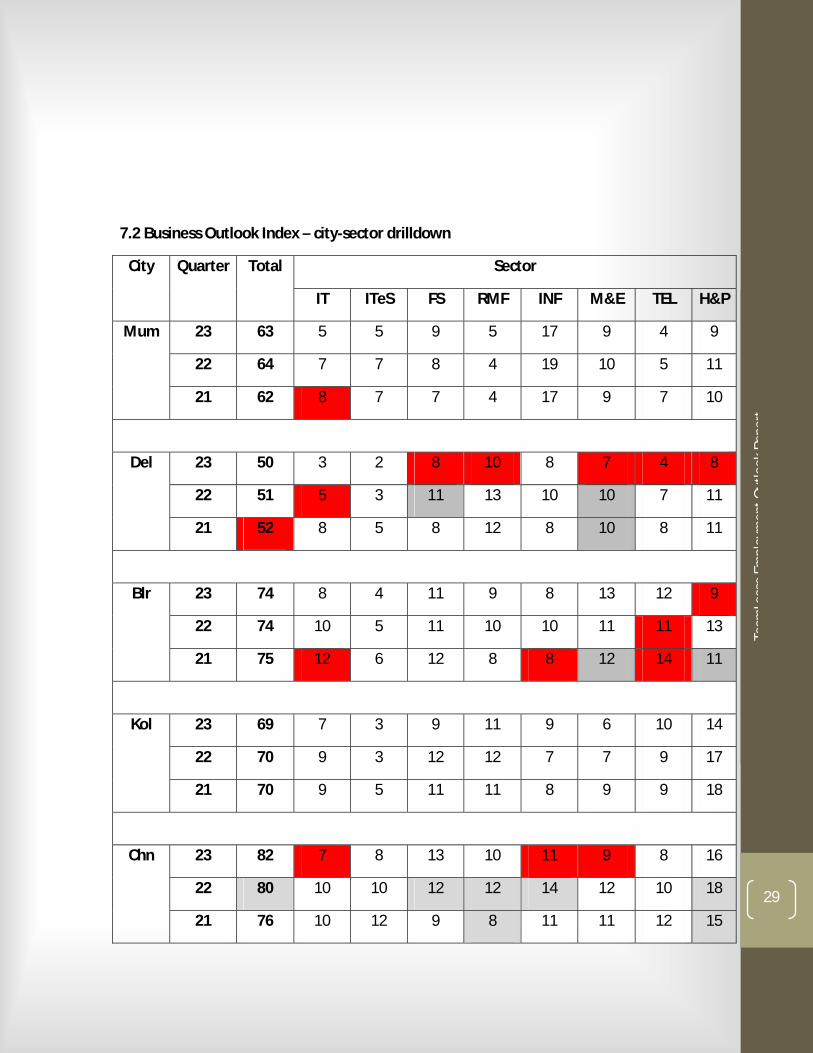
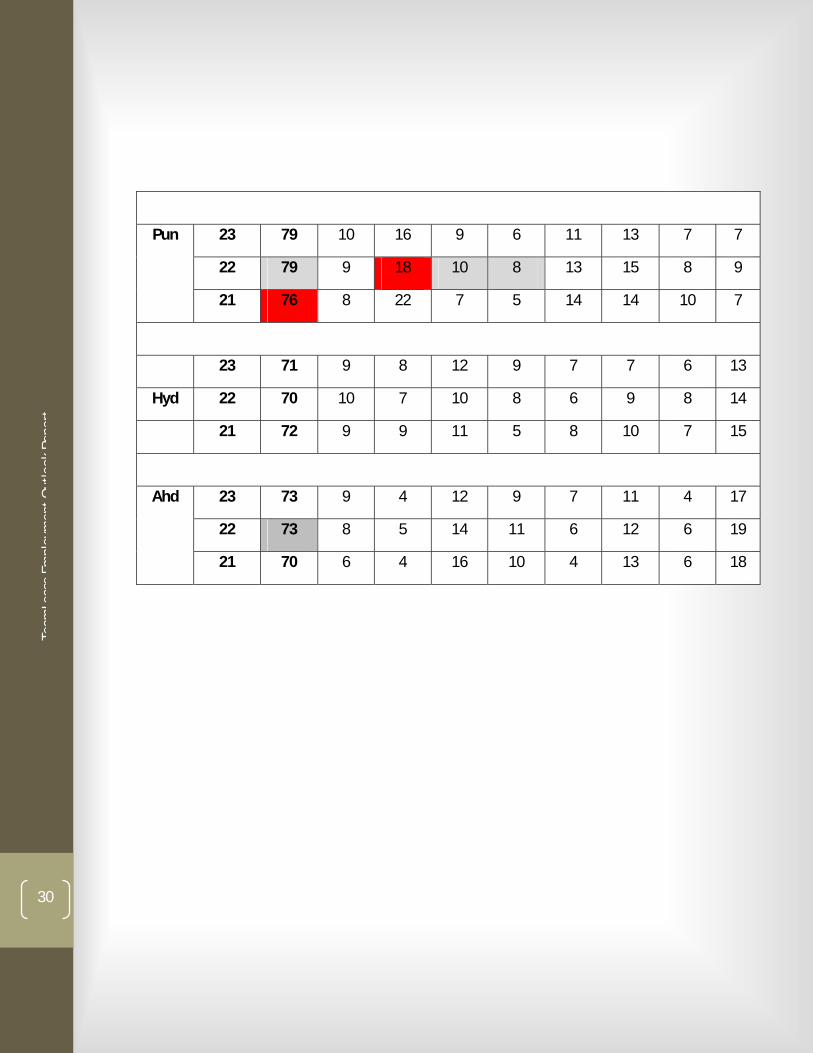
7.2 Business Outlook Index – city-sector drilldown
Sector City Quarter Total
IT ITeS FS RMF INF M&E TEL H&P
23 63 5 5 9 5 17 9 4 9
22 64 7 7 8 4 19 10 5 11
Mum
21 62 8 7 7 4 17 9 7 10
23 50 3 2 8 10 8 7 4 8
22 51 5 3 11 13 10 10 7 11
Del
21 52 8 5 8 12 8 10 8 11
23 74 8 4 11 9 8 13 12 9
22 74 10 5 11 10 10 11 11 13
Blr
21 75 12 6 12 8 8 12 14 11
23 69 7 3 9 11 9 6 10 14
22 70 9 3 12 12 7 7 9 17
Kol
21 70 9 5 11 11 8 9 9 18
23 82 7 8 13 10 11 9 8 16
22 80 10 10 12 12 14 12 10 18
Chn
21 76 10 12 9 8 11 11 12 15
Team
Leas
eEm
ploy
men
tOut
look
Repo
rt
30
23 79 10 16 9 6 11 13 7 7
22 79 9 18 10 8 13 15 8 9
Pun
21 76 8 22 7 5 14 14 10 7
23 71 9 8 12 9 7 7 6 13
Hyd 22 70 10 7 10 8 6 9 8 14
21 72 9 9 11 5 8 10 7 15
23 73 9 4 12 9 7 11 4 17
22 73 8 5 14 11 6 12 6 19
Ahd
21 70 6 4 16 10 4 13 6 18
Team
Leas
eEm
ploy
men
tOut
look
Repo
rt
31
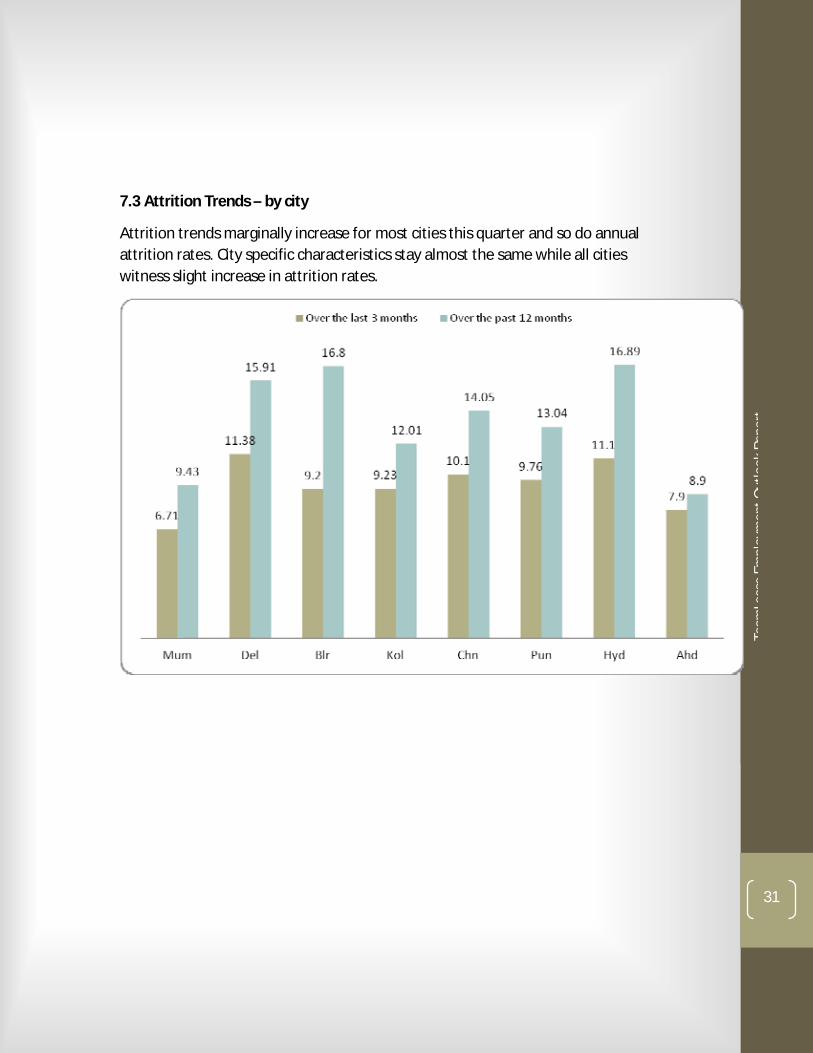
7.3 Attrition Trends – by city
Attrition trends marginally increase for most cities this quarter and so do annual attrition rates. City specific characteristics stay almost the same while all cities witness slight increase in attrition rates.
Team
Leas
eEm
ploy
men
tOut
look
Repo
rt
32
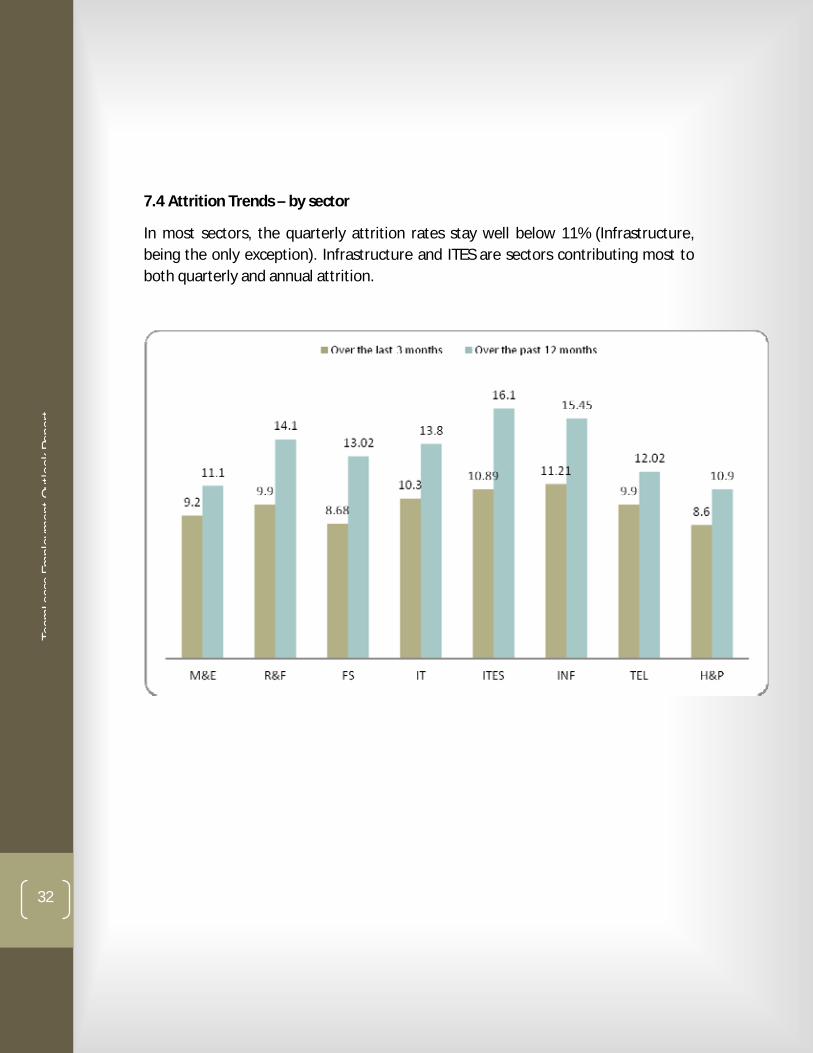
7.4 Attrition Trends – by sector
In most sectors, the quarterly attrition rates stay well below 11% (Infrastructure, being the only exception). Infrastructure and ITES are sectors contributing most to both quarterly and annual attrition.
Team
Leas
eEm
ploy
men
tOut
look
Repo
rt
33
8.AnnexureResearch Methodology
The Employment Outlook Survey follows a rigorous and statistically validated process as detailed below.
8.1 Sample Design
Random sampling technique was used to identify respondents for the survey. Data sources used to collect contact data were:
1. Kompass directory for small, medium and large sized companies in the private sector. To ensure continuity with the baseline measurement, the core random sample was drawn from this database.
2. NASSCOM database for IT companies
3. Companies registered withbpo.india.org in the case of ITES and
4. Financial companies registered with the Bombay Stock Exchange (BSE).
8.2 Respondent Selection
Target respondents for the study were Business & HR Heads as well as Senior Managers with hiring mandates. The databases offered a contact name for each company listed. Interviewers called into each of these companies and obtained the names of the appropriate individuals who were responsible for hiring decisions.
8.3Data Collection
The survey instrument was then administered to the target respondents using the CATI (Computer Aided Telephonic Interview) methodology. Appropriate computer software was used for data collection and tabulation. Please refer the following section named ‘Sample Distribution’ for details on city and business size-wise breakup of the sample.
8.4 Secondary Data Sources:
1. BSE and NSE websites
2. Moneycontrol.com
3. Times of India
4. Business Today
5. Business Standard
6. Live mint
Team
Leas
eEm
ploy
men
tOut
look
Repo
rt
34
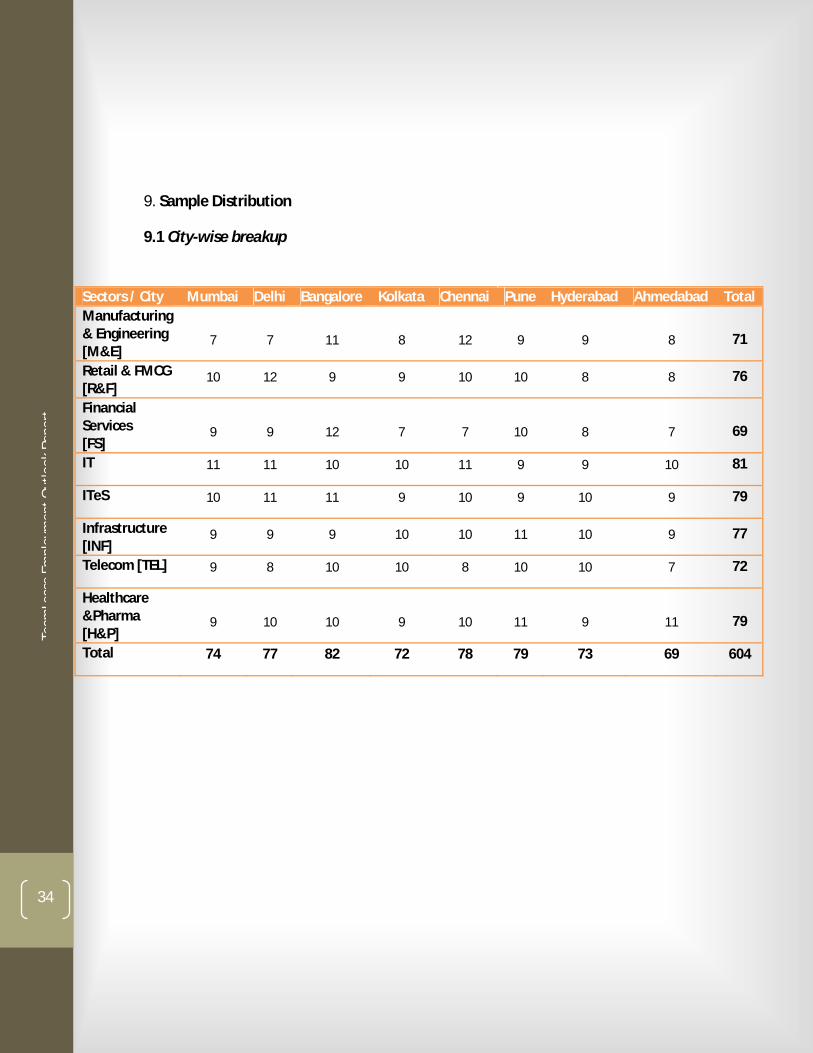
9. Sample Distribution
9.1 City-wise breakup
Sectors / City Mumbai Delhi Bangalore Kolkata Chennai Pune Hyderabad Ahmedabad Total Manufacturing & Engineering [M&E]
7 7 11 8 12 9 9 8 71
Retail & FMCG [R&F]
10 12 9 9 10 10 8 8 76
Financial Services [FS]
9 9 12 7 7 10 8 7 69
IT 11 11 10 10 11 9 9 10 81
ITeS 10 11 11 9 10 9 10 9 79
Infrastructure [INF]
9 9 9 10 10 11 10 9 77
Telecom [TEL] 9 8 10 10 8 10 10 7 72
Healthcare &Pharma [H&P]
9 10 10 9 10 11 9 11 79
Total 74 77 82 72 78 79 73 69 604
Team
Leas
eEm
ploy
men
tOut
look
Repo
rt
35
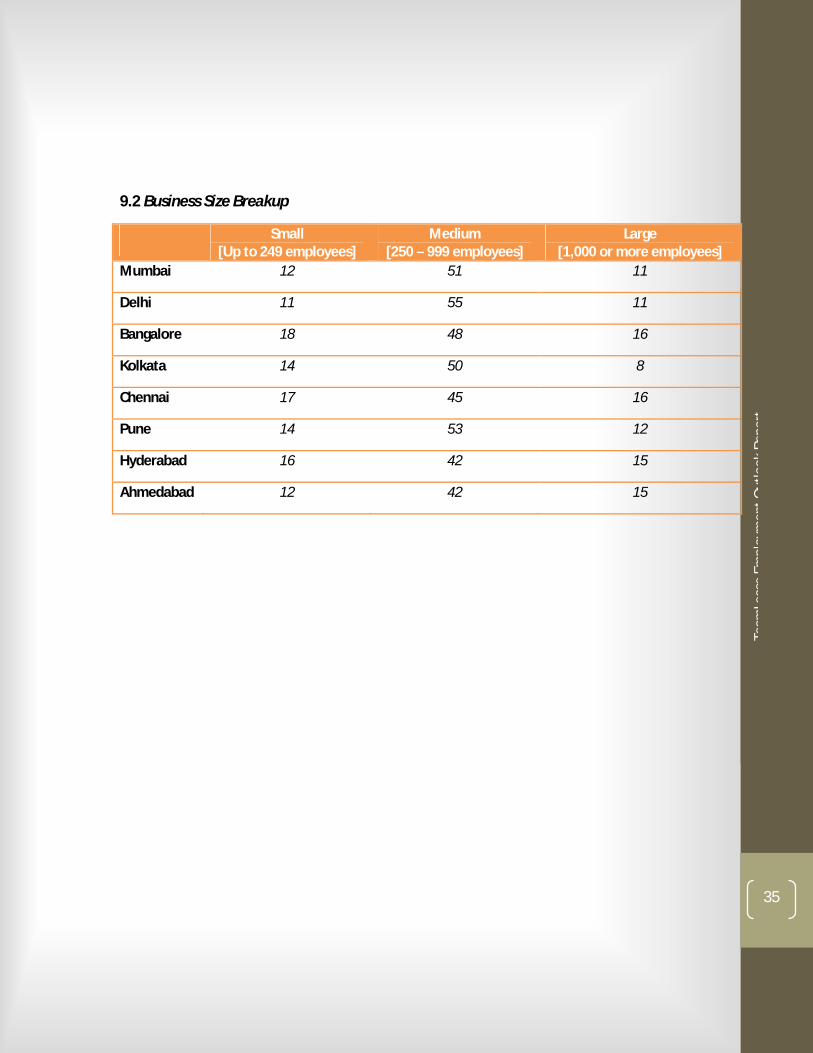
9.2 Business Size Breakup
Small [Up to 249 employees]
Medium [250 – 999 employees]
Large [1,000 or more employees]
Mumbai 12 51 11
Delhi 11 55 11
Bangalore 18 48 16
Kolkata 14 50 8
Chennai 17 45 16
Pune 14 53 12
Hyderabad 16 42 15
Ahmedabad 12 42 15
Team
Leas
eEm
ploy
men
tOut
look
Repo
rt
36
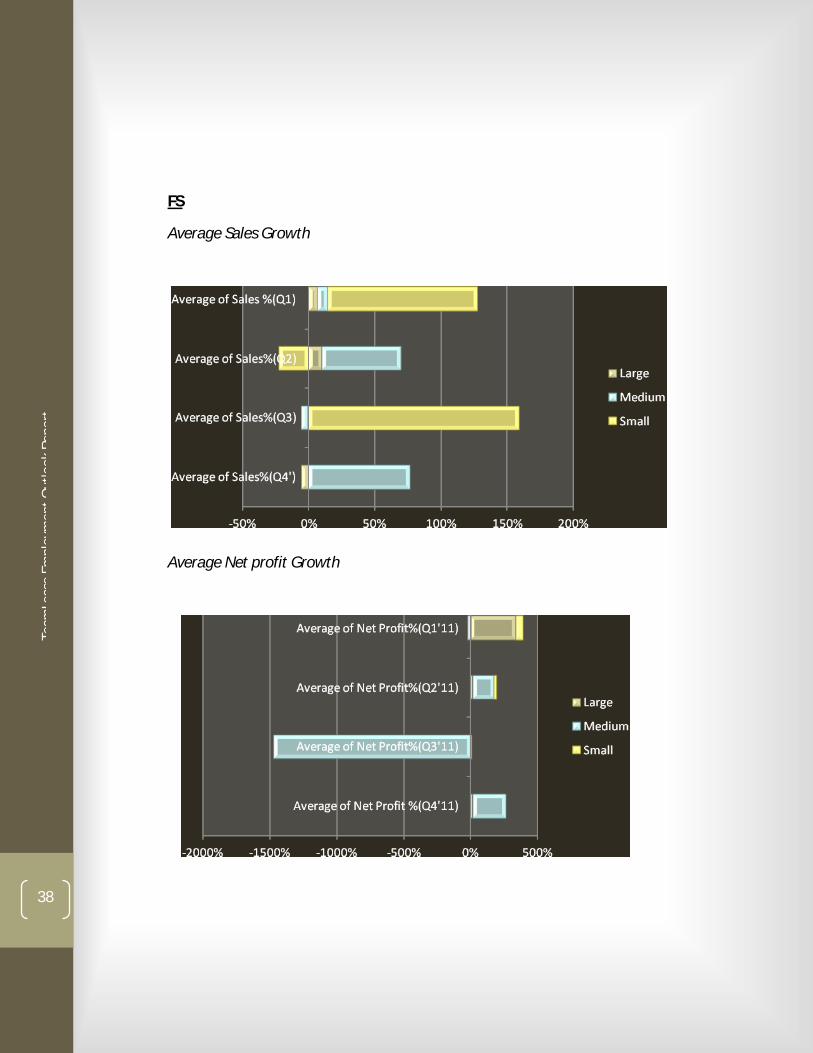
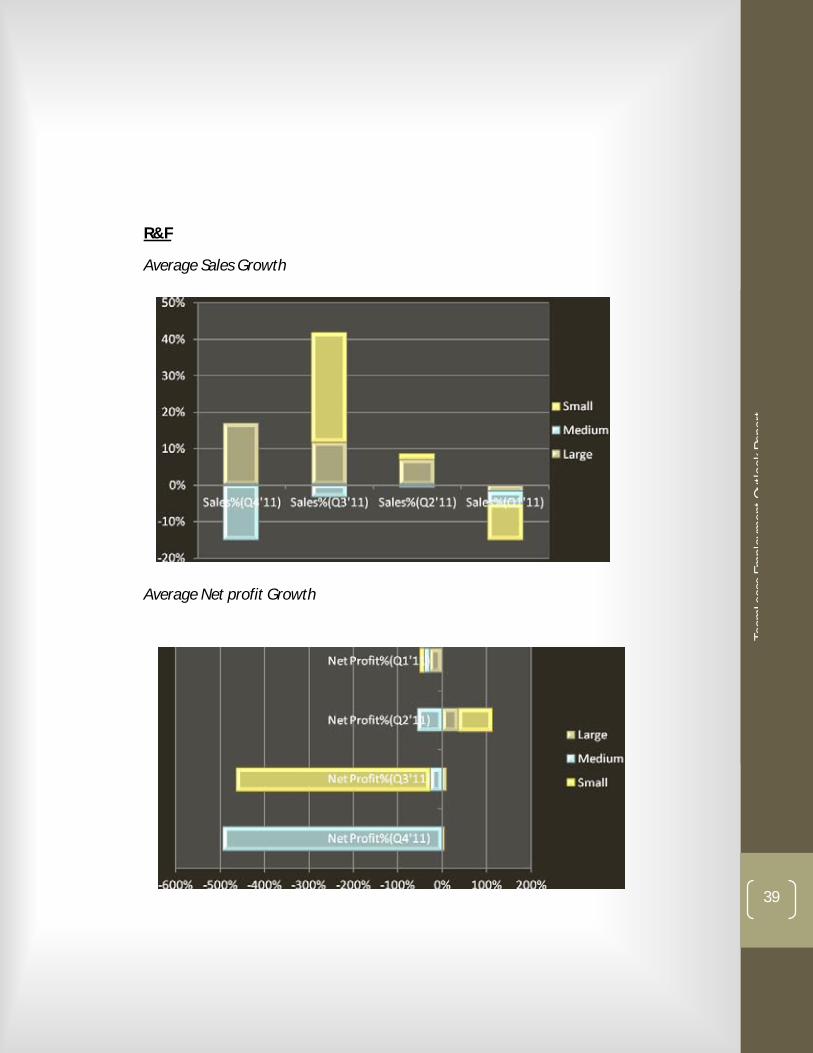
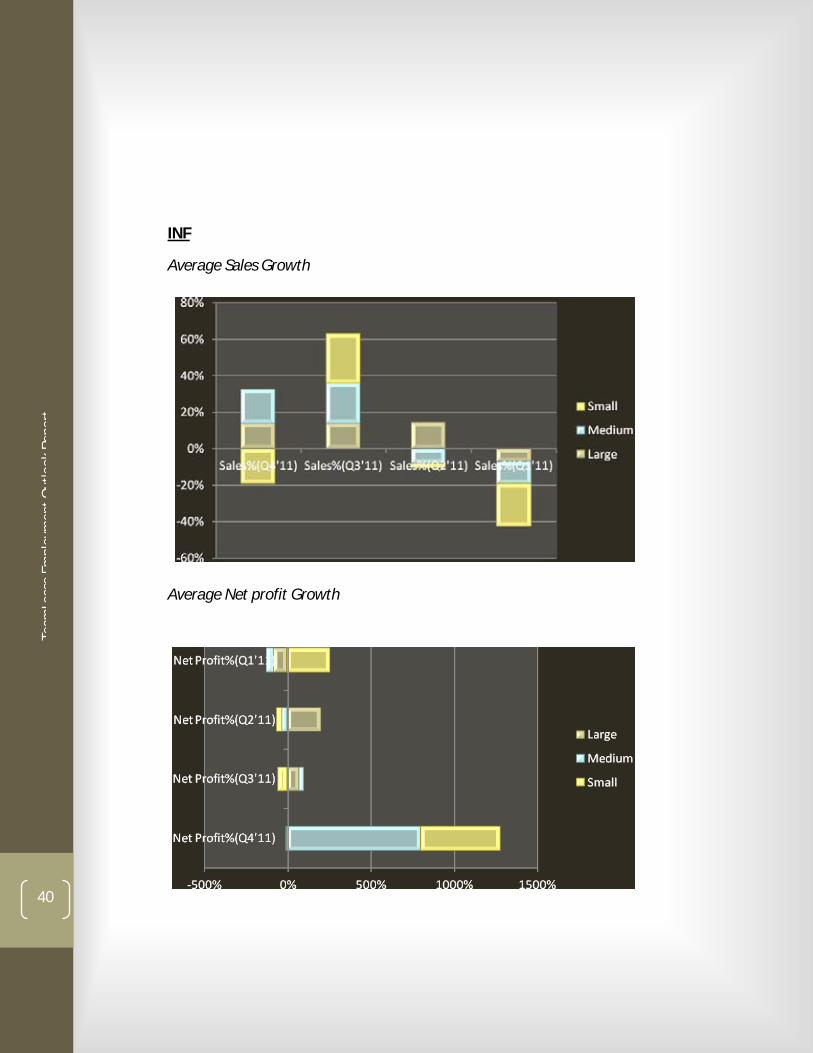
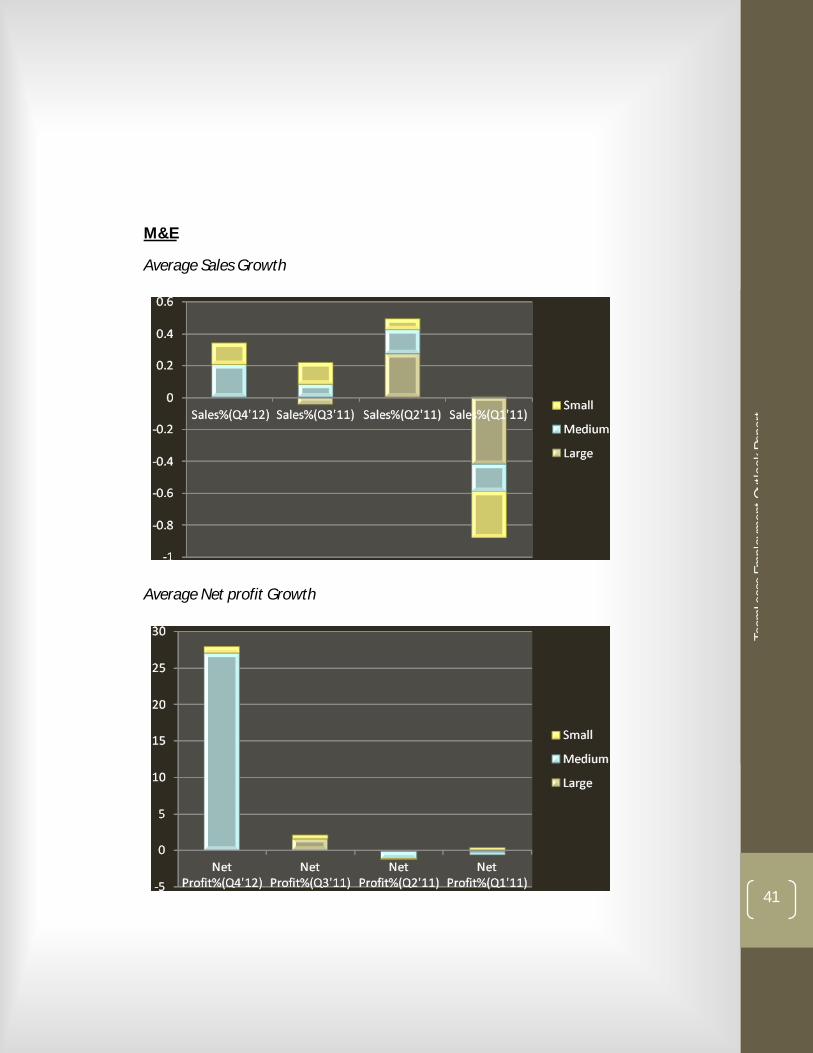
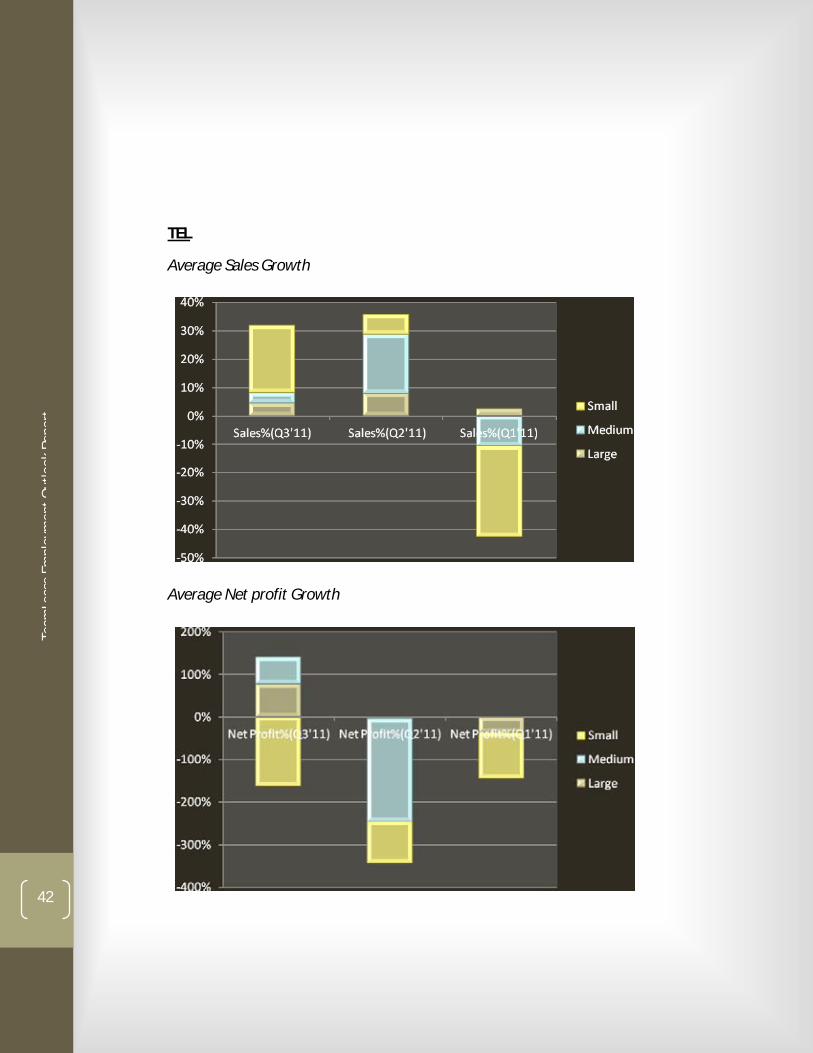
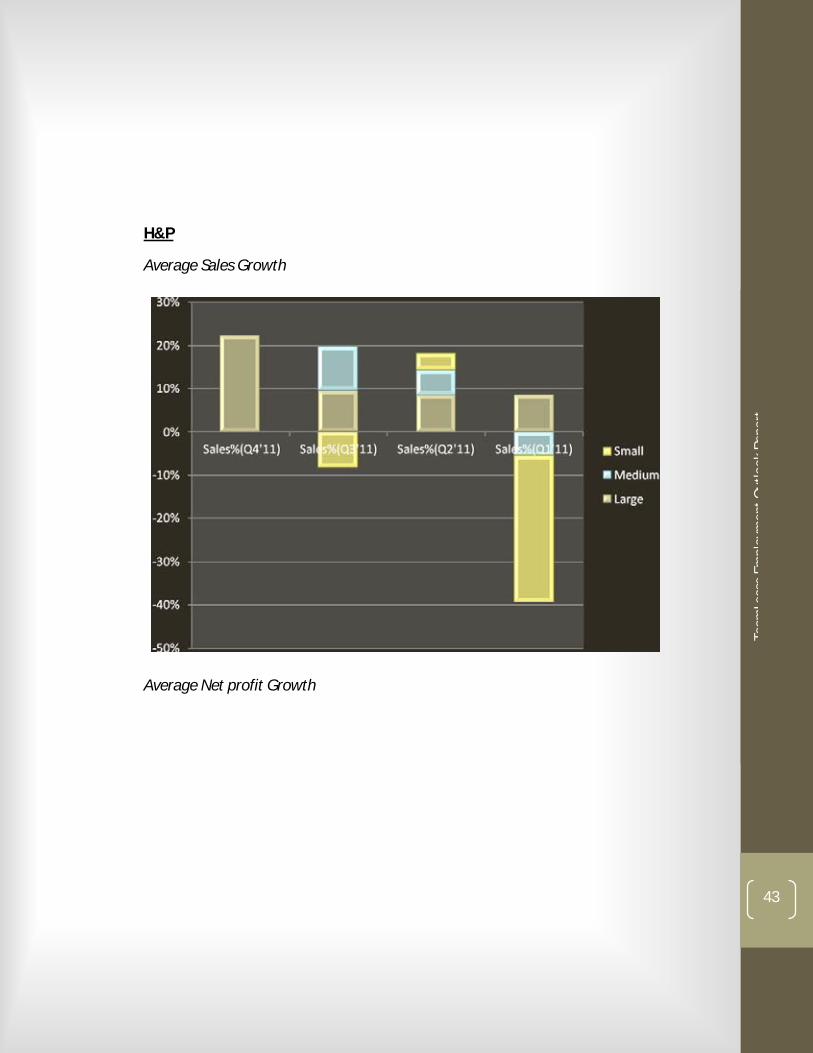
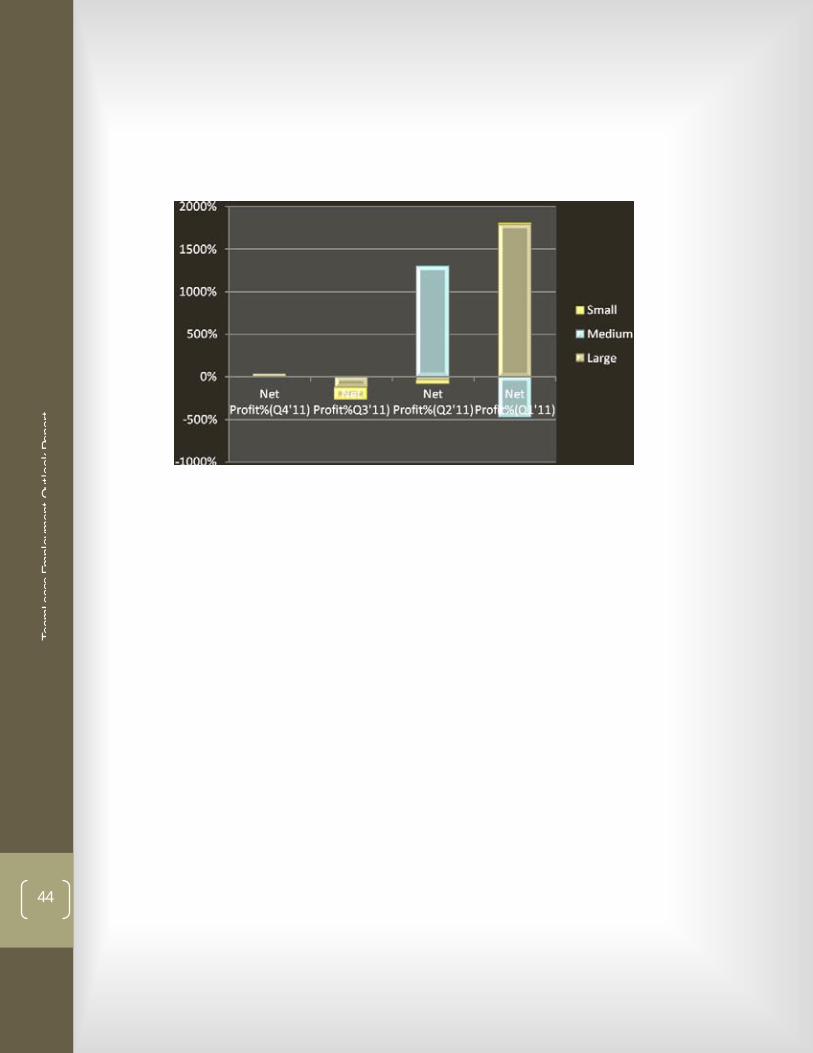
10. Literature Research findings – Business Growth trends
Avg sales growth(Q-o-Q) Avg NP growth(Q-o-Q) BOL Index values