NOT FOR DISTRIBUTION INTO THE U.S. UBS 1 Equities Sales Trading Commentary Technical Analysis Technical Outlook 2011 Global Michael Riesner Marc Müller 11/01/2011 [email protected][email protected]+41-44-239 1676 +41-44-239 1789 We Are Living in Extremes…Fasten your Seatbelt 2010 was the projected challenging and volatile year for equities, with a mixed performance across markets and sectors. Inline with the 4-year presidential cycle, the US market experienced a significant correction that served as the anticipated good buying opportunity for another move higher into this year. 2011 is a pre-election year and although pre-election years usually have quite a bullish background, we have reasons to believe that the current cyclical bull market in equities and commodities will move into an important top. Here are our key calls: In 2009 we expected the start of a new cyclical bull market in equities and commodities and on the back of our cyclical models it was our belief that these bull markets would move into a major peak in 2011. With risk assets trading in a major wave five, market sentiment and long-term price studies hitting multi year extremes, relative weakness coming into emerging markets and growing selectivity in markets/sectors we have increasing evidence that we are approaching the final stages of the current bull market in risk assets. Tactically we are moving into 2011 on one of the most overbought positions of the last years. On the back of our cylical models we expect a first significant setback into early Q1, which, however, should be just the beginning of a longer-lasting distributive top-building process. As long as the S&P-500 doesn’t break 1173, the market has still a chance to overshoot from a February tactical low into its ultimate Q2 top at 1350, followed by a weak H2. The uncertainty on the macro side is high and the pressure from the global bond markets is increasing. We generally expect volatility in financial markets to increase significantly in 2011 and 2012, so tactical timing will remain at the top of the agenda instead of chasing trends. We expect to see very sharp but short trend moves across all asset classes. With the VIX hitting an important long-term support we are a buyer of volatility!! In the bigger picture we continue to believe in the reflationary trend on the macro side, so a potential new cyclical bear market in risk assets should be limited in price and time. From a Q2 top we expect the US market to start a six to ten-month bear market into H1 2012, in which the S&P-500 could lose 25% from its 2011 peak. On the inter-market side, the USD will have a major impact on risk assets in 2011. On the back of the 4-year cycle we expect the USD to move into a major bottom in 2011 and this bottom should be the basis for a longer- lasting recovery into deeper 2012. Tactically, we expect the current bounce in the USD to top out in early Q1, followed by a capitulation move down into Q2, which is our preferred timing for a major USD low. A major USD bottom has consequences for other asset classes. A final overshooting in the USD suggests a potential blow-off and/or selective bubbles in commodities and related markets/themes. With moving into 2011 we see commodities vulnerable for a short-term set back but from an important tactical low in deeper Q1 we expect commodities and in particularly gold/silver and grains to start another aggressive rally into a major Q2/Q3 top, followed by a sharp correction into 2012. On the back of a USD bottom we expect commodity currencies (AUD/CAD/ZAR) to hit a major top in Q2 2011, which implies that emerging markets in general and in particular the 2010 star performers should hit a major cyclical top, followed by painful corrections into 2012. We still strongly believe that the December 2008 low in the US long bond represents the ultimate low of a 27 year lasting secular bull market. Tactically, yields have been rising sharply since October 2010. However, given our cycles and a too bearish consensus for 2011 we see bonds moving into an important tactical buying opportunity in Q2. From a Q2 top we expect a significant set back in yields into at least deeper H2. On the sector front we see early cyclical sectors running into an important relative top in early Q1, which should be the starting point for a larger top-building phase in which we expect commodity themes to hit an important peak in Q2. Given our scenario of a limited bear market in equities, we see a comeback of defensive sectors (utilities, healthcare and telecoms) in H2. The luxury sector is our key short idea for 2011.
We Are Living in Extremes…Fasten your Seatbelt 2010 was the projected challenging and volatile year for equities, with a mixed performance across markets and sectors. Inline with the 4-year presidential cycle, the US market experienced a significant correction that served as the anticipated good buying opportunity for another move higher into this year. 2011 is a pre-election year and although pre-election years usually have quite a bullish background, we have reasons to believe that the current cyclical bull market in equities and commodities will move into an important top. Here are our key calls:
In 2009 we expected the start of a new cyclical bull market in equities and commodities and on the back of our cyclical models it was our belief that these bull markets would move into a major peak in 2011. With risk assets trading in a major wave five, market sentiment and long-term price studies hitting multi year extremes, relative weakness coming into emerging markets and growing selectivity in markets/sectors we have increasing evidence that we are approaching the final stages of the current bull market in risk assets.
Tactically we are moving into 2011 on one of the most overbought positions of the last years. On the back of our cylical models we expect a first significant setback into early Q1, which, however, should be just the beginning of a longer-lasting distributive top-building process. As long as the S&P-500 doesn’t break 1173, the market has still a chance to overshoot from a February tactical low into its ultimate Q2 top at 1350, followed by a weak H2.
The uncertainty on the macro side is high and the pressure from the global bond markets is increasing. We generally expect volatility in financial markets to increase significantly in 2011 and 2012, so tactical timing will remain at the top of the agenda instead of chasing trends. We expect to see very sharp but short trend moves across all asset classes. With the VIX hitting an important long-term support we are a buyer of volatility!!
In the bigger picture we continue to believe in the reflationary trend on the macro side, so a potential new cyclical bear market in risk assets should be limited in price and time. From a Q2 top we expect the US market to start a six to ten-month bear market into H1 2012, in which the S&P-500 could lose 25% from its 2011 peak.
On the inter-market side, the USD will have a major impact on risk assets in 2011. On the back of the 4-year cycle we expect the USD to move into a major bottom in 2011 and this bottom should be the basis for a longer-lasting recovery into deeper 2012. Tactically, we expect the current bounce in the USD to top out in early Q1, followed by a capitulation move down into Q2, which is our preferred timing for a major USD low. A major USD bottom has consequences for other asset classes.
A final overshooting in the USD suggests a potential blow-off and/or selective bubbles in commodities and related markets/themes. With moving into 2011 we see commodities vulnerable for a short-term set back but from an important tactical low in deeper Q1 we expect commodities and in particularly gold/silver and grains to start another aggressive rally into a major Q2/Q3 top, followed by a sharp correction into 2012.
On the back of a USD bottom we expect commodity currencies (AUD/CAD/ZAR) to hit a major top in Q2 2011, which implies that emerging markets in general and in particular the 2010 star performers should hit a major cyclical top, followed by painful corrections into 2012.
We still strongly believe that the December 2008 low in the US long bond represents the ultimate low of a 27 year lasting secular bull market. Tactically, yields have been rising sharply since October 2010. However, given our cycles and a too bearish consensus for 2011 we see bonds moving into an important tactical buying opportunity in Q2. From a Q2 top we expect a significant set back in yields into at least deeper H2.
On the sector front we see early cyclical sectors running into an important relative top in early Q1, which should be the starting point for a larger top-building phase in which we expect commodity themes to hit an important peak in Q2. Given our scenario of a limited bear market in equities, we see a comeback of defensive sectors (utilities, healthcare and telecoms) in H2. The luxury sector is our key short idea for 2011.
Technical Strategy
NOT FOR DISTRIBUTION INTO THE U.S. UBS 2
Technical Strategy 2011
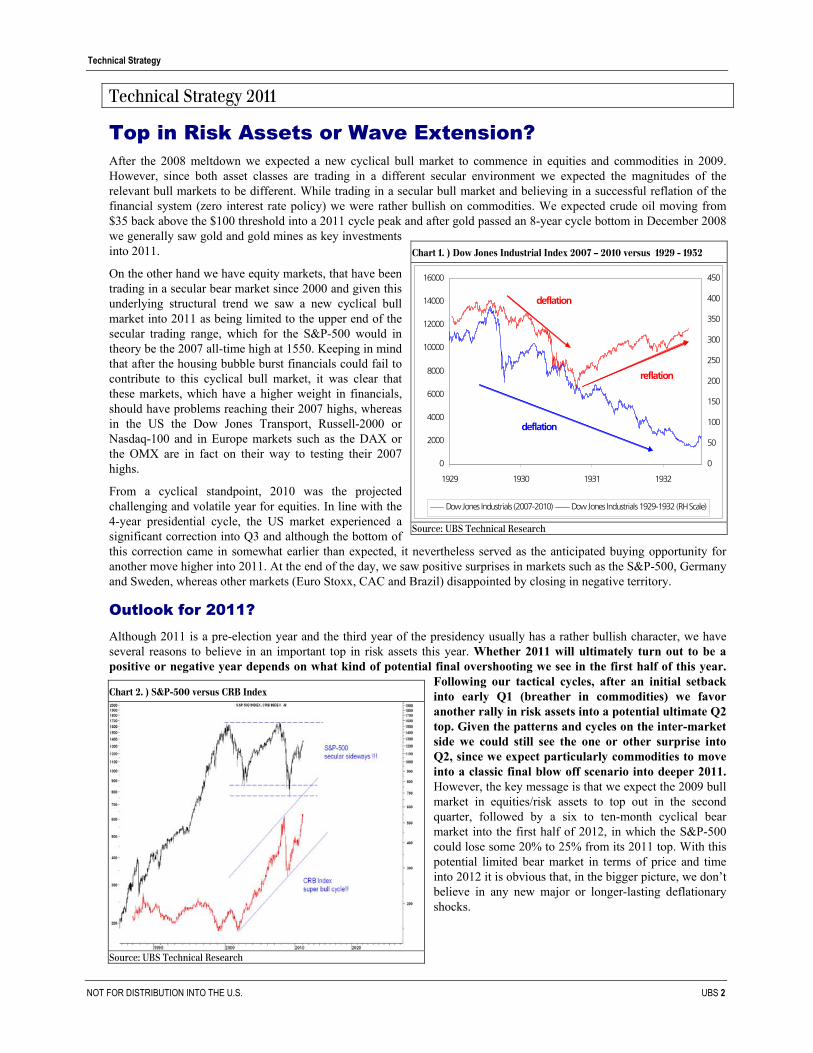
Top in Risk Assets or Wave Extension? After the 2008 meltdown we expected a new cyclical bull market to commence in equities and commodities in 2009. However, since both asset classes are trading in a different secular environment we expected the magnitudes of the relevant bull markets to be different. While trading in a secular bull market and believing in a successful reflation of the financial system (zero interest rate policy) we were rather bullish on commodities. We expected crude oil moving from $35 back above the $100 threshold into a 2011 cycle peak and after gold passed an 8-year cycle bottom in December 2008 we generally saw gold and gold mines as key investments into 2011.
On the other hand we have equity markets, that have been trading in a secular bear market since 2000 and given this underlying structural trend we saw a new cyclical bull market into 2011 as being limited to the upper end of the secular trading range, which for the S&P-500 would in theory be the 2007 all-time high at 1550. Keeping in mind that after the housing bubble burst financials could fail to contribute to this cyclical bull market, it was clear that these markets, which have a higher weight in financials, should have problems reaching their 2007 highs, whereas in the US the Dow Jones Transport, Russell-2000 or Nasdaq-100 and in Europe markets such as the DAX or the OMX are in fact on their way to testing their 2007 highs.
From a cyclical standpoint, 2010 was the projected challenging and volatile year for equities. In line with the 4-year presidential cycle, the US market experienced a significant correction into Q3 and although the bottom of this correction came in somewhat earlier than expected, it nevertheless served as the anticipated buying opportunity for another move higher into 2011. At the end of the day, we saw positive surprises in markets such as the S&P-500, Germany and Sweden, whereas other markets (Euro Stoxx, CAC and Brazil) disappointed by closing in negative territory.
Outlook for 2011? Although 2011 is a pre-election year and the third year of the presidency usually has a rather bullish character, we have several reasons to believe in an important top in risk assets this year. Whether 2011 will ultimately turn out to be a positive or negative year depends on what kind of potential final overshooting we see in the first half of this year.
Following our tactical cycles, after an initial setback into early Q1 (breather in commodities) we favor another rally in risk assets into a potential ultimate Q2 top. Given the patterns and cycles on the inter-market side we could still see the one or other surprise into Q2, since we expect particularly commodities to move into a classic final blow off scenario into deeper 2011. However, the key message is that we expect the 2009 bull market in equities/risk assets to top out in the second quarter, followed by a six to ten-month cyclical bear market into the first half of 2012, in which the S&P-500 could lose some 20% to 25% from its 2011 top. With this potential limited bear market in terms of price and time into 2012 it is obvious that, in the bigger picture, we don’t believe in any new major or longer-lasting deflationary shocks.
Chart 1. ) Dow Jones Industrial Index 2007 – 2010 versus 1929 - 1932
0
2000
4000
6000
8000
10000
12000
14000
16000
1929 1930 1931 1932
0
50
100
150
200
250
300
350
400
450
Dow Jones Industrials (2007-2010) Dow Jones Industrials 1929-1932 (RH Scale)
deflation
reflation
deflation
Source: UBS Technical Research
Chart 2. ) S&P-500 versus CRB Index
Source: UBS Technical Research
Technical Strategy
NOT FOR DISTRIBUTION INTO THE U.S. UBS 3
Technical Strategy 2011
Key Themes on the Macro Side? 1) On the back of a potential overshooting in commodities into Q2/Q3 and the quantitative easing activity of the central banks we see inflation becoming a growing issue in this year’s macro discussion. The short end of the yield curve we expect to be vulnerable for a significant move higher in 2011 and given the increasingly oversold longer end we see yield curves moving into an important top in H1 2011!
2) The strongly rising yields in the global bond markets are a reason for growing pressure in the financial system with regards to debt burden and sovereign risk. Given this background we think that volatility is currently too low/risk appetite is too high. Consequently, we see a major low in the VIX in 2011.
3) Generally speaking, in light of high uncertainty on the macro side (sovereign risks) and the growing pressure in the global bond markets, we expect volatility in financial markets to increase significantly in 2011 and 2012. We expect to see very sharp but short trend moves across all asset classes, based on the relevant news flow and external shocks caused by the monetary authorities. All in all, this means that tactical timing will remain at the top of the agenda instead of chasing trends.
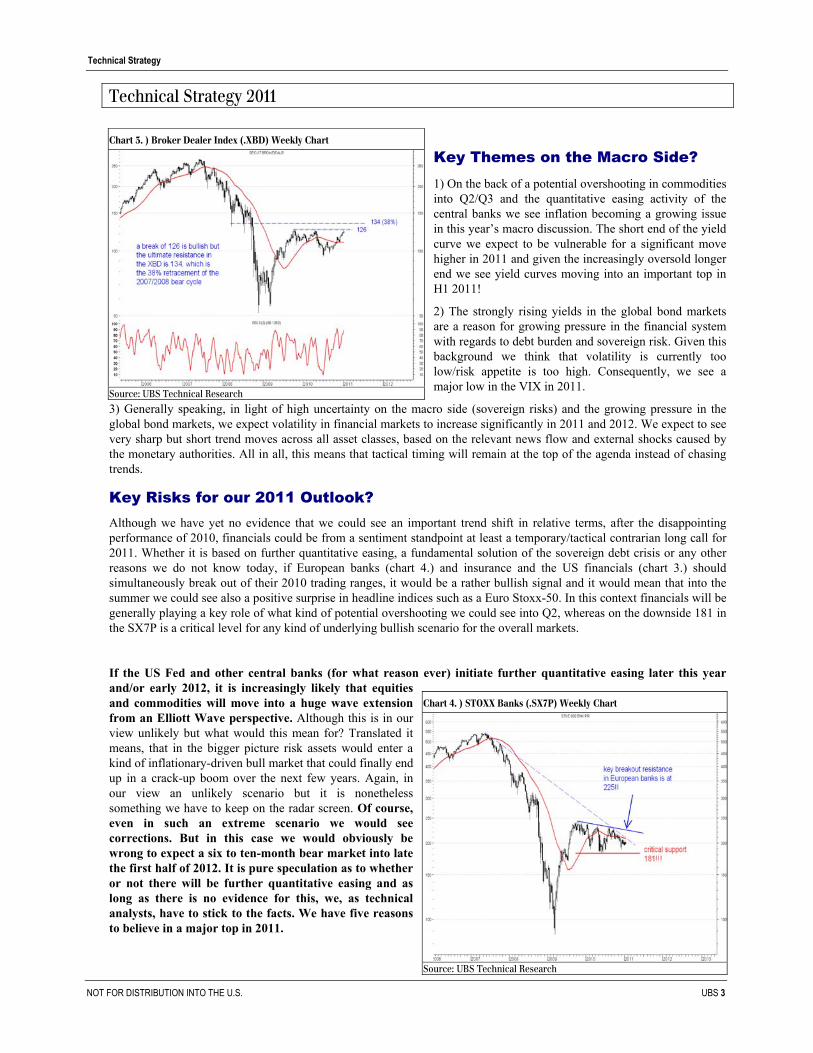
Key Risks for our 2011 Outlook? Although we have yet no evidence that we could see an important trend shift in relative terms, after the disappointing performance of 2010, financials could be from a sentiment standpoint at least a temporary/tactical contrarian long call for 2011. Whether it is based on further quantitative easing, a fundamental solution of the sovereign debt crisis or any other reasons we do not know today, if European banks (chart 4.) and insurance and the US financials (chart 3.) should simultaneously break out of their 2010 trading ranges, it would be a rather bullish signal and it would mean that into the summer we could see also a positive surprise in headline indices such as a Euro Stoxx-50. In this context financials will be generally playing a key role of what kind of potential overshooting we could see into Q2, whereas on the downside 181 in the SX7P is a critical level for any kind of underlying bullish scenario for the overall markets.
If the US Fed and other central banks (for what reason ever) initiate further quantitative easing later this year and/or early 2012, it is increasingly likely that equities and commodities will move into a huge wave extension from an Elliott Wave perspective. Although this is in our view unlikely but what would this mean for? Translated it means, that in the bigger picture risk assets would enter a kind of inflationary-driven bull market that could finally end up in a crack-up boom over the next few years. Again, in our view an unlikely scenario but it is nonetheless something we have to keep on the radar screen. Of course, even in such an extreme scenario we would see corrections. But in this case we would obviously be wrong to expect a six to ten-month bear market into late the first half of 2012. It is pure speculation as to whether or not there will be further quantitative easing and as long as there is no evidence for this, we, as technical analysts, have to stick to the facts. We have five reasons to believe in a major top in 2011.
Chart 3. ) Broker Dealer Index (.XBD) Weekly Chart
Source: UBS Technical Research
Chart 4. ) STOXX Banks (.SX7P) Weekly Chart
Source: UBS Technical Research
Technical Strategy
NOT FOR DISTRIBUTION INTO THE U.S. UBS 4
Technical Strategy 2011
1) Sentiment in Risk Assets Hitting Extremes It is amazing to see the sentiment swings in equity markets over the last few weeks. It is particularly the pace of the swing and the consistency in our sentiment studies that provides evidence of a huge shift in Q4 from a “climbing the wall of worry” environment toward one of the most bullish sentiment peaks since the 2000 secular market top.
It doesn’t matter whether we look at the classic sentiment surveys (Investor Intelligence or AAII) or the flow-driven sentiment studies (put/call ratios); both groups are at multi-year extremes. In late December, the bullish consensus of the AAII jumped to 63%, which is the highest reading since 2003/2004 and generally one of the highest readings in the last 10 years. The same picture is coming from put/call ratios. The ISEE sentiment index, which measures the options flow of retail investors, is at a multi-year high and the 10-day CBOE put/call ratio (chart 7.) has hit its third-lowest reading since the secular top in 2000. The lowest reading in the last 10 years occurred in January 2004, which marked the beginning of an eight-month volatile correction pattern. The second-lowest reading came in April 2010, prior to the 17% correction in the S&P-500.
In this context it is fitting that the VIX index in the US is re-testing its April 2010 lows, which, in the longer-term perspective, is a quite important level. In April last year we highlighted the two major support levels in implied volatility, which in the past have very often represented the end of a cyclical decline in market volatility. Last but not lest we are talking about two different volatility regimes, which means that we are talking about two different “risk environments” that are obviously linked to the relevant macro background.
It is the level of around 10, which represents the all-time low in the VIX and which is a level at which the market has been trading in the secular bull market of the mid/early 1990s and in the years 2005 to 2007, where the world seems to have been “risk free.” Another long-term key level seems to be at 16 to 17, where the SPX peaked out in 1998 and 2000 and where the bear market rallies into March 2002 and into May 2008 peaked out. In April of last year this level was tested again and it was one of our key arguments to expect a strong correction and therefore a bigger spike in volatility into the summer. Moving into 2011, we are obviously in the same situation as in April 2010. We can again ask ourselves whether we are living in a “risk-free” environment, so that the VIX could even break the support zone of 16/17 and continue to move lower toward 10, or if we are just about to see the ultimate top of the bull market in risk assets that began in 2009.
Conclusion: From a sentiment standpoint we have an enormous consensus in the market that 2011 should be a very bullish year if not even the year for equities. Of course, it is always subjective to talk about the real market consensus but with all our sentiment work on extreme readings we are receiving an objective confirmation of this consensus. Equity markets are starting into 2011 with all sentiment studies at contrarian levels and the VIX index is testing an important long-term support. From this standpoint alone it is very likely that in 2011 the air on the upside will be getting increasingly thin, which also means, that the potential for a negative surprise in risk assets is high. The only question is when we will see this negative surprise and whether it will just be a longer-lasting correction within an intact bull market or if it will mark the start of a new cyclical bear market.
Chart 5. ) S&P-500 Weekly Chart with AAII Bullish Consensus
Source: UBS Technical Research
Chart 6. ) VIX Index Daily Chart
Source: UBS Technical Research
Technical Strategy
NOT FOR DISTRIBUTION INTO THE U.S. UBS 5
Technical Strategy 2011
From a pure tactical perspective one point is quite clear. Starting with this kind of elevated sentiment position into 2011 it is very likely that we will see a first significant setback already in early Q1, before another rally attempt into Q2 could mark the beginning of a larger top-out process. So tactically, we should be prepared for a negative surprise in later January and into February!!
Apart from any short-term timing, one of our key calls for 2011 is that we are a buyer of volatility. Given the uncertainty/technical constellation on the macro side, the VIX index is in our view too low. Global bond markets have entered a bear market and at the same time we are talking about sovereign risk and debt burden in Europe and the US. On the currency side we see huge patterns and gold as a safe haven is still near an all-time high. One of these markets must be wrong, so either the risk appetite of investors is too high compared to the risks on the macro side, or the markets are overestimating the risks on the macro side, which in consequence means that we are on the way towards 10 in the VIX.
2) Price Indicators Moving Into Extremes In our 2010 strategy report we said that looking at most of our long-term indicators and market structure charts it would be too early to call a major market top, so that a potential correction in 2010 should be just an interruption of the 2009 bull market. This year is different, since together with our sentiment studies hitting contrarian territory most of our indicator work is either moving into long-term overbought extremes or forming a divergence as evidence of declining momentum, which is something that we usually only see at important cyclical market turning points.
The TT New Composite* has an oscillating background and it is a key study in our cyclical models. For the use of this indicator it is important to identify whether we are trading in a trend or not. In a strong trend it is a fact that almost all price studies are forming misleading and longer-lasting divergences in overbought extremes, whereas the market continues to move higher. However, in sideways trading markets the situation is completely different, and oscillators in particular generate quite accurate buy/sell signals. If we look at the ultra-long-term picture, it is quite obvious that the US market is trading in a secular bear market that has the shape of a sideways trading range, like the bear markets from 1966-1982, 1929-1942 and the secular bear market at the beginning of the last century. In this context it is important to understand that in a secular bear market, and in particular the one at the beginning of the last century, it makes a big difference as to whether we are looking at a nominal Dow Jones Industrials chart or at the inflation-adjusted version. After World War I the US experienced a period of high inflation, although it was not the kind of disastrous hyperinflation that occurred in Germany. In nominal terms the DJI doubled its value from the 1915 low into its 1919 peak (see chart 9), whereas in real terms investors lost some 60% of their value. So at the end of the day we are talking about 2 completely different charts. However, the key message is that after the secular top-out in all 3 structural bear markets of the last century, the Dow Jones Industrial experienced at least 2 if not even 3 major cyclical peaks, followed by a cyclical bear market.
* TT New Composite is a composite of 12 equally weighted indicators (MACD, Stochastic, Pring Daily, Buy/Sell Pressure, Money Flow Index,
Stochastic Momentum, Rate of Change, RSI, Slow Stochastic, Aroon, 38-Day Moving Average and DMI)
Chart 7. ) S&P-500 Daily Chart with 10-Day CBOE Put/Call Ratio
Source: UBS Technical Research
Chart 8. ) VIX Index Daily Chart
Source: UBS Technical Research
Technical Strategy
NOT FOR DISTRIBUTION INTO THE U.S. UBS 6
Technical Strategy 2011
In all cases the monthly TT New Composite topped out between a reading of +40 and +80, and all this without forming a major divergence, since the market was in fact trading in a sideways pattern. The current cyclical bull market we still see as part of the structural bear market that started in 2000. Currently, the monthly TT New Composite is still in long mode, which theoretically leaves the door open for another 4 to 5 months of bull market. However, with a reading of above +50 the indicator is heading into an area where a major cyclical top shouldn’t be too far away.
If we expand the current analysis by going down one timeframe, we can also see that on a weekly basis the TT New Composite is hitting/approaching extreme territory in most headline indices. By breaking the 5000 threshold the Dow Jones Transport index, (chart 10.) as a proxy for the cyclical camp, is on its way back to its 2007/2008 all-time high at 5500. If we look at past major market tops, we can see that most of them have been accompanied by a divergence in the TT New Composite and this is something that is still missing, which again still leaves the door open for more upside. However, we should be aware of the fact that the transport sector is starting into 2011 with the TT New Composite at overbought extremes (above +60), which suggests that the air is becoming increasingly thin and which also means that the likelihood is high that the bull run that began in 2009 is on its way into an important top this year. If so, then the likelihood is high that cyclical sectors should top out earlier than late cyclicals.
Furthermore, if we take into account structural indicators such as market breadth studies, the setup for this year is getting an even more toppish background. Last year we said that as long as we don’t see a bigger divergence in market breadth indicators such as the NYSE new 52-week highs (chart 11), it is way too early to call a major top. To get a better indication of the long-term position of the market we usually smooth the NYSE new 52-week highs with a 10-week moving average. With this set-up we can see that all major market tops in the last 40 years have been led by a bigger non-confirmation in this structural indicator. The only exception in the last 40 years was the cyclical market peak in 1983, where the S&P-500 peaked out in Q2 and traded sideways for a couple of months before correcting into the July 1984 cyclical bottom. Currently, we can see another major non-confirmation forming in this key indicator, which suggests that the risk of moving into a major market peak in 2011 is high!!
Chart 9. ) S&P-500 Monthly Chart with TT-New Composite
Source: UBS Technical Research
Chart 10. ) Dow Jones Transport Weekly Chart
Source: UBS Technical Research
Technical Strategy
NOT FOR DISTRIBUTION INTO THE U.S. UBS 7
Technical Strategy 2011
Conclusion: If we are talking about the perspectives for 2011 we have to be aware of the fact that the US market is starting this year by being overbought in all timeframes. This alone is a fact that suggests the risk of a significant correction sometime later this year. With a bigger divergence forming in the NYSE new 52-week high indicator and the market sentiment at contrarian levels, there is increasing evidence that the 2009 cyclical bull market is on its way into a major top instead of just seeing another temporary interruption of the bull market, as was the case in 2010.
3) Mixed Picture Coming from Cycles In 2010 equities faced cyclical headwind from the decennial cycle and the 4-year presidential cycle. Years ending in “0” have the worst track record in the 10-year cycle and in mid-term election years the likelihood of seeing a significant correction is generally high. Against this background, 2010 was as expected a volatile and challenging year for equities, including a 17% correction in the S&P-500 and a very mixed performance across markets and sectors. In hindsight we can say that for most of 2010 there was a relatively high correlation between the effective market behavior and the seasonal cycles of years ending in “0” and mid-term years. After the short-term setback in January we saw another big rally into Q2 and in particular the Q2 top and the subsequent sharp correction came in right on track with our cycles. However, for 2011 the cyclical side looks much more complex, as on the one hand we have the bullish implication of a pre-election year, and on the other hand we are just entering the most unfavorable period for equities, according to the decennial cycle.
Pre-Election Years Have the Best Track Record in the 4-Year Cycle 2011 is a pre-election year and the most bullish argument for this year is certainly the amazing track record of pre-election years in the presidential cycle. Since 1941, all pre-election years ended bullish with an average performance
of 16.5% in the Dow Jones Industrials. The seasonal chart for pre-election years (since 1900) is self-explanatory since it suggests an outright bullish year from the very beginning of the year into a temporary Q3 top, and then becomes bullish again at year-end. This track record is truly amazing, but if we go a bit deeper into the statistics the picture begins to change. Particularly in the first half of the last century and also the 19th century, the track record for pre-election years is much more mixed. In the time between 1833 and 1937 (chart 13.) there were 16 bullish versus 11 negative pre-election years, which shows a much more mixed performance compared to the last 70 years. One can say that in modern times the political establishment is much more effective and timely in massaging the economy to establish a positive mood for getting re-elected. On the other hand it is also interesting to note that of the six negative or flat pre-election years since 1900, four occurred in the first four years of the decade, which is the most unfavorable
Chart 11. ) S&P-500 Weekly Chart with 10-Week NYSE New 52-Week Highs
Source: UBS Technical Research
Chart 12. ) Seasonal Chart of Pre-Election Years
0.0%
2.0%
4.0%
6.0%
8.0%
10.0%
12.0%
14.0%
Jan Feb Mar Apr May Jun Jul Aug Sep Oct Nov Dec
Dow Jones Industrials Pre-Election Year Cycle (1903-2007)
pre-election years ... outright bullish equities!!
Source: UBS Technical Research
Technical Strategy
NOT FOR DISTRIBUTION INTO THE U.S. UBS 8
Technical Strategy 2011
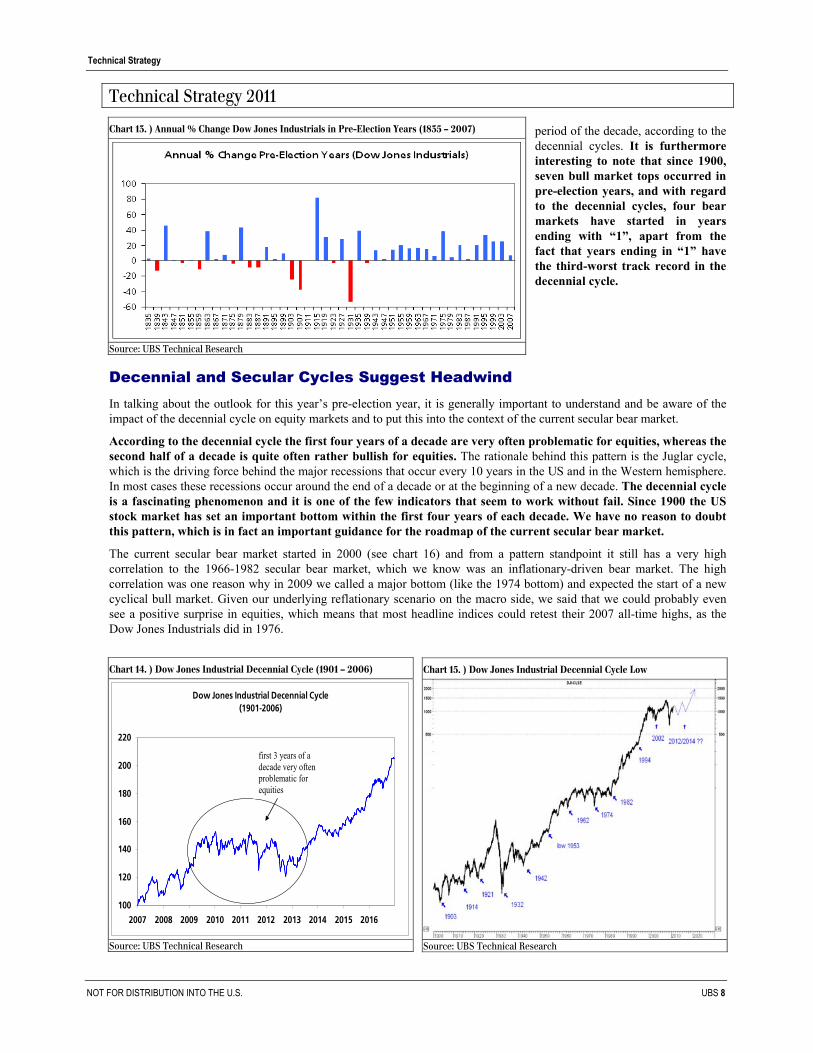
period of the decade, according to the decennial cycles. It is furthermore interesting to note that since 1900, seven bull market tops occurred in pre-election years, and with regard to the decennial cycles, four bear markets have started in years ending with “1”, apart from the fact that years ending in “1” have the third-worst track record in the decennial cycle.
Decennial and Secular Cycles Suggest Headwind In talking about the outlook for this year’s pre-election year, it is generally important to understand and be aware of the impact of the decennial cycle on equity markets and to put this into the context of the current secular bear market.
According to the decennial cycle the first four years of a decade are very often problematic for equities, whereas the second half of a decade is quite often rather bullish for equities. The rationale behind this pattern is the Juglar cycle, which is the driving force behind the major recessions that occur every 10 years in the US and in the Western hemisphere. In most cases these recessions occur around the end of a decade or at the beginning of a new decade. The decennial cycle is a fascinating phenomenon and it is one of the few indicators that seem to work without fail. Since 1900 the US stock market has set an important bottom within the first four years of each decade. We have no reason to doubt this pattern, which is in fact an important guidance for the roadmap of the current secular bear market.
The current secular bear market started in 2000 (see chart 16) and from a pattern standpoint it still has a very high correlation to the 1966-1982 secular bear market, which we know was an inflationary-driven bear market. The high correlation was one reason why in 2009 we called a major bottom (like the 1974 bottom) and expected the start of a new cyclical bull market. Given our underlying reflationary scenario on the macro side, we said that we could probably even see a positive surprise in equities, which means that most headline indices could retest their 2007 all-time highs, as the Dow Jones Industrials did in 1976.
Chart 13. ) Annual % Change Dow Jones Industrials in Pre-Election Years (1835 – 2007)
first 3 years of a decade very often problematic for equities
Source: UBS Technical Research
Chart 15. ) Dow Jones Industrial Decennial Cycle Low
Source: UBS Technical Research
Technical Strategy
NOT FOR DISTRIBUTION INTO THE U.S. UBS 9
Technical Strategy 2011
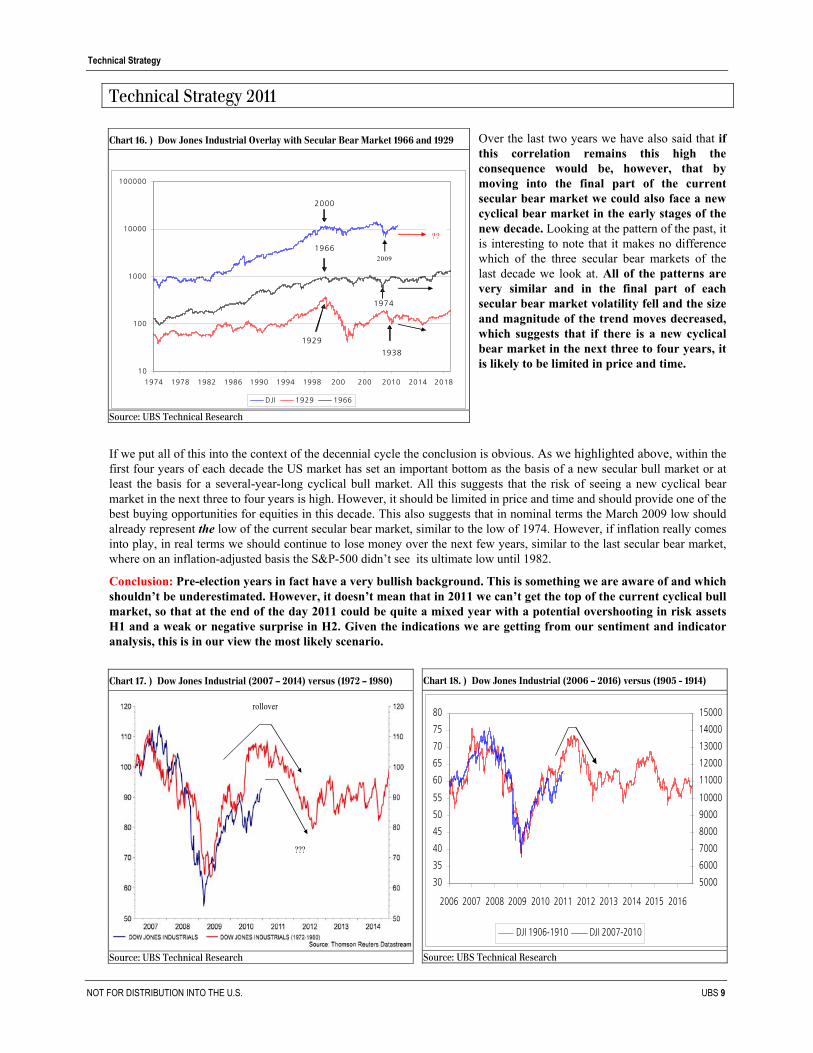
Over the last two years we have also said that if this correlation remains this high the consequence would be, however, that by moving into the final part of the current secular bear market we could also face a new cyclical bear market in the early stages of the new decade. Looking at the pattern of the past, it is interesting to note that it makes no difference which of the three secular bear markets of the last decade we look at. All of the patterns are very similar and in the final part of each secular bear market volatility fell and the size and magnitude of the trend moves decreased, which suggests that if there is a new cyclical bear market in the next three to four years, it is likely to be limited in price and time.
If we put all of this into the context of the decennial cycle the conclusion is obvious. As we highlighted above, within the first four years of each decade the US market has set an important bottom as the basis of a new secular bull market or at least the basis for a several-year-long cyclical bull market. All this suggests that the risk of seeing a new cyclical bear market in the next three to four years is high. However, it should be limited in price and time and should provide one of the best buying opportunities for equities in this decade. This also suggests that in nominal terms the March 2009 low should already represent the low of the current secular bear market, similar to the low of 1974. However, if inflation really comes into play, in real terms we should continue to lose money over the next few years, similar to the last secular bear market, where on an inflation-adjusted basis the S&P-500 didn’t see its ultimate low until 1982.
Conclusion: Pre-election years in fact have a very bullish background. This is something we are aware of and which shouldn’t be underestimated. However, it doesn’t mean that in 2011 we can’t get the top of the current cyclical bull market, so that at the end of the day 2011 could be quite a mixed year with a potential overshooting in risk assets H1 and a weak or negative surprise in H2. Given the indications we are getting from our sentiment and indicator analysis, this is in our view the most likely scenario.
Chart 16. ) Dow Jones Industrial Overlay with Secular Bear Market 1966 and 1929
Again, we can’t remember a year in which there was such an enormous bullish consensus in the market. It would be a very big surprise for us if 2011 came out as a bullish or even an overly bullish year. Furthermore, moving into the first year of the new decade we are also approaching the most unfavorable period for equities, which makes it unlikely that we will see a huge extension of the cyclical bull market that started in 2009. On the contrary, if we compare the structure of the current secular bear market with the structure of the last three secular bear markets we can still see a high correlation to each one of these market patterns. In all three cases the chart analogy suggests the risk of moving into an important top this year, followed by a short cyclical bear market of around 6 to a maximum of 12 months.
In this context it is also worth highlighting the high correlation of the current secular bear market with the one at the beginning of the last century and in particular with the period beginning in 1906. The 1906-1907 melt down had a very similar background to the meltdown of 2008. In both cases the market had to deal with a dramatic financial crisis and the risk of moving into a classic bank run. After J.P Morgan organized a bailout, the market reversed sharply and rallied for more or less 24 months into the late-1909 peak before another limited cyclical bear market of just seven months occurred.
Following this pattern, we should see a short but sharp correction into early Q1 (February low projection), followed by a final overshooting into Q2 (summer top), before a top building process starts that ends in a sharp correction into Q4 as the first part of a corrective cyclical bear market that should finally move down into the first half of 2012. Interestingly enough, this pattern would perfectly fit the seasonal pattern of years ending in “1,” which points to a Q2 top followed by a significant correction into Q4. It is completely contrarian to the seasonal chart of pre-election years but given the overall setup with regard to the elevated sentiment, overbought indicators and taking into account the secular patterns it gives us an indication of how 2011 could look from a tactical perspective.
4) Risk Assets Are Trading in a Final Wave Five It is always controversial to talk about Elliott Wave analysis, since the interpretation of Elliott Wave counts very often has some subjective elements. However, if we think a relatively clear pattern is developing in the markets, we believe it is
worth highlighting and taking into account with regard to our overall strategy.
If we look at the wave structure of most risk assets it is becoming more and more obvious that with the rally from the July/August bottom last year, the overall structure off from the March 2009 lows is taking the shape of an impulsive wave-five structure. It doesn’t make a difference whether we look at equities, where we see wave-five structures developing in prominent markets such as the S&P-500 or the FTSE, commodities or the Australian dollar (AUD) as a key indicator for risk assets. All of these assets have in common that the whole bull move that started in March 2009 or December 2008 is developing in a wave-five structure. If this count is correct then we are currently trading in the final wave five of this bull run. What would be the consequence of this count?
Chart 19. ) Seasonal Chart of Years ending in “1”
-4%
-3%
-2%
-1%
0%
1%
2%
3%
4%
5%
6%
Jan Feb Mar Apr May Jun Jul Aug Sep Oct Nov Nov Dec
Dow Jones Industsrial Years Ending in '1' (1901-2001)
Q2 top projection
Source: UBS Technical Research
Chart 20. ) FTSE-100 Weekly Chart
Source: UBS Technical Research
Technical Strategy
NOT FOR DISTRIBUTION INTO THE U.S. UBS 11
Technical Strategy 2011
1) The most important message is that with a completed wave-five structure, the 2009 bull market in risk assets would move into an important top, which means that we would face a longer-lasting corrective phase (most likely pattern a-b-c correction) that would at least wipe out the last bull run of a lower degree, which is wave five. For the S&P-500 this would mean that regardless of where the ultimate top would finally be, the following correction, which in fact would be a cyclical bear market, should reach a level of around 1000 to 1050.
2) An impulsive wave-five structure is usually bullish to a larger degree, which confirms our view that the March 2009 low plays a very important role in the very long-term context. So the likelihood is high that at least on a nominal basis we have seen the low of the current secular bear market, which, however, doesn’t mean that in real terms the March 2009 low can’t be taken out if we are heading into a phase of higher inflation. This also means that the current wave structure confirms our call that if there is a potential new cyclical bear market into late 2011 or the first half of 2012, it should be limited in terms of price, which suggests that we would not see a new deflationary shock wave rolling over risk assets.
3) The AUD is a perfect indicator for risk assets, given the obvious high correlation to commodities and emerging markets. Consequently, a completed wave-five structure in the AUD would have far-reaching consequences for the current bull market in commodities and emerging markets as well as for the USD. Our key message is that you can be wrong about
your tactical timing for a potential top this year but when we see the AUD moving into a long-term top followed by a larger and longer-lasting correction, we will see the same correction in commodities and emerging markets, which fits the relative weakness we are already seeing in some of the Asian markets (see page 13.). Furthermore, a major top in the AUD would obviously also imply that the USD should be not too far away from an important long-term low, which again fits the call that commodities are on the way into an important top in 2011!!
4) What is the risk of this call and what could be the best timing for a top in 2011?
The risk of this call is a very simple but also a very extreme scenario. If the wave in risk assets that started in July is not a wave five of a larger degree, then it is the beginning of a huge wave extension (wave 3 of a larger degree), which would mean that we are just at the
Chart 21. ) AUDUSD Weekly Chart
Source: UBS Technical Research
Chart 22. ) S&P-500 Weekly Chart
Source: UBS Technical Research
Chart 23. ) Correlation AUDUSD/ HangSeng/ CRB Index
Source: UBS Technical Research
Technical Strategy
NOT FOR DISTRIBUTION INTO THE U.S. UBS 12
Technical Strategy 2011
beginning of a huge acceleration on the upside in equities/risk assets. Translated into fundamentals, this would only be realistic if we indeed moved into a kind of inflationary-driven bull market, which could in fact take the shape of a crack-up boom. However, even in this case the likelihood is high that there should nevertheless be a bigger tactical correction in 2011 and, if so, then the best timing for these corrections should be early Q1 and Q3.
However, if our call/wave count is correct then it is very likely that the top would come sooner rather than later this year. The difference between getting the top very early in Q1 or later in Q2 depends on whether we finally see an extension of the underlying wave five of a lower degree, which in the SPX started at 1173 and in the AUD started at 0.95 in November. If we take into account a potential final negative overshooting in the USD into Q2 (which would call for a final blow-off scenario in commodities) and the fact that QE2 doesn’t expire until summer, we
think there is still the potential for such a final extension into Q2, which would also fit with a Q2 top projection of the seasonal cycle of years ending in “1.” The potential on the upside is unchanged from what we have said in our recent reports. After reaching our projected 1260 target the SPX looks vulnerable for a short-term set back in early Q1, before we could see an extension towards 1320 and 1350 as our preferred targets for a potential Q2 top. However, for this scenario to take place it is absolutely essential that the S&P-500 holds 1173 and the AUD holds 0.95, so both levels represent a strategic key support this year.
Conclusion: From a pattern point of view we see risk assets trading in the final stages of an impulsive wave-five structure, which suggests that risk assets are generally on their way toward an important long-term top. Confirmation for this wave count comes from the internal wave structure of the relevant sub-waves, which are unfolding in a near-perfect wave-five structure, and the increasing divergences in price studies, which is a typical phenomenon that we usually see in a final wave five. Keep in mind, a divergence is nothing more than declining momentum and declining momentum is a leading indicator for a top and subsequent correction, if not even a change in trend. It doesn’t matter whether we look at the S&P-500 or the AUD, the divergences in weekly trending studies is confirmation that both markets are on the way into an important top. Furthermore, if we take into account the sentiment in risk assets the picture becomes even more consistent. The bullish consensus in equities is at a multi-year high, the AUD and commodity currencies in general are quite a crowded trade and emerging markets are a “must have” for everyone. We think particularly H2 will provide a negative surprise for these markets.
Chart 24. ) Alternative Scenario S&P-500
Source: UBS Technical Research
Chart 25. ) AUDUSD Daily Chart
Source: UBS Technical Research
Chart 26. ) S&P-500 Daily Chart
Source: UBS Technical Research
Technical Strategy
NOT FOR DISTRIBUTION INTO THE U.S. UBS 13
Technical Strategy 2011
5) China and Asia are Weakening In December we called a short-term bottom in the Shanghai Composite index (SSEC) at 2800 but below this call we placed a stop loss since we had worries about the relative chart of China versus the world. With the recent decline the SSEC broke 2800, which negates our December call on China. However, the even more important signal is coming from the relative chart of China versus the world and some other Asian markets. From a relative perspective the SSEC is about to break its July 2010 relative bottom, which is a key support, versus the MSCI world. In this context it is important to highlight that in the meantime, most of the Asian markets that had quite a nice bull run last year (Malaysia, Thailand, India, Hong Kong), have turned short versus the MSCI world, which means the weakness in China is not an isolated phenomenon, which is something that we see as a threat to the Western markets in 2011.
Conclusion: China has been leading the last three cycles in equities and the relative weakness of China and other Asian markets is a negative indication for equities. In the larger picture, the chart of the Shanghai Composite Index is moving into the apex of a huge triangle formation, so that a breakout decision in this chart will be inevitable in H1. We see China as a leading indicator for this year’s performance in equities/risk assets. In this context we would keep an eye on the real estate sector in China. The Shenzhen real estate is currently testing its 2009 long-term downtrend at 1500 a failure and subsequent break of the obvious key support at 1350 to 1300 would be a rather bearish signal for this sector (test of 1170) and it could be a catalyst for upcoming worries about the overall economic situation in China.
Chart 27. ) Shanghai Composite Index Weekly Chart
Chart 28. ) Shanghai Composite Index versus MSCI World
HIGH 73.093 5/11/10 LOW 34.586 14/ 9/01 LAST 67.774 Source: Thomson Datastream Chart 30. ) Shenzhen Real Estate (.SZRE) Daily Chart
Technical Strategy
NOT FOR DISTRIBUTION INTO THE U.S. UBS 14
Technical Strategy 2011
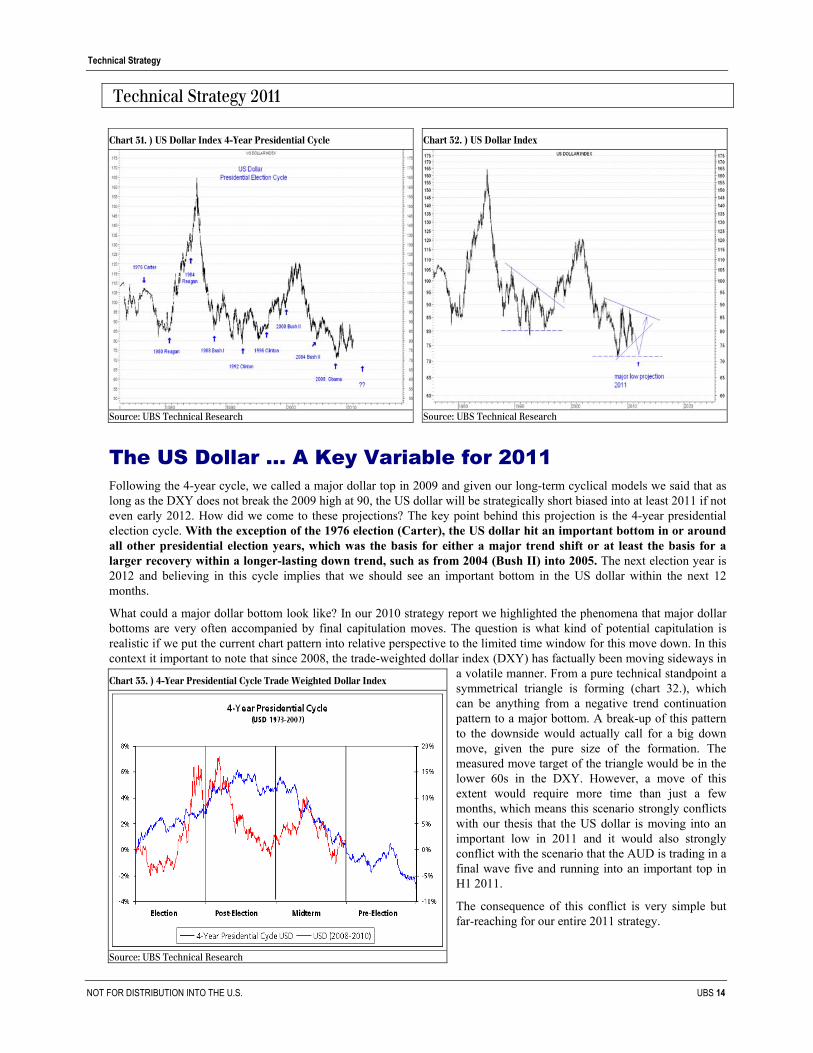
The US Dollar … A Key Variable for 2011 Following the 4-year cycle, we called a major dollar top in 2009 and given our long-term cyclical models we said that as long as the DXY does not break the 2009 high at 90, the US dollar will be strategically short biased into at least 2011 if not even early 2012. How did we come to these projections? The key point behind this projection is the 4-year presidential election cycle. With the exception of the 1976 election (Carter), the US dollar hit an important bottom in or around all other presidential election years, which was the basis for either a major trend shift or at least the basis for a larger recovery within a longer-lasting down trend, such as from 2004 (Bush II) into 2005. The next election year is 2012 and believing in this cycle implies that we should see an important bottom in the US dollar within the next 12 months.
What could a major dollar bottom look like? In our 2010 strategy report we highlighted the phenomena that major dollar bottoms are very often accompanied by final capitulation moves. The question is what kind of potential capitulation is realistic if we put the current chart pattern into relative perspective to the limited time window for this move down. In this context it important to note that since 2008, the trade-weighted dollar index (DXY) has factually been moving sideways in
a volatile manner. From a pure technical standpoint a symmetrical triangle is forming (chart 32.), which can be anything from a negative trend continuation pattern to a major bottom. A break-up of this pattern to the downside would actually call for a big down move, given the pure size of the formation. The measured move target of the triangle would be in the lower 60s in the DXY. However, a move of this extent would require more time than just a few months, which means this scenario strongly conflicts with our thesis that the US dollar is moving into an important low in 2011 and it would also strongly conflict with the scenario that the AUD is trading in a final wave five and running into an important top in H1 2011.
The consequence of this conflict is very simple but far-reaching for our entire 2011 strategy.
Chart 31. ) US Dollar Index 4-Year Presidential Cycle
Source: UBS Technical Research
Chart 32. ) US Dollar Index
Source: UBS Technical Research
Chart 33. ) 4-Year Presidential Cycle Trade Weighted Dollar Index
Source: UBS Technical Research
Technical Strategy
NOT FOR DISTRIBUTION INTO THE U.S. UBS 15
Technical Strategy 2011
We are either completely wrong about our call that the US dollar will move into an important low in 2011, or this potential bottom is generally not too far away, which means we should see the bottom in H1. Keep in mind, if we don’t see a dollar bottom in 2011, then, from a trend perspective, we are also wrong about our call that the AUD, as a key indictor for risk assets, will move into an important top. Again, translated into fundamentals, this could mean that there will be more quantitative easing down the road, which would suggest that, apart from an intermediate setback/correction, the bull market in commodities, and ultimately also in equities, would continue.
On the other hand, if we are right about our dollar bottom call, it would imply that, from a timing perspective, this bottom should be not too far off. However, in this case the symmetrical triangle in the DXY should be more a bottom and not a negative trend continuation pattern, which means we should expect a major low in the range between 75 and 70, before a larger recovery rally starts into deeper 2012.
Conclusion: Believing in the 4-year presidential cycle, we expect the US dollar to move into an important long-term bottom in 2011, followed by a larger recovery rally into deeper 2012. When could we see this bottom? Looking at our cyclical models and following the presidential cycle, we have an important low projection in Q2 that should act as the basis for a first strong rally into deeper Q3. This has implications for a number of asset classes, so the USD will be a key variable for our 2011 strategy.
1) With a final move down in the USD into Q2, a timeframe should also emerge in which we could see a final overshooting/blow-off scenario in the commodities area into Q2. Although this could mean growing selectivity, we see this as underlying bullish for equities in Q2. However, this would also indicate that the ultimate top of the bull market in risk assets is more likely to be in Q2 instead of topping out in early Q1.
When do we expect the last down wave to start? From a tactical standpoint we see the current US dollar bounce moving into an important tactical top in later January/early February, which should translate into another but final tactical buying opportunity for commodities/precious metals.
2) A major dollar bottom in Q2 suggests that from a Q2 top we could see a very weak EUR into 2012. The key question is whether a potential dollar rally into 2012 would be a reflection of outright dollar strength or outright EUR weakness. If the latter is the case than it could be an indication that the current debate over sovereign debt could move into a hot phase in 2012.
3) A major dollar bottom implies an important top for commodities in 2011, which also suggests that gold and precious metals (denominated in USD) could move into an important top in later 2011. Consequently, if we see a final blow off scenario in the precious metals area, then we should see it starting from a Q1 tactical bottom into Q3, where we have a major top projection for gold and silver.
4) An important dollar bottom also implies a potential major peak in the JPY. The relative performance of the Nikkei-225 is strongly correlated to the USDJPY pair. Consequently, if the JPY hits an important long-term peak, this implies the start of a longer-lasting period of Nikkei outperformance versus the S&P-500 (please see page 24).
Chart 34. ) Trade Weighted Dollar (DXY) Tactical Scenario
Source: UBS Technical Research
Technical Strategy
NOT FOR DISTRIBUTION INTO THE U.S. UBS 16
Technical Strategy 2011
Final Overshooting in Commodities is Still Missing!! In 2009 we called a major bottom in commodities and based on a successful reflationary scenario we expected the start of a new cyclical bull market which, apart form a tactical correction in 2010, should run into a major peak in 2011. Based on our calls on the US dollar and risk assets in general, our favored timing for a major top in commodities is the second quarter. However, given the fact that commodities very often top out later than equities, we do not rule out that a major top could ultimately shift into Q3 before a sharp correction should send commodities down into the next major long-term buying opportunity in H1 2012.
Conclusion: Our key call for 2011 is that we expect commodities to move into an important bull market top. However, prior to this peak we expect to see the classic overshooting and/or selective bubbles, which is characteristic for the final stages of a cyclical bull market. So despite the risk of a major reversal and subsequent losses in the second half of 2011, on the back of a potential overshooting into Q2 the overall year 2011 could be nonetheless an “OK” year for commodities. In 2008 we saw massive overshooting/selective bubbles in grains and oil. What are the candidates for a potential overshooting in 2011? Given our relative models the most likely candidates are gold, silver and the grain sector. Tactically, we expect a short but significant setback into early Q1. However, we have an important low projection for most commodities in deeper Q1 (February), so if we see a final acceleration/overshooting in this bull market then this potential Q1 low should be a superb basis for a final but
sharp rally into later Q2. Here are our calls/targets:
The DJ UBS Commodity index has broken its 38% retracement and is on its way to the next strategic target at 170, which represents the 50% retracement of the 2008 bear cycle. After a tactical setback into an important tactical low in deeper Q1, we expect another stronger rally into Q2, which is our preferred target for a major top in 2011. However, given the fact that commodities very often top out later than equities, this could open the window for an extension of the current bull trend into a major Q3 top. A break of the 50% retracement at 170 would pave the way for a potential overshooting towards the 186/190 area, which is the upper end of the 2009 bull trend.
Crude oil has failed to break the 50% retracement of the 2008 bear cycle at $90. A re-break below $87 would be short-term bearish and call for a somewhat stronger tactical setback into February before the ultimate rally into a major Q2/Q3 top could start. A break of $90 would call for a major target at $104.
Chart 35. ) DJ UBS Commodity Index Weekly Chart
Chart 36. ) Crude Oil Weekly Chart
Technical Strategy
NOT FOR DISTRIBUTION INTO THE U.S. UBS 17
Technical Strategy 2011
Grains are late-cyclicals in the commodity spectrum and given the fact that most commodities had their major cyclical lows in late 2008 it was one of the key calls of our 2010 strategy to expect grains to bottom out and start a new major bull leg. Based on the 7-year relative outperformance cycles, it was and still is our believe that a new bull market in wheat, corn and soybeans should last at least into 2011 and given the fact that grains should outperform other commodities we don’t rule out selective bubbles and/or a massive overshooting this year. Given our overall scenario we also expect a tactical setback in the grains sector into very early Q1. However, given our long-term cyclical models this setback should just be the basis for another but final bull leg into a major Q3 top. Buy/add grains and related sectors into a Q1 low!!
Gold Moving into a Final Blow-Off Scenario? After passing its 8-year cycle bottom in December 2008, we expected gold, silver and gold/silver mines to be the key investments for the next 3 to 4 years. We also said that in the next bull cycle we could see gold running into a bubble-like scenario, which would be the classic outcome of a major bull market.
Over the last few months we heard more and more market commentators saying that gold is already trading in a bubble. At least from a pure technical standpoint, this is not correct. As long as gold is still trading in a moderate bull trend and we
see no acceleration on the upside we are still far away from a bubble-chart scenario and/or a major top. In this context, it is interesting to note that particularly silver is in fact trading near the upper trend channel resistance of its long-term bull trend. Consequently, if gold and silver are really on the way into a bubble, then we shouldn’t be too far from the ultimate breakout decision into a parabolic blow-off scenario, similar to the gold bubble in 1980 and the technology bubble in 2000 (chart 40/41).
So the key question for 2011 is, whether we see gold moving a spectacular final blow off and if so, then it is very likely that this marks the end of a bull market or if we see gold “just” moving into another one of these important inter-mediate tops, followed by a longer lasting correction before resuming its underlying bull trend in later 2012.
Chart 37. ) CRB Grains versus CRB Index (7-Year Cycle) 10/1/11
If we really see gold moving into a vertical rally, the most likely timing for a blow-off top in precious metals should be later Q3, where we have a major top projection. From a tactical standpoint we expect a short setback into early Q1, which could be related to another move higher in yields in the bond markets (real interest rates are rising). However, from a Q1 low (February) we expect gold and silver to resume their underlying bull trends and finally start into an aggressive overshooting process into a potential ultimate top in Q3. The question of whether or not gold is moving into a bubble will be already answered in early Q1, since our favored setback into February shouldn’t be too aggressive. If, however, gold should move below $1300 it is in our view more and more unlikely that the yellow metal will have the strength to reaccelerate into such an extreme overshooting within the relatively short time frame of just 6 to 8 months.
If we see indeed a final blow-off scenario in gold, what would be the potential target for this move? According to trend arithmetic and our next Fibonacci projections (chart 39), gold could move into an area of 1800 to 2100 before a stronger and longer-lasting correction into 2012 should start. What kind of target can we expect for silver in such an environment? In this context, the gold/silver ratio will be a key factor. After the meltdown of the last few months, the gold/silver ratio is hitting a major support area at 45. A significant break of this area would suggest a next major long-term target of 15, which would obviously call for a very aggressive overshooting in silver. Again, the key question is whether or not 45 holds in this ratio. If it holds, at least temporarily, then a major overshooting target between 1800 and 2100 in gold would translate into a potential key target zone of $40 to $45 in silver, which, projected into Q3, would be the exact upper end and massive resistance of two long-term trend channels.
Chart 40. ) Gold Bubble 1976 - 1980
Source: UBS Technical Research
Chart 41. ) Nasdaq Bubble 1998 - 2000
Source: UBS Technical Research
Chart 42. ) Silver Daily Chart
Source: UBS Technical Research
Chart 43. ) Gold/Silver Ratio
Source: UBS Technical Research
Technical Strategy
NOT FOR DISTRIBUTION INTO THE U.S. UBS 19
Technical Strategy 2011
Structure in Bonds is Bearish but Oversold It was a key call of our 2009 strategy that the buying panic in bonds and therefore the meltdown in yields into the 2008 lows marked the absolute sentiment peak of a 27-year lasting secular bull market in the US bond market. Following the 30-year cycle in the US long bond, we said that after a potential longer-lasting bottoming phase over the next few years the long-term trend in yields should start to move higher, which consequently means that we are on the verge of starting a 25 to 30-year-long secular bear market in bonds. One of the key pillars of this strategy was to get technical confirmation that a classic price bottom in yields was in place, and in this context we favored the US 10-Year Treasury to set a double bottom or a higher low into 2010. With last year’s move down to 2.30%, this higher low is now in place and in line with our recent calls the US bond market has started an aggressive move up in yields.
Generally speaking, with a higher low in place in US yields, a completed, inverted head & shoulder bottom in the Australian bond market and a major reversal and long-term trend break in place in the German bund future (chart 47), there is mounting evidence that yields around the globe have seen an important long-term low, which from a trend perspective and therefore from a strategic standpoint is bearish bonds!!
However, from a sentiment point of view we have the same problem for bonds that we have for equities. If we look at the market consensus for 2011 the overwhelming consensus is to be bullish equities and bearish bonds. There is not one single broker/house in the industry that is not bearish on bonds, and we think this kind of one-sided sentiment position should be the basis for at least a tactical surprise in the bond market in later 2011. Apart from our bearish long-term cycles, our medium-term cyclical models are suggesting an important low projection for the US T-Bond in deeper Q2, which we think will be closely linked with a potential top in risk assets in Q2.
On a tactical basis a potential low in Q2 suggests that on a medium-term basis yields are set for another move higher. In this context, the long-term secular downtrend in the US 10-Year Treasury and the neckline of a potential huge double bottom at 4.00% to 4.50% will come into play and which is a level that we in fact expect to be tested in Q2.
Chart 44. ) US Long Bond Yearly Chart 30-Year Cycle (1800 – 2009)
Source: UBS Technical Research
Chart 45. ) US 10-Year Treasury Weekly Chart
Source: UBS Technical Research
Chart 46. ) Australia 10-Year Bond AUSTRALIA BOND Y IELD 10 YEAR - MIDDLE RATE
FROM 7/1/09 TO 7/1/11 DAILY
J F M A M J J A S O N D J F M A M J J A S O N D J
3.50
4.00
4.50
5.00
5.50
6.00
H IGH 5.8600 19/ 6 /09 LOW 3.8600 15/ 1/09 LAST 5.5800 Sourc e: Thoms on D atas tream
s
h
s
Source: UBS Technical Research
Technical Strategy
NOT FOR DISTRIBUTION INTO THE U.S. UBS 20
Technical Strategy 2011
In Germany the Bund Future is currently pulling back to its broken long-term bull trend at around 128, from which we expect another move lower towards at least 122, which is the 50% retracement of the 2008/2010 bull cycle. In case of an overshooting we could even see 119 to 118. However, given the already quite bearish sentiment in the bond market, we see a high likelihood that in Q2 we could finally move into a kind of selling climax and therefore a medium-term contrarian buying opportunity.
Conclusion: Strategically and tactically the technical picture in bonds is bearish but given our cyclical models we expect an important medium-term top in yields in Q2, which suggests that bonds are moving into an important tactical buying opportunity in Q2. In price terms we expect the US 10-year treasury to test the level of 4.50%, which represents the structural down trend in yields and which should be the basis for a significant setback in yields into at least late-summer 2011 if not even longer.
From an inter-market perspective the key question is what a move to 4.00% to 4.50% in the 10-year Treasury and 122 in the German bund would mean for other asset classes and what it would mean with regard to the current worries about sovereign debt and debt burden. We wouldn’t be surprised if such a move (although we think it will be only temporary) would further increase worries about the debt situation on the macro side, which could finally start biting risk assets at a certain point, so that at the end of the day the bond market could be one trigger for a top in equities in Q2. Ironically, this could be the point where it makes sense to switch from overbought and overly bullish biased equities into a potentially extremely oversold bond market.
Our call on the bond market will also have consequences for gold. Initially, a continued move higher in yields suggests headwind for gold, since real interest rates are also rising. However, with yields moving into a tactical high in Q2, followed by another move down into at least later summer, this also means that a potential correction in gold and precious metals in general should be short-lived and last but not least another tactical buying opportunity, regardless whether we see in the precious metals this kind of final blow off scenario or not.
Chart 47. ) German Bund Future Weekly Chart
Source: UBS Technical Research
Technical Strategy
NOT FOR DISTRIBUTION INTO THE U.S. UBS 21
Technical Strategy 2011
Europe:
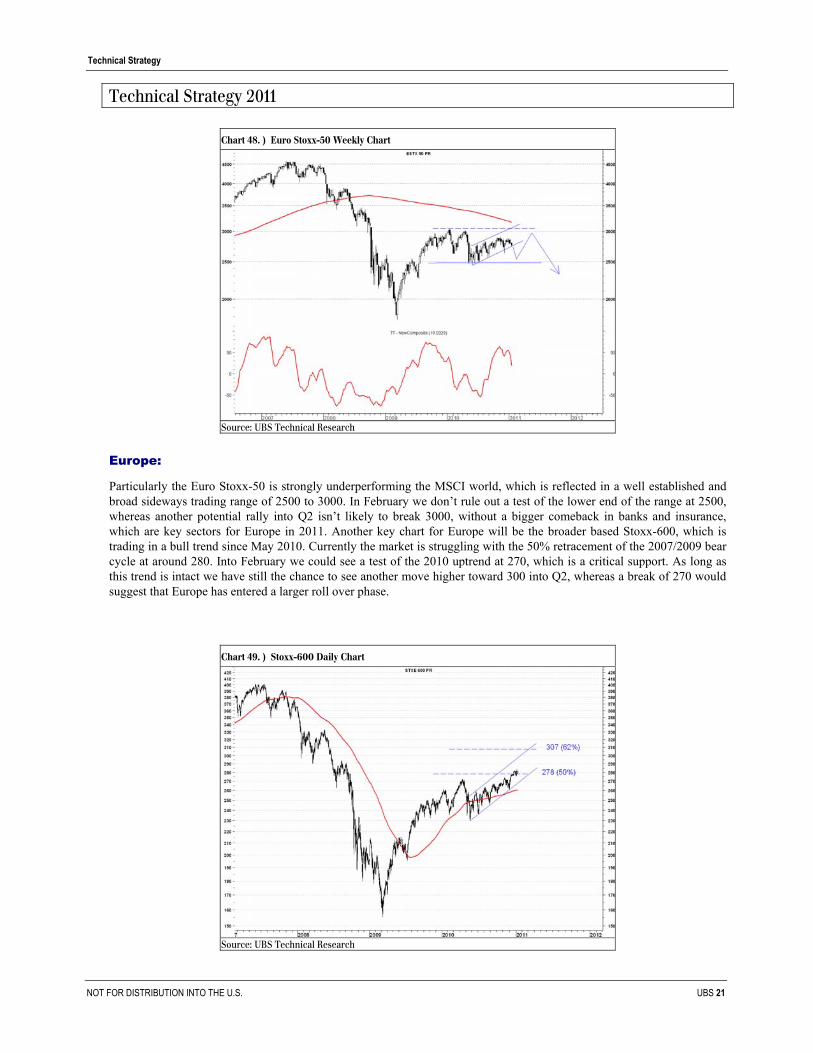
Particularly the Euro Stoxx-50 is strongly underperforming the MSCI world, which is reflected in a well established and broad sideways trading range of 2500 to 3000. In February we don’t rule out a test of the lower end of the range at 2500, whereas another potential rally into Q2 isn’t likely to break 3000, without a bigger comeback in banks and insurance, which are key sectors for Europe in 2011. Another key chart for Europe will be the broader based Stoxx-600, which is trading in a bull trend since May 2010. Currently the market is struggling with the 50% retracement of the 2007/2009 bear cycle at around 280. Into February we could see a test of the 2010 uptrend at 270, which is a critical support. As long as this trend is intact we have still the chance to see another move higher toward 300 into Q2, whereas a break of 270 would suggest that Europe has entered a larger roll over phase.
Chart 48. ) Euro Stoxx-50 Weekly Chart
Source: UBS Technical Research
Chart 49. ) Stoxx-600 Daily Chart
Source: UBS Technical Research
Technical Strategy
NOT FOR DISTRIBUTION INTO THE U.S. UBS 22
Technical Strategy 2011
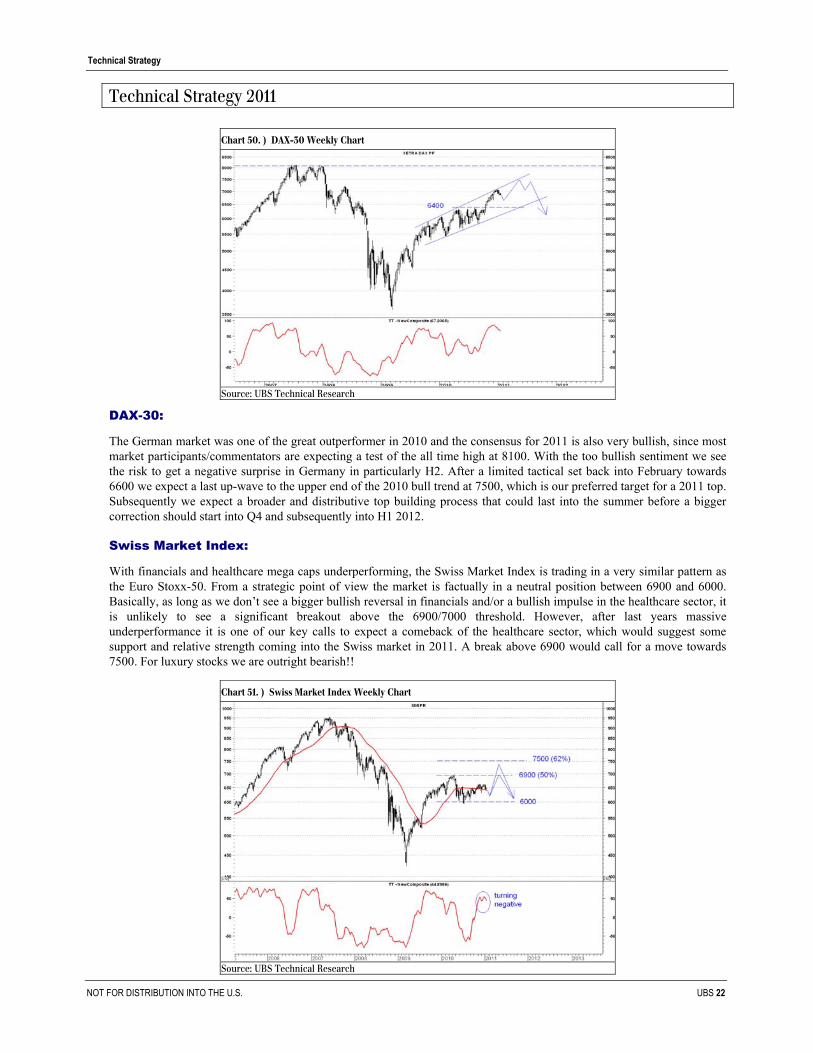
DAX-30:
The German market was one of the great outperformer in 2010 and the consensus for 2011 is also very bullish, since most market participants/commentators are expecting a test of the all time high at 8100. With the too bullish sentiment we see the risk to get a negative surprise in Germany in particularly H2. After a limited tactical set back into February towards 6600 we expect a last up-wave to the upper end of the 2010 bull trend at 7500, which is our preferred target for a 2011 top. Subsequently we expect a broader and distributive top building process that could last into the summer before a bigger correction should start into Q4 and subsequently into H1 2012.
Swiss Market Index:
With financials and healthcare mega caps underperforming, the Swiss Market Index is trading in a very similar pattern as the Euro Stoxx-50. From a strategic point of view the market is factually in a neutral position between 6900 and 6000. Basically, as long as we don’t see a bigger bullish reversal in financials and/or a bullish impulse in the healthcare sector, it is unlikely to see a significant breakout above the 6900/7000 threshold. However, after last years massive underperformance it is one of our key calls to expect a comeback of the healthcare sector, which would suggest some support and relative strength coming into the Swiss market in 2011. A break above 6900 would call for a move towards 7500. For luxury stocks we are outright bearish!!
Chart 50. ) DAX-30 Weekly Chart
Source: UBS Technical Research
Chart 51. ) Swiss Market Index Weekly Chart
Source: UBS Technical Research
Technical Strategy
NOT FOR DISTRIBUTION INTO THE U.S. UBS 23
Technical Strategy 2011
Our Key Short Idea:
After 285% performance in just 22 months and a major wave 5 underway we expect the luxury sector to move into a major peak this year. After a potential longer lasting top building process into Q2 we see the risk of a 30% to 40% correction in this sector into H1 2012! A weekly break below 108 would be strategically bearish.
Our Key Long Idea:
After 2 years of a massive underperformance we see the European utilities sector moving into long-term support and therefore also moving into an important relative buying opportunity in 2011. From a tactical standpoint we could still see a final relative capitulation into Q2 but particularly in H2 and into H1 2012 we expect to see a major comeback of utilities.
Chart 52. ) DB World Luxury Index (.DB1LUX) Weekly Chart
Source: UBS Technical Research
Chart 53. ) DJ STOXX Utilities (.SX6P) versus STOXX-600
H IGH 1.74 17/11/08,LOW 0.80 22/1/01,LAST 1.12 10/1/11 Sourc e: Thoms on D atas tream
Source: UBS Technical Research
Technical Strategy
NOT FOR DISTRIBUTION INTO THE U.S. UBS 24
Technical Strategy 2011
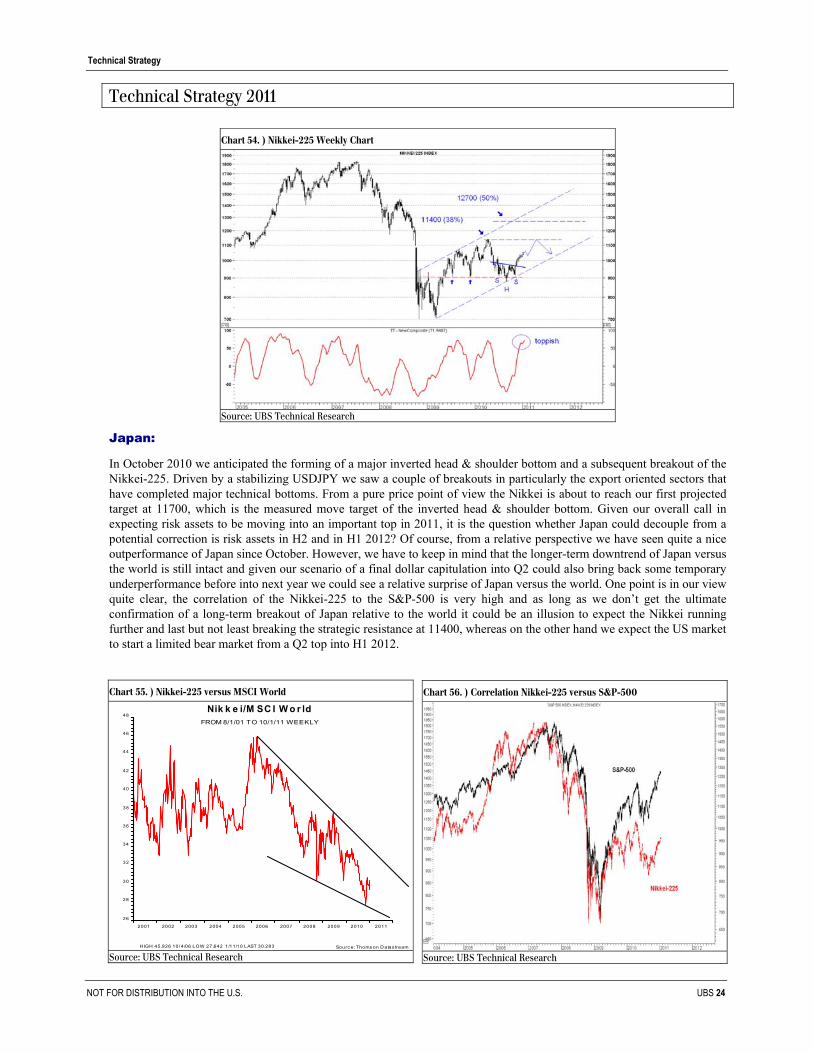
Japan:
In October 2010 we anticipated the forming of a major inverted head & shoulder bottom and a subsequent breakout of the Nikkei-225. Driven by a stabilizing USDJPY we saw a couple of breakouts in particularly the export oriented sectors that have completed major technical bottoms. From a pure price point of view the Nikkei is about to reach our first projected target at 11700, which is the measured move target of the inverted head & shoulder bottom. Given our overall call in expecting risk assets to be moving into an important top in 2011, it is the question whether Japan could decouple from a potential correction is risk assets in H2 and in H1 2012? Of course, from a relative perspective we have seen quite a nice outperformance of Japan since October. However, we have to keep in mind that the longer-term downtrend of Japan versus the world is still intact and given our scenario of a final dollar capitulation into Q2 could also bring back some temporary underperformance before into next year we could see a relative surprise of Japan versus the world. One point is in our view quite clear, the correlation of the Nikkei-225 to the S&P-500 is very high and as long as we don’t get the ultimate confirmation of a long-term breakout of Japan relative to the world it could be an illusion to expect the Nikkei running further and last but not least breaking the strategic resistance at 11400, whereas on the other hand we expect the US market to start a limited bear market from a Q2 top into H1 2012.
Chart 54. ) Nikkei-225 Weekly Chart
Source: UBS Technical Research
Chart 55. ) Nikkei-225 versus MSCI World
Nik k e i/M SC I W o r ldFROM 8/1/01 TO 10/1/11 WEEKLY