Techno-Economic Analysis of CO 2 Capture Reference System Based on Phase-Change Solvent Absorption Master’s thesis in Sustainable Energy Systems DIXIN WEI CHANG PENG Department of Energy and Environment CHALMERS UNIVERSITY OF T ECHNOLOGY Gothenburg, Sweden 2017
Transcript
Techno-Economic Analysis of CO2Capture Reference System Based onPhase-Change Solvent AbsorptionMaster’s thesis in Sustainable Energy Systems
DIXIN WEICHANG PENG
Department of Energy and EnvironmentCHALMERS UNIVERSITY OF TECHNOLOGY
Gothenburg, Sweden 2017
Master’s thesis 2017
Techno-Economic Analysis of CO2 Capture
Reference System Based on Phase-Change
Solvent Absorption
DIXIN WEICHANG PENG
Department of Energy and EnvironmentDivision of Energy Technology
Chalmers University of TechnologyGothenburg, Sweden 2017
Techno-Economic Analysis of CO2 Capture Reference SystemBased on Phase-Change Solvent Absorption
Supervisor: Stavros PapadokonstantakisExaminer: Stavros Papadokonstantakis, Department of Energy and Environment
Master’s Thesis 2017Department of Energy and EnvironmentDivision of Energy TechnologyChalmers University of TechnologySE-412 96 GothenburgTelephone +46 31 772 1000
Typeset in LATEXPrinted by [Chalmers Reproservice]Gothenburg, Sweden 2017
iv
Techno-Economic Analysis of CO2 Capture Reference SystemBased on Phase-Change Solvent Absorption
DIXIN WEICHANG PENGDepartment of Energy and EnvironmentChalmers University of Technology
AbstractThe CO2 emission into atmosphere over the past century is considered as the mainreason for global warming phenomenon. The Paris Agreement target of 2 ◦C urgednot only focus on this issue, but also effective measures for the transition periodand long term. The solvent based post-combustion carbon capture, a convenientlyapplied process,can be costly mainly due to high reboiler heating for the solventregeneration. If the cost can be reduced to an acceptable value for power plants,then PCC processes exhibit substantial potential in coal and natural gas fired plantemission reduction, which is a large share in global CO2 emissions.
This study focuses on phase-change amines, that have reported good experimentalresults in phase separation, and thus reduce reboiler heating demand. It startswith checking and comparing a group of amines and selecting potential candidates.Further PCC process simulation in Aspen shows detailed results in performance ofdifferent configuration and amine type.
In general, two amines known as DIBA and HXA are seen as promising replacement,especially HXA. The results are compared with MEA reference case. With respectto reboiler duty, the two selected amines both showed more than 50% reduction.And in the best scenario, the reboiler heating demand is reduced to 0.91 GJ/tonCO2 captured.
AcknowledgementsSincerely, we would like to thank our supervisor and examiner, Stavros Papadokon-stantakis. His advice helped us throughout the whole project and inspired severalmeaningful studies. We would also thank Gulnara Shavalieva who helped us withsources related to our study.
We also appreciate the warm support from our friends and family, especially Yiyufrom group ’Teletubbies’. Besides, great thanks to the nice and friendly environmentin the department, as well as master thesis students altogether.
A.16 GWP. EI99 results of scenario 3.5.7 . . . . . . . . . . . . . . . . . . IXA.17 Equivalent enegy consumption Results of scenario 3.5.7 . . . . . . . . IXA.18 Solution concentration sentivity analysis data . . . . . . . . . . . . . XA.19 Result table of sensitivity analysis in decanter using DIBA with varied
temperature. unit for flow rate: kmol/h . . . . . . . . . . . . . . . . XA.20 Result table of sensitivity analysis in decanter using HXA with varied
temperature (unit for flow rate: kmol/h) . . . . . . . . . . . . . . . . XIA.21 result table of sensitivity analysis in decanter using DIBA with varied
CO2 mole flow rate (unit for flow rate: kmol/h) . . . . . . . . . . . . XIA.22 Result table of sensitivity analysis in decanter using HXA with varied
The Paris Agreement, published in December 2015, introduces the 2◦C target whichis widely accepted by countries and districts around the world [1]. The target showsthe great resolution of human beings in mitigating global warming, and from anotheraspect reveals the importance of reducing greenhouse gase in current situation.
Ever since the industrial revolution, the carbon dioxide, known as the most commongreenhouse gas emitted by all kinds of industries was increasing dramatically due tothe growth in global fossil fuel consumption. This on-going growth in global fossilfuel consumption [2], and the long road to widely replace fossil fuels with cleantechnologies, will be contributing to the continuous growth in the total amount ofCO2 if no practical strategies are utilized. One possible option for us to control theCO2 emission and realize our 2◦C target is the carbon capture and storage, knownas the CCS technology.
CCS is the well-understood way that is able to remove CO2 from flue gas released forinstance by power plants. Main parts of CCS are carbon capture, carbon transportand carbon storage. The CO2 capture part is studied with most focus, since it isthe dominating step that could significantly add additional operating cost to theemitting power plants.
Carbon Capture
Well-understood CO2 capture methods at present are post-combustion carbon cap-ture, oxy-fuel combustion process, pre-combustion capture, and inherent separation[3].
Post-combustion capture removes CO2 from exhausted gas. It is a retrofittingmethod to control carbon emission for combustion process, and can be applied inmost of the existing power plant[4]. For post-combustion capture, proper selectionof solvent and arrangement of process structure can elevate the efficiency and reducecost, that is the mainly study area of this project. However, post-combustion cap-ture process usually work under low pressure condition (same as ambient pressure,or slightly higher than the ambient), that means energy is required for pressurizingCO2 after the process.
1
1. Introduction
In oxy-fuel combustion process, air is replaced by oxygen as the oxidizing agent [5].The exhausted gas of the oxy-fuel combustion process contains around 75% CO2,while the rest is H2O. CO2 concentration can reach to over 99% after condensing [6].Compared to postcombustion capture, using oxy-fuel saves some operating cost fromCO2 stripping and amine consumption, but extra cost caused by pure oxygen comingfrom intensive air separation needs to be account. Moreover, more sophisticatedequipments using advanced material for storing oxy-fuel and withstanding reactionsare needed, and the retrofitting of the emitting plant will also increase the capitalcost.
Chemical-looping combustion (CLC) is a method of inherent separation that hassimilar principle with oxy-fuel combustion. Two interlinked reactors, air reactorand fuel reactor are occupied in a CLC system. Chosen metal oxide is oxidized byair in air reactor and then react with fossil fuel in fuel reactor. The Used metaloxide is recycled back to the air reactor [7] [8]. Similar to oxy-fuel combustion, theexhaust gas after fuel reactor contains only CO2 and water which will be handledafter condensing.
The idea of pre-combustion CCS is to use steam or oxygen to react with fuel, formingsynthesis gas(syngas) which contains only CO and H2. A water-gas shift reactionwith extra steam is followed, to convert CO to CO2 and produce a great amount ofhydrogen at the mean time [9]. Pre-combustion CCS is mainly designed for NGCCand IGCC, the process however, needs high investment, and the running cost is alsohigh compared to other CCS processes [6].
Carbon Transportation
CO2 separation and capture is the start of CCS process, the following step is carbontransportation. Pressurized CO2 can be transported by onshore truck and train,offshore ship, and pipelines. Pipeline is currently a preferable option for most of thepractical CCS projects[10] that produce large amount of captured CO2. The cost ofpipeline transportation increases following the increasing of transporting distance,and in some cases, shipping can be a better CO2 method. Thus, the decisive factorof selecting carbon transportation method is the geographic conditions.
An exception is CCS projects built for oil industry. As the oil reservoirs are naturalCO2 storing places, CO2 produced at these projects can be injected directly to there,thus no carbon transportation is needed [11] [12].
Carbon Storage
CO2 storage methods can be classified as ocean storage and geological storage, bothof the methods being developed by oil and mining technologies. Carbon storageneeds proper locations, but the capacity of carbon storage for spots is hard to know.CO2 can leak from the storing places unintentionally and threatening life of humanbeings and animals around the leaking spots. Therefore, cost of the carbon storage
2
1. Introduction
contains not only the short term cost for equipment and injections, but also the longterm cost for monitoring as well.
Ocean storage injects the captured CO2 directly into deep ocean, and the extremelyhigh pressure at the storing location will compress the CO2 to liquid with densityhigher than water. The cost of ocean storage is not fixed, because of the varied costfor CO2 injections, the deeper the storing location is, the higher price will be.
The other way is to store CO2 geologically at places like deep saline formations, oiland gas reservoirs and unminable coal beds. For oil and gas reservoirs, injectingCO2 to reservoirs can at the same time provide a force to drive out fossil fuels, aconsiderable amount of energy can be saved in that way.
1.2 Solvent Based Post-Combustion Carbon Cap-ture Process
Post-combustion carbon capture (PCC) has high utilization and installation poten-tial in CO2 emission reduction process. One major reason is that PCC does notrequire main retrofitting changes on plant flowsheet or component design [13], es-pecially in countries where abundant fossil fuel provide economic solution for largescale power production. Considering the typical large capacity sizes, PCC are highlypossible to lead final emission reduction in short term. However, the integration withflue gas after-treatment process does require both technical and economic analysis.Various factors including appropriate heat source for the capture process, securetransport and storage facilities also limit the investment and implementation possi-bility.
In mature modern power plants, the flue gas is normally sent to after-treatmentincluding particulate matter and desulfurization treatment. After this point theflue gas will be directed to CO2 separation process, as in most PCC design cases.
There were already several solvent based industrial application of PCC in differentscales. Prior to PCC, aqueous amine solution has been commonly used in naturalgas sweetening field for decades [14]. Previous acquired experience of amine basedabsorption serve as cornerstones for the choice of appropriate absorbent molecules,as well as complete PCC process design. Among the abundant amine family, Mo-noEthanolAmine (MEA) has been preferred for high reactivity even at low CO2pressure [15], low cost, and relatively low thermal degradation [16].
MEA absorption demonstrates considerable 90% removal efficiency, while the mainobstacle of promotion lies in high energy and cost requirement[3]. Heat required inthe process mainly lies in solvent regeneration process, where steam is used to heatthe solvent and strip CO2 out of solution. From previous testing results, 30% weightbased solution has reported an energy requirement of 3.7 GJ/ton CO2 [17] to 4.3GJ/ton CO2 [18] under different plant testing and CO2 loading conditions, resulting
3
1. Introduction
in cost of 40-100 $/ton CO2 captured [19].
Except for considering diverse PCC process designs, increasing solvent concentrationand mixing amines, there has been focus on investigation of phase change amineswhich possibly reduce cost to large extent. Thus the range of studied solvents hasexpanded to various compounds, aiming at high absorption capacity and low energyconsumption. The focus of this thesis will be a group of phase-changing amines [20]which present phase separation properties at varying temperature ranges.
In the previous commonly adopted absorption process, alkanolamines includingMEA were preferred, because at that stage liquid-liquid separation was consideredas a shortcoming [21]. The hydroxyl structure in MEA indeed prevents phase sepa-ration from water [15]. But as the research scope expands, phase changing solventsoffers considerable energy reduction potential due to its liquid-liquid equilibriumcharacteristic. Researchers in IFP Energies nouvelles developed a DMXTM process,which undergoes phase separation after absorption [21]. Less flow rate entering thestripper and higher solvent cyclic capacity enables the stripper to work at reducedheat duty.
Moreover, another advantage lies in possibly diminished reboiler temperature, whichprovides opportunity of utilizing industrial excess heat. For example, the MEAprocess requires heat at 120-130 ◦. If this could be reduced, there is significantpotential to integrate industrial excess heat. This and further process integrationpotential contributes to energy and cost optimization [22].
1.3 Aim of thesis projectBased on available experimental data from recent studies in phase-changing solventsfor PCC, the main object of this thesis work is searching for appropriate amineabsorbents that have phase-changing property and can be used in DMXTM processor other similar process, to largely reduce reboiler energy demand for high carbondioxide removal efficiency.
The thesis starts with study of amine candidates detailed in their performance inphase separation and desorption process. Modeling and simulation for the carboncapture process using Aspen Plus is then performed to compare the energy reduc-tion achieved for the identified promising candidates. After that, sensitivity analysisis needed to see the reliability of the modeling result, and meanwhile understandlimitations and the inaccuracy of process simulation. Different process configura-tions are studied to see their potential in reducing energy consumption to a greaterextension.
4
2Theory
In the following chapter, theory about amine-based absorption reaction mechanism,reaction equilibrium constant calculation, as well as VLLE background used in thiswork are discussed.
2.1 Phase Change Solvent Absorption Flowsheet
MEA Absorption
Figure 2.1: MEA absorption flowsheet
The MEA absorption flowsheet is shown in Figure 2.1. The process begins with re-actions between flue gas and amine aqueous solution in the absorber at near ambienttemperature, and subsequent heating of rich CO2 loaded solution releases CO2 inthe stripper component. Heat exchanger utilizes the high temperature lean aminestream after stripping. Flow mixed with CO2 and other vapor is condensed in the
5
2. Theory
condenser after stripper, so CO2 can reach a high purity. CO2 after the condenserwill be pressurized for transportation and further storage [3].
Compared to the MEA process, the main improvement in DMXTM process is thereduced flow to the stripper because of the liquid-liquid phase separation of solvent-water-CO2 mixture in a decanter [21]. After reaction with flue gas, the rich CO2loading solution is separated into two liquid phases, where only the one with concen-trated CO2 is sent to the stripper, and the lean one is recycled back to the absorber.The vapor-liquid-liquid equilibrium (VLLE) property varies according to differentmolecule chosen, solution concentration etc, which affects the composition and flowrate of two phases.
2.2 Amine Absorption Reaction MechanismAmines suitable for phase-changing carbon capture should exhibit several importantfeatures: phase-separation performance, absorption capacity, and regenerability instripper. The studied amines react with CO2 according to different mechanisms,considering their chemical structures. Basically amines could be divided into threegroups according to the number of hydrogen atoms replaced by function groups:primary, secondary and tertiary amines represent amines categories according toone to three substituents, respectively.
As in equation 2.1, first and secondary amine aqueous solution mainly attend car-bamate formation (CF) [23][20], which is the core caption and typically not reaction
6
2. Theory
rate limited. The absorption capacity is also affected by factors including aminesolubility, insoluble salt formation and amine aqueous solution concentration.
For tertiary amines, the lack of free proton results in the formation of bicarbonatebeing the main capture equation (eq.2.2). Researchers also studied reactions includ-ing carbonic acid formation (eq.2.4). Yet formation of carbonic acid is relativelyslow and negligible compared with overall reaction rate [23].
Thus in the study scope of thesis work, mainly CF reaction (2.1) is assumed forprimary and secondary amines, while tertiary amine goes through bicarbonate for-mation (2.2) .
RNH+3 +RNHCOO− ⇔ CO2 + 2RNH2 (2.1)
CO2 +RNH2 +H2O ⇔ RNH+3 +HCO−
3 (2.2)
CO2 +RNHCOO− + 2H2O ⇔ RNH+3 + 2HCO−
3 (2.3)
CO2 +H2O ⇔ H+ +HCO−3 (2.4)
2.3 Liquid Liquid Equilibrium of phase-change amine
Total Gibbs energy and the fugacities are used as criteria when considering equilibriain a multicomponent systems. For a multicomponent system, when T and P isconstant, equilibrium is reached when Gibbs energy is minimum [24] [25].
Fugacity is another alternative for chemical phase equilibrium calculation. Com-pared to Gibbs energy, it is a straightforward extension of its application to purefluids. For a liquid-liquid equilibrium system, the equilibrium compositions can begiven as 2.5. In the equation, the superscripts α and β are used to mark the differentliquid phase. γ in equations stands for the activity coefficient, and x represents themole fraction of i in one of the liquid phases [24].
f̂αi = γαi xαi P
sati = f̂βi (2.5a)
γαi xαi = γβi x
βi (2.5b)
There is a possibility that three phases can coexist together, two liquid phase andone vapor phase. And the equation to describe this vapor-liquid-liquid equilibrium
7
2. Theory
is given as 2.6.
f̂αi = γαi xαi P
sati = f̂βi = yiP = f̂Vi (2.6a)
γαi xαi P
sati = γβi x
βi P
sati = yiP (2.6b)
For vapor-liquid-liquid equilibrium, stable T and P are important factors. Whilefor liquid-liquid equilibrium, only T affects.
2.4 Absorption and StrippingAbsorption and stripping are two important unit operations in solvent-based post-combustion CO2 capture. Flue gas is firstly sent to a unit where one or somecomponents are taken away by nonvolatile liquid added to the system. The processis called absorption, and the unit where the process taking place is the absorber.Absorption can be physical and chemical. Physical absorption is caused becausecomponents have higher solubility in solvents than in gas. In chemical absorption,this solubility is enhanced by chemical reactions taking place between the absorbercompound and the solvent.
Chemical absorption can be reversible and irreversible. For solvent-based carboncapture, absorption is usually reversible,that is CO2 can be released out in strip-per, where the reverse reactions are favored because of different process operatingcondition [26].
8
3Methods
This chapter explains methods adopted in study and comparison between potentialamine candidates according to performance in reaction, separation and regeneration.Details in subsequent Aspen Plus flowsheet modeling including component settings,layouts variation, reaction definition etc. are discussed as well.
3.1 Study of Phase-Change Solvents
There are already studies and experimental results about some phase-change sol-vents, stating their potential and limitation in carbon capture process. So the studystarts from selecting appropriate amines and compare them using Aspen Plus, whichis a cornerstone for later flowsheet setting up.
3.1.1 Property Method in Aspen PlusTo start investigating available solvents in the study, the property methods areimportant to know. Collections of models and methods used to compute ther-modynamics and transport properties in Aspen Plus are called property methods.According to the different equations used and the calculating sequences, propertymethods are classified into 10 groups in Aspen Plus V8.8 1. These groups are rec-ommended to be used under different conditions. Good choices of property methodswill benefit the system in later simulations [27].
From equations 2.1, 2.2, and 2.3, amines studied in this project reacts with carbondioxide, and ions are formed in the reactions. Due to the existence of ions, ELEC-NRTL turns to be a preferred method since it accounts for electrolytic system. Butwhen ELECNRTL is occupied in the system, problems occurs and Aspen can’t cor-rectly process the calculation. The main reason for this is that ELECNRTL doesn’tplay well with the phase separation in decanter. When this methods is using, thedecanter will either not recognize molecules and report errors, or not able to performthe liquid-liquid separation and give out wrong result that have only one stream outfrom decanter.
1 10 groups in Aspen: IDEA, Refence correlations for specific components, Liquid fugacityand K-value correlations, Petroleum tuned equations of state, Equations of state for high pressurehydrocarbon application, Flexible and predictive equations of state, Liquid activity coefficients,Electrolyte activity coefficients and correlations, Solids processing, Steam tables
9
3. Methods
Since the phase separation in decanter is one of the main study aims for this thesisproject, other methods are tried to see if they are suitable to be used. Among thestudied methods, UNIFAC-LL turns out to be an available alternative. The methodcan be used to play with liquid-liquid equilibrium in decanter, and can help to plotternary diagram in Aspen.
3.1.2 Aspen Component SpecificationBefore processing the modelling in flowsheet, components need to be specified in thesystem. Most of the commonly used components have already existed in data-bankin Aspen Plus V8.8. For electrolyte problems, Elec Wizard on Select Componentssheet can be used to input ionic components and relative reactions into system.
Seldom used molecules and ions that are not yet exist in Aspen data-bank canbe defined by user, i.e., by providing the molecular structure 2. For propertiesof these user-defined components, there are two methods provided by Aspen toevaluate using their structures, one is to evaluate by NIST TDE, and the other isto estimate through the property estimation tool. Both of the methods however,can only provide rough estimation for components. It is thus very important toperform cross-checking (and fitting of the underlying property models) of the mostimportant properties for the scope of the process modelling, if experimental dataare available.
3.1.3 Property Check and ModificationFor user-defined anions and cations, one noticeable problem is that the system stillrecognize them as molecules. So the molecule weight of these ions are modified tocorrect value.
lnp∗,li = C1i + C2i
T + C3i+ C4iT + C5ilnT + C6iT
7i forC8i 6 T 6 C9i (3.1)
Another noticeable problem is incorrect vapour pressure estimation of ions in Aspenproperty estimation. Extended Antoine Equation (eq.3.1) is used in Aspen to cal-culate vapour pressure, and relevant C1 to C9 values are estimated by the propertysystem. This is a crucial property for absorber and stripper simulation. The C1values of molecules are modified to ensure zero ion emission. Detailed C1 to C9values are given in Appendix A.1.
3.1.4 Aspen Ternary Diagram StudyThe mixture of certain amines with water in the presence of CO2 exhibits two liquidphases under certain conditions. The main object is to figure out their liquid-liquidphase separation performance and working range. Aspen Plus 8.8 works as theproperty estimation tool.
2Ions defined and imported by users are recognized as molecular form in Aspen, properties asfor molecule weight need to be modified manually to avoid errors in later simulation
10
3. Methods
Ternary diagram analysis is the preliminary tool for checking VLLE behaviour. If theamine aqueous solution shows phase separation possibility, the diagram describes theseparation result for diverse working conditions through tie lines and phase envelopeas in Figure 3.1 below. Only mixture compositions in the envelope are separatedinto water and lipophilic phase, while the two ends of tie line indicate compositionof corresponding outflow.
The preferred result is relatively complete separation of carbon dioxide, while watercould exist in both flows. Then only the heavy CO2 loaded flow is sent to furtherdesorption. So the criteria of filtering amine at this section is that they could showphase separation envelope in the ternary diagram.
According to Zhang, Qiao, Agar [20], certain amines have shown promising exper-imental results on absorption capacity, regenerability and reaction rate. Based onthat, 7 amines are selected for our ternary mixture diagram study. 6 of them fulfilthe criteria. These 6 amines are listed in Table 3.1 below, together with respectiveVLLE ternary diagrams (Figure 3.1 to Figure 3.6). While study on DMCA 3 showsthat the working envelope is close to none, which is given in the Appendix FigureA.1.
Although from the diagrams, EPD and CHPA show better phase envelope rangethan others, this cannot conclude they are the best performing amines. The reasonscan be that ternary diagram study does not consider chemistry, and the compositionsof two separated phases are also important factors.
2,6-Dimethyl piperidine (26-DMPD) Tertiary 504-03-0 NO
3DMCA : N,N-Dimethyl Cyclohexyl amine
11
3. Methods
Figure 3.1: VLLE ternary diagram DIBA
Figure 3.2: VLLE ternary diagram DPA12
3. Methods
Figure 3.3: VLLE ternary diagram HXA
Figure 3.4: VLLE ternary diagram CHPA
13
3. Methods
Figure 3.5: VLLE ternary diagram 26-DMPD
Figure 3.6: VLLE ternary diagram EPD
14
3. Methods
3.1.5 Decanter Separation StudyAlthough ternary diagram is a primary property data checking tool, more detailedand accurate phase-separation modelling is indeed necessary. The decanter block inAspen performs liquid-liquid separation according to molecule property estimation,so it is selected as the subsequent study method. As mentioned in previous chap-ter, UNIFAC-LL method is selected due to focus on liquid liquid equilibrium andseparation.
There were trials and errors in this section. Global chemistry equation and iondefinition are two most influencing factors during the modelling. The first obstacle isthat, when defining chemistry in Aspen, all the relevant cations (RNH+
3 ) and anions(RNHCOO−) do not exist in Aspen database. When user defined ions are in thesame chemical reactions with system defined ions (e.g., H+, HCO−
3 ) the modellingproblems appeared in Aspen. Thus the chemistry adopted is merely carbamateformation as equation 2.1 for primary and secondary amines. However, EPD and2,6 DMPD are tertiary amines, and their chemistry is supposed to follow equation2.2. So the user-defined ions are inevitably in same equation with system ions. Thedecanter is limited in estimating these two amines phase separation. The comparisonmainly focuses on the other four molecules.
The other obstacle, it is discovered decanter block cannot perform phase separationcalculation with chemistry definition in the decanter. So the results of the separationin the decanter are therefore serving only as first estimations and need to be refinedwith more accurate equilibrium data/models.
Figure 3.7: Decanter modelling setting for amine study
A mixer is used for modelling the absorption between CO2 and amine solution, asin Figure 3.7. Consider the above mentioned decanter limitation, the flowsheet isdivided into two sections, and decanter lies in the one with no chemistry. Workingconditions and inlet flow settings shown in table 3.2 are used.
Table 3.3 demonstrates the compositions of two decanter outflows of four molecules.Detailed composition of two outflows are in Appendix A.19 to A.22. The amine
15
3. Methods
Table 3.2: Basic Flowrate and Column Setting in Decanter Modelling
Base CaseFlow Rate
CO2 7.5 Kmol/hrAmine 15 Kmol/hrWater 50 Kmol/hrColumn
Mixer Temp 20 CDecanter Temp 40 CPressure 2 bar
flowrate in table is the sum of amine molecule and ionic forms. Rich phase refersto rich CO2 loaded phase. All molecules except for CHPA show preferred results.For molecule CHPA, almost all water exists in lean amine phase, and only 14% ofrich phase composition is water. So this solvent was not considered because theconcentration of water in the rich phase could be too low for dissolution purposesof the CO2-solvent system. The rest three molecules are recognized as potentialcandidates.
However, in this limited period of study, it is possible for us to select two amiesconsidering the modelling time required. Another reason is that the estimated solu-bility data reference that is used in later steps is available temporarily for these twoamines, not for HXA. Based on the various amine type, we choose DIBA (secondary)and HXA (primary) in further flowsheet modelling for wider comparison .
Table 3.3: Water and Amine Flowrate in Two Separated Phases
Lean Amine Phase Rich Amine Phase Fraction in Rich Phase
Kmol/hr Water Amine Total Flow Water Amine Total Flow Water AmineDIBA 40.445 0.006 40.451 9.555 14.994 24.549 0.389 0.611HXA 38.470 0.069 38.539 11.530 14.931 26.461 0.436 0.564CHPA 47.508 0.014 47.522 2.492 14.986 17.478 0.143 0.857DPA 37.826 0.052 37.877 12.174 14.948 27.123 0.449 0.551
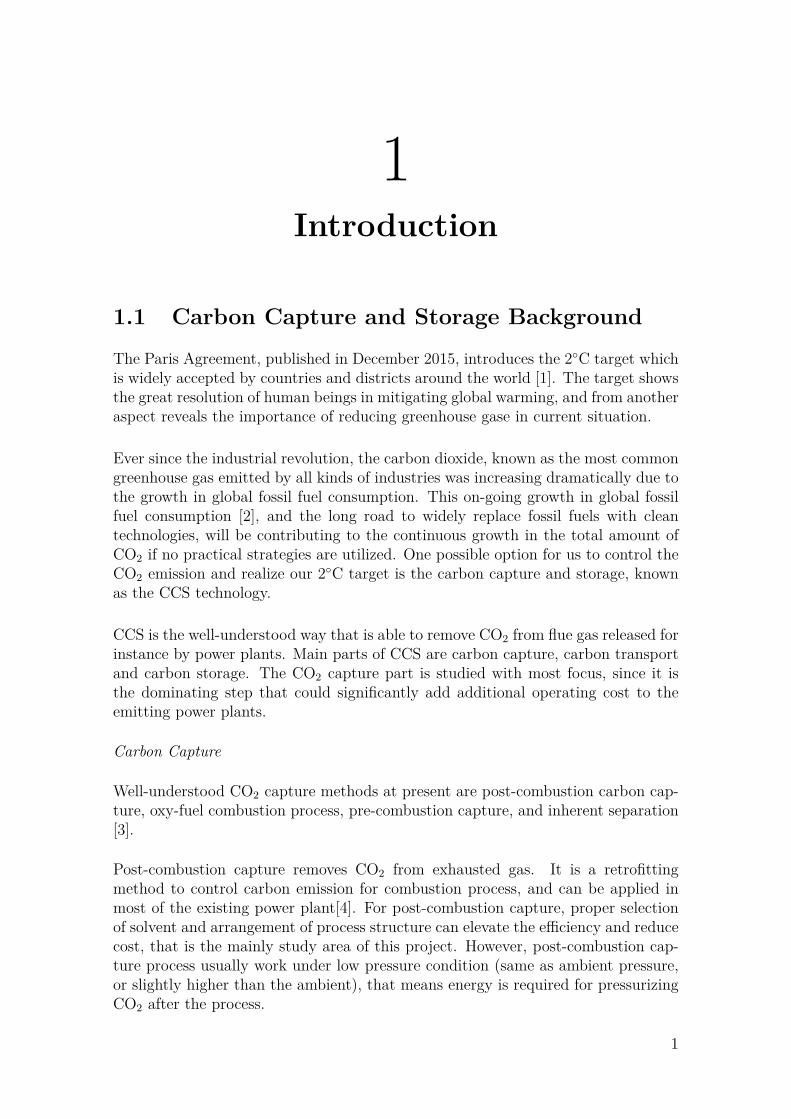
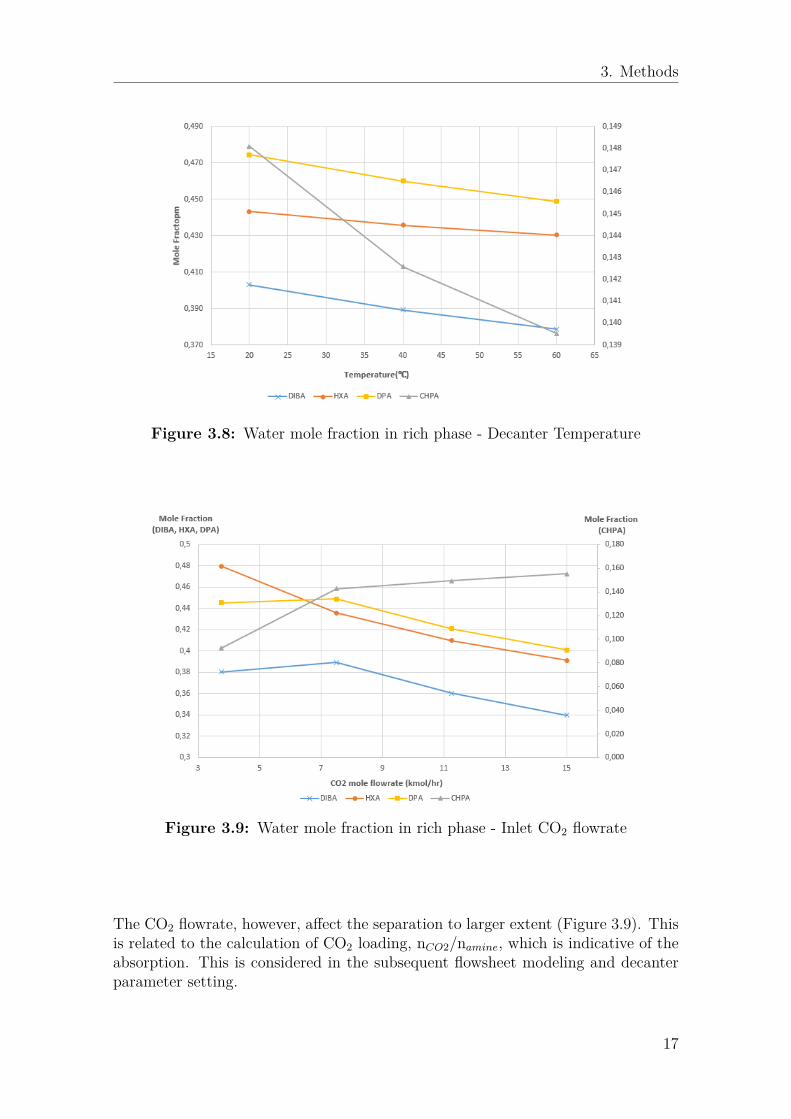
Besides, the decanter temperature and inlet CO2 amount values are varied to studytheir effect on water mole fraction in amine rich phase. Elevated decanter tempera-ture has similar influence on all four molecules, and the result is not highly sensitive(Figure 3.8). Temperature increase of 40 ◦C only leads to less than 2% difference inmole fraction.
16
3. Methods
Figure 3.8: Water mole fraction in rich phase - Decanter Temperature
Figure 3.9: Water mole fraction in rich phase - Inlet CO2 flowrate
The CO2 flowrate, however, affect the separation to larger extent (Figure 3.9). Thisis related to the calculation of CO2 loading, nCO2/namine, which is indicative of theabsorption. This is considered in the subsequent flowsheet modeling and decanterparameter setting.
17
3. Methods
3.2 Define Reaction Equilibrium ConstantSolution chemistry is needed in calculations to solve electrolyte problems. Reactionequilibrium constant - Keq is specified. However, available keq value of studiedamine is not available due to limited study or experiment, so they are estimatedaccording to available MEA value.
3.2.1 Reaction Keq in MEA FlowsheetMEA chemistry is generated from the Elec Wizard in Aspen, the process that MEAreact with water and CO2 to form carbamate is described in three equations 3.2shown below, and their keq value can be read from Aspen. They are listed inAppendix table A.3.
CO2 + 2H2O ⇔ H3O+ +HCO−
3 (3.2a)
MEA+ +H2O ⇔MEA+H3O+ (3.2b)
MEACOO− +H2O ⇔MEA+HCO−3 (3.2c)
If we add these three equations together, we’ll get equation shown as 3.3 which isused in this study (see also section 3.1.5).
MEACOO− +MEA+ ⇔ 2MEA+ CO2 (3.3)
The equilibrium constants of 3.3 is the product of three constants from 3.2, and theA-E values are summed. This calculation theory is given in Appendix A1. Thenthe MEA keq value used in equation 3.3 are shown in table below.
Table 3.4: Values used for calculating the equilibrium constant in equation 3.3
ln(Keq) = A+B/T + C ∗ ln(T ) +D ∗ T + E ∗ ((P − Pref )/Pref )A B C D E keq-235.025 2538.213 36.782 -0.003 0 4.25e-8
3.2.2 Reaction keq value of studied molecules
Table 3.5: Estimated RED (relative energy difference) values
MEA DIBA HXA3.77 1.49 0.74
18
3. Methods
The MEA Keq value is only regarded as a reference for DIBA and HXA because ofthe different properties of amine structure, solubility etc. results show that DIBAand HXA have extremely good absorption and quite bad stripping when using MEAkeq values. To get a more realistic CO2 capture performance for these two molecules,their relative energy difference values (RED) 3.5 are compared to that of MEA.
Table 3.6: Estimated reaction equilibrium constant values in equation 3.3
Amine A B C D E KeqHXA -227.3 2549.61 36.8916 -0.003 0 9.4131e-5DIBA -228 2549.61 36.8916 -0.003 0 1.8955e-4
However the relationship between keq and relative energy difference (RED) is notlinear, and it’s only one of the crucial parameters that affect the reaction. It usedhere only to indicate the direction to adjust keq values. Chosen Keq values for HXAand DIBA are listed in table 3.6.
3.3 Base configuration setting upIn this part, the structure of flowsheet and setting of integrated columns in base con-figuration are discussed. A reference MEA Aspen flowsheet is used for comparison,and its flowsheeting details, parameter setting and stripper performance is given inAppendix A.2 and A.4.
The base flowsheet is shown in Figure 3.10. The absorption process occurs in theabsorber unit between inlet fluegas and lean solution, and then CO2 loaded solutionenters heat exchanger for elevating temperature. The decanter works to separaterich loading into water and lipophilic phases, so flow with of high concentration inwater is avoided from further processing in the stripper. Then the stripper and twocondensers are used to separate CO2 from amine as well as water. The stripper alsoregenerates the amine and recycles it back to absorber. Since there are losses ofamine in two columns, the makeup amine solution flow is mixed with regeneratedamine before cooling. Besides, the separated water flow from decanter can be recy-cled and used for mixing with amine lean solution to make the whole process a closeloop.
3.3.1 Calculating methods for absorber and stripperFor the absorber and stripper used in the flowsheet, Aspen Plus provides some unitoperation models for either shortcut or rigorous calculation. Shortcut models areused for determining values as for reflux ratio and number of stages in distillationcolumns with one feed and two product streams . While the rigorous models is usedfor rigorous design and rating calculation in different kinds of columns, more inputs
19
3. Methods
Figure 3.10: Base case configuration
are needed to process calculation[27]. In this study, RadFrac model is selected forboth absorber and stripper. RadFrac is a rigorous model for all types of multistagevapor-liquid fraction operations which include absorption and stripping, and it’ssuitable for multi-phase system [28].
There are two alternatives for the calculating methods in Radfrac columns, one isequilibrium-based method while the other is rate-based. In the project, equilibrium-based method is used first to process the simulation and get initial values. Thenthe method is changed to rate-based, and the diameter gained from the previoussimulation is used as a first estimation for the rate-based calculation.
3.3.2 Stream and column settingsThe fluegas containing CO2 enters the absorber in the bottom stage, while the Leaninstream loaded amine solution enters at top stage. The treated fluegas leaves columnfrom top, while the amine solution loaded with CO2 exits the bottom. Neithercondenser nor reboiler is required in absorber, and the total stage is set to 12. Topstage pressure is set to the same as the entering stream, 1.06 bar, and the totalpressure drop in the column is 0.6 bar. The detailed settings for different scenariosare listed in appendix table A.5 and A.7.
The stripper uses a reboiler to heat the rich loaded solution. After sufficient regen-eration , the recycled lean amine solution leaves from the bottom of the stripperwhile CO2 is emitted from top. Both condenser and reboiler are required in thestirpper to ensure the effective separation between liquid and vapour phase. The
20
3. Methods
reboiler heating causes substantial amount of water vapour exiting from the top, sotwo external condensers are added for flash procedure. They are working at 76 ◦Cand 25◦C separately. Separated water is recycled back to stripper as a reflux flow,entering the first stage.
The internal kettle reboiler is defined with reflux ratio, an initial value of 3 is ten-tatively defined, while later it is adjusted according to the overall flowsheet closeloop requirement. Detailed input parameters stages, reflux ratio, pressure, columndiameters of all scenarios are listed in table A.5, A.6, and A.7.
In order to conveniently compare the amine performance with MEA, the fluegasflowrate and composition is set as the same value as in MEA basic flowsheet: 18.4% wt CO2, 70.2 % wt nitrogen, 7.1% wt water, and 4.3 % wt oxygen with the totalmole flowrate at 213.67 kmol/hr. Fluegas temperature is set to 48 ◦C.
All the crucial column and stream input parameters are listed in Appendix A.8, A.9and A.10.
3.3.3 Close-loop mass balance and design specificationsThe recycled lean flow from stripper eventually enters the absorber after mixing withmakeup flow. This changes the flowsheet from open loop to close loop, so majormolecule amount (apparent component) need to reach convergence at Lean-in andLean-out flows, i.e. water, amine and CO2 flowrate. Three corresponding designspecifications ensure the close loop mass balance.
The amine and CO2 amount at Lean-out flow is affected by the reaction in absorberand stripper, as well as inlet amine solution composition. When the reaction keqvalue is fixed, stripper settings are main influencing factors that affect the bottomproduct composition. Thus one design specification is used for CO2 apparent com-ponent convergence. The stripper reflux ratio is mainly adjusted within 1-10, sinceit highly affects the stripping product.
In this shortcut flowsheet, there are only amine losses through absorber and strippervapour outflow. Amine makeup is specified according to mass balance. In practicaloperation, amines are added in the form of aqueous solution in Makeup stream,rather than pure amine. This supplementary water amount is also considered inwater mass balance.
The water loss is composed of absorber, stripper vaporization and condenser wastewater. According to the simulation results, the water contained in the fluegas isabsorbed into the Rich stream in the absorber. So there is still extra water in theLean-out stream even if the Makeup water is adjusted to zero. To ensure overallwater mass balance, waste water removal in the system is required. So a waste waterseparator block is added on decanter lean stream. Similar to amine mass balance,the makeup water flowrate is defined by design specification.
21
3. Methods
Apart from mass balance, another design specification is added to reach the sameremoval efficiency as MEA, 90 % (CO2 amount in stream CO2/in stream Fluegas).Lean-in solution flowrate is varied, because the absorbed and stripped CO2 amountis highly sensitive to amine amount. While other parameters including CO2 loading,keq value also affect the removal and regeneration reaction in the two columns, sothey are studied in subsequent process as a sensitivity analysis on capturing andstripping performance.
3.3.4 Flowsheet improvement - add condenser unit for re-cycling amine
Figure 3.11: Add condenser for amine recycling
From the base case configuration, it is discovered that there is potential in reducingamine emission loss from the two columns, which is around 220 kg/ton CO2 forDIBA, and 100 kg/ton CO2 for HXA. In this configuration, solvent emitted fromabsorber and condenser are recycled to mitigate the environmental effects and re-duce the operating costs (Figure 3.11). The gas out from the absorber is sent toa condenser, where the solvent and water are cooled, separated from the treatedgas and sent to the mixer before the absorber. Moreover, the outlet stream of thestripper condenser, containing solvent, is sent to the same mixer instead of beingreleased. The flowsheet can reduces more 79-99% of the solvent loss. Thus in otherconfigurations, this procedure is also utilized as a improvement scenario.
22
3. Methods
3.4 Other ConfigurationsSome researches have studied the optimization of flowsheet for the solvent-basedpost combustion CO2 capture to give out better performance of components andsave operation cost. Two other configurations are studied, one by adopting doublestrippers, and the other is to rearrange heat exchanger placement [29, 30, 31].
3.4.1 Double Stripper Configuration
Figure 3.12: Configuration of double strippers with different operating pressure
Configuration with two strippers operating under different pressure are tried first,in Figure 3.12. The rich amine stream is split into two streams by a splitter in acertain ratio. Streams are sent to two strippers, and the top pressure of strippersare set to 160 and 295 kpa respectively, both with pressure drop of 6 kpa. Streamssplit from the separator are feed to the top stage of strippers and flow from the highpressure stripper outlet is sent to the mid stage of low pressure stripper since it haslower CO2 loading.
Split ratio at the splitter has direct impact on the reboiler heat duty in strippers.For DIBA case, 25% of the separated flow is sent to the low pressure stripper whilethe rest of flow is sent to the other stripper. And for HXA this value is 20%. Notonly the split ratio, but the solvent properties also have influence on the requiredheat duty of strippers. So for each amine, the split ratio and operating pressurecan be optimized to obtain lower energy demand. But we should note that thedouble strippers used will increase the capital cost, considering their relatively highpressure.
The double stripper column input settings different from the base configuration arelisted in Appendix A.6.
23
3. Methods
3.4.2 Configuration with Rearranged Heat Exchanger
Figure 3.13: Configuration with Rearranged HX Placement
The other configuration is about the heat exchanger and decanter placement. In thebase configuration, heat exchanger only elevate the rich stream temperature by 20◦Cdue to small hot and cold stream flowrate ratio. If the heat exchanger is placed afterthe decanter, only the CO2 rich loaded phase enters the heat exchanger, and thewater phase is avoided from unnecessary heating. According to the decanter perfor-mance, water phase account for around 50% total mass flowrate, that means half ofthe heating demand can potentially be saved. Substantial cold stream temperatureincrease is expected. This configuration gives advantage in the stripper inlet streamtemperature, which affects the reboiler duty. The revised flowsheet is in Figure 3.13.Relevant revised heat exhanger input parameters are listed in Appendix A.9.
3.5 Degradation Estimation
The solvent loss in the system consists of these major parts: emissions from theabsorber and stripper, thermal and oxidative degradation. The evaporation losscould be estimated from Aspen in two column vapour off flows, and a makeup flowof amine solution is added for compensation.
The degradation estimation is not performed in Aspen because of lack of degradationdata in the form of in the form of reactions and kinetics. Although there are studiesabout MEA degradation in the CO2 absorption process, the relevant data aboutnew phase change amines are limited.
24
3. Methods
In this section, the degradation estimation is based on experimental and simulationresults from MEA. According to Goff and Rochelle [32], under normal operationconditions, MEA oxidative degradation is assumed to be 0.29 - 0.73 kg/ton CO2captured. Badr [33] concluded amine degradation rate estimation of four aminescompared to MEA, as in table A.11. According to similar amine structure and type,the estimation for DIBA and HXA take the value of 8 and 3.5 times of MEA, whichgives the value of 4.08 and 1.785 kg/ton CO2 captured respectively.
Table 3.7: Amine degradation rate estimation based on MEA
Amine Degradation ratio a Amine type SourceDEA 0.71 Secondary Freeman[34]DGA 2.75 Primary Freeman[34]
a The ratio between Amine and MEA degradation rate
Thermal degradation is simplified to be 10% of total degradation according to MEAthermal degradation value. Davis [36] reported a value of 0.019 kg/ton CO2 cap-tured. Except for direct degradation, the degradation products accumulate in thesystem, which requires a purge stream to remove them. The regeneration unit isassumed to be 95% efficiency, so another 5% loss is considered in this procedure.These values are used in analysing the total solvent makeup cost. The estimatedvalues of thermal, oxidative degradation, and loss from purge are given in AppendixTable A.11.
3.6 Economic and Environmental AnalysisOperating cost
The operating cost consists of low pressure steam cost, cost for the process water,electricity and solvent make-up. Low pressure steam is used in the reboiler forthe stripping process. Amine cost include emission makeup and degradation cost.Process water is the makeup water in system. Electricity cost is from pumps andcompressors installed in the system.
For solvent make-up cost, amine prices affect the results. Prices for common aminelike MEA and DIBA can be gained directly from global chemical products trans-action network as ’Alibaba’ and ’Molbase’, or supplier as Sigma-Aldrich. But foramine that is rarely used in industries, or is not yet available on market, their pricesshould be estimated. Also note that fluctuations of prices for the same amine are
25
3. Methods
inevitable, thus the average reference price on these supplier platforms are utilizedfor more objective comparison.
Environmental Effect
When considering the potential of utilizing studied amines in industrial process,the environmental impact is a crucial factor, especially when the original aim ofabsorption process is to reduce global warming potential. Three factors are studied,CED, GWP and EI99 points.
CED is the cumulative energy demand of a product, which represents the totalenergy amount during the process of extraction, manufacturing and disposal [37].The value contains energy acquired from fossil fuel as well as energy gained fromrenewable energy during the life cycle of a product, and the unit used here for CEDis MJ/kg.
Cumulative energy demand (CED) and reference prices for several studied aminesare listed on table 3.8 [38]. Since CED represents the total energy demanded duringthe process of producing amines, the higher CED is likely to refer to a higher price.A scatter figure of studied amines with horizontal axial of CED, and vertical axialof prices is plotted to investigate the link between these two values. The relation-ship between these two values, if established, could be used in predicting price ofcandidates available for phase-changing PCC process.
Table 3.8: reference price and environmental index for studied amines
From figure 3.14, most of the studied amines locate close to the trending line, whileDGA and PZ are away from the line. It reveals that for commonly used aminesin industries, price have tighter link to the CED value, but CED is not the onlyfactor linked to price. To predict price of amines accurately, factors such as scarcityof amine, scale of production, difficulty of transport and reservation should also beinvolved. So in our cost analysis, the DIBA and HXA price from reference websiteis directly used, as values in Table 3.8.
GWP stands for the the global warming potential, which is another important valueused in LCA. It represents the cumulative radiative forcing value caused by greenhouse gas emission for a given period of time, evaluated by the amount of CO2 thatcould cause the equivalent impact [3]. The unit of GWP is kg CO2 − eq.
EI99 is the eco-indicator 99, it is a method of weighting environmental effect. It isa comprehensive indicator integrated with various environmental effects in life cycleassessment. Higher EI 99 points expresses greater impact on environment.
26
3. Methods
Figure 3.14: CED vs Price for studied amines
Background data for the assessment are provided in the Appendix. Utility price inA.12, amine and utility CED, EI99, GWP in A.13 and A.14.
3.7 Assumption and LimitationCrucial assumptions are made for the modelling. The most influencial and sensitiveassumptions are reaction equilibrium value estimation, decanter VLLE, input ofuser-defined molecules and all the amine ions. All the assumptions are summarizedin table 3.9.
The chemistry definition for each studied amine specifies all the reactions, whichcould affect the performance of absorption and stripping to large extent. In ourflowsheet the main assumptions are reaction in the form of equation 2.1 and equilib-rium constant value. The solubility relevant RED values of DIBA, HXA and MEAindicate the relative absorption capability. However the assumed keq value lacks realdata for validation. The choice of appropriate keq value lies in certain range. Thisassumption is the most influential factor, so a sensitivity study on the keq value isdone.
Another major assumption is about VLLE in the decanter block. The phase separa-tion are estimated by Aspen according to property estimation. However, this coulddiffer from the actual phase separation data. It is also assumed to be no reaction inthe decanter block.
User-defined molecules and ions property estimation also affect the modelling ac-curacy. Property estimation are performed based on structure. Aspen recognizesuser-defined ions as molecules, which limits the ion estimation accuracy.
27
3. Methods
Table 3.9: Assumptions
Assumption Direct ImpactKeq value (Tab.3.6) Absorption and stripping reactionPhase separation in decanter Phase composition of outflowsSimplified chemistry (eq.2.1) Carbonic acid reaction neglectedNo chemistry in decanter Phase composition of outflowsInput user-defined ions and molecules Lack of property estimation accuracy
28
4Results
The three different configurations, base case, double stripper, and HX rearrange-ment, are studied and compared. And they result in 7 scenarios for each aminesolvent, with different flowsheet or calculation modes. Description for these scenar-ios are listed in Table 4.1. The MEA flowsheet in Aspen is used as reference casefor comparison.
Table 4.1: Seven Studied Scenarios
Scenario Flowsheet setting Columns1 Base case configuration Equilibrium2 Base case configuration Ratebased3 Base case configuration, add amine recycling Ratebased4 Double stripper configuration Ratebased5 Double stripper configuration, add amine recycling Ratebased6 HX improvement configuration Ratebased7 HX improvement configuration, add amine recycling Ratebased
4.1 Reboiler dutyThe reboiler heating demand in all scenarios is discussed in this section, as it is themain part to look at when comparing different scenarios to MEA case. A summarygraph of all values and amine emission loss amount is given out in Figure 4.1 atthe end of this section. Detailed stripper performance results including reflux ratio,temperature for all scenarios are all given in Appendix Table A.25. Other streamdata and important results are in Appendix Table A.26 to A.39.
4.1.1 Base Case ConfigurationThe reboiler energy demand and reboiler temperature of the base case for Diisobuty-lamine (DIBA) and Hexylamine (HXA) is shown in Table 4.2. Both equilibrium andrate-base are used in the study. The total mass flow of CO2 in flue gas is fixed, and
29
4. Results
since all scenarios have the same capture efficiency as 90%, the flow rate of capturedCO2 is constant as 23.28 kg/hr. Heat duty and temperature in reboiler are twoimportant results used for comparison, they are listed in the table 4.2.
Table 4.2: Result list for Scenario 1 (equilibrium), 2 (ratebased), and MEA refer-ence
The result shows that reboiler duties required in DIBA and HXA cases are sig-nificantly lower than the MEA reference case, which is 3.49 GJ/ton CO2. Whencomparing the two candidate amines, HXA has better performance with respect toreboiler duty, while similar reboiler temperatures are required for both cases. Com-pare to the MEA temperature, there is possibly some reduction, but not enough totake these cases attractive to low-grade heat.
As mentioned in chapter 3, rate-base method provides more realistic result, to thedeviation of results gained by these two methods can be reasonable. For HXA, equi-librium and rate-base methods have very close result in reboiler duty, the differenceis 2%, but for DIBA, this difference is 14.3%. That means the calculation methodshave greater effect on DIBA, but it is not the only decisive factor in this comparison,because the design specification also adjusts the reflux ratio differently, which couldinfluence the reboiler duty. Considering this difference, especially for DIBA, theratebased calculation is adopted in all other scenarios for accuracy.
4.1.2 Add condenser for recycling amineThe base case flowsheet showed expected reboiler duty reduction performance. Butfrom the results gained by Aspen, the amine loss from column emissions in scenario2 still account for 231kg/hr (2.1% of circulating amine) and 86 kg/hr (1.0%). Thehigh supplier price of both amines makes the base case even less competitive thanMEA case. So a condenser after the absorber, and amine recycling after the stripperare added on scenario 2 to reduce the solvent emission. It shows good amine recycleefficiency for both amines. The makeup amine amount due to emission loss andreboiler duty are listed in table 4.3, as well as percentage change compared withscenario 2.
Reboiler duty is affected due to these reasons :
30
4. Results
• One design specification adjusts the stripper reflux ratio for close loop massbalance. So after recycling amine, the reflux ratio is adjusted according to newamine mass balance between Leanout and Leanin. In the stripper, this leadsto the adjustment of boilup ratio, and thus the reboiler duty.
• The Leanin flowrate that enters absorber is adjusted by another design spec-ification as well to ensure 90% CO2 removal efficiency. As a result, the richloading stream flowrate entering stripper changes, which in another aspectaffect the reboiler duty.
Table 4.3: Result lists for scenario 3
Reboiler Duty change a Amine Emission Makeup changeUnit GJ/ton CO2 % kg/hr %DIBA 1.49 - 16.83 3.51 -98.35HXA 1.20 -0.49 15.57 -79.51aCompare with scenario 2
For DIBA the improvement on emission loss is obvious, since in the base case itvaporize more. Recycled DIBA amount also lead to more reduction on the reboilerduty, and boilup ratio is decreased from 0.40 to 0.32. HXA showed the same trend.This recycling procedure is also adopted in the other two configurations to improvethe amine utilization, and lower the amine makeup.
4.1.3 Double Stripper ConfigurationSplitting fraction of stream that goes to the low pressure stripper is set to 25% and20% for DIBA and HXA respectively, meaning that a bigger part of the rich solventis sent to the high pressure stripper.
The reboiler duty results are shown in table 4.4. The result shows that this con-figuration saves 25% and 1% reboiler duty for DIBA and HXA respectively. Whenthe amine recycling part is integrated to double strippers flowsheet, the energy con-sumption for DIBA increased, mainly because high pressure stripper boilup ratiois adjusted by design specification, from 0.40 to 0.51. For HXA, the energy is 1.18GJ/t CO2, the trend is reverse, possibly due to lower split ratio and thus differentadjustment in the high pressure stripper. And boilup ratio in HP stripper decreasedfrom 0.25 to 0.24.
The results reveal that flowsheet with double strippers can save reboiler duty insome situation, but this system must be carefully investigated or optimized withrespect to the splitting ratio and stripper pressures for each solvent. Note that theadditional stripper will increase the capital cost as well as the complexity of the
31
4. Results
Table 4.4: Result list for configuration with two strippers, scenario 4 and 5
system. To accept the longer pay-back period or to gain profits from the reducedreboiler duty should be further investigated into more details.
4.1.4 Heat Exchanger Rearrange ConfigurationWhen placing the heat exchanger after decanter, the temperature of stripper inletstream is enhanced. For DIBA it’s 92◦C, and HXA 97 ◦C. This change of configu-ration leads to different results for the two amines. HXA shows substantial reboilerduty reduction, and is more sensitive to temperature than DIBA.
Table 4.5: Reboiler duty result for HX rearrange configuration, scenario 6 and 7
The results of two scenarios with and without amine recycle condenser are listed inTable 4.5. This reboiler duty in model is affected by reflux ratio, Leanin flowrateand other factors including amine solubility. As mentioned before, the estimatedreaction keq is assumed according to RED values, which is higher for DIBA. Whenchecking the stripper, if the inlet temperature is increased, DIBA indeed exhibitsworse regeneration ability, so to reach the 90% removal efficiency, the Leanin flowrateis elevated due to design specification. And thus higher volume into the stripperrequires higher reboiler heating demand.
In DIBA scenario 6, the amine loss obviously increases in the stripper, and total lossis 4% of circulating amine. While HXA in scenario 6 only lose 1%. So the aminerecyling in scenario 7 again lead to different adjustment on stripper boilup ratio, toensure new amine mass balance. The heat exchanger temperature setting could beoptimized to improve the performance in this configuration.
32
4. Results
4.1.5 SummaryThe result of all scenarios compared to MEA is shown in figure 4.1. Though severalfactors including amine amount, reboiler temperature also contribute to the perfor-mance in different scenario, the energy requirement is shown as the main studyingtarget for this project.
Figure 4.1: Reboiler duty in all scenarios, compared with MEA reference
Apparently, all HXA scenarios are more competitive than DIBA scenarios. In sce-nario 6 and 7, HXA shows duty even lower than 1 GJ/ton CO2 captured. HXAscenario 6, the one with the lowest energy demand, reaches to 74% reduction inenergy demand compared to the 3.49 GJ/ton CO2 captured in MEA reference case.This indicates the importance of the heat excahnger and decanter placement in theprocess design.
For DIBA, expect for scenario 7, all the others have energy requirement lower than2 GJ/ton CO2. The best scenario is number 4, which has double strippers withoutamine recycling. The energy requirement for it is 1.34 GJ/ton CO2, which diminishes62% compared with MEA.
From the aspect of energy requirement, all the scenarios studied except for HXAscenario 7 could be seen as promising. However, as the previous result of amineemission shows, amine make-up amount varies significantly between scenarios. Table4.6 lists amine emission loss values. Compare with amine recycling in the system,these loss are within 1 -2%. But consider the price of amine which is around 1000$/ton amine [38], this could greatly affect the operation feasibility. Consider this
33
4. Results
aspect, preferred scenarios are 3, 5, and 7. By rough estimation, others scenariosneed solvent make-up cost above 100 $/ton CO2 cap, which is not expected.
Table 4.6: Amine emission lost amount of all scenarios
kg amine/ton CO2 cap S1 S2 S3 S4 S5 S6 S7DIBA 119.14 226.11 3.42 195.23 4.65 416.91 4.59HXA 73.21 84.91 15.20 111.61 40.98 142.63 7.49
4.2 Sensitivity AnalysisSeveral crucial parameters affecting and dominating the performance are studied,and they are chosen because either they have direct link to the modelling results,or their values are estimated with significant uncertainty. The sensitivity study isbased on still the same CO2 absorption rate, 90%, and scenario 2 flowsheet.
The reaction equilibrium constant assumptions in our study requires further inves-tigation on their influence With respect to their influence on model. The A valuein equation A.10 is the dominating parameter, thus it is varied while B and C arekept unchanged. The supporting detailed data is given in Appendix Table A.23.
Firstly, the effect on absorber is studied. Although the exact keq value is not avail-able, the CO2 absorption for these two amines is reported to show good performanceaccording to Zhang,2012 [20]. Besides, from RED value given in 3.5, the two amineshave lower solubility than MEA. So Keq is varied from the same value as MEA(4.25e-8) up to 5.13e-3, since the forward reaction in equation 2.1 is stripping. Atthese two endpoints the reaction efficiency is already far from reasonable value insideabsorber.
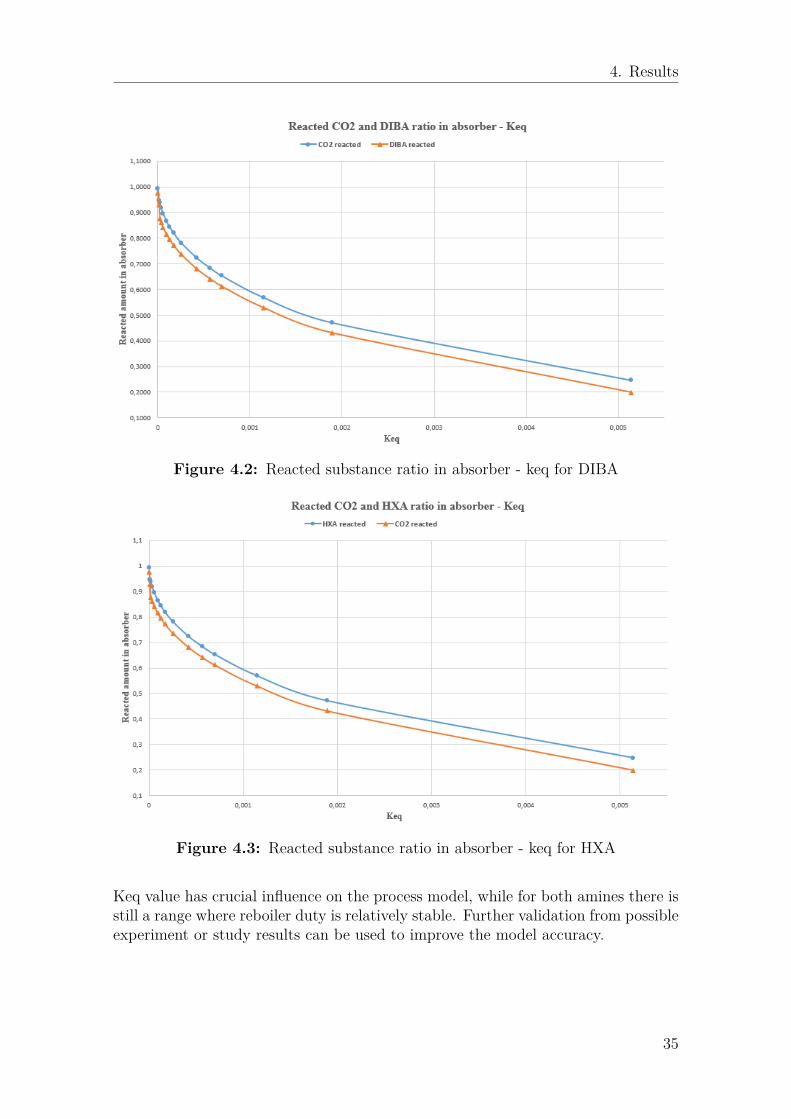
Figure 4.2 and 4.3 show almost identical performance of the two amines in absorber.It proves the significant effect of Keq value. Keq value changes the absorption ratiodirectly, it has greater impact on simulation than the calculation type set in absorbercolumn.
Furthermore, the effect on stripper duty, i.e. the energy requirement per ton CO2captured is calculated for comparison, when keq is varied between 4.25e-8 and 1.27e-5. Since equation A.10 is expressed in logarithmic format, and the keq value increasein exponential scale with linear A value change, the figure is divided into Figure 4.4and 4.5 for clear appearance.
34
4. Results
Figure 4.2: Reacted substance ratio in absorber - keq for DIBA
Figure 4.3: Reacted substance ratio in absorber - keq for HXA
Keq value has crucial influence on the process model, while for both amines there isstill a range where reboiler duty is relatively stable. Further validation from possibleexperiment or study results can be used to improve the model accuracy.
35
4. Results
Figure 4.4: Reboiler duty - keq value, A varies from -235.025 to -227.5
Figure 4.5: Reboiler duty - keq value, A varies from -227.5 to -226.5
Decanter block
The decanter block performs phase separation according to VLLE estimation by As-
36
4. Results
pen, which is limited by available database resource, calculation equation in chosenmethod, and user-defined ions as well. So a sensitivity study on the composition oftwo outflows is shown in this section. A separator block is used to replace decanter,and the separation fraction is input manually. The water, CO2 and amine splitfraction in rich phase is varied separately. The supporting detailed data is given inAppendix Table A.18.
The first varying factor is ratio of water in rich loading phase compared with totalwater entering decanter. When using the decanter, less than 10% of water goes intorich phase. Thus this value is varied within 0.01 to 0.45. The original decantercalculated value is 0.06 for DIBA, and 0.08 of HXA. As in figure 4.6, DIBA is moresensitive on water separation, while HXA reboiler duty is less fluctuating at therange close to 0.08.
Figure 4.6: Reboiler duty - water split ratio in rich loading phase compared withtotal water entering decanter
The second parameter, the split fraction of amine (molecular and ionic) in rich phaseis related to reboiler dutyand the results are in Figure 4.7. When the amine con-centration is lower, flow sent to decanter increases to ensure the 90% CO2 removal,leading to higher energy consumed in stripper.
When the ratio for DIBA is decreased from the decanter estimated value 0.999, theinfluence on energy requirement is notable, and the duty already doubles at ratio
37
4. Results
Figure 4.7: Reboiler duty - amine split ratio in rich loading phase compared withtotal molecular CO2 entering decanter
0.85. While for HXA, reboiler duty variation within the range from 0.96 to 0.75 isless than 4%, and is rising trend accelerates when ratio is lower than 0.7.
Figure 4.8: Reboiler duty - molecular CO2 split ratio in rich loading phase com-pared with total molecular CO2 entering decanter
38
4. Results
The third factor, the molecular CO2 ratio in two phases is also studied, howeverthis is expected to be less influential since the amount of molecular CO2 is verysmall, and decanter inlet stream is mostly composed by water (close to 50% massfraction). The results are shown in Figure 4.8. HXA also shows more steady reboilerperformance than DIBA.
These results indicate that the decanter estimation can be considered as more reliablefor HXA. Especially for the amine and CO2 in separated phases, variation close tothe estimated value causes performance variation within 5%. DIBA is sensitive todecanter estimation, and the amine split ratio in two phases is the most crucial valueto ensure robust and solid simulation.
4.2.2 Amine solution concentration
Figure 4.9: Reboiler duty - Amine aqueous solution weight based concentration,from 30% to 44%
The amine aqueous solution utilized in all scenarios is 44% wt DIBA solution, and38% wt HXA solution. In MEA Aspen reference case 30% wt is used. This alsoaffects the heating demand and the amine cost. So a study on different solutionconcentration is performed, focusing on the influence on reboiler duty. The solutionconcentration has multiple effect on the performance. One is that concentrationaffect the absorption and regeneration reaction, as well as amine amount in thestripper inlet, which is adjusted by design specification. Besides, different solubilityof the two amines also affects the stripper.
From figure 4.9, the trend of DIBA and HXA within 30% to 40% wt range seemssimilar (drop first, and then increase). On one side, higher concentration couldindicate the total Leanin stream flowrate decrease, to capture same amount CO2.
39
4. Results
On the other side, the concentration is affecting the reversible chemistry in bothabsorber and stripper, and the stripper reflux ratio is adjusted to meet the massbalance. In general, there is a suitable range that reboiler duty is relatively low,which is different for two amines.
The fluctuation for HXA is obvious, when concentration is down to 32%, too muchsolution needed to capture CO2 that the desorption becomes highly energy intensiveand convergence becomes difficult. So in the figure these values of HXA are notincluded. Another fact to notice is that, except for reboiler duty, to capture sameamount of Co2, the amine amount recycling in the system is also affected, sincethe flowrate and mass fraction is also changing. This is a trade-off to optimize theconcentration utilized. Detailed supporting data is given in Appendix A.18.
4.3 Economic and Environment Analysis
4.3.1 Operating costThe 3 scenarios which add condenser for recycling amine have shown much significantcost reduction, while the rest with high amine emission lost cause higher operationcost than MEA reference case. MEA reference also has the amine recycling in acondenser. So the three recommended scenarios are compared with respect to mainlysteam and amine cost. Amine cost includes the emission makeup and degradationcost. Steam cost refers to the reboiler required low pressure steam. The results areshown in Figure 4.10. Process water, electricity cost is close to negligible due to lowamount. The supporting data for operation cost and electricity penalty is given inAppendix Table A.15.
Figure 4.10: Operating cost of scenario 3,5,7 for two amines
40
4. Results
Scenario 7 with HXA is the optimum case in all studied candidates, with the costof 22.48 €/ton CO2 captured. DIBA shows best result in the scenario 3, which isthe base case.
In general, DIBA amine makeup cost accounts for lower percentage in total costthan HXA. Although more than 99% of total amine is already recycled, the highprice of two amines make this part not unimportant. The amine emission lost canpossibly be reduced with well-designed component like scrubber and condenser inindustry application. So there is indeed potential to reduce solvent cost.
Figure 4.11: CO2 Capture cost penalty in unit electricity production
A further investigation is to relate these values to the power plant production, toindicate the amount of cost required compared with electricity revenue. The fluegas(wet) adopted in our case is composed of 12 % volume CO2, and CO2 flowrate is1138 kg/hr. Assume the modeled plant is normal gas fired power plant [39] basedon fluegas composition. According to IEA carbon capture report [40], an estimatedaverage CO2 emission from natural gas plant is 348 kg /MWh. The fluegas containedCO2 flowrate in our model is 1138 kg/hr. Thus this gives estimation of the powerplant size, 3.27 MW.
The cost for capturing CO2 per unit electricity production is available. Accordingto the global average electricity supplier price by IEA [41], 55 €/MWh is chosen as areference revenue. Thus cost penalty is calculated and shown in Figure 4.11. Exceptfor scenario 5 using HXA, all other cases need a penalty within 10-30%, which is aacceptable value for either consumer or government funding.
41
4. Results
4.3.2 Environmental ImpactEI99 environment indicator factor result is shown in figure 4.12. The detailed resultsfor GWP and EI99 are given in Appendix Table A.16. The calculation is basedon estimated values for solvent, low pressure steam, electricity and process water.Different sources, production plant, and electricity type also affect the accuracy,so results are only compared between studied amines. DIBA is estimated to havelarger environment impact per unit in production, so the overall indicator values arehigher.
Figure 4.12: EI99 indicator estimation, points/ton CO2 captured
GWP is expressed in form of CO2 emission caused by capture process. Even in thebest case for DIBA, scenario 1, an offset of 18% occurs. HXA has advantage inscenario 7, with 12% offset value.
The energy consumption of steam, amine makeup, electricity and process water areall transferred to equivalent energy consumption, using CED values. Then they canbe summed and compare with MEA reference. For MEA reference, degradation isestimated and other consumption is read from Aspen. The final result is shownin Figure 4.14. The best scenario, HXA 7 reduces more than half of consumption.However this wider comparison relies on several estimated values, so it is a roughtrend analysis. The supporting data of CED is given in Appendix A.17.
42
4. Results
Figure 4.13: Global warming potential estimation, CO2eq ton/ton captured
Figure 4.14: Equivalent energy consumption
43
4. Results
44
5Conclusion
The major focus of this thesis study is to search for amine solvent, that could reachlower absorption energy demand, compared with MEA, as well as setting up suitableflowsheet layouts. It starts with study and comparison of phase change solvents.Based on previous literature and experimental data, some candidates with reportedgood performance and experimental results are screened, with the help of Aspenternay diagram and decanter block simulation. Although DIBA and HXA are twoamines that we finally choose, other amines from different research still exhibit goodstudy potential.
Besides, the limitation in this stage is mainly the input of molecules and ions intoAspen. Aspen lack proper recognition of user-defined ions, which is considered as acrucial problem affect the modelling results. A potential improvement is to modifyion property estimation, from either experimental or equation calculation. Howeverthis requires reliable experimental data.
The chemistry adopted in this study is in simplified form, considering the con-venience of study, and limitation of Aspen chemistry calculation, which is also asensitive factor.
Setting up flowsheet in Aspen gives detailed stream and column results in the ab-sorption process. In order to compare with MEA flowsheet, the initial base caseflowhsheet follows similar column sizing, and fluegas input. Both HXA and DIBAshowed good reboiler energy reduction under the same CO2 capture efficiency. Tofurther reduce the amine emission loss, improvement on recycling amine is done.Other two configurations about HX and stripper improvement are also tried. Therecould also be other layouts with different absorber or stripper setting. Within to-tally 7 scenarios, 3, 5, and 7 all demonstrate acceptable results, the best one is HXAscenario 7.
The energy consumption results showed that - for HXA all the scenarios require lessheating energy than DIBA, and the improvement on HX placement after decantersuits it best. While for DIBA the double stripper flowsheet shows better perfor-mance. For both amines, the base case configuration already reaches the energydemand of lower than 2 GJ/ton CO2 captured, more than 50% reduction of MEAreference case.
Although the results fulfill the target we aim at, it is limited by assumptions and
45
5. Conclusion
parameter estimation. The reaction equilibrium constant, keq, which is estimatedaccording to amine solubility, is a dominating factor. The sensitivity study showsthis influence. Other sensitivity on amine solution, and the decanter performancealso showed their limit on results. In general HXA is less sensitive to these param-eters.
Considering the environmental and economic impact, HXA in scenario 7 showedleast cost offset and environment impact.
To sum up, two chosen amines, especially HXA, shows good phase separation, ab-sorption and regeneration performance. They both lower the energy demand com-pared with MEA, and the offset of electricity revenue is also reduced to 10 - 20 %.For power plant suppliers, this is a potential value if they install the CCS facility,and distribute extra cost to consumers, government support etc.
Future work in this topic can be continued in different directions.• For the study itself, improved modeling based on more experimental data will
give out more realistic results, as well as diverse process designs and validationof keq estimation.
• A larger scale of amines can be studied to find more candidates available forthe process, including the DPA molecule that is excluded from the study.
• In the double stripper configuration, the splitting ratio of high and low pressurestripper, as well as working pressure could be optimized according to differentamines, minimized the reboiler duty.
46
Bibliography
[1] United Nations. Paris agreement, 2015.[2] BP. Bp statistic review of world energy 2016, 2016.[3] Ellina Levina, Simon Bennett, and Sean McCoy. Technology Roadmap: Carbon
capture and storage. OECD/IEA, 2013.[4] José D Figueroa, Timothy Fout, Sean Plasynski, Howard McIlvried, and
Rameshwar D Srivastava. Advances in co2 capture technology—the us de-partment of energy’s carbon sequestration program. International journal ofgreenhouse gas control, 2(1):9–20, 2008.
[5] BJP Buhre, LKr Elliott, CD Sheng, RP Gupta, and TF Wall. Oxy-fuel com-bustion technology for coal-fired power generation. Progress in energy andcombustion science, 31(4):283–307, 2005.
[6] Mohamed Kanniche, René Gros-Bonnivard, Philippe Jaud, Jose Valle-Marcos,Jean-Marc Amann, and Chakib Bouallou. Pre-combustion, post-combustionand oxy-combustion in thermal power plant for co 2 capture. Applied ThermalEngineering, 30(1):53–62, 2010.
[7] Bernhard Kronberger, Anders Lyngfelt, Gerhard Löffler, and Hermann Hof-bauer. Design and fluid dynamic analysis of a bench-scale combustion systemwith co2 separation- chemical-looping combustion. Industrial & EngineeringChemistry Research, 44(3):546–556, 2005.
[8] Anders Lyngfelt, Bo Leckner, and Tobias Mattisson. A fluidized-bed com-bustion process with inherent co 2 separation; application of chemical-loopingcombustion. Chemical Engineering Science, 56(10):3101–3113, 2001.
[9] Jansen Daniel, Gazzani Matteo, Manzolini Giampaolo, van Dijk Eric, andCarbo Michiel. Pre-combustion co2 capture. Greenhouse Gas Control, 40:167–187, 2015.
[10] Global CCS institue. Large scale ccs projects. website.[11] Paulo Otávio Gomes, Bill Kilsdonk, Jon Minken, Tim Grow, and Roberto
Barragan. The outer high of the santos basin, southern sao paulo plateau,brazil: pre-salt exploration outbreak, paleogeographic setting, and evolution ofthe syn-rift structures. American Association of Petroleum Geologists Searchand Discovery Article, 10193, 2009.
[12] Philip Ringrose, Mansour Atbi, David Mason, Marianne Espinassous, ØyvindMyhrer, Martin Iding, Allan Mathieson, and Iain Wright. Plume developmentaround well kb-502 at the in salah co2 storage site. First break, 27(1), 2009.
[13] Paul Feron. Absorption-Based Post-Combustion Capture of Carbon Dioxide.Woodhead Publishing, 2016.
47
Bibliography
[14] Robert N Maddox, Gilbert J Mains, and Mahmud A Rahman. Reactions ofcarbon dioxide and hydrogen sulfide with some alkanolamines. Industrial &engineering chemistry research, 26(1):27–31, 1987.
[15] Marco Aleixo, Monique Prigent, Alexendre Gibert, Fabien Porcheron, IlhamMokbel, Jacques Jose, and Marc Jacquin. Physical and chemical properties ofdmxtm solvents. Energy Procedia, 4:148–155, 2011.
[16] IEA GHG. Post combustion carbon capture from coal fired plants–solventscrubbing. International Energy Agency Greenhouse Gas R&D Programme,2007.
[17] Jacob N Knudsen, Jørgen N Jensen, Poul-Jacob Vilhelmsen, and Ole Biede.Experience with co2 capture from coal flue gas in pilot-scale: Testing of differentamine solvents. Energy Procedia, 1(1):783–790, 2009.
[18] Prachi Singh, WPM Van Swaaij, and DWF Wim Brilman. Energy efficientsolvents for co 2 absorption from flue gas: vapor liquid equilibrium and pilotplant study. Energy procedia, 37:2021–2046, 2013.
[19] Tim C Merkel, Haiqing Lin, Xiaotong Wei, and Richard Baker. Power plantpost-combustion carbon dioxide capture: an opportunity for membranes. Jour-nal of membrane science, 359(1):126–139, 2010.
[20] Jiafei Zhang, Yu Qiao, and David W Agar. Improvement of lipophilic-amine-based thermomorphic biphasic solvent for energy-efficient carbon capture. En-ergy Procedia, 23:92–101, 2012.
[21] Ludovic Raynal, Pascal Alix, Pierre-Antoine Bouillon, Adrien Gomez, Mariele Febvre de Nailly, Marc Jacquin, Jean Kittel, Angella di Lella, Pascal Mougin,and Jean Trapy. The dmx ™ process: An original solution for lowering the costof post-combustion carbon capture. Energy Procedia, 4:779–786, 2011.
[22] Hallvard F Svendsen, Erik T Hessen, and Thor Mejdell. Carbon dioxide cap-ture by absorption, challenges and possibilities. Chemical Engineering Journal,171(3):718–724, 2011.
[23] PMM Blauwhoff, GF Versteeg, and WPM Van Swaaij. A study on the reactionbetween co2 and alkanolamines in aqueous solutions. Chemical EngineeringScience, 38(9):1411–1429, 1983.
[24] J Richard Elliott and Carl T Lira. Introductory chemical engineering thermo-dynamics. Prentice Hall PTR Upper Saddle River, NJ, 1999.
[25] Walter Greiner, Ludwig Neise, and Horst Stöcker. Thermodynamics and sta-tistical mechanics. Springer Science & Business Media, 2012.
[26] Phillip C Wankat. Separation process engineering (third edition). Prentice hall,2011.
[27] Aspen Tech. Aspen plus v8.8 help list.[28] Aspen Tech. Aspen plus unit operation models reference manual.[29] P Seferlis and AN Hrymak. Optimization of distillation units using collocation
models. AIChE journal, 40(5):813–825, 1994.[30] Theodoros Damartzis, Athanasios I Papadopoulos, and Panos Seferlis. Opti-
mum synthesis of solvent-based post-combustion co2 capture flowsheets througha generalized modeling framework. Clean Technologies and Environmental Pol-icy, 16(7):1363–1380, 2014.
48
Bibliography
[31] Babatunde A Oyenekan and Gary T Rochelle. Alternative stripper configura-tions for co2 capture by aqueous amines. AIChE Journal, 53(12):3144–3154,2007.
[32] George S Goff and Gary T Rochelle. Monoethanolamine degradation: O2 masstransfer effects under co2 capture conditions. Industrial & Engineering Chem-istry Research, 43(20):6400–6408, 2004.
[33] Sara Badr. Sustainability Assessment of Amine-based Post Combustion CO2Capture. PhD thesis, Zürich, 2016.
[34] Stephanie Anne Freeman. Thermal degradation and oxidation of aqueous piper-azine for carbon dioxide capture. PhD thesis, 2011.
[35] FB Closmann. Oxidation and thermal degradation ofmethyldiethanolamine/piperazine in CO 2 capture. The University of Texas atAustin. PhD thesis, Ph. D. Dissertation, 2011.
[36] Jason Daniel Davis. Thermal degradation of aqueous amines used for carbondioxide capture. 2009.
[37] Mark AJ Huijbregts, Stefanie Hellweg, Rolf Frischknecht, Harrie WM Hendriks,Konrad Hungerbuhler, and A Jan Hendriks. Cumulative energy demand as pre-dictor for the environmental burden of commodity production. Environmentalscience & technology, 44(6):2189–2196, 2010.
[38] MOLBASE. reference price on molbase.com.[39] Xiaochun Xu, Chunshan Song, Ronald Wincek, John M Andresen, Bruce G
Miller, and Alan W Scaroni. Separation of co2 from power plant flue gas usinga novel co2 ‘molecular basket’adsorbent. Fuel Chem. Div. Prepr, 48(1):162–163,2003.
[40] IEA Greenhouse Gas RD Programme. Co2 capture at gas-fired power plantsstudy report, 2011.
[41] Fatih Birol et al. World energy outlook 2015. Paris: International EnergyAgency, 2015.
49
Bibliography
50
AAppendix 1
A.1 keq value and property estimationAspen use relevant property estimation equations for components. The most impor-tant parameters are vapour pressure. heat capacity. viscosity. boiling temperature.liquid density. The corresponding equations that Aspen use are as follows. TheExtended Antoine equation 3.1 is used for vapour pressure estimation. EquationA.2 is the ideal gas heat capacity equation. and equation A.3 is the DIPPR liquidviscosity equation. Liquid density is estimated from equation A.4. All the Ci valuesfor each component are estimated and listed in the parameter sheet.
lnp∗.li = C1i + C2i
T + C3i+ C4iT + C5ilnT + C6iT
7i forC8i 6 T 6 C9i (A.1)
C∗.lgp = C1i + C2i
C3i/T
sinh(C3i/T ) + C4iC5i/T
cosh(Cgi/T ) forC6i 6 T 6 C7i (A.2)
ln∗.lηi = C1i + C2i
T+ C3ilnT + C4iT
C5i for C6i 6 T 6 C7i (A.3)
ρ∗.li = C1i/C
1+(1−T/C3i)C4i
2i forC6i 6 T 6 C7i (A.4)
Table A.1: PLXANT parameter values
PLXANT parameter values used in equation 3.1Components DIBA+ DIBACOO- HXA+ HXACOO-
Temperature units C C C CProperty units bar bar bar bar
For a chemical equation shown as A.5, A and B are reactant chemical species, whileC and D are the product species. α, β, γ, δ are the stoichiometric coefficients of therelative reactants and products.
αA+ βB ⇔ γC + δD (A.5)
When the reaction reaches equilibrium under a certain condition, the rate of reac-tants consuming is equal to the rate of products forming, so the concentration ofboth reactants and products will stay stable. The equilibrium constant of the reac-tion can be expressed as A.6. [A], [B], [C], [D] are the activities for the respective
II
A. Appendix 1
species.
Keq = [C]γ ∗ [D]δ[A]α ∗ [B]β (A.6)
Equation A.5 will sometimes be shown as below.
αA⇔ γC (A.7a)
βB ⇔ δD (A.7b)
Then equilibrium constants for these two equations are expressed as A.8.
Keq1 = [C]γ[A]α (A.8a)
Keq2 = [[D]δ[B]β
(A.8b)
Therefore, the equilibrium constant of A.6 is able to be calculated out using A.9 ifKeq1 and Keq2 in A.8 are given.
Keq = Keq1 ∗Keq2 (A.9)
In Aspen Plus V8.8, when defining the chemical reactions, some values are neededto calculate the equilibrium constants Keq. Equation that used in Aspen calculationis shown as A.10. A-E are values to be defined to determine Keq.
ln(Keq) = A+B/T + C ∗ ln(T ) +D ∗ T + E ∗ ((P − Pref )/Pref ) (A.10)
Therefore, in a reaction written in form of separated equations, if A-E values ofthese equations are known, the corresponding A-E values of the combined equationcan be calculated by simply adding them respectively.
Table A.3: Keq Value for reactions in Carbon Capture Process based on MEA.T=340 k
Equation A B C D E keq3.2a 231.4654 -12092.1 -36.7816 0 0 9.26051E-093.2b -3.03833 -7008.36 0 -0.00313 0 -1.06586263.2c -0.52135 -2545.53 0 0 0.0003327223.3 -235.025 2538.213 36.7816 -0.00313 -1.06586068
III
A. Appendix 1
A.2 Ternary diagram of DMCA
Figure A.1: DMCA ternary mixture study diagram
A.3 Column. stream input setting in flowsheets
Figure A.2: Reference MEA flowsheet
IV
A. Appendix 1
Table A.4: MEA reference flowsheet setting. stripper results
Column settingParameter value unit Parameter value unit
Absorber
No. Stages 17
Stripper
No. Stages 13top stage pressure 1.06 bar top stage pressure 2 bar
pressure drop 0.06 bar pressure drop 0.06 barFluegas feed stage 17 Fluegas feed stage 1leanMEA feed stage 1 leanMEA feed stage 1
HX and Input Stream SettingLean-in MEA Total flow rate 18214.3 kg/hr Makeup water 204.1 kg/hr
mass frac MEA 0.28 HX hot side temp. Change 56 cmass frac H2O 0.66mass frac CO2 0.05
Table A.5: Component settings for absorber and stripper with equilibrium calcu-late type
Absorber with Equilibrium Type Stripper with Equilibrium TypeCondenser none Condenser noneAbsorber none number of stages 15number of stages 12 Reboiler kettleFluegas feed stage 12 on-stage Reflux ratio 3.7 Input valueaLean-in feed stage 1 above-stage Reflux feed stage 1 above-stageoutlet stage for rich amine 12 lqiuid Derich feed stage 1 above-stageoutlet stage for gas-off 1 phase outlet stage for liquid 15 liquidTop stage pressure 1.06 bar outlet stage for vapour 1 vaporpressure drop 0.06 bar / column Top stage pressure 2 bar
pressure drop 0.06 bar / columna Reflux ratio is controlled by design specification
V
A. Appendix 1
Table A.6: Components settings for stripper in double-stripper flowsheet (scenario4 and 5)
High Pressure StripperReflux ratio 3.3 initialFeed Stream Stage 1 above-stageoutlet stage for liquid 15 liquidoutlet stage for vapor 1 vaporTop stage pressure 295 kPapressure drop 0.06 bar/column
Low pressure StripperReflux ratio 3.7 initialFeed liquid stage 8 above-stageFeed of stream from HP stripper stage 1 above-stageFeed stream Reflux 1 above-stageoutlet stage for liquid 15 liquidoutlet stage for vapor 1 vaporTop stage pressure 160 kPapressure drop 0.06 bar/columnGeneral settings:Number of Stages:15. Reboiler: kettle
Table A.7: Column settings for Rate-based absorber & stripper in sifferent sce-narios
Amine Flowsheet AB diameter ST Diameter LP stripper(m) /HP stripper (If available)
DIBA
Base case 0.9295 0.54base case with SR 0.9295 0.72 strippers 0.9295 0.5 0.42 strippers & SR 0.9295 0.5 0.4HX after DC 0.9295 0.54HX after DC & SR 0.9295 0.65
HXA
Base case 0.9267 0.65base case with SR 0.9267 0.652 strippers 0.9267 0.6 0.492 strippers & SR 0.9267 0.6 0.49HX after DC 0.9267 0.65HX after DC & SR 0.9267 0.65
General : Tray type: Sieve Tray spacing: 0.6096m
VI
A. Appendix 1
Table A.8: Other component settings
Component Parameter value unit/commentHX a Hot side temp. Change -64 c
Condenser temperature 76 cpressure 2 bar
Coolcomp condenser temperature 25 cpressure 2 bar
Cooler temperature 35 cWaste water separator split fraction 0.98a This HX input is only for basecase. different scenarios see tableA.9
Table A.9: HX setting of all scenarios
Heat Exchanger Hot side temperature Change ValueScenario DIBA HXA Unit