Page 1
TECHNO ECONOMIC ANALYSIS OF STAND-ALONE
HYBRID RENEWABLE ENERGY SYSTEM
HANIEH BORHANAZAD
RESEARCH PROJECT SUBMITTED IN PARTIAL
FULFILLMENT OF THE REQUIREMENTS
FOR THE DEGREE OF MASTER OF ENGINEERING
FACULTY OF ENGINEERING
UNIVERSITY OF MALAYA
KUALA LUMPUR
2013
Page 2
ii
UNIVERSITI MALAYA
ORIGINAL LITERARY WORK DECLARATION
Name of Candidate: HANIEH BORHANAZAD (I.C/Passport No:
Registration/Matric No: KGI100003
Name of Degree: Master of Engineering (Electro-Manufacturing)
Title of Project Paper/Research Report/Dissertation/Thesis (“this Work”):
TECHNO ECONOMIC ANALYSIS OF STAND-ALONE HYBRID RENEWABLE
ENERGY SYSTEM
Field of Study: Electrical
I do solemnly and sincerely declare that:
(1) I am the sole author/writer of this Work;
(2) This Work is original;
(3) Any use of any work in which copyright exists was done by way of fair dealing
and for permitted purposes and any excerpt or extract from, or reference to or
reproduction of any copyright work has been disclosed expressly and
sufficiently and the title of the Work and its authorship have been acknowledged
in this Work;
(4) I do not have any actual knowledge nor do I ought reasonably to know that the
making of this work constitutes an infringement of any copyright work;
(5) I hereby assign all and every rights in the copyright to this Work to the
University of Malaya (“UM”), who henceforth shall be owner of the copyright in
this Work and that any reproduction or use in any form or by any means
whatsoever is prohibited without the written consent of UM having been first
had and obtained;
(6) I am fully aware that if in the course of making this Work I have infringed any
copyright whether intentionally or otherwise, I may be subject to legal action or
any other action as may be determined by UM.
Candidate’s Signature Date
Subscribed and solemnly declared before,
Witness’s Signature Date
Name:
Designation:
Page 3
iii
ABSTRACT
Decentralized electricity generation by renewable energy sources is considered
as a solution for remote area’s electrification. However, intermittent nature of these
sources leads to develop sizing rules and use hybrid systems to exploit them. This study
proposes an integrated PV/wind hybrid system, with battery storage and diesel generator
as a backup. Optimization method utilizes the iterative optimization technique following
the loss of power probability and the cost of electricity for power reliability and system
costs.
The optimal size of hybrid energy conversion system founded in this study can
be performed technically and economically according to the system reliability
requirements. In addition, a sensitivity analysis was carried out on the PV contribution
as the most important parameters influencing the economic performances of the hybrid
system.
This investigation is executed as a techno-economic analysis to design an
optimum autonomous hybrid PV-wind-diesel-battery system to meet the load in remote
areas of Malaysia
The hybrid system with 56-61% of photovoltaic energy penetration combined
with wind turbines, diesel generator with a rated power, and storage batteries was found
to be an optimal system and economically feasible one.
Page 4
iv
ABSTRAK
Kuasa penjanaan elektrik oleh sumber tenaga boleh baharu dianggap sebagai
penyelesaian kepada elektrifikasi kawasan pedalaman. Walau bagaimanapun, sifat
berkala sumber-sumber ini mewujudkan peraturan ukuran dan menggunakan sistem
hibrid untuk mengeksploitasi mereka. Kajian ini mencadangkan sistem hibrid bersepadu
PV / angin, dengan penyimpanan bateri dan penjana diesel sebagai sokongan. Kaedah
optimum menggunakan teknik lelaran optimum adalah berikutan kebarangkalian
kehilangan kuasa dan kos elektrik terhadap kebolehpercayaan kuasa dan kos sistem.
Sistem penukaran tenaga hibrid yang diasaskan dalam kajian ini dipercayai baik
secara teknikal dan ekonomi. Di samping itu, analisis kepekaan telah dijalankan dan
sumbangan PV sebagai parameter penting dalam mempengaruhi prestasi ekonomi
sistem hibrid.
Kajian mengkaji teknologi dan eknomi analisis terhadap system hybrid. Ini
kerana kami ingin mengoptimkan sebaik mungkin sistem hibrid yang mampu memenuhi
keperluan dan harga yang rendah dengan tenaga yang boleh dipercayai
Sistem hibrid dengan 66% penembusan tenaga fotovoltaik yang digabungkan
dengan turbin angin, penjana diesel dengan kuasa tertinggi, dan bateri penyimpanan
telah ditemui sebagai sistem yang optimum dan ekonomi tersaur
Page 5
v
ACKNOWLEDGEMENT
This research project would not have been possible without the support of many
people. First of all I would like to take this opportunity to express my deepest gratitude
to my supervisors, Prof. Dr. Saad Mekhilef and Prof. Dr. Velappa Gounder Ganapathy
who were abundantly helpful and offered invaluable assistance, support and guidance.
I wish to express my deep sense of gratitude to the officials and other staff
members of University of Malaya for their able guidance and useful suggestions, which
helped me in completing the project work, in time.
I would also like to convey thanks to the Ali Mirtaheri for his kind co-operation,
and Prof. Dr. Saidur Rahman Abdul Hakim for his help in gathering the necessary data
and information needed for this compilation.
I would like to express my eternal gratitude to my parents and family for
their everlasting love and support. Special thanks also go to my friends. To others who
have helped me either directly or indirectly, your help will always be remembered. Last
but not least, thank you all.
Page 6
vi
CONTENTS
Contents CHAPTER 1 ......................................................................................................... 1
INTRODUCTION .......................................................................................... 1
1.1 Introduction ............................................................................................. 1
1.2 Problem Statement .................................................................................. 2
1.3 Motivation ............................................................................................... 3
1.4 Project Objective ..................................................................................... 4
1.5 Thesis Outline .......................................................................................... 4
CHAPTER 2 ......................................................................................................... 5
LITERATURE REVIEW ............................................................................... 5
2.1 Introduction ............................................................................................. 5
2.2 Modeling ................................................................................................. 6
2.2.1 Photo Voltaic (PV) Technology and Modeling ................................. 7
2.2.2 Wind turbine technology and Modeling .......................................... 12
2.3 Battery technology and modeling .......................................................... 18
2.4 Diesel generator ..................................................................................... 21
2.5 DC/AC Converter (Inverter) ................................................................. 22
2.6 Criteria for optimization of hybrid renewable energy systems ............. 23
2.6.1 Economic criteria of hybrid renewable energy systems .................. 23
Page 7
vii
2.6.2 Net present cost (NPC) .................................................................... 23
2.6.3 Cost of energy (COE) ...................................................................... 23
2.7 Technical criteria of hybrid renewable energy systems ........................ 25
2.7.1 Reliability ........................................................................................ 25
2.8 Design of hybrid systems ...................................................................... 26
2.9 Sizing and optimization methods .......................................................... 31
2.9.1 Software for optimization ................................................................ 33
2.9.2 Computational optimization ............................................................ 34
2.10 Conclusion ......................................................................................... 38
CHAPTER 3 ....................................................................................................... 39
METHODOLOGY ....................................................................................... 39
3.1 Introduction ........................................................................................... 39
3.2 Simulation Approach ............................................................................. 39
3.2.1 Load profile ..................................................................................... 40
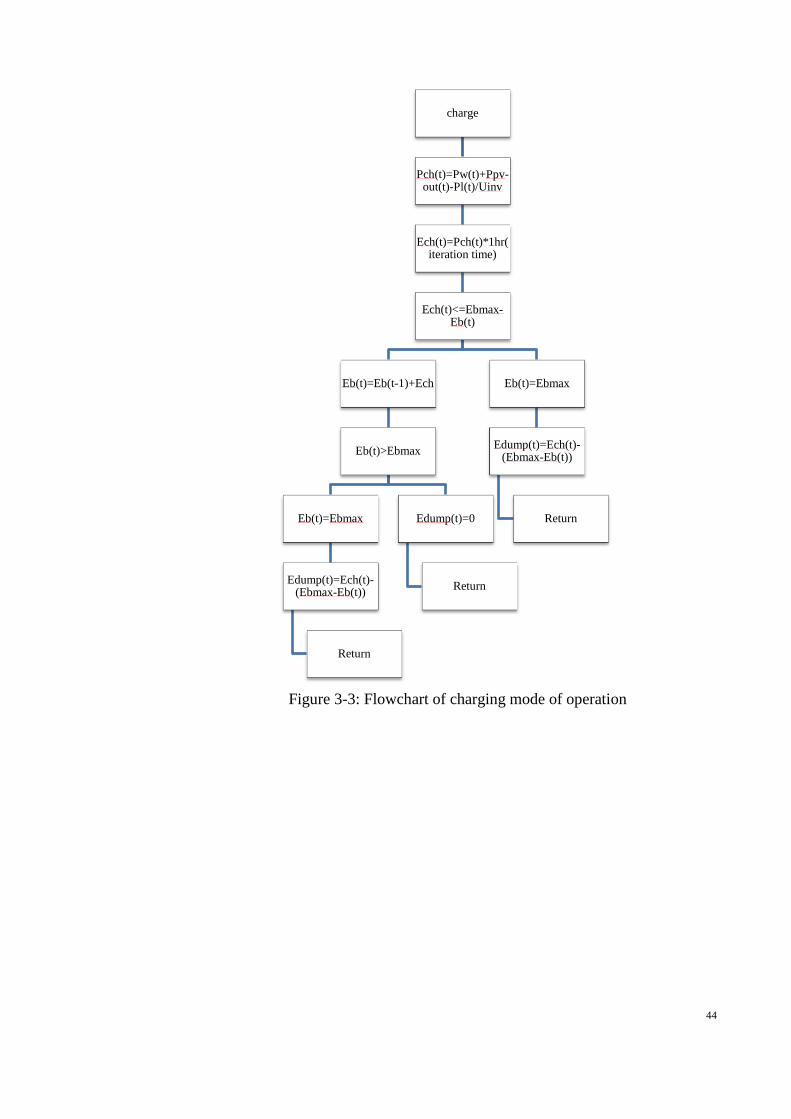
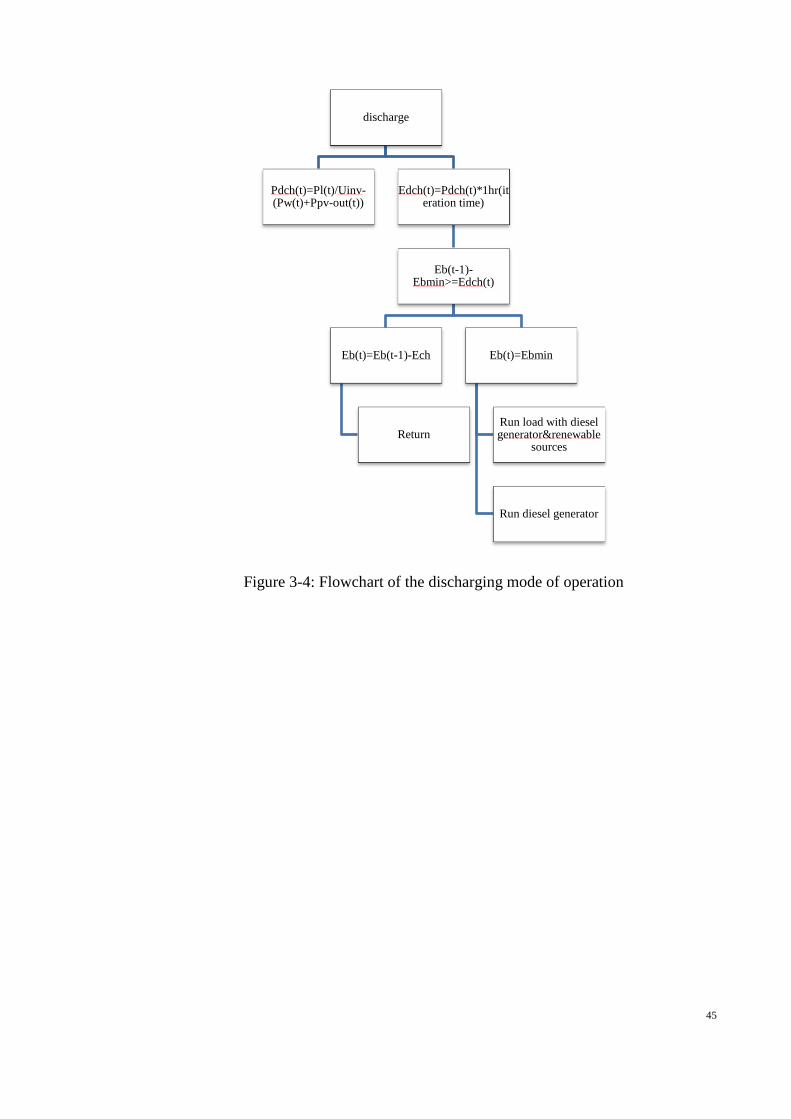
3.2.2 Power management strategies ......................................................... 41
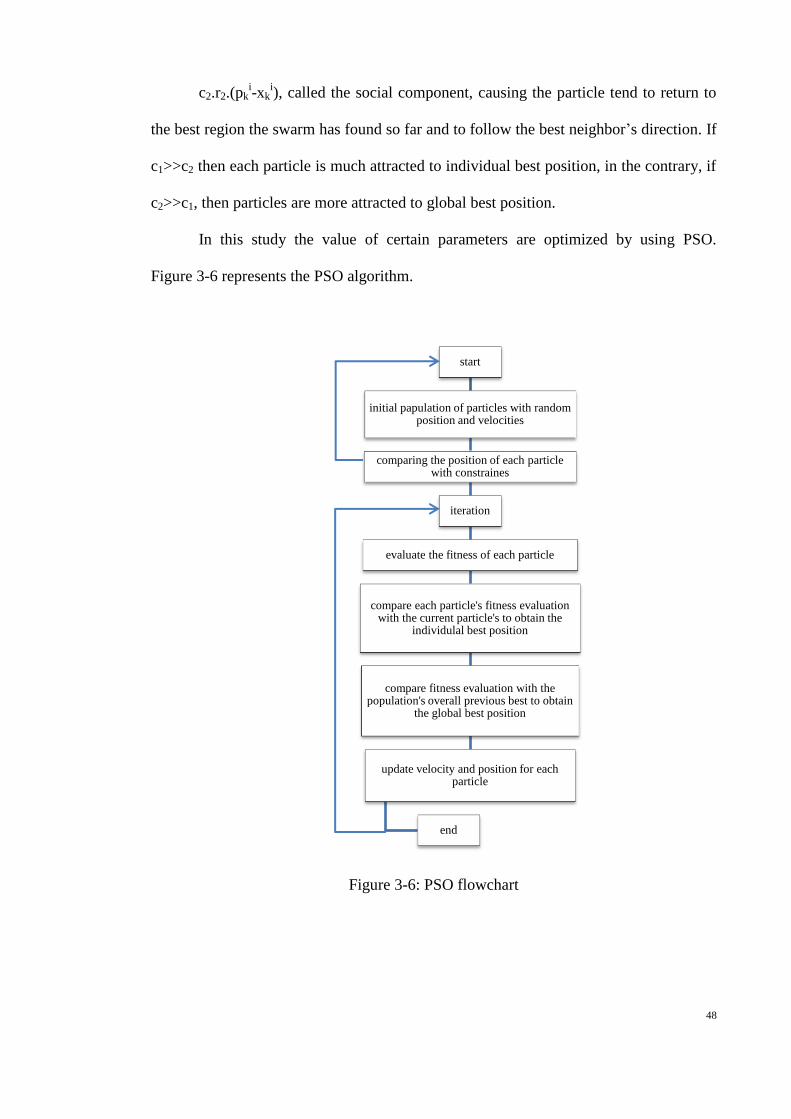
3.3 Particle swarm optimization .................................................................. 46
3.4 Reliability and economic analysis ......................................................... 49
3.4.1 Reliability ........................................................................................ 49
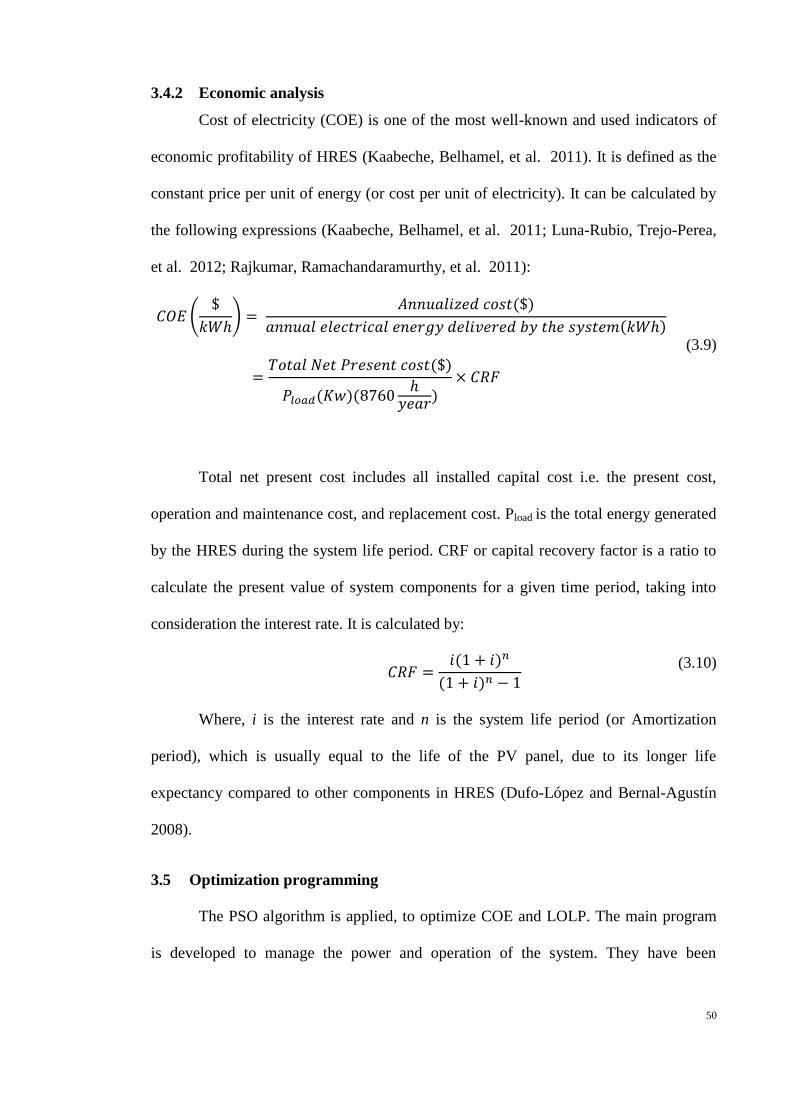
3.4.2 Economic analysis ........................................................................... 50
3.5 Optimization programming ................................................................... 50
3.6 Summary ............................................................................................... 53
CHAPTER 4 ....................................................................................................... 54
Page 8
viii
RESULTS ..................................................................................................... 54
4.1 Introduction ........................................................................................... 54
4.2 Renewable energy outputs ..................................................................... 54
4.2.1 Wind output ..................................................................................... 54
4.2.2 PV output ......................................................................................... 57
4.3 Economic analysis ................................................................................. 59
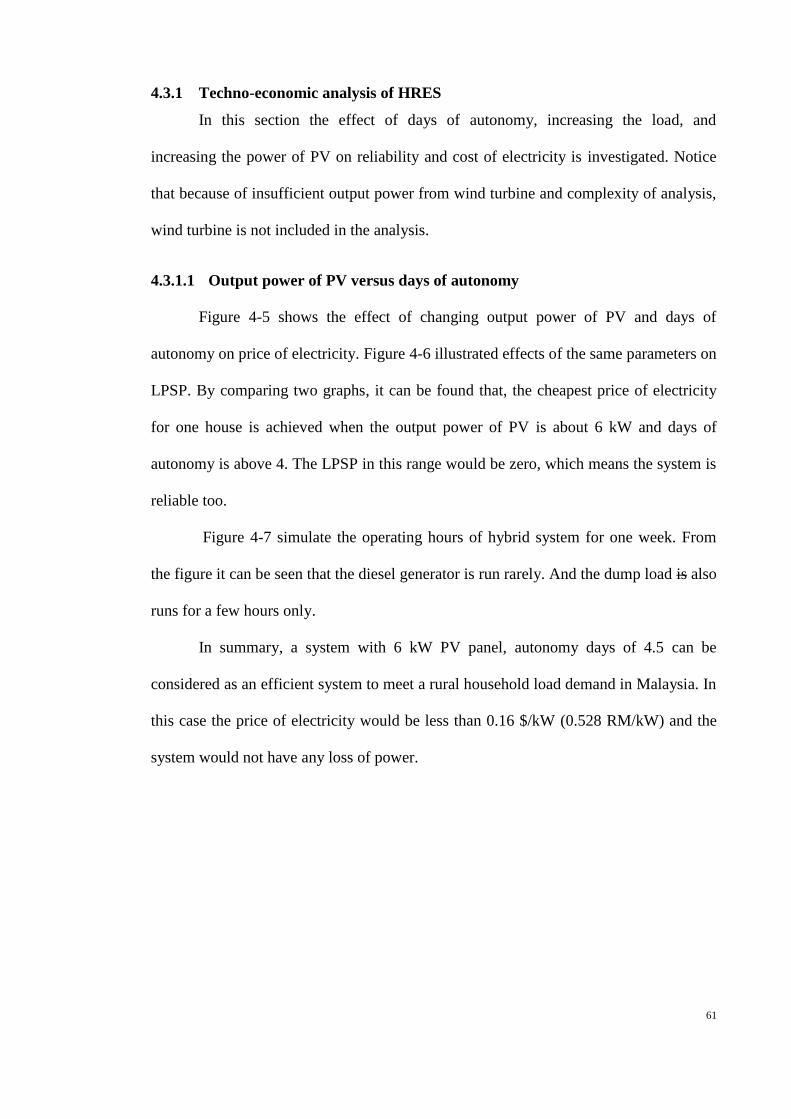
4.3.1 Techno-economic analysis of HRES ............................................... 61
4.3.2 Output power of PV versus increasing the load demand ................ 63
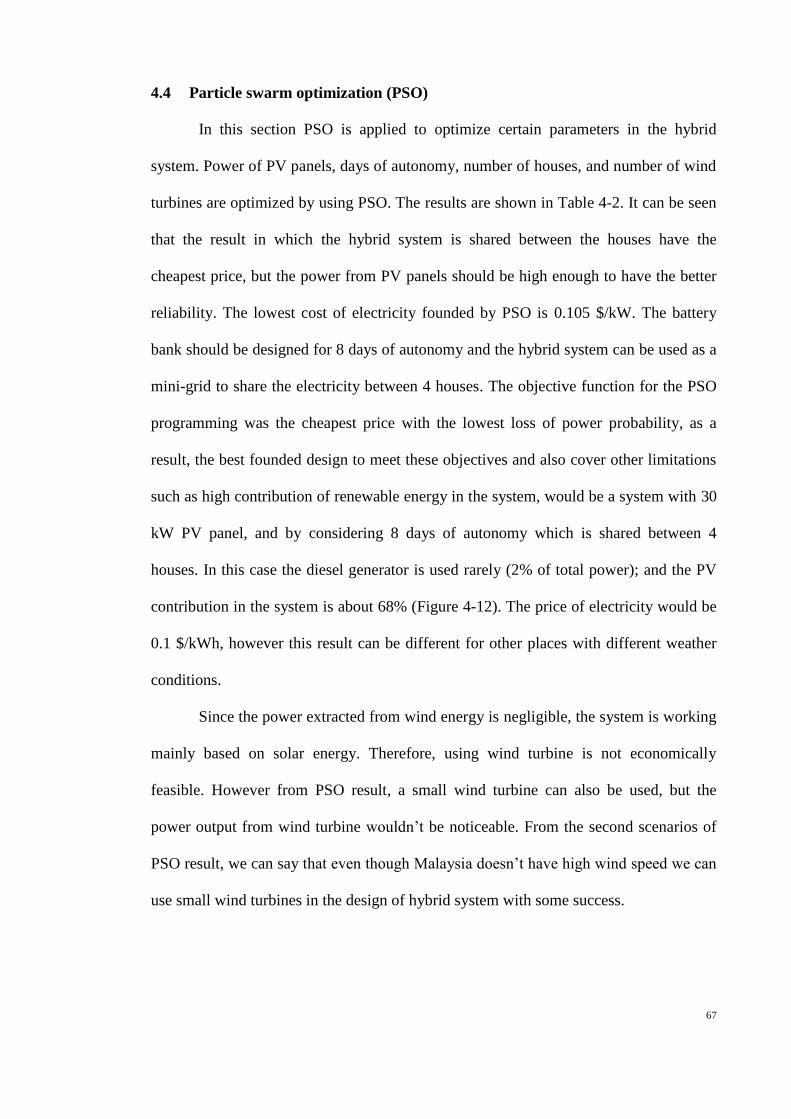
4.4 Particle swarm optimization (PSO) ....................................................... 67
4.5 Conclusion ............................................................................................. 69
CHAPTER 5 ....................................................................................................... 71
DISCUSSIONS ............................................................................................. 71
5.1 Introduction ........................................................................................... 71
5.2 Design considerations of the HRES for one house ............................... 71
5.2.1 Design of battery bank .................................................................... 71
5.2.2 Bidirectional inverter ....................................................................... 71
5.2.3 Charge controller ............................................................................. 72
5.2.4 Design of stand-alone hybrid system .............................................. 72
5.3 Design considerations of the HRESs in micro-grid configuration ........ 73
5.3.1 Design of battery bank .................................................................... 74
5.3.2 Design of micro-grid hybrid system ................................................ 75
5.4 Optimum configuration in literatures .................................................... 75
Page 9
ix
5.5 Conclusion ............................................................................................. 76
CHAPTER 6 ....................................................................................................... 77
CONCLUSION ............................................................................................. 77
6.1 Conclusion ............................................................................................. 77
6.2 Recommendation for Future Work ........................................................ 78
Page 10
x
LIST OF FIGURES
Figure 2-1:Classification of PV systems ............................................................... 8
Figure 2-2: Calculating the fill factor (FF) from the I-V curve .......................... 10
Figure 2-3: PV module ........................................................................................ 10
Figure 2-4: Power curve for typical wind turbine ............................................... 17
Figure 2-5. Block diagram of hybrid Wind -Micro turbine system .................... 28
Figure 2-6: Pv-micro turbine-battery hybrid system schematic .......................... 29
Figure 2-7: Block diagram of a hybrid wind/photovoltaic generation unit. ....... 30
Figure 2-8: System configuration of multisource alternative hybrid energy
system. ................................................................................................................. 30
Figure 2-9: Architecture of HOMER software. .................................................. 34
Figure 2-10: Optimization of hybrid systems. .................................................... 35
Figure 3-1: Hourly typical rural household load profile (kW) ............................ 40
Figure 3-2: Main flowchart of the hybrid system ............................................... 43
Figure 3-3: Flowchart of charging mode of operation ........................................ 44
Figure 3-4: Flowchart of the discharging mode of operation ............................. 45
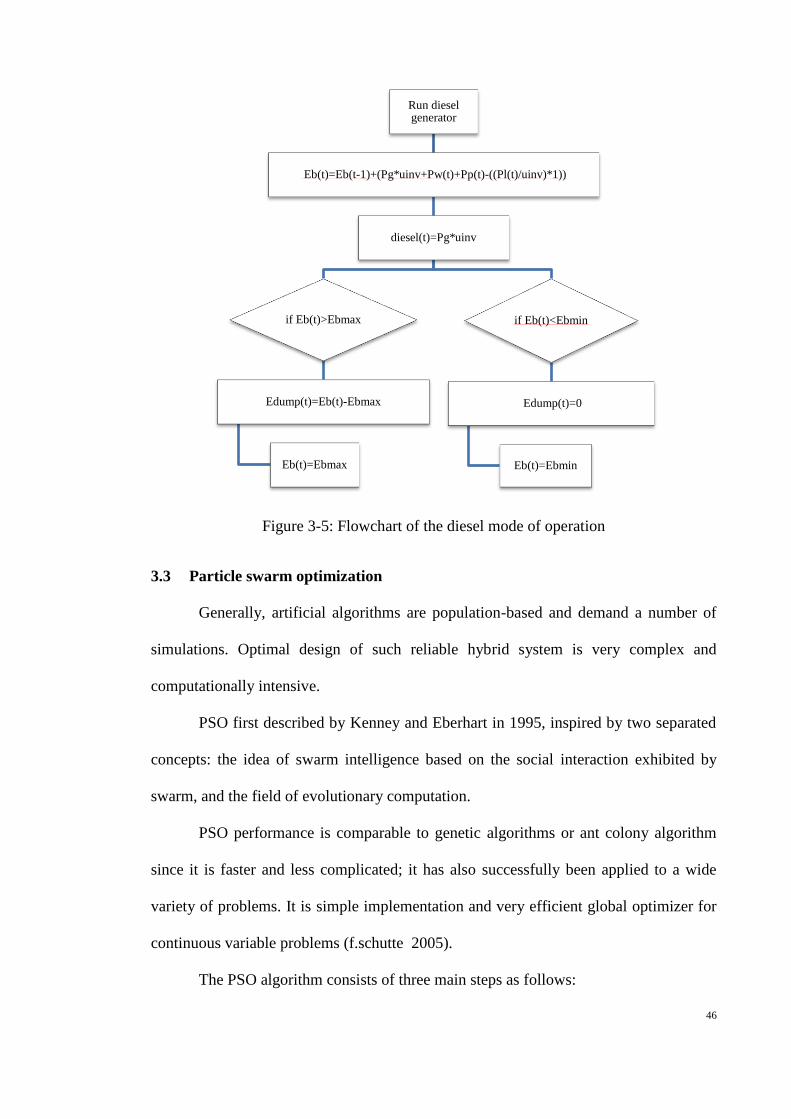
Figure 3-5: Flowchart of the diesel mode of operation ....................................... 46
Figure 3-6: PSO flowchart .................................................................................. 48
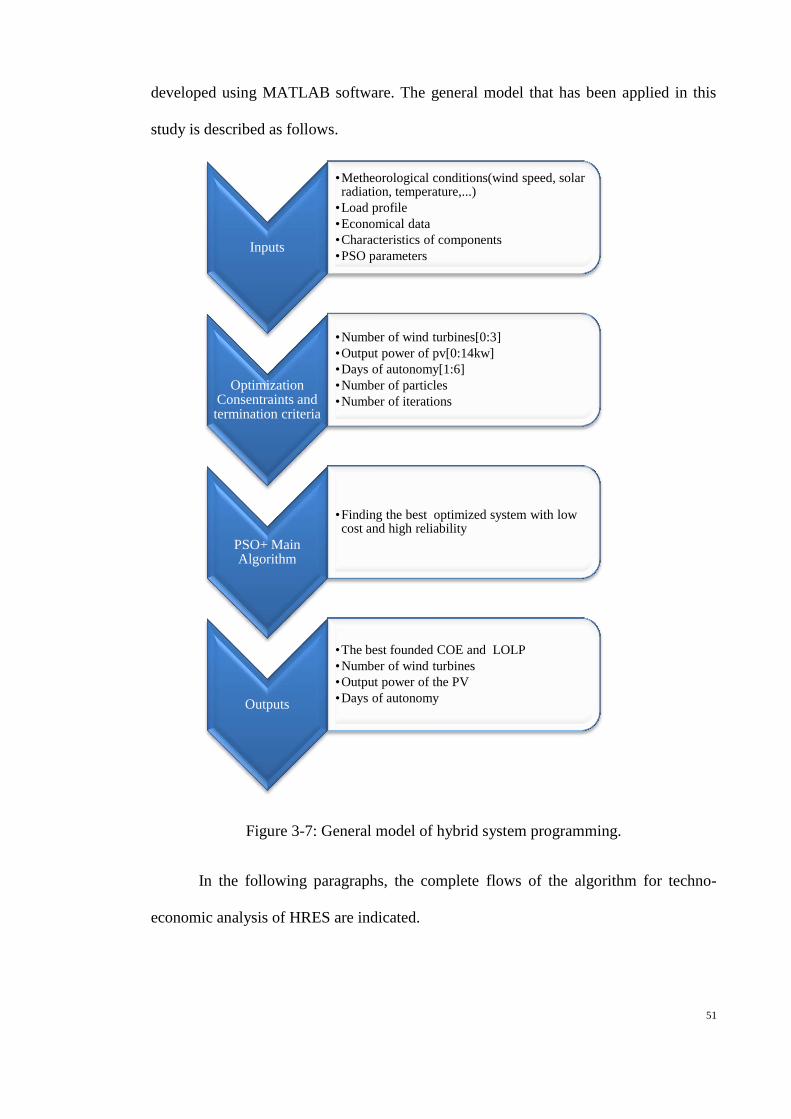
Figure 3-7: General model of hybrid system programming................................ 51
Figure 4-1: Hourly wind speed data in Malaysia ................................................ 56
Figure 4-2:Average daily output power from wind turbine in Malaysia ............ 57
Figure 4-3: Average monthly ambient temperature. ........................................... 58
Figure 4-4: Average daily output power from PV in Malaysia .......................... 59
Figure 4-5: Price of electricity for one house ($/kW) ......................................... 62
Page 11
xi
Figure 4-6: LPSP for one house .......................................................................... 62
Figure 4-7: Operation of hybrid PV-battery-diesel system in one week ............ 63
Figure 4-8: Price of electricity for 4 days of autonomy ...................................... 65
Figure 4-9: LPSP for 4.5 days of autonomy ....................................................... 65
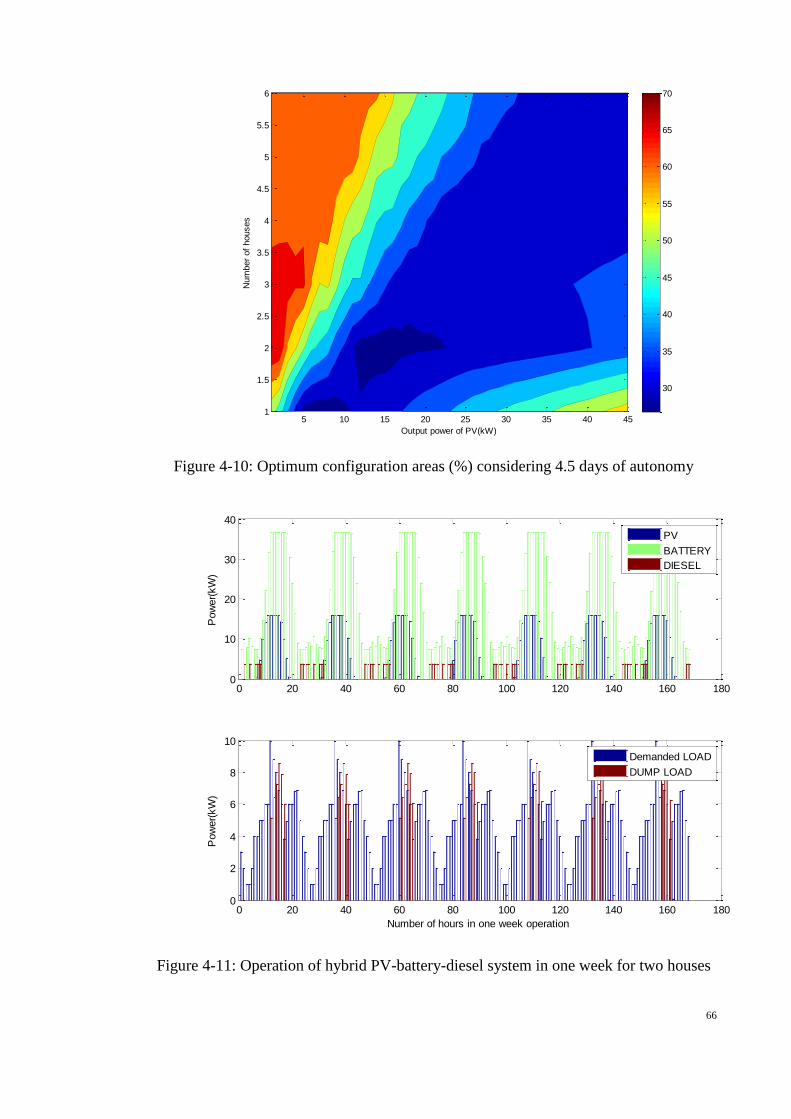
Figure 4-10: Optimum configuration areas (%) considering 4.5 days of
autonomy ............................................................................................................. 66
Figure 4-11: Operation of hybrid PV-battery-diesel system in one week for two
houses .................................................................................................................. 66
Figure 4-12: Best configurations founded by PSO ............................................. 68
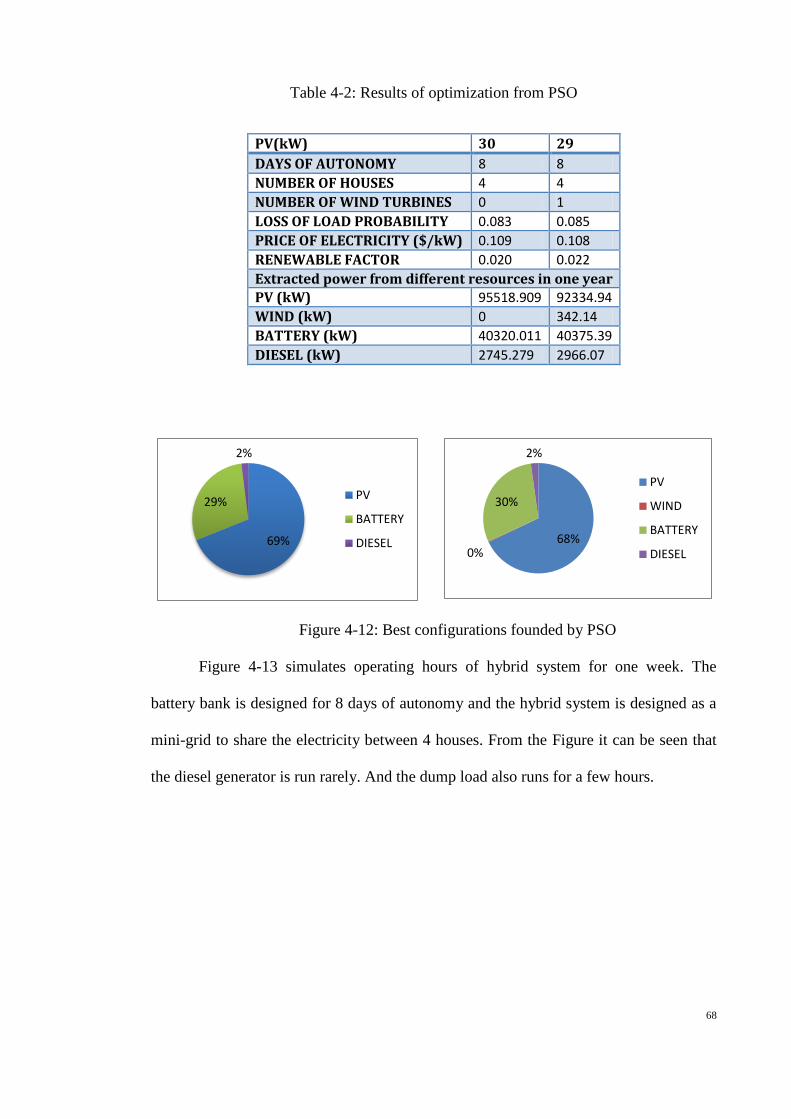
Figure 4-13: Operation of hybrid PV-battery-diesel system in one week for four
houses .................................................................................................................. 69
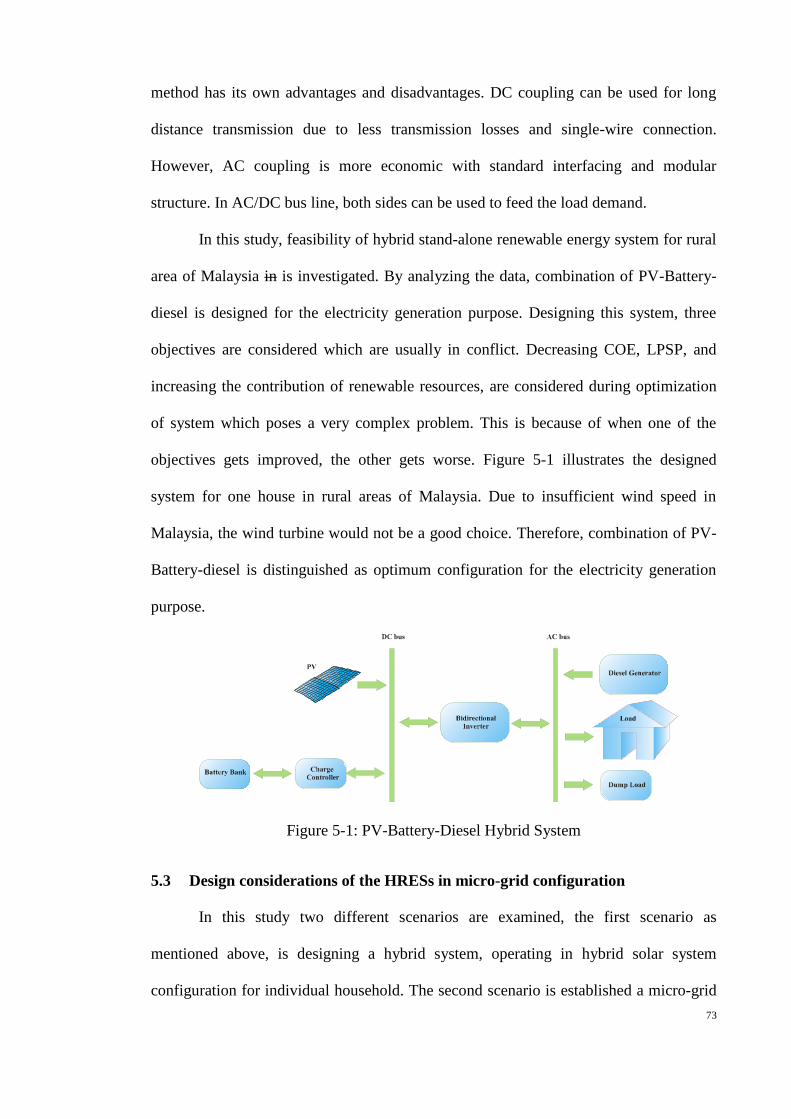
Figure 5-1: PV-Battery-Diesel Hybrid System ................................................... 73
Figure 5-2: Schematic design of micro-grid hybrid system ................................ 75
Page 12
xii
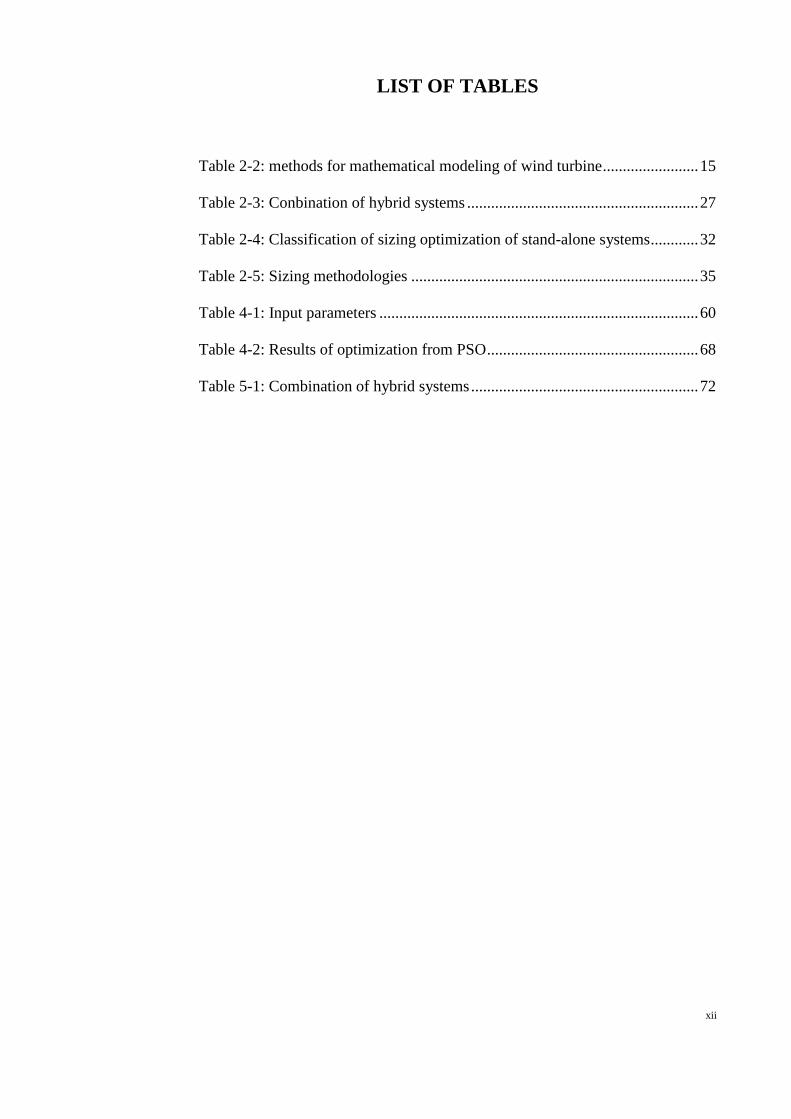
LIST OF TABLES
Table 2-2: methods for mathematical modeling of wind turbine ........................ 15
Table 2-3: Conbination of hybrid systems .......................................................... 27
Table 2-4: Classification of sizing optimization of stand-alone systems ............ 32
Table 2-5: Sizing methodologies ........................................................................ 35
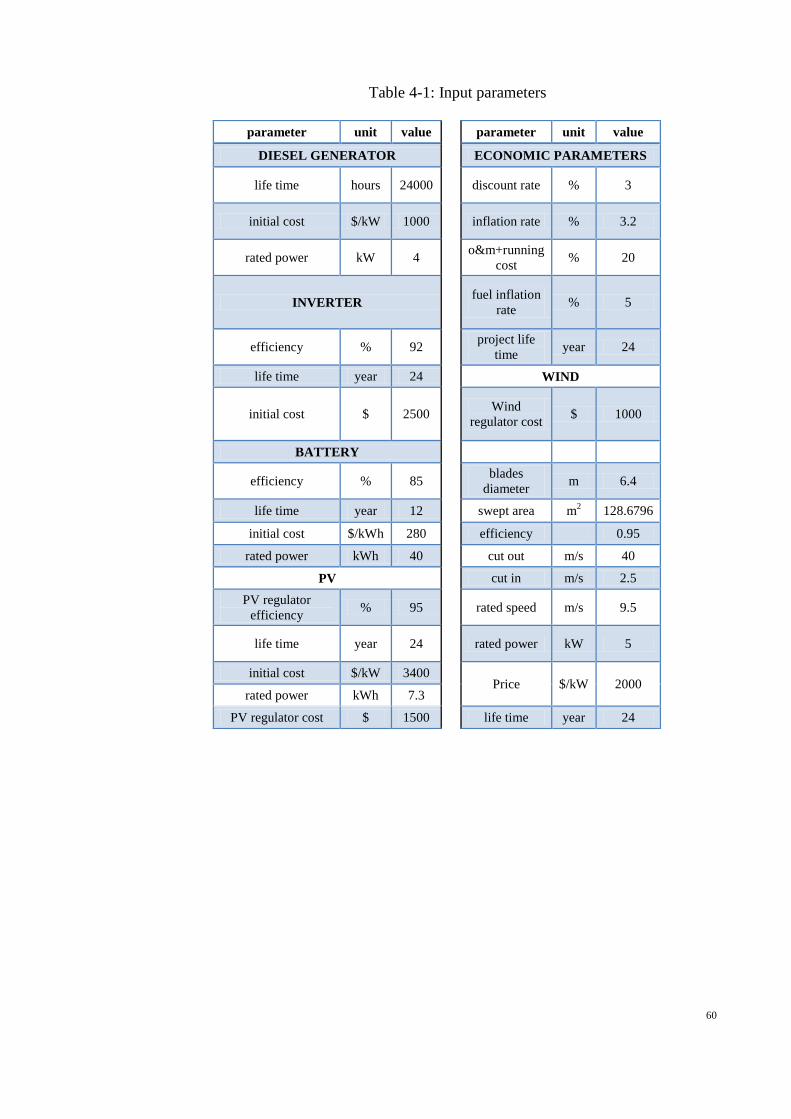
Table 4-1: Input parameters ................................................................................ 60
Table 4-2: Results of optimization from PSO ..................................................... 68
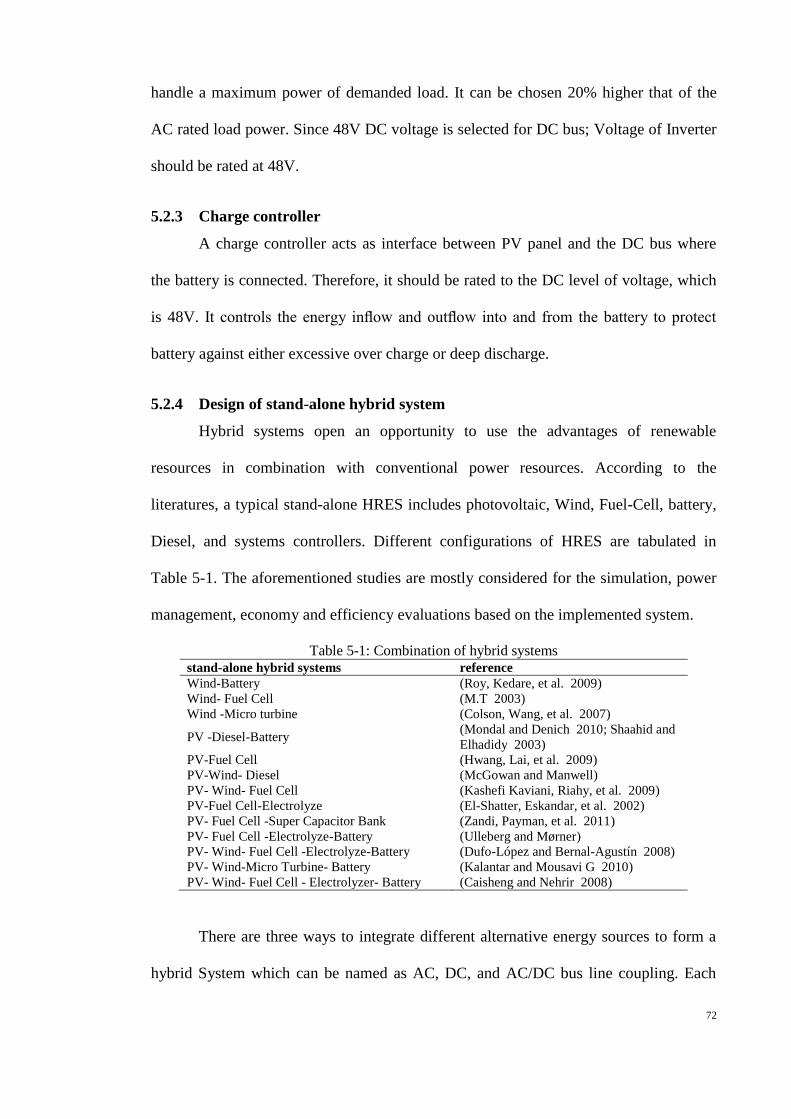
Table 5-1: Combination of hybrid systems ......................................................... 72
Page 13
xiii
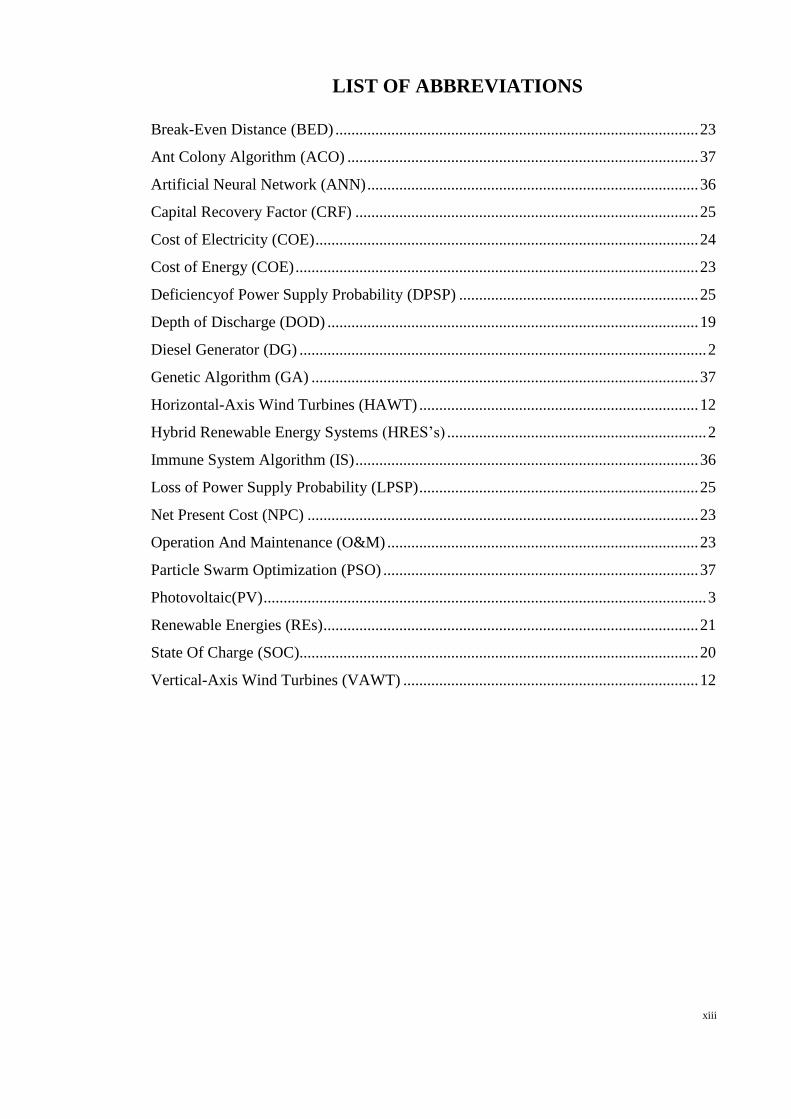
LIST OF ABBREVIATIONS
Break-Even Distance (BED) ........................................................................................... 23
Ant Colony Algorithm (ACO) ........................................................................................ 37
Artificial Neural Network (ANN) ................................................................................... 36
Capital Recovery Factor (CRF) ...................................................................................... 25
Cost of Electricity (COE) ................................................................................................ 24
Cost of Energy (COE) ..................................................................................................... 23
Deficiencyof Power Supply Probability (DPSP) ............................................................ 25
Depth of Discharge (DOD) ............................................................................................. 19
Diesel Generator (DG) ...................................................................................................... 2
Genetic Algorithm (GA) ................................................................................................. 37
Horizontal-Axis Wind Turbines (HAWT) ...................................................................... 12
Hybrid Renewable Energy Systems (HRES’s) ................................................................. 2
Immune System Algorithm (IS) ...................................................................................... 36
Loss of Power Supply Probability (LPSP) ...................................................................... 25
Net Present Cost (NPC) .................................................................................................. 23
Operation And Maintenance (O&M) .............................................................................. 23
Particle Swarm Optimization (PSO) ............................................................................... 37
Photovoltaic(PV) ............................................................................................................... 3
Renewable Energies (REs) .............................................................................................. 21
State Of Charge (SOC).................................................................................................... 20
Vertical-Axis Wind Turbines (VAWT) .......................................................................... 12
Page 14
1
CHAPTER 1
INTRODUCTION
1.1 Introduction
Nowadays renewable energy resources are one of the promising ways to address
many problems encountered since 1970 when the world major industries faced the
shortage of Petroleum and worst energy crises . Climate change, desertification,
greenhouse effect, etc., lead the world towards sustainable energy era. Using natural and
renewable resources such as wind, solar, geothermal, tidal, wave and hydroelectric
offer clean alternatives for fossil fuel; in which they are omnipresent, abundant, free,
clean and easily accessible even in isolated and undeveloped places.
Design a renewable energy system with the low adverse socio-economic and
environmental impacts, are one of the challenges for its developments. Renewable
energy systems need to be adequately informed and assessed at initial stages.
Unpredictable nature of these resources is one of the drawbacks for their development,
especially when having a reliable source of energy to match the time distribution of load
demand is essential. This drawback together with high initial cost, and dependency on
weather conditions lead to combine different renewable resources to form a Hybrid
system which can be flexible, cost effective, reliable and efficient. However, careful
planning and assessment is required to ensure the successful implementation of a hybrid
power system. Training of operators, involving local community on electrification
programs, overseeing installation and commissioning, maintenance procedures ,
system monitoring and reporting are all part of the successful hybrid power
system implementation process.
Page 15
2
Since wind and solar energies are complementary in electric power generation
from the complementarity of time and region; in stand-alone systems, energy provided
by wind turbine and PV are the major renewable energy resources (Y. j. Li, Yue et al.
2009). Moreover, storage resources such as diesel generator (DG), battery, super
capacitor bank, super conducting magnetic energy storage (SMES), and fuel cell-
electrolyzer are used to overcome the intermittent nature of wind and solar energies
(Agbossou, Kolhe et al. 2004; Caisheng and Nehrir 2008; Strunz and Kristina Brock
2006) .
Since the combination of PV and wind are the most common sources of
renewable energies in stand-alone systems, in this project, optimization of hybrid
systems which include PV and wind as the sources of energy generations combined
with battery and diesel will be investigated.
Component models of renewable resources are summarized in the following
section and later the arrangement of sources and connections of hybrid systems will be
discussed to predict the hybrid renewable energy systems (HRES’s) performance.
1.2 Problem Statement
Renewable sources such as wind, solar, and hydro power, which offer clean
alternatives for fossil fuel, are omnipresent, abundant, free, clean and easily accessible
even in isolated and undeveloped places in the form of stand-alone hybrid systems.
These systems are mainly used in remote area communities to generate electricity.
However unpredictable nature of these resources is one of the drawbacks for their
development, especially when having a reliable source of energy to match the time
distribution of load demand is essential.
This drawback together with high initial cost, and dependency on weather
conditions result in combining different renewable resources to form a Hybrid system
Page 16
3
which can be flexible, cost effective, reliable and efficient. However hybrid systems
need to be adequately informed and assessed at initial stages. Design a renewable
energy system with the low adverse socio-economic and environmental impacts, are one
of the challenges for hybrid renewable energy developments. Thereby, knowledge of all
factors which influence the performance of the system and accurate modeling for each
component are prerequisites for designing an accurate model of the HRES. In recent
years, there are a number of studies conducted on different aspects of stand-alone hybrid
systems in terms of component or configuration to optimize the stand alone systems.
Therefore, finding the best suited model for a particular region would be the basic need
of any study.
1.3 Motivation
Mainly, hybrid systems are divided into two categories as stand-alone and grid-
connected systems. Stand-alone systems are the most promising technologies for
supplying load in remote and rural areas. They provide greater reliability, higher
efficiency and lower cost in comparison with using single resources technologies.
Since the combination of PV and wind are the most common sources of
renewable energies in stand-alone systems, in this study of optimization of hybrid
systems which include photovoltaic (PV) and wind as the sources of energy generations
combined with battery and diesel will be investigated.
Page 17
4
1.4 Project Objective
The expected outcomes of the proposed work are as follows:
To study hybrid stand-alone energy systems.
To design a reliable and cost-effective hybrid renewable energy system
To perform technical and economic analysis for the designed system.
1.5 Thesis Outline
This thesis consists of six chapters. Chapter 1 presents the introduction of the
project, and the objective and scope of project. Chapter 2 surveys previous literature and
studies relevant to the project. It also reviews mathematical equations, simulation
programs, and computational methods which are commonly used in literatures.
In Chapter 3, the methodology of the project is described. Here, design
parameters, optimization algorithm, and techno-economic flowchart are explained.
In Chapter 4, the simulation results are presented. Power extracted from
different resources, sensitivity analysis on some of major parameters in design of hybrid
systems, techno-economic analysis of hybrid renewable energy system for rural area in
Malaysia, optimization of hybrid system, considering low cost and high reliability, are
presented in this chapter.
Design consideration of hybrid system is investigated in Chapter 5. Stand-alone
hybrid system for individual house and micro-grid configuration for number of houses
is designed in this section.
Chapter 6 concludes the overall aspect of the project. In addition,
recommendation and possible future work are also proposed.
Page 18
5
CHAPTER 2
LITERATURE REVIEW
While hybrid renewable energies have obvious advantages over other energy
sources, these systems should be able to meet the need of complex conditions due to
stochastic nature of renewable energy resources. Performance improvement, predicting
the output accurately, and reliability are some of the essential needs for designing a
stand-alone hybrid renewable energy system (HRES). In addition economic assessment
of the designed system can have a crucial role in wider acceptance of renewable energy
technologies.
Therefore, to meet all the aforementioned and make more comprehensive
decisions, a complex design is needed. The simulation programs and computational
methods are commonly used in this regard.
2.1 Introduction
Nowadays renewable energy resources are one of the promising ways to address
many problems encountered since the end of fossil fuel era. Climate change,
desertification, greenhouse effect, etc. lead the world towards sustainable energy era by
using natural and renewable sources such as wind, solar, and hydro power, which offer
clean alternatives for fossil fuel. They are omnipresent, abundant, free, clean and easily
accessible even in isolated and undeveloped places. These systems are mainly used in
remote area communities to generate electricity. However unpredictable nature of these
resources is one of the drawbacks for their development, especially when having a
reliable source of energy to match the generation with time distribution of load demand
is essential (A. Gupta, Saini et al. 2008).
Page 19
6
This drawback together with high initial cost, and dependency on weather
conditions result in combining different renewable resources to form a Hybrid system
which can be flexible, cost effective, reliable and efficient. However hybrid systems
need to be adequately informed and assessed at initial stages. Design a renewable
energy system with the low adverse socio-economic and environmental impacts, are one
of the challenges for hybrid renewable energy developments. Thereby, knowledge of all
factors which influence the performance of the system and accurate modeling for each
component are prerequisites for designing an accurate model of the system (Thapar,
Agnihotri et al. 2011). In recent years, there are numbers of studies conducted on
different aspects of stand-alone hybrid systems in terms of component or configuration
to optimize the stand alone systems. Therefore, finding the best suited model for a
particular region would be the basic need of any study. Accordingly, this study tries to
review on different models of each component and examine various combinations of
stand-alone hybrid systems based on solar and wind energies. Finally different
approaches for technical and economic optimization of systems are reviewed. To the
best of our knowledge, no such review exists at present, although reviews of
optimization methods of hybrid renewable energy systems can be found.
2.2 Modeling
Mainly, hybrid systems are divided into two categories as stand-alone and grid-
connected systems. Since wind and solar energies are complementary in electric power
generation from the complementarity of time and region; in stand-alone systems, energy
provides by wind turbine and PV are the major renewable energy resources (Y. j. Li,
Yue, et al. 2009; Sreeraj, Chatterjee et al. 2010). Moreover, storage resources such as
diesel generator (DG), battery, super capacitor bank, super conducting magnetic energy
storage (SMES), and fuel cell-electrolyzer are used to overcome the intermittent nature
Page 20
7
of wind and solar energies(Agbossou, Kolhe, et al. 2004; Caisheng and Nehrir 2008;
Strunz and Kristina Brock 2006) .
Stand-alone systems are the most promising technologies for supplying load in
remote and rural areas. They provide greater reliability, higher efficiency and lower cost
in comparison with using single resources technologies.
Since the combination of PV and wind are the most common sources of
renewable energies in stand-alone systems, in this study of optimization of hybrid
systems which include PV and wind as the sources of energy generations combined
with battery and diesel will be investigated. Component models of renewable resources
are summarized in the following section and later the arrangement of sources and
connections of hybrid systems will be discussed to predict the hybrid renewable energy
systems (HRES’s) performance.
2.2.1 Photo Voltaic (PV) Technology and Modeling
Photovoltaic systems are classified into two categories of grid-connected and
stand –alone systems which are known as Remote area power supply (RAPS) systems
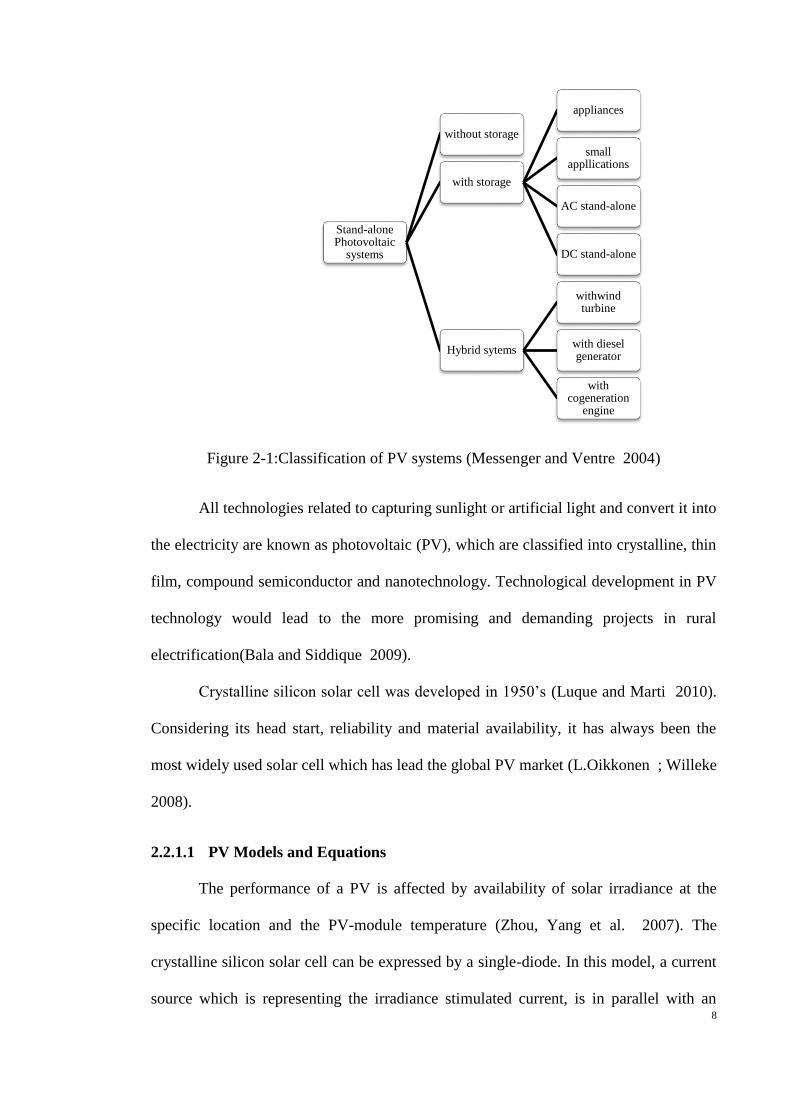
(Hancock, Outhred et al. 1994). Figure 2-1 illustrates the classification of PV stand-
alone systems.
Page 21
8
Figure 2-1:Classification of PV systems (Messenger and Ventre 2004)
All technologies related to capturing sunlight or artificial light and convert it into
the electricity are known as photovoltaic (PV), which are classified into crystalline, thin
film, compound semiconductor and nanotechnology. Technological development in PV
technology would lead to the more promising and demanding projects in rural
electrification(Bala and Siddique 2009).
Crystalline silicon solar cell was developed in 1950’s (Luque and Marti 2010).
Considering its head start, reliability and material availability, it has always been the
most widely used solar cell which has lead the global PV market (L.Oikkonen ; Willeke
2008).
2.2.1.1 PV Models and Equations
The performance of a PV is affected by availability of solar irradiance at the
specific location and the PV-module temperature (Zhou, Yang et al. 2007). The
crystalline silicon solar cell can be expressed by a single-diode. In this model, a current
source which is representing the irradiance stimulated current, is in parallel with an
Stand-alone Photovoltaic
systems
without storage
with storage
appliances
small appllications
AC stand-alone
DC stand-alone
Hybrid sytems
withwind turbine
with diesel generator
with cogeneration
engine
Page 22
9
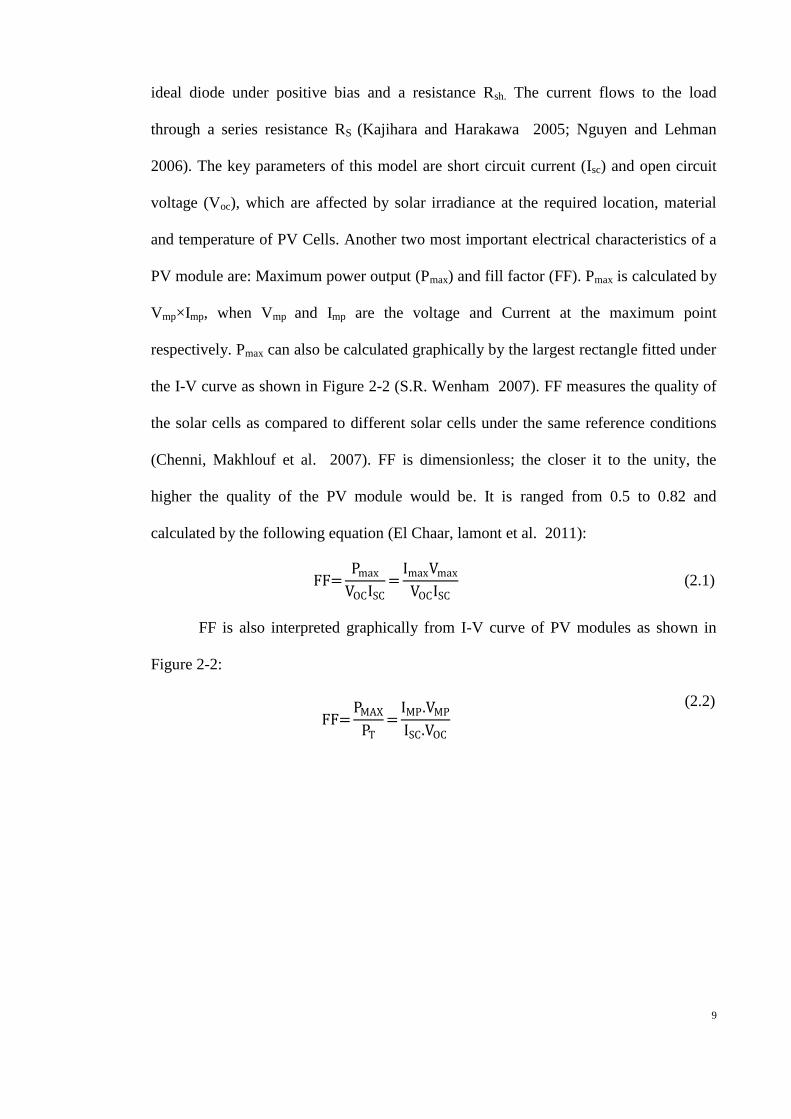
ideal diode under positive bias and a resistance Rsh. The current flows to the load
through a series resistance RS (Kajihara and Harakawa 2005; Nguyen and Lehman
2006). The key parameters of this model are short circuit current (Isc) and open circuit
voltage (Voc), which are affected by solar irradiance at the required location, material
and temperature of PV Cells. Another two most important electrical characteristics of a
PV module are: Maximum power output (Pmax) and fill factor (FF). Pmax is calculated by
Vmp×Imp, when Vmp and Imp are the voltage and Current at the maximum point
respectively. Pmax can also be calculated graphically by the largest rectangle fitted under
the I-V curve as shown in Figure 2-2 (S.R. Wenham 2007). FF measures the quality of
the solar cells as compared to different solar cells under the same reference conditions
(Chenni, Makhlouf et al. 2007). FF is dimensionless; the closer it to the unity, the
higher the quality of the PV module would be. It is ranged from 0.5 to 0.82 and
calculated by the following equation (El Chaar, lamont et al. 2011):
(2.1)
FF is also interpreted graphically from I-V curve of PV modules as shown in
Figure 2-2:
(2.2)
Page 23
10
Figure 2-2: Calculating the fill factor (FF) from the I-V curve
Finally the most important figure of merit is efficiency, which is derived by:
(Luque and Hegedus 2003)
(2.3)
Where and Pin represent the power conversion efficiency and the input power,
respectively.
In most applications several cells can be usually connected into a series string to
form a module in order to get the desired output voltage (Figure 2-3).
Figure 2-3: PV module
Page 24
11
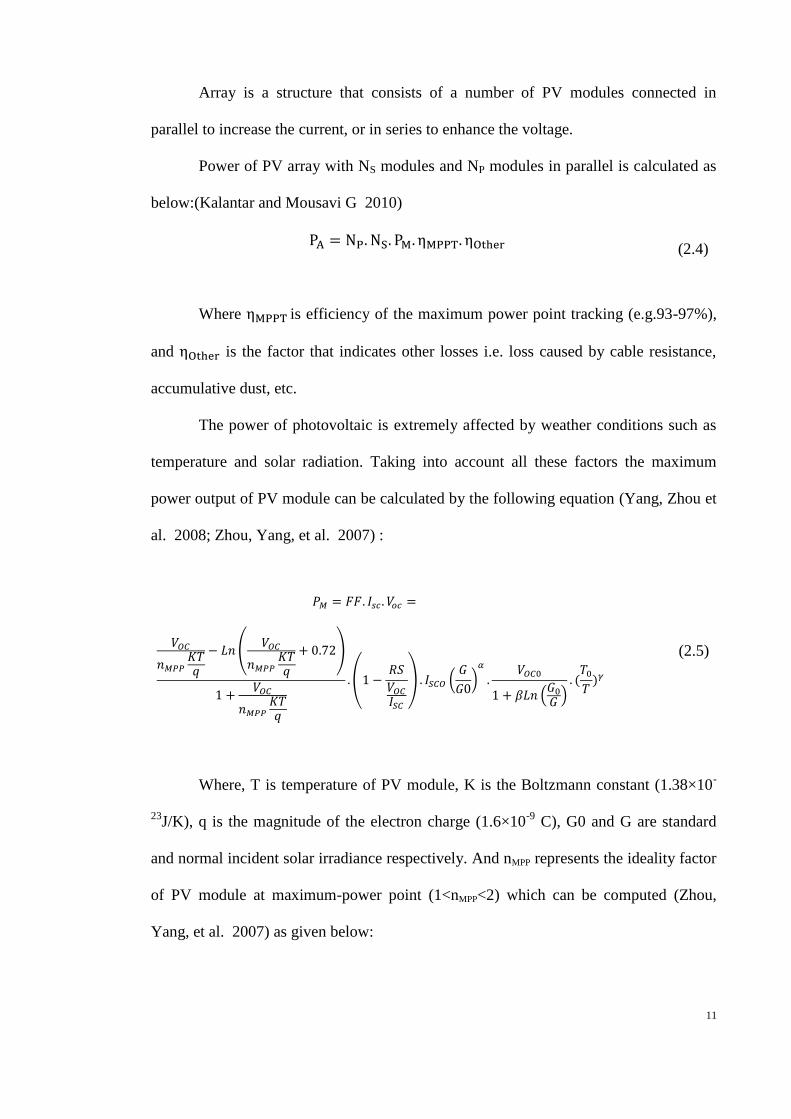
Array is a structure that consists of a number of PV modules connected in
parallel to increase the current, or in series to enhance the voltage.
Power of PV array with NS modules and NP modules in parallel is calculated as
below:(Kalantar and Mousavi G 2010)
(2.4)
Where is efficiency of the maximum power point tracking (e.g.93-97%),
and is the factor that indicates other losses i.e. loss caused by cable resistance,
accumulative dust, etc.
The power of photovoltaic is extremely affected by weather conditions such as
temperature and solar radiation. Taking into account all these factors the maximum
power output of PV module can be calculated by the following equation (Yang, Zhou et
al. 2008; Zhou, Yang, et al. 2007) :
(
)
(
) (
)
( )
(2.5)
Where, T is temperature of PV module, K is the Boltzmann constant (1.38×10-
23J/K), q is the magnitude of the electron charge (1.6×10
-9 C), G0 and G are standard
and normal incident solar irradiance respectively. And nMPP represents the ideality factor
of PV module at maximum-power point (1<nMPP<2) which can be computed (Zhou,
Yang, et al. 2007) as given below:
Page 25
12
(
)
(2.6)
The α and ɣ are the exponents responsible for nonlinear effects of photocurrent
and temperature-voltage, and β is the coefficient for solar cell technology specific
(e.g.0.085) (van Dyk, Meyer et al. 2002). They can be determined by the equations 7 to
9, respectively:
(
)
( )
( )
(
)
( )
2.2.2 Wind turbine technology and Modeling
Wind turbines harness the power of the wind and convert it into electricity
energy. Being low-cost, easily available and environmental friendly, it continues to be
the fastest growing electricity generator technology in the world (Jafarian and Ranjbar
2010; Kiranoudis, Voros et al. 2001; M. Li and Li 2005). Wind turbines can be
classified based on the orientation of the axis of the rotor with respect to the Ground:
those whose rotor rotates around a horizontal axis, and those whose rotor shaft rotates
around a vertical axis. Horizontal axes wind turbines are more common (Ofualagba and
Ubeku 2008) and generally are used for large scale electrical grid-connected power
plants (Robert Foster 2009).The vertical axis wind turbine is an eggbeater-shape and
often known as Darrieus rotor after its inventor (Ofualagba and Ubeku 2008). Despite a
few problems with the vertical-axis, its advantages outweigh disadvantages in several
aspects: Unlike horizontal-axis wind turbines (HAWT), they can accept wind from any
direction. The speed increaser and generator can be installed at ground level that makes
it accessible and it doesn’t need over-speed protection. They are applicable in low-wind
speed and since they don’t require tower, the capital cost for vertical-axis wind turbines
(VAWT) is lower (Kanellos and Hatziargyriou 2008; Ross and Altman 2011).
Page 26
13
However the problem is that the rotor is closer to the ground and cycling variation of
power will happen on each rotor revolution(Eriksson, Bernhoff et al. 2008).
Small wind turbines can provide enough electricity and be cost effective if the
following rules are considered: the average of low wind speed month become 3-4m/s,
wind tower located away from buildings and trees (Harry L. Wegley 1980) , it is
installed not too far away from the load due to more losses and cost of wiring,
considering DC having more losses from wind turbine to the load rather than AC(Harry
L. Wegley 1980).
2.2.2.1 Wind Models and Equations
There are several factors which influence the output power of wind turbine,
among them the noteworthy ones are the wind speed distribution and the height of
tower, but the wind speed is the prime factor.
2.2.2.2 Wind speed distribution
Wind speed distribution determines the performance of wind turbine for specific
location by predicting the energy yield from a wind turbine (Kantar and Usta 2008).
There are different methods for the predication of wind distribution, namely
Weibull,Burr, Gamma,Erlang and Inverse Gamma (Carta, Ramírez et al. 2009). Among
them, Weibull distribution function is the most acceptable method, due to its flexibility
and simplicity (Carta and Mentado 2007; Islam, Saidur et al. 2011; Jangamshetti and
Ran 2001; Manwell, McGowan et al. 2009; Seguro and Lambert 2000).
2.2.2.3 Height of tower
Since the wind speed varies with height, the measured wind speed at
anemometer height must be converted to desired hub heights. There are many
researches on analyzing the variation of wind speed with height, which are discussed in
Page 27
14
ref (Bañuelos-Ruedas, Angeles-Camacho et al. 2010; Manwell, McGowan et al. 2010;
S. Rehman and Al-Abbadi 2007); however the most commonly used methods are
Hellmann exponential law (power law) and the logarithmic profile which are acceptable
and more accurate methods in estimating wind shear (Archer 2003).
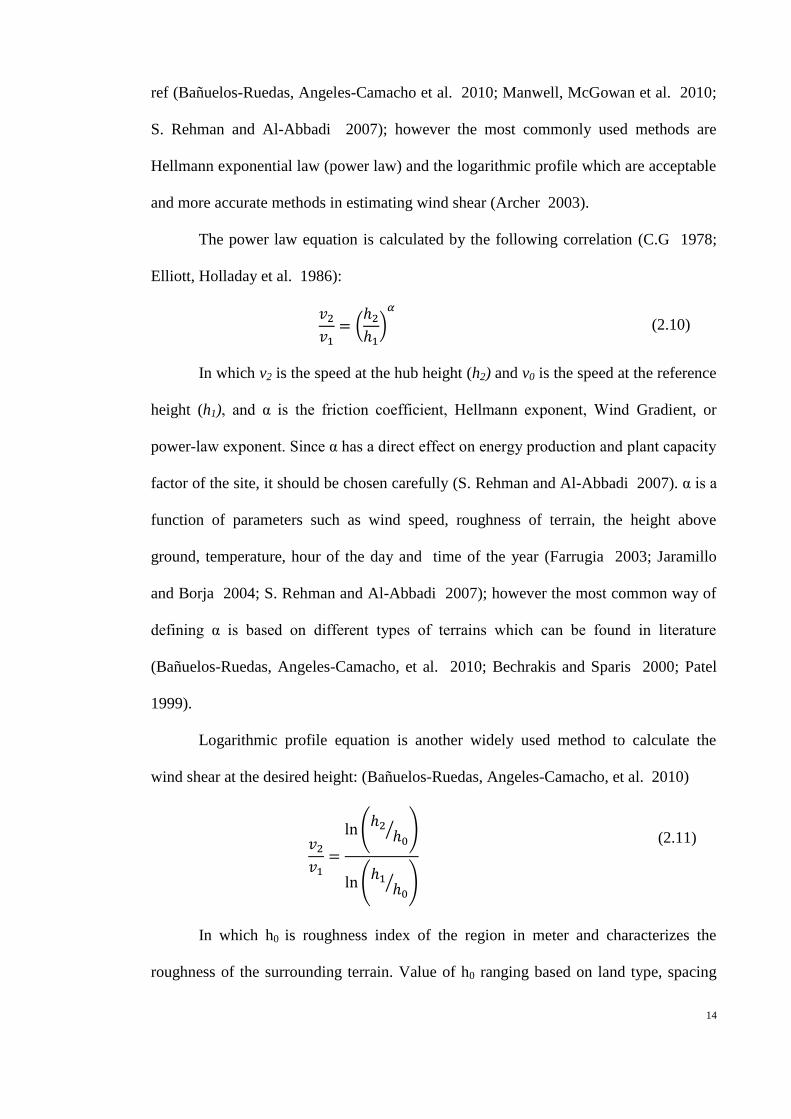
The power law equation is calculated by the following correlation (C.G 1978;
Elliott, Holladay et al. 1986):
( )
(2.10)
In which v2 is the speed at the hub height (h2) and v0 is the speed at the reference
height (h1), and α is the friction coefficient, Hellmann exponent, Wind Gradient, or
power-law exponent. Since α has a direct effect on energy production and plant capacity
factor of the site, it should be chosen carefully (S. Rehman and Al-Abbadi 2007). α is a
function of parameters such as wind speed, roughness of terrain, the height above
ground, temperature, hour of the day and time of the year (Farrugia 2003; Jaramillo
and Borja 2004; S. Rehman and Al-Abbadi 2007); however the most common way of
defining α is based on different types of terrains which can be found in literature
(Bañuelos-Ruedas, Angeles-Camacho, et al. 2010; Bechrakis and Sparis 2000; Patel
1999).
Logarithmic profile equation is another widely used method to calculate the
wind shear at the desired height: (Bañuelos-Ruedas, Angeles-Camacho, et al. 2010)
(
⁄ )
(
⁄ )
(2.11)
In which h0 is roughness index of the region in meter and characterizes the
roughness of the surrounding terrain. Value of h0 ranging based on land type, spacing
Page 28
15
and height of the roughness factor from 0.0002m in water surface to 1.6m for a large
city with high sky scrapers (Manwell, McGowan, et al. 2010).
2.2.2.4 Wind power
There are many researches on determining power output of the wind turbines.
However the accuracy of each one depends on the wind turbine characteristics, wind
speed of the region and wind turbine application.
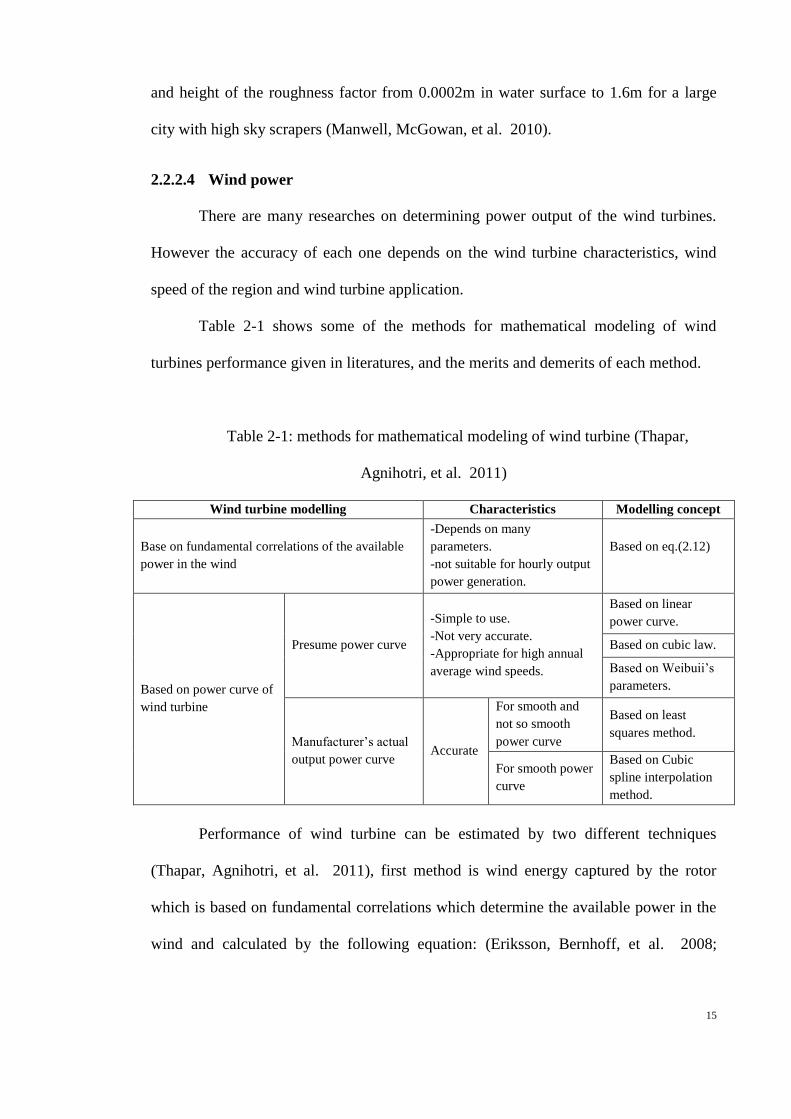
Table 2-1 shows some of the methods for mathematical modeling of wind
turbines performance given in literatures, and the merits and demerits of each method.
Table 2-1: methods for mathematical modeling of wind turbine (Thapar,
Agnihotri, et al. 2011)
Wind turbine modelling Characteristics Modelling concept
Base on fundamental correlations of the available
power in the wind
-Depends on many
parameters.
-not suitable for hourly output
power generation.
Based on eq.(2.12)
Based on power curve of
wind turbine
Presume power curve
-Simple to use.
-Not very accurate.
-Appropriate for high annual
average wind speeds.
Based on linear
power curve.
Based on cubic law.
Based on Weibuii’s
parameters.
Manufacturer’s actual
output power curve Accurate
For smooth and
not so smooth
power curve
Based on least
squares method.
For smooth power
curve
Based on Cubic
spline interpolation
method.
Performance of wind turbine can be estimated by two different techniques
(Thapar, Agnihotri, et al. 2011), first method is wind energy captured by the rotor
which is based on fundamental correlations which determine the available power in the
wind and calculated by the following equation: (Eriksson, Bernhoff, et al. 2008;
Page 29
16
Kanellos and Hatziargyriou 2008; Ofualagba and Ubeku 2008; Robert Foster 2009;
Ross and Altman 2011)
(2.12)
Where, P is the mechanical power(watt), is the upstream wind speed at the
entrance of the rotor blades (m/s), A is area swept by the rotor blades (m2), and is air
density (kg/m3) which is a function of temperature, altitude, and humidity level with the
least effect (Patel 1999). The mechanical power is then transferred to electrical power
which is given by (Thapar, Agnihotri, et al. 2011):
(2.13)
The term in the bracket represents the overall efficiency of wind turbine (WT);
where ɳm is mechanical transmission efficiency (like the gearbox, which converts the
slow, high-torque rotation of the turbine to higher rotational speeds on the electrical
generator side), ɳg is electrical generator efficiency, and CP is the power coefficient
which represents the aero dynamic efficiency of the wind turbine. The maximum CP is
governed by Betz limit. It states that the maximum value of CP which can be achieved
for all types of wind turbine cannot exceed 59%. Nevertheless, in the practical designs,
it achieves the value between 0.4 to 0.5 for two-blade, high-speed wind turbines; and
0.2 for slow-speed wind turbines with more blades (Patel 1999).
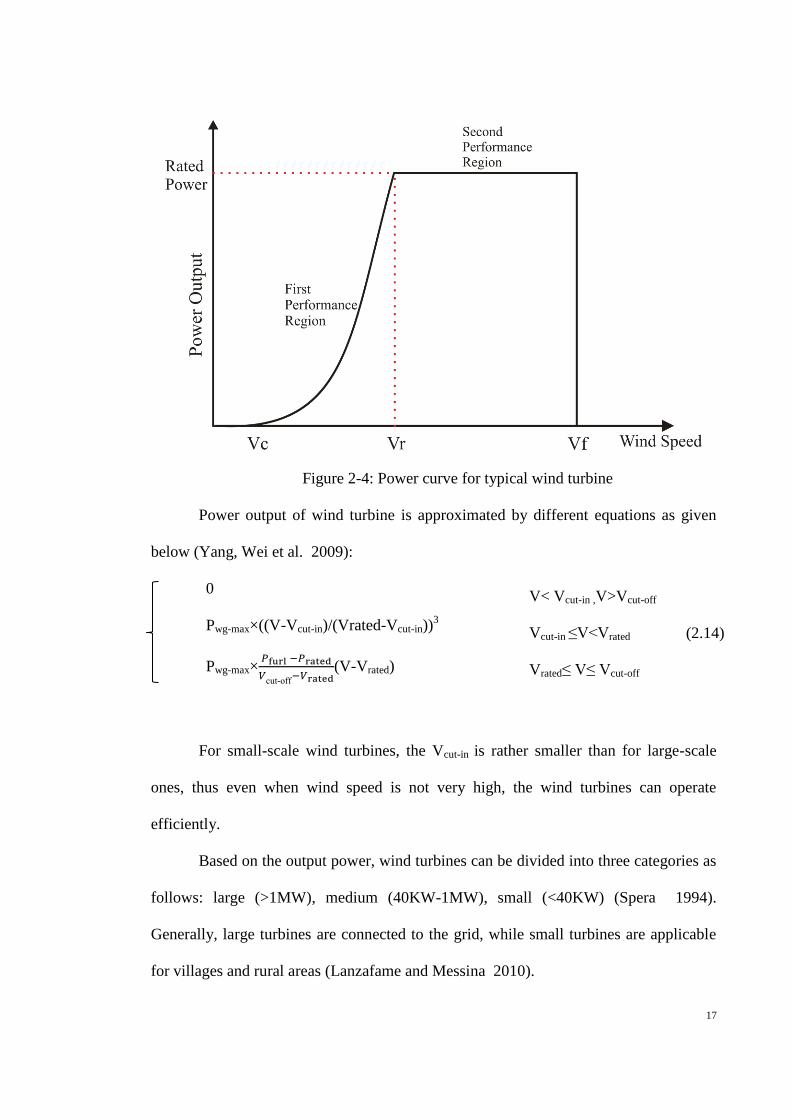
Another method for estimation of wind turbine performance is based on the
power curve (Thapar, Agnihotri, et al. 2011). Figure 2-4 indicates power curve for a
typical wind turbine.
Page 30
17
Figure 2-4: Power curve for typical wind turbine
Power output of wind turbine is approximated by different equations as given
below (Yang, Wei et al. 2009):
0
Pwg-max×((V-Vcut-in)/(Vrated-Vcut-in))3
Pwg-max×
cut-off
(V-Vrated)
V< Vcut-in ,V>Vcut-off
Vcut-in ≤V<Vrated
Vrated≤ V≤ Vcut-off
(2.14)
For small-scale wind turbines, the Vcut-in is rather smaller than for large-scale
ones, thus even when wind speed is not very high, the wind turbines can operate
efficiently.
Based on the output power, wind turbines can be divided into three categories as
follows: large (>1MW), medium (40KW-1MW), small (<40KW) (Spera 1994).
Generally, large turbines are connected to the grid, while small turbines are applicable
for villages and rural areas (Lanzafame and Messina 2010).
Page 31
18
The overall efficiency of the wind turbine is calculated by the following
equation (Ibrahim 2009):
(2.15)
Where, E is the overall efficiency, Er is the efficiency of the rotor and Et is the
transmission efficiency.
2.3 Battery technology and modeling
The battery storage is usually used as a backup for the hybrid stand-alone
systems to increase its availability, and provide load leveling for short-term fluctuations.
As given in the literature, there are various methods for storing the renewable energy. A
study on using super capacitor is conducted by Samson, G.T., et al. (Samson, Undeland
et al. 2009). The results show that battery life time increased by relieving the battery of
narrow and repeated transient charging and discharging. Ref. (Díaz-González, Sumper
et al. 2012) reviews the different methods for wind energy storage, and Ref. (Rahman,
Rehman et al. 2012) is an overview of renewable energy storage in Saudi Arabia.
However, to date Lead-acid batteries have been the most commonly used energy storage
units in hybrid systems by delivering electricity in range of 5 V to 24 V DC ("Battery
modelling for HEV simulation, Thermo Analytics, etc." 1999; Jantharamin and Zhang
2008). They are of low cost, readily available, and highly efficient. Capacity of lead-
acid batteries is ranging from 10Ah up to 1000Ah. There are some limitations in using
lead-acid batteries as they are subject to frequent maintenance and sensitivity to harsh
temperatures (Wang 2011).
Modeling of the batteries is a key issue of hybrid power system, due to the life
cycle cost of the batteries as one of the major expenses for the systems (Henrik
Bindner). Defining a general model for the battery, which covers all the factors, is quite
difficult. Accordingly, depending on the application of the model, different approaches
Page 32
19
have been applied. Modeling of the batteries is classified into three categories i.e.
Chemical Model, Electrical Models, charge accumulation and empirical models (Zhou,
Lou et al. 2010). Most of modeling focus on three different characteristics:
performance or a charge model, voltage model, and the lifetime model (Henrik
Bindner).
The battery characteristics which play a significant role in designing a hybrid
renewable system are as follows: battery capacity, battery voltage, battery state of
charge (Piller, Perrin et al. 2001), depth of discharge, life-time of battery (Wenzl,
Baring-Gould et al. 2005), and charging regime as well as the cost analysis of the
battery.
Cycle life of the battery is defined as the number of charging and discharging
that a battery can undergo before it reaches the end of its lifetime. The battery’s float
life is affected by the ambient temperature and normally every 10°C rise in average
ambient temperature halves the battery’s life time (Dall, Lenzen et al. 2010). The
energy capacity (Wh) of a battery is defined by the energy that a fully charged battery
can deliver under the specified conditions.
Depth of discharge (DOD) is the ampere-hours removed from a fully charged
battery. It is defined by the percentage ratio of the battery rated capacity to the
applicable discharge rate (A). Battery bank is used as a backup system and it is sized to
meet the load demand when the renewable energy resources failed to satisfy the load;
the number of days a fully charged battery can feed the load without any contribution of
auxiliary power sources is represented by days of autonomy, and is taken to be 2 or 3
days.
The capacity of battery bank is estimated by the following equation (Deshmukh
and Deshmukh 2008):
Page 33
20
(2.16)
Where, EL represents the load demand in Wh; SD is days of autonomy; VB is the
operating voltage of the battery; DOD max is the maximum depth of discharge; Tcf is the
temperature correction factor and ɳB is the charging/discharging efficiency (Chaurey
and Kandpal 2010).
One of the most important points in control and management of hybrid systems
is the knowledge of state of charge (SOC) of the battery in each step. Deep discharge or
overcharge can lead to irreversible damage in the battery and this involves major
expenses of the system (Piller, Perrin, et al. 2001).
There are different methods to estimate the SOC of the battery for different
applications which are discussed in ref. (Shuo, Farrell et al. 2001). However, it can be
defined as the ratio of the available capacity to the rated capacity in AHr and is defined
by the following equation (Deepti and Ramanarayanan 2006):
(2.17)
Hybrid system optimizations are usually done using the iteration techniques
which need the SOC in every moment during the specific period or for a specific load
profile, consequently it can be calculated using:
[
] (2.18)
And
[
] (2.19)
Where, σ is hourly self-discharge rate, EL is load demand, and EGEN is the
generated energy by hybrid system, considering the energy loss in controller. Eq.(2.18)
is used when the battery is charging and Eq.(2.19) is applied for battery discharge
Page 34
21
regime. From the equation it can be seen that the SOC in each moment is related to the
previous step (Ajai Gupta, Saini et al. 2011). However, in each moment the state of
charge should not exceed 1 or become less than SOCmin which is determined by
following equation:
(2.20)
The battery’s lifetime can be prolonged to the maximum if depth of discharge
takes the value of 30-50%. The higher is depth of discharge; the lower is the battery life
cycle.
2.4 Diesel generator
For remote communities and rural industries the standard power supplies are
provided through diesel generators. They are used as a secondary energy source during
the peak demand, or in the case of battery depletion. Diesel generators have low capital
cost; nevertheless, they are expensive to operate and maintain, and provide electricity
only for a few hours a day. Therefore, there are two aspects using renewable energy
with diesel generators: adding renewable energies (REs) to existing diesel power plants
as a fuel saver, or integrated diesel generator to hybrid systems for village power.
Avoiding unloaded or even lightly loaded operation for the diesel generator is
one of the considerations that should be taken into account (Said H 1998). In addition it
is recommended that the diesel generator operates until the battery bank reaches roughly
about 90% of SOC in order to avoid excessive operation, and improves the service life
and fuel consumption (Coleman 1989). It is to be noted that Optimum operation range
for a diesel generator is between 70% and 89% of its rated power (Said H 1998).
Efficiency and hourly fuel consumption are the characteristics of a diesel
generator which should be considered in designing a hybrid system and can be
expressed by (Ashari and Nayar 1999; Skarstein and Uhlen 1989):
Page 35
22
(2.21)
Where, (t) is fuel consumption (lit/h), P (t) is generated power (kw), Pr is rated
power, a and b are constant numbers (lit/kw) which represent the coefficients of fuel
consumption and they can be approximated to 0.246 and 0.08415, respectively
(Azoumah, Yamegueu et al. 2011).
The efficiency of a diesel generator is calculated by: (Deshmukh and Deshmukh
2008)
generator (2.22)
Where, and represent the overall efficiency and the brake
thermal efficiency of diesel generator, respectively.
2.5 DC/AC Converter (Inverter)
Inverters convert electrical energy of DC form into AC with the desired
frequency of the load. The efficiency of the inverter can be defined by the following
equation:
(2.23)
In which, P, P0 and k can be determined by using the following equations:
(Darras, Sailler et al. 2010; Diaf, Diaf et al. 2007; Schimd J 1991; Schmid 1988)
(
)
(2.24)
(2.25)
(2.26)
ɳ10 and ɳ100 are provided by the manufacturers and present the efficiency of the
inverter at 10% and 100% of its nominal power. The efficiency of inverter is roughly
Page 36
23
assumed to be constant over the whole of the working range (e.g. 90%) (Kashefi
Kaviani, Riahy et al. 2009).
2.6 Criteria for optimization of hybrid renewable energy systems
2.6.1 Economic criteria of hybrid renewable energy systems
For a designed hybrid system the economics evaluation is one of the key factors
to ensure the optimum configuration and acceptable economic benefits have been
resulted. There are some indicators which are commonly used in literatures i.e. net
present cost (NPC), cost of energy (COE), and break-even distance (BED). A brief
description of these indicators for economic analysis of hybrid system is shown in the
forthcoming subsections.
2.6.2 Net present cost (NPC)
The net present cost/value analysis of a project reveals economic profitability of
that, considering all significant cost over its life cycle; adding capital, replacement,
operating and maintenance (O&M), and fuel cost of each component for every year and
discounting them back to a common base which is present worth of the project. It can be
calculated by subtracting present worth of benefit from present worth of cost according
to the following equation (Mohammadi, Hosseinian et al. 2012):
(2.27)
2.6.3 Cost of Electricity (COE)
Cost of electricity (COE) is one of the most well-known and used indicators of
economic profitability of HRES (Kaabeche, Belhamel et al. 2011). It is defined as the
Page 37
24
constant price per unit of energy (or cost per unit of electricity). It can be calculated by
either of two of the following expressions (Dispenzieri, Kumar et al. 2010; Kaabeche,
Belhamel, et al. 2011; Luna-Rubio, Trejo-Perea et al. 2012)
(
)
(2.28)
Total net present cost includes all installed capital cost i.e. the present cost,
operation and maintenance cost, and replacement cost. Pload is the total energy generated
by the HRES during the system life period. Capital recovery factor (CRF) is a ratio to
calculate the present value of system components for a given time period, taking into
consideration the interest rate. It is calculated by:
(2.29)
Where, i is the interest rate and n is the system life period (or Amortization
period), which is usually equal to the life of the PV panel, due to its longer life
expectancy compared to other components in HRES (Dufo-López and Bernal-Agustín
2008).
2.6.3.1 COE for fuel-burning systems
Reference (Ramakumar 1983) suggested a method for calculating conventional
fuel-burning systems (like biomass) by using equation (2.30):
(2.30)
In which, C is generation cost, P is capital cost, η0 is the overall efficiency in
percentage, Cf is conventional fuel cost, and m is defined as a fraction of the capital cost
Page 38
25
per year for operation and maintenance. Notice that for 24 kg of biomass, approximately
1kWH energy is produced.
2.6.3.2 COE for diesel generator
The operation cost of diesel generator depends on several factors of fuel
consumption, maintenance cost, the operation hours and the demand, The eq. (2.31)
shows cost per unit of diesel generator (Ashari and Nayar 1999; Ashari, Nayar et al.
2001):
(
)
(2.31)
Where, PR is rated power at full load, POPR is operation power, Cf is fuel price,
and 0.246 and 0.08415 represent fuel consumption at no load and incremental diesel
fuel consumption rate, respectively.
2.7 Technical criteria of hybrid renewable energy systems
2.7.1 Reliability
Due to intermittent solar radiation and wind speed characteristics influencing the
energy production, energy system reliability analysis should be taken into consideration.
Reliability is a function to evaluate the technical criteria of the hybrid system. A reliable
system has been defined as a system that can feed the load demand without failure
during a certain period. According to ref (Kashefi Kaviani, Riahy, et al. 2009),
reliability of hybrid system directly depends of on the reliability of components.
Moreover, it is found that the inverter’s reliability is an upper limit for the entire system.
There are different reliability evaluation methods i.e. loss of energy expected,
loss of power supply probability, equivalent loss factor, and loss of load expected (J.
Kaldellis, Zafirakis et al.). However the most common is loss of power supply
probability (LPSP), or deficiency of power supply probability (DPSP) in which a
Page 39
26
reliable system is defined as a system that can feed sufficient power to the load demand
during a certain period without load rejection.
LPSP is a statistical parameter which indicates the probability of power supply
failure due to either losing power supply in a bad resource year or technical failure to
meet demand. There are two methods of calculating LPSP i.e. chronological simulation
and probabilistic techniques. The former technique is using time-series data in a given
period (equation (2.32)) and the latter is based on energy accumulation effect of the
energy storage system (equation (2.33)). They can be described by either of the
following equations (Luna-Rubio, Trejo-Perea, et al. 2012; Rajkumar,
Ramachandaramurthy et al. 2011):
∑
(2.32)
∑
∑
(2.33)
2.8 Design of hybrid systems
Hybrid systems open an opportunity to use the advantages of renewable
resources in combination with conventional power resources. Reviewing the studies
shows a significant development on design, analysis and implementation of such
systems over the last decade. Based on the reviewed papers, a typical stand-alone HRES
includes photovoltaic, Wind, Fuel-Cell, battery, Diesel, and systems controllers.
According to the potential of renewable resources and the purpose of using hybrid
system in the area of study, different configurations are represented (Table 2-2).
Page 40
27
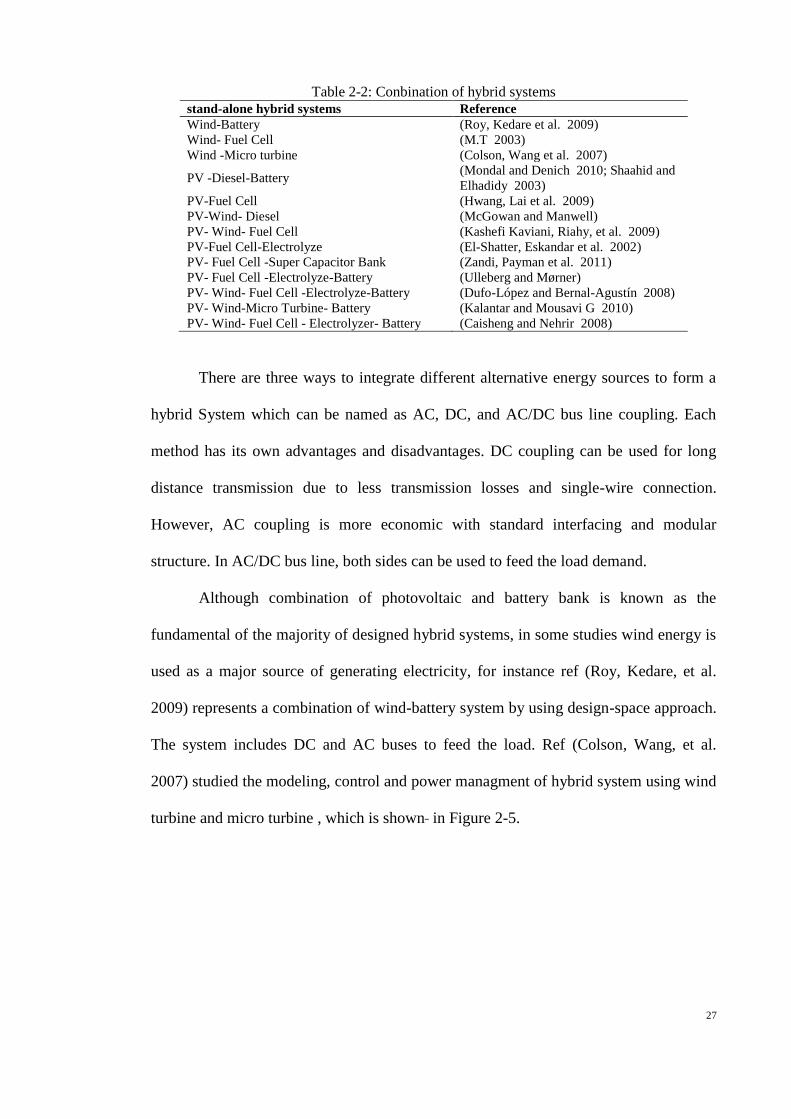
Table 2-2: Conbination of hybrid systems stand-alone hybrid systems Reference
Wind-Battery (Roy, Kedare et al. 2009)
Wind- Fuel Cell (M.T 2003)
Wind -Micro turbine (Colson, Wang et al. 2007)
PV -Diesel-Battery (Mondal and Denich 2010; Shaahid and
Elhadidy 2003)
PV-Fuel Cell (Hwang, Lai et al. 2009)
PV-Wind- Diesel (McGowan and Manwell)
PV- Wind- Fuel Cell (Kashefi Kaviani, Riahy, et al. 2009)
PV-Fuel Cell-Electrolyze (El-Shatter, Eskandar et al. 2002)
PV- Fuel Cell -Super Capacitor Bank (Zandi, Payman et al. 2011)
PV- Fuel Cell -Electrolyze-Battery (Ulleberg and Mørner)
PV- Wind- Fuel Cell -Electrolyze-Battery (Dufo-López and Bernal-Agustín 2008)
PV- Wind-Micro Turbine- Battery (Kalantar and Mousavi G 2010)
PV- Wind- Fuel Cell - Electrolyzer- Battery (Caisheng and Nehrir 2008)
There are three ways to integrate different alternative energy sources to form a
hybrid System which can be named as AC, DC, and AC/DC bus line coupling. Each
method has its own advantages and disadvantages. DC coupling can be used for long
distance transmission due to less transmission losses and single-wire connection.
However, AC coupling is more economic with standard interfacing and modular
structure. In AC/DC bus line, both sides can be used to feed the load demand.
Although combination of photovoltaic and battery bank is known as the
fundamental of the majority of designed hybrid systems, in some studies wind energy is
used as a major source of generating electricity, for instance ref (Roy, Kedare, et al.
2009) represents a combination of wind-battery system by using design-space approach.
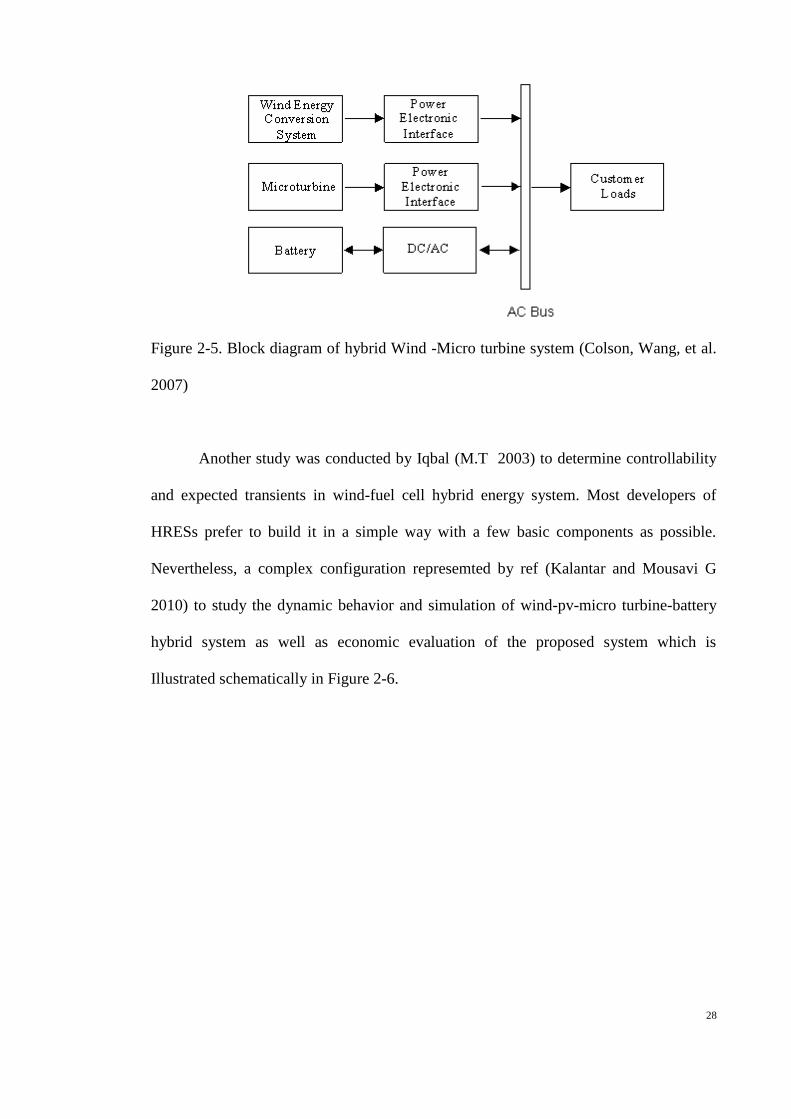
The system includes DC and AC buses to feed the load. Ref (Colson, Wang, et al.
2007) studied the modeling, control and power managment of hybrid system using wind
turbine and micro turbine , which is shown in Figure 2-5.
Page 41
28
Figure 2-5. Block diagram of hybrid Wind -Micro turbine system (Colson, Wang, et al.
2007)
Another study was conducted by Iqbal (M.T 2003) to determine controllability
and expected transients in wind-fuel cell hybrid energy system. Most developers of
HRESs prefer to build it in a simple way with a few basic components as possible.
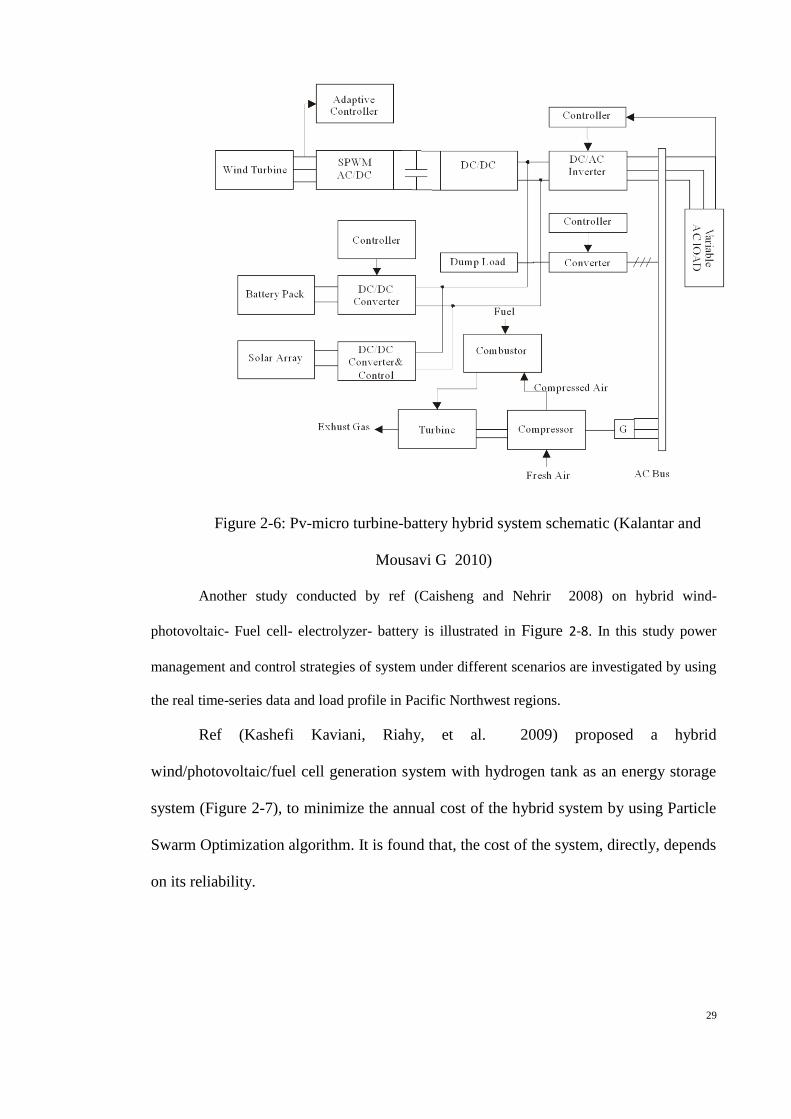
Nevertheless, a complex configuration represemted by ref (Kalantar and Mousavi G
2010) to study the dynamic behavior and simulation of wind-pv-micro turbine-battery
hybrid system as well as economic evaluation of the proposed system which is
Illustrated schematically in Figure 2-6.
Page 42
29
Figure 2-6: Pv-micro turbine-battery hybrid system schematic (Kalantar and
Mousavi G 2010)
Another study conducted by ref (Caisheng and Nehrir 2008) on hybrid wind-
photovoltaic- Fuel cell- electrolyzer- battery is illustrated in Figure 2-8. In this study power
management and control strategies of system under different scenarios are investigated by using
the real time-series data and load profile in Pacific Northwest regions.
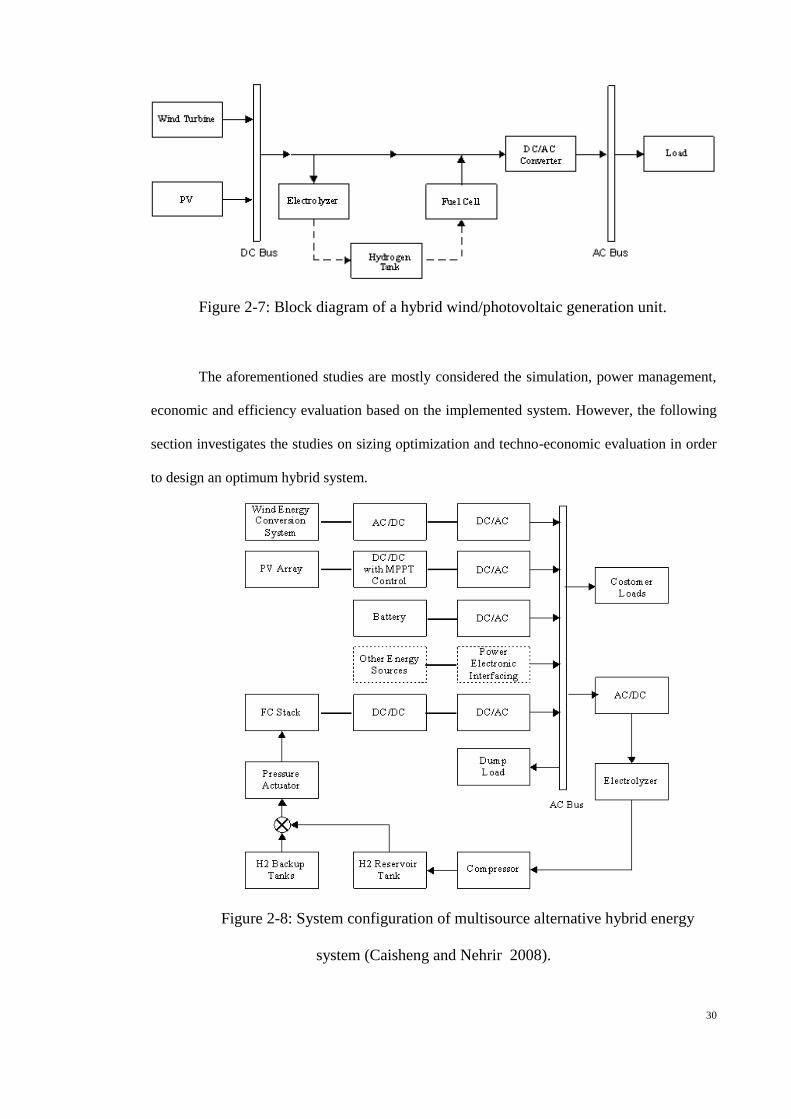
Ref (Kashefi Kaviani, Riahy, et al. 2009) proposed a hybrid
wind/photovoltaic/fuel cell generation system with hydrogen tank as an energy storage
system (Figure 2-7), to minimize the annual cost of the hybrid system by using Particle
Swarm Optimization algorithm. It is found that, the cost of the system, directly, depends
on its reliability.
Page 43
30
Figure 2-7: Block diagram of a hybrid wind/photovoltaic generation unit.
The aforementioned studies are mostly considered the simulation, power management,
economic and efficiency evaluation based on the implemented system. However, the following
section investigates the studies on sizing optimization and techno-economic evaluation in order
to design an optimum hybrid system.
Figure 2-8: System configuration of multisource alternative hybrid energy
system (Caisheng and Nehrir 2008).
Page 44
31
2.9 Sizing and optimization methods
Optimization of hybrid renewable energy systems investigates the process of
selecting the best configuration of components and their sizing, considering efficiency,
reliability, and cost-effectiveness of the system by applying appropriate evaluating
strategy.
Due to the stochastic availability of renewable energies, design and optimizing a
reliable system from both technical and economic point of view is always required. The
mathematical and computational methods are applied in this regard. However
computational methods have been used more in recent years (Baños, Manzano-
Agugliaro et al. 2011).
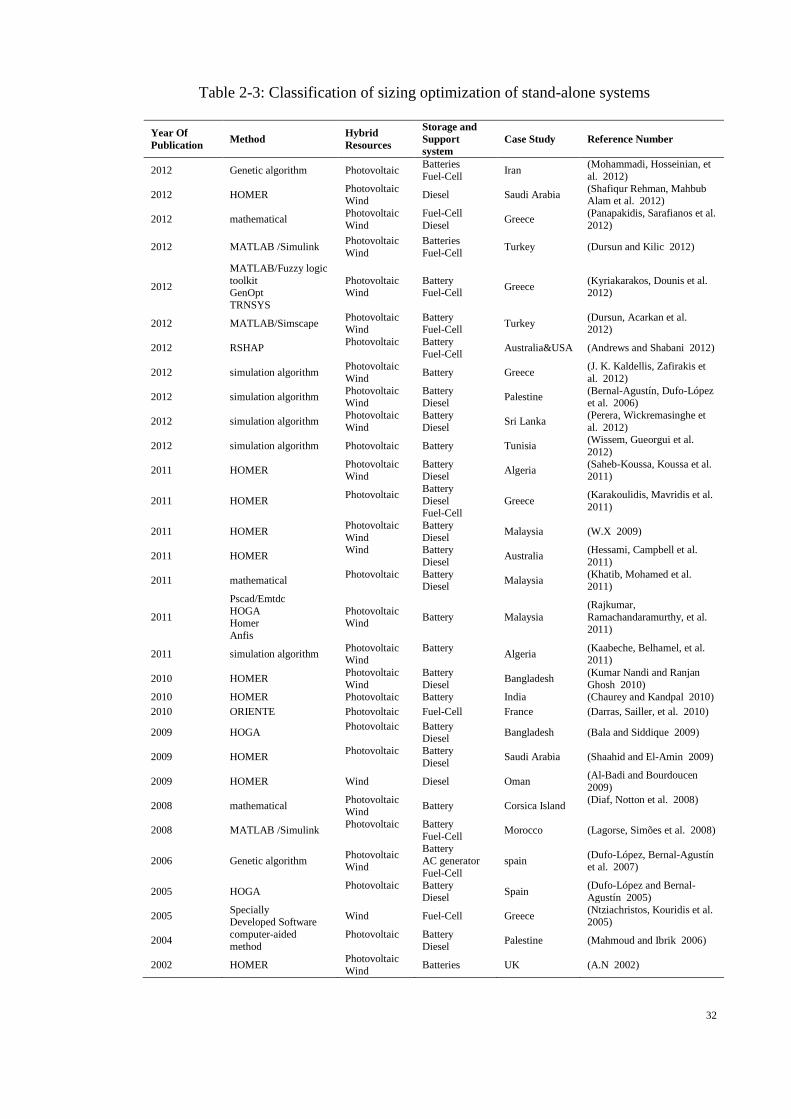
Table 2-3 represents the reviewed studies in sizing optimization of stand-alone
systems from 2002 to 2012. It can be seen that software tools are commonly used for
techno-economic analysis of stand-alone hybrid systems. HOMER is one of the main
simulation programs for economic assessment of the designed hybrid system
considering different constraints. Computational analysis is also widely used for
optimization of stand-alone HRESs. HOMER is the most commonly used tool, and
multi-objective evolutionary algorithms for optimization of stand-alone hybrid wind-
solar renewable energy systems is described briefly in the next subsection.
Page 45
32
Table 2-3: Classification of sizing optimization of stand-alone systems
Year Of
Publication Method
Hybrid
Resources
Storage and
Support
system
Case Study Reference Number
2012 Genetic algorithm Photovoltaic Batteries
Fuel-Cell Iran
(Mohammadi, Hosseinian, et
al. 2012)
2012 HOMER Photovoltaic Wind
Diesel Saudi Arabia (Shafiqur Rehman, Mahbub Alam et al. 2012)
2012 mathematical Photovoltaic
Wind
Fuel-Cell
Diesel Greece
(Panapakidis, Sarafianos et al.
2012)
2012 MATLAB /Simulink Photovoltaic
Wind
Batteries
Fuel-Cell Turkey (Dursun and Kilic 2012)
2012
MATLAB/Fuzzy logic
toolkit GenOpt
TRNSYS
Photovoltaic Wind
Battery Fuel-Cell
Greece (Kyriakarakos, Dounis et al. 2012)
2012 MATLAB/Simscape Photovoltaic Wind
Battery Fuel-Cell
Turkey (Dursun, Acarkan et al. 2012)
2012 RSHAP Photovoltaic
Battery
Fuel-Cell Australia&USA (Andrews and Shabani 2012)
2012 simulation algorithm Photovoltaic
Wind Battery Greece
(J. K. Kaldellis, Zafirakis et
al. 2012)
2012 simulation algorithm Photovoltaic Wind
Battery Diesel
Palestine (Bernal-Agustín, Dufo-López et al. 2006)
2012 simulation algorithm Photovoltaic
Wind
Battery
Diesel Sri Lanka
(Perera, Wickremasinghe et
al. 2012)
2012 simulation algorithm Photovoltaic Battery Tunisia (Wissem, Gueorgui et al.
2012)
2011 HOMER Photovoltaic Wind
Battery Diesel
Algeria (Saheb-Koussa, Koussa et al. 2011)
2011 HOMER Photovoltaic
Battery
Diesel Fuel-Cell
Greece (Karakoulidis, Mavridis et al.
2011)
2011 HOMER Photovoltaic
Wind
Battery
Diesel Malaysia (W.X 2009)
2011 HOMER Wind
Battery
Diesel Australia
(Hessami, Campbell et al.
2011)
2011 mathematical Photovoltaic
Battery Diesel
Malaysia (Khatib, Mohamed et al. 2011)
2011
Pscad/Emtdc
HOGA Homer
Anfis
Photovoltaic Wind
Battery Malaysia
(Rajkumar,
Ramachandaramurthy, et al.
2011)
2011 simulation algorithm Photovoltaic Wind
Battery
Algeria (Kaabeche, Belhamel, et al. 2011)
2010 HOMER Photovoltaic
Wind
Battery
Diesel Bangladesh
(Kumar Nandi and Ranjan
Ghosh 2010) 2010 HOMER Photovoltaic Battery India (Chaurey and Kandpal 2010)
2010 ORIENTE Photovoltaic Fuel-Cell France (Darras, Sailler, et al. 2010)
2009 HOGA Photovoltaic
Battery Diesel
Bangladesh (Bala and Siddique 2009)
2009 HOMER Photovoltaic
Battery
Diesel Saudi Arabia (Shaahid and El-Amin 2009)
2009 HOMER Wind Diesel Oman (Al-Badi and Bourdoucen
2009)
2008 mathematical Photovoltaic Wind
Battery Corsica Island (Diaf, Notton et al. 2008)
2008 MATLAB /Simulink Photovoltaic
Battery
Fuel-Cell Morocco (Lagorse, Simões et al. 2008)
2006 Genetic algorithm Photovoltaic Wind
Battery
AC generator
Fuel-Cell
spain (Dufo-López, Bernal-Agustín et al. 2007)
2005 HOGA Photovoltaic
Battery
Diesel Spain
(Dufo-López and Bernal-
Agustín 2005)
2005 Specially Developed Software
Wind Fuel-Cell Greece (Ntziachristos, Kouridis et al. 2005)
2004 computer-aided
method
Photovoltaic
Battery
Diesel Palestine (Mahmoud and Ibrik 2006)
2002 HOMER Photovoltaic
Wind Batteries UK (A.N 2002)
Page 46
33
2.9.1 Software for optimization
Since the performance of renewable sources such as wind and solar are varied in
different hours of a day as well as different seasons of an year, providing sustainable
energy supply for users, requires energy management study. In this respect, software
tools are broadly used for simulating, optimizing and sizing HRESs (A. Gupta, Saini, et
al. 2008; Zhou, Lou, et al. 2010). The utilized software tools has been named as:
HOMER (HOMER), HYBRID2, HYBRIDS (Zhou, Lou, et al. 2010), HOGA (Bala and
Siddique 2009), PVSYST, SOMES, RAPSIM (McCruddin 1998), SOLSIM ("SolSim
and hybrid designer: self-optimizing software tools for simulation of solar hybrid
applications" 1998), INSEL (S. Islam 2002), PV-DESIGN PRO, RSHAP (Andrews
and Shabani 2012), ORIENTE (Darras, Sailler, et al. 2010). However HOMER (hybrid
optimization model for electric renewables) is so far the most common tools for cost
analysis, sensitivity analysis, and validation testes of HRESs. It is produced by the
National Renewable Energy Laboratory, US (Zhou, Lou, et al. 2010). Figure 2-9
presents the architecture of HOMER software. The operation of the HOMER software
is simple and straightforward. Economic assessment is based on Net Present Cost, and
since it is using the annual real interest rate, the impact of inflation has been factored
out of the analysis (Zhou, Lou, et al. 2010).
Page 47
34
Figure 2-9: Architecture of HOMER software (Mellit and Kalogirou 2008).
2.9.2 Computational optimization
The computational optimization methods have been developed significantly in
recent years. They can effectively increase the efficiency of hybrid systems by finding
the best configuration to optimize the technical and economic criteria as mentioned
before. Figure 2-10 illustrates the block diagram of computational optimization
methods.
Page 48
35
Figure 2-10: Optimization of hybrid systems.
Reference (Erdinc and Uzunoglu 2012) reviewed over two hundred papers on
latest computational optimization methods for stand-alone hybrid systems, and
categorized them according to the Table 2-4.
Table 2-4: Sizing methodologies
Genetic algorithm Evolutionary algorithm
Particle swarm optimization Design space based approach
Neural network Probabilistic, iterative, parametric and numerical approaches
Simulated annealing Other approaches (matrix approached.)
Linear programming
Page 49
36
In this study computational optimization is defined as “the process of designing,
implementing and testing algorithms for solving a large variety of optimization
problems. Computational optimization includes the disciplines of mathematics to
formulate the model, operations research to model the system, computer science for
algorithmic design and analysis, and software engineering to implement the model”. It
is concluded that the computational optimization methods for wind-solar energy
resources increased dramatically over the recent years. In addition it recommended that
“the use of heuristic approaches, and parallel processing are promising research areas in
this field of renewable and sustainable energy”. It is also introducing Ant colony
algorithm (ACO) and artificial immune system algorithm (IS) as some examples of
potential methodologies for sizing of hybrid systems.
Another study on sizing methodologies was conducted by Luna-Rubio et al. in
2011 (Luna-Rubio, Trejo-Perea, et al. 2012). It classified sizing methodologies into:
probabilistic, analytical, iterative, and hybrid techniques. It concluded that one of the
most powerful sizing methodologies to optimize the hybrid systems are bio-inspired
methodologies which can deal with lack of information and data. Moreover, they are
known as powerful methods for multi-objective optimization.
According to the aforementioned information, one of the common methods for
optimization of hybrid systems is using bio-inspired technologies, such as genetic
algorithm (GA), artificial neural network (ANN), particle swarm optimization (PSO),
etc. Ref (Mellit and Kalogirou 2008) reviewed over 335 studies on using artificial
intelligence techniques in order to forecasting the incomplete metrological data, sizing
and modeling, simulation and control of photovoltaic applications. Another study was
done by Jafarin and Ranjbar to estimate annual energy output of wind turbines in 25
Page 50
37
different stations in Netherland by applying neural networks and fuzzy logic approaches
(Jafarian and Ranjbar 2010).
GA is one of the efficient methods to optimize sizing of the hybrid systems,
especially in complex systems, where the number of parameters is high. It provides
variety of hybrid systems with different size of components to satisfy the load demand
based either load profile of given location or meteorological data of the region, and then
it can evaluate them according to defined fitness function.
ANN is another artificial intelligence technique to optimize the hybrid systems.
It can be used to predict and modeling of the incomplete meteorological data, and to
improve the performance of hybrid system in combination with other methods such as
genetic algorithm or fuzzy logic.
PSO like GA is commonly used in literature as an optimization method. It can
be pointed out to simple concept, easy coding implementation, robustness to control
parameters, and computational efficiency by generating high-quality solutions with
shorter calculation time and stable convergence characteristics as the advantages of the
PSO.
However, according to the amount of considered input data (including wind
speed, solar radiation, load profile, etc.) and multi-objectives nature of hybrid systems’
optimization methods, sometimes they fail to offer accurate solutions; in this way
hybrid artificial intelligent based optimization methodologies can improve the result.
For more detailed information on optimization methods, the readers are addressed to ref
(Erdinc and Uzunoglu 2012; Luna-Rubio, Trejo-Perea, et al. 2012).
Page 51
38
2.10 Conclusion
The unpredictable nature of renewable energy resources, high initial cost, and
dependency on weather conditions result in combining different renewable resources to
form a Hybrid system which can be flexible, cost effective, reliable and efficient.
Techno-economic analysis of hybrid systems ensures that a right combination is chosen.
In the present study, the design and techno-economic evaluation of stand-alone hybrid
renewable energy systems are reviewed. The existing technologies for photovoltaic
solar cells, wind turbines, batteries and diesel generators, as the storage and backup
systems, are investigated. To come up with a cost and energy efficient hybrid renewable
energy system, the economic and technical criteria to optimize the systems are studied.
The possible configurations of the HRES are investigated and their sizing and
optimization methods are described. Among the several applied software for
optimization, HOMER is one of the common software for cost and sensitivity analysis
of the HRES and is explained in detail. It is found that the GA, ANN and PSO are the
common computational optimization methods that are applied in the surveys. Despite
the significant progress in modeling, sizing and optimization of HRES in the past
decade, still there is a gap in implementation and application of HRES in world-wide
scale.
Page 52
39
CHAPTER 3
METHODOLOGY
This chapter is intended to explain the method used for the completion of the
project.
3.1 Introduction
Goal of this study is optimal design of a diesel-based hybrid Wind/PV renewable
energy system. Optimization variables are the number of wind turbines and PV panels,
days of autonomy for battery capacity and the number of houses in a village in which
renewable hybrid energy system may be shared by them. System costs consist of
annualized cost of investment, replacement cost, operation and maintenance cost of
components, and fuel cost for diesel generator. The problem is subject to maximum
allowable reliability index as well as minimum price of electricity. Particle swarm
optimization is used in this regard.
Moreover, optimal combination of number of wind turbines and PV panels, days
of autonomy for battery capacity and the number of houses in a village in which
renewable hybrid energy system may be shared by them is achieved by applying
particle swarm optimization, the optimization problem is subject to maximum allowable
reliability index as well as minimum price of electricity.
3.2 Simulation Approach
It is assumed 100% reliability for the system which means the system will
perform without any interruptions. The developed software optimizes the variables of
the hybrid system in order to find the best combination and sizing of the components to
meet the load even when the renewable resources are not available.
Page 53
40
3.2.1 Load profile
For rural and remote tribal areas location, stand-alone hybrid renewable energy
system can be used as an alternative solution to provide electricity. However studying
the load profile of area is critical to design a reliable and efficient system for a specific
area. Sizing and modeling of batteries depend on the load profile. Moreover, peak times
in a load profile and behavior of consumers have effect on the reliability of the system,
and also, the sizing of the component and the price of electricity will be affected by that.
The hourly load profile of typical rural area is shown in Figure 3-1. The hybrid
system is designed to supply this daily load curve.
Figure 3-1: Hourly typical rural household load profile (kW)
3.2.1.1 Design of battery bank
The battery capacity (kW) of the system is designed according to the load by
using the following equation:
5 10 15 200
0.5
1
1.5
2
2.5
3
3.5
4
4.5
5
Page 54
41
(3.1)
For exapmle, for one house, with the above load profile, we assume, autonomy
days=3, depth of discharge(DOD)=80% and ηinv=95%,ηb=85%; so capacity of battery
bank would be :
(34)
Which means the capacity of battery bank should be designed for 4.5 times of
average load (in this case 2.54 kW) to satisfy the load for maximum 3 days of
insufficient renewable energy sources; if the voltage of DC bus selected as 48v and the
lead acid battery selected as 12v, 100Ah; then 4.64 X 2.54=11.7856kW,
11785.6/48=245Ah. Therefore, the number of batteries in series would be 4 to obtain
the level of DC voltage at the DC bus. The number of batteries in parallel would be
245/100=2.45≈3, so 12 batteries would be needed for one house.
3.2.2 Power management strategies
The stand-alone hybrid system is composed from renewable power sources as
well as non-renewable resources as a backup. Consequently, the power management
strategies for that became very complex. As a basic control rule, the energy extracted
from renewable energy sources must be preferentially used to feed the loads. In
addition, the battery bank should also be capable of providing the needed power when
the renewable resources are not either available or sufficient to meet the load.
Therefore the management strategy would be covering the load demand by
adding the power generated from renewable energy sources (wind and PV) and the
energy stored in the battery. The diesel generator is switched on as a backup source
when the battery bank is depleted. For each hour step the simulation program compares
Page 55
42
the load demand and the supplied energy (Wind+PV), and according to the
difference a decision to charge the battery or discharge it or to operate the diesel
generator will be taken. If the power extracted from wind and PV is more than is
demanded then the surplus power can be used to charge the batteries. If, on the contrary,
renewable resources fail to meet the load demand then battery bank would be
discharged to its minimum value. The following cases will be considered in the
simulation software to apply these strategies:
Case1: Sufficient generated energy is provided by renewable sources and the
extra energy is used to charge battery bank.
Case 2: same as case 1 but surplus energy generated by renewable resources is
greater than the need to supply the load and the battery bank. Therefore, in this case the
surplus energy is consumed by the dump load.
Case 3: renewable resources failed to provide sufficient energy to meet the load.
The priority in this case, is to use the stored energy in the batteries rather than operating
the diesel generator.
Case 4: The generated energy by the renewable sources is not sufficient to meet
the demanded load and the battery bank is also depleted. In this case the diesel generator
is switched on to supply the load and charge the batteries. The hybrid system would be
remained in this mode until the batteries are recharged to their full capacity.
The main flow chart, for different modes of operation, is shown in Figure 3-2.
The algorithms for strategy2, strategy3, and strategy4 are given in Figure 3-3,
Figure 3-4, and Figure 3-5 respectively.
Page 56
43
Figure 3-2: Main flowchart of the hybrid system
start
Read inputs
Pw(t)+Ppv-out(t)>=Pl(t)/Uinv
discharge Run load with turbine and PV
Pw(t)+Ppv-out(t)>Pl(t)
Charge Eb(t)=Eb(t-1)
Return
Page 57
44
Figure 3-3: Flowchart of charging mode of operation
charge
Pch(t)=Pw(t)+Ppv-out(t)-Pl(t)/Uinv
Ech(t)=Pch(t)*1hr(iteration time)
Ech(t)<=Ebmax-Eb(t)
Eb(t)=Eb(t-1)+Ech
Eb(t)>Ebmax
Eb(t)=Ebmax
Edump(t)=Ech(t)-(Ebmax-Eb(t))
Return
Edump(t)=0
Return
Eb(t)=Ebmax
Edump(t)=Ech(t)-(Ebmax-Eb(t))
Return
Page 58
45
Figure 3-4: Flowchart of the discharging mode of operation
discharge
Pdch(t)=Pl(t)/Uinv-(Pw(t)+Ppv-out(t))
Edch(t)=Pdch(t)*1hr(iteration time)
Eb(t-1)-Ebmin>=Edch(t)
Eb(t)=Eb(t-1)-Ech
Return
Eb(t)=Ebmin
Run load with diesel generator&renewable
sources
Run diesel generator
Page 59
46
Figure 3-5: Flowchart of the diesel mode of operation
3.3 Particle swarm optimization
Generally, artificial algorithms are population-based and demand a number of
simulations. Optimal design of such reliable hybrid system is very complex and
computationally intensive.
PSO first described by Kenney and Eberhart in 1995, inspired by two separated
concepts: the idea of swarm intelligence based on the social interaction exhibited by
swarm, and the field of evolutionary computation.
PSO performance is comparable to genetic algorithms or ant colony algorithm
since it is faster and less complicated; it has also successfully been applied to a wide
variety of problems. It is simple implementation and very efficient global optimizer for
continuous variable problems (f.schutte 2005).
The PSO algorithm consists of three main steps as follows:
Run diesel generator
Eb(t)=Eb(t-1)+(Pg*uinv+Pw(t)+Pp(t)-((Pl(t)/uinv)*1))
diesel(t)=Pg*uinv
if Eb(t)>Ebmax
Edump(t)=Eb(t)-Ebmax
Eb(t)=Ebmax
if Eb(t)<Ebmin
Edump(t)=0
Eb(t)=Ebmin
Page 60
47
Evaluate the fitness of each particle
Update individual and global best finesses and positions
Update velocity and position of each particle
Each particle remembers the best fitness value it has achieved during the
operation of algorithm. The particle with the best fitness value compared to other
particles is also calculated and updated in iterations. The process is repeated until some
stopping criteria, such as number of iteration or predefined target fitness value, are met.
The position of each particle in the swarm is updated using the following
equation:
(35)
Where x is particle position and v is particle velocity in iteration k. The velocity
calculated as follows:
(36)
√
(37)
(38)
Where, Pi is the best individual particle position and P
g is the best global
position, c1 and c2 are cognitive and social parameters, r1 and r2 are random numbers
between 0 and 1.
Vik, called inertia, it makes the particle move in the same direction and with the
same velocity.
c1.r1.(pki-xk
i), called the cognitive component, causing the particle return to a
previous position in which it has experienced high individual fitness.
Page 61
48
c2.r2.(pki-xk
i), called the social component, causing the particle tend to return to
the best region the swarm has found so far and to follow the best neighbor’s direction. If
c1>>c2 then each particle is much attracted to individual best position, in the contrary, if
c2>>c1, then particles are more attracted to global best position.
In this study the value of certain parameters are optimized by using PSO.
Figure 3-6 represents the PSO algorithm.
Figure 3-6: PSO flowchart
start
initial papulation of particles with random position and velocities
comparing the position of each particle with constraines
iteration
evaluate the fitness of each particle
compare each particle's fitness evaluation with the current particle's to obtain the
individulal best position
compare fitness evaluation with the population's overall previous best to obtain
the global best position
update velocity and position for each particle
end
Page 62
49
3.4 Reliability and economic analysis
3.4.1 Reliability
Several reliability indices are introduced in literatures. Loss of load expected,
loss of energy expected, loss of power supply probability, and equivalent loss factor are
some of the most common used indices in the reliability evaluation of any system.
Loss of power supply probability (LPSP) is a statistical parameter which
indicates the probability of power supply failure due to either losing power supply in a
bad resource year or technical failure to meet demand. There are two methods of
calculating LPSP i.e. chronological simulation and probabilistic techniques. The former
technique is using time-series data in a given period (equation (2.32)) and the latter is
based on energy accumulation effect of the energy storage system (equation (2.33))
(Diaf, Belhamel et al. 2008). They can be described by either of the following
equations (Deshmukh and Deshmukh 2008; Luna-Rubio, Trejo-Perea, et al. 2012;
Rajkumar, Ramachandaramurthy, et al. 2011; Yang, Zhou, et al. 2008):
∑
(3.7)
∑
∑
(3.8)
In this study the reliability evaluations are carried out for worst conditions.
Equation (3.7) is chosen as the main reliability index of this study. In developed
countries, electricity suppliers aim at LPSP<0.01%, however, in rural areas and stand-
alone applications, LPSP<1% is acceptable (Kashefi Kaviani, Riahy, et al. 2009).
Version R2010b for MATLAB is used to calculate the parameters.
Page 63
50
3.4.2 Economic analysis
Cost of electricity (COE) is one of the most well-known and used indicators of
economic profitability of HRES (Kaabeche, Belhamel, et al. 2011). It is defined as the
constant price per unit of energy (or cost per unit of electricity). It can be calculated by
the following expressions (Kaabeche, Belhamel, et al. 2011; Luna-Rubio, Trejo-Perea,
et al. 2012; Rajkumar, Ramachandaramurthy, et al. 2011):
(
)
(3.9)
Total net present cost includes all installed capital cost i.e. the present cost,
operation and maintenance cost, and replacement cost. Pload is the total energy generated
by the HRES during the system life period. CRF or capital recovery factor is a ratio to
calculate the present value of system components for a given time period, taking into
consideration the interest rate. It is calculated by:
(3.10)
Where, i is the interest rate and n is the system life period (or Amortization
period), which is usually equal to the life of the PV panel, due to its longer life
expectancy compared to other components in HRES (Dufo-López and Bernal-Agustín
2008).
3.5 Optimization programming
The PSO algorithm is applied, to optimize COE and LOLP. The main program
is developed to manage the power and operation of the system. They have been
Page 64
51
developed using MATLAB software. The general model that has been applied in this
study is described as follows.
Figure 3-7: General model of hybrid system programming.
In the following paragraphs, the complete flows of the algorithm for techno-
economic analysis of HRES are indicated.
Inputs
•Metheorological conditions(wind speed, solar radiation, temperature,...)
•Load profile
•Economical data
•Characteristics of components
•PSO parameters
Optimization Consentraints and termination criteria
•Number of wind turbines[0:3]
•Output power of pv[0:14kw]
•Days of autonomy[1:6]
•Number of particles
•Number of iterations
PSO+ Main Algorithm
•Finding the best optimized system with low cost and high reliability
Outputs
•The best founded COE and LOLP
•Number of wind turbines
•Output power of the PV
•Days of autonomy
Page 65
52
Step1) Initialization.
a) Load meteorological data
b) Load components characteristics
c) Load economic parameters
d) Set the constants:
Personal and Global Learning Coefficient, C1=C2=2,
Maximum of Iteration=40,
Number of Particles=20,
Inertia Weight, W=0.5,
Inertia Weight Damping Ratio, Wdamp=0.99
e) Set the constraints:
Maximum price of electricity, C=0.5
Maximum loss of load probability, W=0.3
Maximum renewable energy factor (the ratio of diesel output power to
renewable energy power in a year), K=0.9
f) Define the list of tasks as follows. The dimension of PSO algorithm is
the number of tasks.
Upper bound and lower bound of nominal power of PV (kW), [0:45]
Upper bound and lower bound of autonomy days, [1:8]
Upper bound and lower bound of number of houses for a hybrid system (Load)
[1:10]
Upper bound and lower bound of number of wind turbine, [0:10]
g) The position and velocity of particles are randomly selected and apply to
the objective function to find COE and LOLP.
Page 66
53
h) If the positions of randomly chosen particles exceed the limitation of
COE or LOLP, return to (d).
i) Evaluate each particle in the swarm and find the best fitness value among
the whole swarm. Set the global best value.
Step2) Update iteration variable.
Step3) Update inertia weight.
Step4) Update velocities.
Step5) Update positions.
Step6) Apply to the objective function to find COE and LOLP.
Step7) Update individual best position.
Step8) Update global best position.
Step9) Stopping criterion. If the number of iteration exceeds the maximum number of
iterations, then stop; otherwise go to step 2.
3.6 Summary
The main goal of designing hybrid renewable energy systems is to provide a reliable
supply to the load, under varying weather conditions, and with minimum cost. In this
study a hybrid system is designed for 20 years of operation. Moreover, optimal
combination of number of wind turbines and PV panels, days of autonomy for battery
capacity and the number of houses in a village in which renewable hybrid energy
system may be shared by them is achieved by applying particle swarm optimization; the
optimization problem is subject to maximum allowable reliability index as well as
minimum price of electricity.
Page 67
54
CHAPTER 4
RESULTS
4.1 Introduction
Because of intermittent nature of energy resources and seasonal unbalance, a
hybrid PV-Wind system was developed to meet the demanded load in remote areas.
Malaysia weather condition is used for this purpose.
In this chapter simulation result using Matlab software, version 7.11 will be
discussed. The results present the different configurations of the components for
efficient hybrid system to supply typical load in rural areas.
Two methods of optimization are considered in this study, at first the result
obtained by running the program in different scenarios is analyzed and then by
comparing the results, the best configuration is suggested. The second technique is
using PSO to find the best optimum configuration by minimizing the fitness function
considering the different constraints.
4.2 Renewable energy outputs
The renewable energy sources can be considered the best alternative to
reduce energy poverty of the rural areas where the grid extension through a
difficult terrain and thick jungle is not possible and economically viable. In this
study, the potential of applying renewable sources such as solar and wind for rural
electrification, is investigated.
4.2.1 Wind output
Wind can be considered as free available energy source that can be utilized for
the electrification in Malaysia. In the early 1980s, a study on Malaysia’s wind
Page 68
55
energy was done at University Kebansaan Malaysia (UKM). Solar Energy Research
Group from UKM collected wind data from ten stations in the whole country for a
period of 10 years from 1982 to 1991. The data of study include the hourly wind speed
in stations, which are mostly located at airports and near coast, where land and sea
breezes may influence the wind regime (Sopian, Othman et al. 1995). The study shows
that, due to the Malaysia’s location, mean wind speed is low and no more than 2m/s.
Nonetheless; the wind does not blow uniformly; wind speed varies according to
month and region. The strongest wind blows on the East coast of Peninsular Malaysia.
The maximum speeds occur in the afternoon and minimum speeds occur just before
sunrise (Sopian, Othman, et al. 1995).
Although average flow of wind is light in Malaysia, but it can generate a
high amount of energy, especially on remote islands or east coast states of Malaysia,
which experiences the wind speed of about 15.4 m/s during strong surges of cold air
from the north Sabah and Sarawak. Moreover, it has the high potential of wind energy,
which can be reached to 10.2m/s during October to March (Shafie, Mahlia et al. 2011).
The greatest wind power potential is for Mersing and Kuala Terengganu which
are located in east coast of peninsular Malaysia. In Sabah, wind directions in two
stations of Kota Kinabalu and Tawau are consistent wind during the whole of the year.
Kota Kinabalu has higher wind power densities at the end of the year; whereas
Labuan station shows that the wind power densities are high at the beginning of the
year (Sopian, Othman, et al. 1995). The Figure 4-1 illustrates the hourly wind speed
data in Mersing, Malaysia.
Page 69
56
Figure 4-1: Hourly wind speed data in Malaysia
Analyzing the data, it can be seen that, the small wind machines could be used to
provide electricity for rural household in Malaysia, that don’t have access to national
grid (Sopian, Othman, et al. 1995). Therefore, in this study a small wind turbine with
0.3 kW rated power is considered to design the hybrid system. The detailed
characteristics of selected wind turbine can be found in Table 4-1. By using equation
(2.14), the daily output power of wind turbine is calculated and shown in Figure 4-2.
0 1000 2000 3000 4000 5000 6000 7000 80000
1
2
3
4
5
6
7
8
9
10
number of hours in a year
win
d s
peed (
m/s
)
Page 70
57
Figure 4-2:Average daily output power from wind turbine in Malaysia
4.2.2 PV output
The potential of applying solar energy in Malaysia especially in the rural
areas is investigated in this section.
Solar radiation data in Malaysia have been the matter of earlier studies.
Malaysia climatic conditions are desirable to extend the PV system utilization, because
of the high amount of solar radiation received throughout the year. Solar radiation in
Malaysia is relatively high based on the world standards. It is estimated that Malaysia
solar power is four times of world fossil fuel resources (Ayu wazira azhari 2008).
Malaysia solar radiation amount is ranging from 0.61kWh/m2 a day in
December to 6.8kWh/m2 in August and November. North region and a few places
in east of Malaysia receive the highest amount of solar radiation by the average
of more than 3kWh/m2 throughout the year. It is estimated that one square meter of
5 10 15 200
0.01
0.02
0.03
0.04
0.05
0.06
0.07
0.08
0.09
0.1
hours
Pow
er(
kW
)
average daily output power from wind turbine
Page 71
58
solar panel in Malaysia can cause 40kg of CO2 reduction yearly (Sovacool and
Drupady 2011).
The solar radiation has a high effect on performance of PV. The power supplied
by the panels is calculated by(Daud and Ismail 2012) :
(3.11)
Where, Ppv-out is output power of PV, PN-pv is rated power at reference conditions,
G is solar radiation (W/m2), Gref is solar radiation in reference condition, Tref is cell
temperature at reference condition, Kt is temperature coefficient of maximum power,
Tamb is the ambient temperature (Gref=1000W/m2,Tref=25˚c,Kt=-3.7*10
-3(1/˚c)). The
average monthly ambient temperature is illustrated in Figure 4-3.
Figure 4-3: Average monthly ambient temperature.
By using data above, average daily PV output power is calculated. Figure 4-4
shows average daily output power from PV in Malaysia. Rated power from PV panel is
considered to be 7.3kW. However the mean output power per day would be 2.7kW due
to the limited sunshine hours. According to literature, in Malaysia the tilted angle of 15˚
is suitable to install the module upon the roof to generate the maximum power for
24.8
25
25.2
25.4
25.6
25.8
26
26.2
26.4
26.6
26.8
Jan Feb Mar Apr May Jun Jul Aug Sep Oct Nov Dec
Temperature(˚C)
Page 72
59
domestic usage. The performance of the system with tilted panel in this case would be
98.6% (Elhassan, Zain et al. 2011).
Figure 4-4: Average daily output power from PV in Malaysia
4.3 Economic analysis
The initial costs of the different components of hybrid system are shown in
Table 4-1. It can be observed that PV panels have the highest cost compared to other
components of the system. Also other inputs which are used in programming are
tabulated.
0 5 10 15 200
1
2
3
4
5
6
7
8
Pow
er(
kW
)
average daily output power from pv
Page 73
60
Table 4-1: Input parameters
parameter unit value parameter unit value
DIESEL GENERATOR ECONOMIC PARAMETERS
life time hours 24000 discount rate % 3
initial cost $/kW 1000 inflation rate % 3.2
rated power kW 4 o&m+running
cost % 20
INVERTER fuel inflation
rate % 5
efficiency % 92 project life
time year 24
life time year 24 WIND
initial cost $ 2500 Wind
regulator cost $ 1000
BATTERY
efficiency % 85 blades
diameter m 6.4
life time year 12 swept area m2 128.6796
initial cost $/kWh 280 efficiency 0.95
rated power kWh 40 cut out m/s 40
PV cut in m/s 2.5
PV regulator
efficiency % 95 rated speed m/s 9.5
life time year 24 rated power kW 5
initial cost $/kW 3400 Price $/kW 2000
rated power kWh 7.3
PV regulator cost $ 1500 life time year 24
Page 74
61
4.3.1 Techno-economic analysis of HRES
In this section the effect of days of autonomy, increasing the load, and
increasing the power of PV on reliability and cost of electricity is investigated. Notice
that because of insufficient output power from wind turbine and complexity of analysis,
wind turbine is not included in the analysis.
4.3.1.1 Output power of PV versus days of autonomy
Figure 4-5 shows the effect of changing output power of PV and days of
autonomy on price of electricity. Figure 4-6 illustrated effects of the same parameters on
LPSP. By comparing two graphs, it can be found that, the cheapest price of electricity
for one house is achieved when the output power of PV is about 6 kW and days of
autonomy is above 4. The LPSP in this range would be zero, which means the system is
reliable too.
Figure 4-7 simulate the operating hours of hybrid system for one week. From
the figure it can be seen that the diesel generator is run rarely. And the dump load is also
runs for a few hours only.
In summary, a system with 6 kW PV panel, autonomy days of 4.5 can be
considered as an efficient system to meet a rural household load demand in Malaysia. In
this case the price of electricity would be less than 0.16 $/kW (0.528 RM/kW) and the
system would not have any loss of power.
Page 75
62
Figure 4-5: Price of electricity for one house ($/kW)
Figure 4-6: LPSP for one house
Output power of PV (kW)
Days o
f auto
nom
y
Pice of electricity ($/kW)
2 4 6 8 10 12 141
1.5
2
2.5
3
3.5
4
4.5
5
5.5
6
0.16
0.18
0.2
0.22
0.24
0.26
0.28
0.3
0.32
Output power of PV (kW)
Days o
f auto
nom
y
Loss of load probability
2 4 6 8 10 12 141
1.5
2
2.5
3
3.5
4
4.5
5
5.5
6
0
0.02
0.04
0.06
0.08
0.1
0.12
0.14
0.16
0.18
Page 76
63
Figure 4-7: Operation of hybrid PV-battery-diesel system in one week
By using these information we design the system and increasing the number of
houses to examine whether sharing the hybrid system for number of houses in the form
of mini-grid can be effective or not.
4.3.2 Output power of PV versus increasing the load demand
In this section we study the feasibility of sharing hybrid system for number of
houses in a village. According to the previous results, for each house a 6 kW PV would
be sufficient to meet the demand. And 4.5 days of autonomy would be the best option
for designing the battery bank.
0 20 40 60 80 100 120 140 160 1800
5
10
15
20P
ow
er
(kW
)
PV
BATTERY
DIESEL
0 20 40 60 80 100 120 140 160 1800
1
2
3
4
5
Number of hours in one week of operation
Pow
er(
kW
)
Demanded LOAD
DUMP LOAD
Page 77
64
Figure 4-8 indicates the result of increasing number of houses on the price of
electricity. By sharing the system for number of houses in a village, the price of
electricity decreased to 0.1$/kW. In the contrary, from Figure 4-9 it can be seen that the
reliability of the system decreased dramatically. Therefore, to design a reliable, cost
effective system, there is a need to find the optimum configuration. Figure 4-10 is an
illustration to show the optimized areas in which both COE and LPSP are on their
lowest amount. From the Figure it can concluded that for two houses and PV panel of
16 kW, the hybrid system would be in optimum configuration. In this case price of
electricity would be around 0.15$/kW, and LPSP would be less than 10%.
Figure 4-11 simulates operating hours of hybrid system for one week. From the
Figure it can be seen that the diesel generator is run rarely. And the dump load also runs
for a few hours.
Therefore, to design a system for remote areas the priorities are different. The
result shows, if the priority is having the cheapest price, the hybrid system can be shared
between two houses. In the contrary, if the priority is having the most reliable system,
then for each house the hybrid system can be installed separately.
In the next section the wind turbine is also added to the system and the
optimization is performed by PSO algorithm.
Page 78
65
Figure 4-8: Price of electricity for 4 days of autonomy
Figure 4-9: LPSP for 4.5 days of autonomy
Output power of PV(kW)
Num
ber
of
houses
5 10 15 20 25 30 35 40 451
1.5
2
2.5
3
3.5
4
4.5
5
5.5
6
0.1
0.15
0.2
0.25
0.3
0.35
0.4
Output power of PV(kW)
Num
ber
of
houses
5 10 15 20 25 30 35 40 451
1.5
2
2.5
3
3.5
4
4.5
5
5.5
6
0.2
0.3
0.4
0.5
0.6
0.7
0.8
0.9
Page 79
66
Figure 4-10: Optimum configuration areas (%) considering 4.5 days of autonomy
Figure 4-11: Operation of hybrid PV-battery-diesel system in one week for two houses
Output power of PV(kW)
Num
ber
of
houses
5 10 15 20 25 30 35 40 451
1.5
2
2.5
3
3.5
4
4.5
5
5.5
6
30
35
40
45
50
55
60
65
70
0 20 40 60 80 100 120 140 160 1800
10
20
30
40
Pow
er(
kW
)
PV
BATTERY
DIESEL
0 20 40 60 80 100 120 140 160 1800
2
4
6
8
10
Number of hours in one week operation
Pow
er(
kW
)
Demanded LOAD
DUMP LOAD
Page 80
67
4.4 Particle swarm optimization (PSO)
In this section PSO is applied to optimize certain parameters in the hybrid
system. Power of PV panels, days of autonomy, number of houses, and number of wind
turbines are optimized by using PSO. The results are shown in Table 4-2. It can be seen
that the result in which the hybrid system is shared between the houses have the
cheapest price, but the power from PV panels should be high enough to have the better
reliability. The lowest cost of electricity founded by PSO is 0.105 $/kW. The battery
bank should be designed for 8 days of autonomy and the hybrid system can be used as a
mini-grid to share the electricity between 4 houses. The objective function for the PSO
programming was the cheapest price with the lowest loss of power probability, as a
result, the best founded design to meet these objectives and also cover other limitations
such as high contribution of renewable energy in the system, would be a system with 30
kW PV panel, and by considering 8 days of autonomy which is shared between 4
houses. In this case the diesel generator is used rarely (2% of total power); and the PV
contribution in the system is about 68% (Figure 4-12). The price of electricity would be
0.1 $/kWh, however this result can be different for other places with different weather
conditions.
Since the power extracted from wind energy is negligible, the system is working
mainly based on solar energy. Therefore, using wind turbine is not economically
feasible. However from PSO result, a small wind turbine can also be used, but the
power output from wind turbine wouldn’t be noticeable. From the second scenarios of
PSO result, we can say that even though Malaysia doesn’t have high wind speed we can
use small wind turbines in the design of hybrid system with some success.
Page 81
68
Table 4-2: Results of optimization from PSO
PV(kW) 30 29
DAYS OF AUTONOMY 8 8
NUMBER OF HOUSES 4 4
NUMBER OF WIND TURBINES 0 1
LOSS OF LOAD PROBABILITY 0.083 0.085
PRICE OF ELECTRICITY ($/kW) 0.109 0.108
RENEWABLE FACTOR 0.020 0.022
Extracted power from different resources in one year
PV (kW) 95518.909 92334.94
WIND (kW) 0 342.14
BATTERY (kW) 40320.011 40375.39
DIESEL (kW) 2745.279 2966.07
Figure 4-12: Best configurations founded by PSO
Figure 4-13 simulates operating hours of hybrid system for one week. The
battery bank is designed for 8 days of autonomy and the hybrid system is designed as a
mini-grid to share the electricity between 4 houses. From the Figure it can be seen that
the diesel generator is run rarely. And the dump load also runs for a few hours.
69%
29%
2%
PV
BATTERY
DIESEL 68% 0%
30%
2%
PV
WIND
BATTERY
DIESEL
Page 82
69
Figure 4-13: Operation of hybrid PV-battery-diesel system in one week for four houses
4.5 Conclusion
A hybrid PV-Wind system was developed to meet the demanded load in remote
areas in Malaysia. The results presented for different configurations of the components
for efficient hybrid system to supply typical load in rural areas. The results also can be
used for supplying electricity to emergency requirements such as hospital, school and
other purposes according to their energy requirements.
Sensitivity analysis is also carried out by running the program in different
scenarios to find the best configuration for one house. A system with 6 kW PV panel,
autonomy days of 4.5 reveals as an efficient system to meet a rural household load
demand in Malaysia. In this case the COE and LPSP would be minimized. It is also
found that the hybrid system can be applied as a mini-grid to share electricity between
houses. However with 4.5 days of autonomy, only two houses can be connected to the
HRES.
0 20 40 60 80 100 120 140 160 1800
50
100
150
Pow
er(
kW
)
0 20 40 60 80 100 120 140 160 1800
5
10
15
20
Number of hours in one week operation of hybrid syetem
Pow
er(
kW
)
PV
WIND
BATTERY
DIESEL
Demanded Load
Dump Load
Page 83
70
In addition, PSO algorithm is applied to find the best optimum configuration by
minimizing the fitness function considering the different constraints. Due to high
flexibility of PSO to solve optimization problem for multiple-variable functions, wind
turbine is also added to the system. Power of PV panels, days of autonomy, number of
houses, and number of wind turbines were optimized by using PSO.
Decreasing COE, LPSP, and increasing the contribution of renewable resources,
are considered during optimization of system by PSO algorithm, which poses a very
complex problem. This is because when one of the objectives gets improved, the other
gets worse. Finally, the best founded design to meet these objectives and also cover
other limitations such as high contribution of renewable energy in the system, is
founded as a system with 30 kW PV panel, by considering 8 days of autonomy which is
shared between 4 houses.
In summary, depending upon priorities to design the hybrid system, there might
be villages where micro-grid would be more cost effective as compared to
single user hybrid systems. If the priority is having the cheapest price, the hybrid system
can be shared between a numbers of houses. On the contrary, if the priority is to have
the most reliable system (such as emergency hospital), then, for each user the hybrid
system can be installed separately. However geographical terrain and location of
houses within the village, available technologies, and weather condition, are some of
the additional factors that will influence a choice between these two scenarios.
Page 84
71
CHAPTER 5
DISCUSSIONS
5.1 Introduction
In this section design consideration of hybrid system is investigated. Moreover,
according to the literature reviews, and by considering the configuration of optimum
systems which are founded in the study, two HRESs are designed for rural areas in
Malaysia.
5.2 Design considerations of the HRES for one house
5.2.1 Design of battery bank
48V DC voltage is selected for DC bus; therefore the batteries shall be
connected in series to obtain this level of voltage. 12V, 20/40/75 Ah lead acid batteries
usually are used for stand-alone applications. In this study, capacity of battery bank for
each house is selected according to Equation (3.1). By considering 4.5 days of
autonomy, 80% DOD, 85% battery efficiency, and 92% inverter efficiency for earlier
mentioned load profile, the capacity of battery bank would be 18.27 kWh. Since the
voltage of DC bus is 48V, four batteries shall be connected in series to obtain this level
of voltage. So, the Ampere-hour capacity of the battery bank to cover the load demand
would be 18.27×1000/48=380.625Ah. By choosing lead acid batteries of 75Ah, five
parallel strings each has four batteries connected in series are needed to cover the load.
5.2.2 Bidirectional inverter
Since, in this study, a diesel generator is used as a backup, a bidirectional
inverter in needed to transfer power in both AC and DC buses. The inverter has to
Page 85
72
handle a maximum power of demanded load. It can be chosen 20% higher that of the
AC rated load power. Since 48V DC voltage is selected for DC bus; Voltage of Inverter
should be rated at 48V.
5.2.3 Charge controller
A charge controller acts as interface between PV panel and the DC bus where
the battery is connected. Therefore, it should be rated to the DC level of voltage, which
is 48V. It controls the energy inflow and outflow into and from the battery to protect
battery against either excessive over charge or deep discharge.
5.2.4 Design of stand-alone hybrid system
Hybrid systems open an opportunity to use the advantages of renewable
resources in combination with conventional power resources. According to the
literatures, a typical stand-alone HRES includes photovoltaic, Wind, Fuel-Cell, battery,
Diesel, and systems controllers. Different configurations of HRES are tabulated in
Table 5-1. The aforementioned studies are mostly considered for the simulation, power
management, economy and efficiency evaluations based on the implemented system.
Table 5-1: Combination of hybrid systems stand-alone hybrid systems reference
Wind-Battery (Roy, Kedare, et al. 2009)
Wind- Fuel Cell (M.T 2003)
Wind -Micro turbine (Colson, Wang, et al. 2007)
PV -Diesel-Battery (Mondal and Denich 2010; Shaahid and
Elhadidy 2003)
PV-Fuel Cell (Hwang, Lai, et al. 2009)
PV-Wind- Diesel (McGowan and Manwell)
PV- Wind- Fuel Cell (Kashefi Kaviani, Riahy, et al. 2009)
PV-Fuel Cell-Electrolyze (El-Shatter, Eskandar, et al. 2002)
PV- Fuel Cell -Super Capacitor Bank (Zandi, Payman, et al. 2011)
PV- Fuel Cell -Electrolyze-Battery (Ulleberg and Mørner)
PV- Wind- Fuel Cell -Electrolyze-Battery (Dufo-López and Bernal-Agustín 2008)
PV- Wind-Micro Turbine- Battery (Kalantar and Mousavi G 2010)
PV- Wind- Fuel Cell - Electrolyzer- Battery (Caisheng and Nehrir 2008)
There are three ways to integrate different alternative energy sources to form a
hybrid System which can be named as AC, DC, and AC/DC bus line coupling. Each
Page 86
73
method has its own advantages and disadvantages. DC coupling can be used for long
distance transmission due to less transmission losses and single-wire connection.
However, AC coupling is more economic with standard interfacing and modular
structure. In AC/DC bus line, both sides can be used to feed the load demand.
In this study, feasibility of hybrid stand-alone renewable energy system for rural
area of Malaysia in is investigated. By analyzing the data, combination of PV-Battery-
diesel is designed for the electricity generation purpose. Designing this system, three
objectives are considered which are usually in conflict. Decreasing COE, LPSP, and
increasing the contribution of renewable resources, are considered during optimization
of system which poses a very complex problem. This is because of when one of the
objectives gets improved, the other gets worse. Figure 5-1 illustrates the designed
system for one house in rural areas of Malaysia. Due to insufficient wind speed in
Malaysia, the wind turbine would not be a good choice. Therefore, combination of PV-
Battery-diesel is distinguished as optimum configuration for the electricity generation
purpose.
Figure 5-1: PV-Battery-Diesel Hybrid System
5.3 Design considerations of the HRESs in micro-grid configuration
In this study two different scenarios are examined, the first scenario as
mentioned above, is designing a hybrid system, operating in hybrid solar system
configuration for individual household. The second scenario is established a micro-grid
Page 87
74
system to generate electricity centrally for a number of households. It can be designed
as a single phase, low-tension distribution network to supply 220v, 50Hz, AC
electricity. Designing hybrid system in the form of micro-grid has a few advantages; for
instance better maintenance, superior load management, increasing security, reduction
of storage needs, and superior electrical performance, are reported in literature reviews
(Chaurey and Kandpal 2010). The result of optimization in this study also indicates that
sharing hybrid system between a numbers of houses would be reliable and cost
effective.
5.3.1 Design of battery bank
Components of micro-grid typically should be selected to have high efficiency
as compared to stand-alone systems which are provided electricity for one house only.
The battery bank in a micro-grid usually uses single deep cycle batteries of 100/500/800
Ah. (Chaurey and Kandpal 2010)
48V DC voltage is selected for DC bus; therefore the batteries shall be
connected in series to obtain this level of voltage. In this study, capacity of battery bank
for each house is selected according to Equation (3.1). By considering 8 days of
autonomy (from PSO result), 80% DOD, 85% battery efficiency, and 92% inverter
efficiency for four households with earlier mentioned load profile, the capacity of
battery bank would be 130 kWh. Since the voltage of DC bus is 48V, four batteries shall
be connected in series to obtain this level of voltage. So, the Ampere-hour capacity of
the battery block to cover the load demand would be 130×1000/48=2706.73Ah. By
choosing lead acid batteries of 800Ah, four parallel strings each has four batteries
connected in series are needed to cover the load.
Page 88
75
5.3.2 Design of micro-grid hybrid system
Figure 5-2 illustrates the PSO-designed system for four houses in rural areas of
Malaysia. A micro-grid system is designed to generate electricity centrally for a number
of households. It can be designed as a single phase, low-tension distribution network to
supply 220v, 50Hz, AC electricity. Dump load can also be used for street lights.
Figure 5-2: Schematic design of micro-grid hybrid system
5.4 Optimum configuration in literatures
In this secession the result founded in literatures is compared to the result
founded in this study.
Ref (Celik 2003) studied different scenarios on hybrid PV-wind energy system
with battery storage. In this paper the least cost of electricity was presented at £3.5 per
kW h.
Ref (Rajkumar, Ramachandaramurthy, et al. 2011) present an ANFIS based
optimization approach to model and optimize the sizing of a hybrid PV-wind-
battery standalone power system in Malaysia. The results show that the optimized
configuration is for LPSP of 0.01 with the price of 4.19 RM/kW considering 5% of
initial cost as operation and maintenance cost.
Page 89
76
Ref (Karakoulidis, Mavridis, et al. 2011) modeled a hybrid renewable energy
system to meet a known electric load in Greece. The best configuration founded by
Homer software suggests the combination of PV and diesel generator system, with the
cost of 0.65 €/kWh.
Ref (Himri, Boudghene Stambouli et al. 2008) investigated hybrid systems in
Algeria; in this case, wind-diesel hybrid system suggested as the most feasible
economically system with minimum cost of energy of 0.114$/kWh.
A stand-alone hybrid photovoltaic/wind system with battery storage is presented
in Ref (Diaf, Belhamel, et al. 2008). The study applied a set of configurations to meet
the desired LPSP, and got the result with the lowest cost of 0.882$/kWh as the optimal
one.
A techno-economic analysis was executed to design an optimal autonomous
hybrid photovoltaic-diesel-battery system in Ref (Hrayshat 2009) to meet the load of an
off-grid house in Jordan. The most economically feasible system presented in this study
is a combination of PV and battery with a minimum COE of 0.297 $/kWh.
5.5 Conclusion
In this section, design consideration of hybrid system is investigated. By
analyzing the data, combination of PV-Battery-diesel is selected for the electricity
generation purpose. Moreover, according to the literature reviews, and by considering
the configuration of optimum systems which are founded in the study, two HRESs are
designed for rural areas in Malaysia. In the first scenario a stand-alone system is
designed for individual house. The second scenario, considering the result from PSO
algorithm, a micro-grid HRES is suggested for four houses.
Page 90
77
CHAPTER 6
CONCLUSION
6.1 Conclusion
Decentralized electricity generation by renewable energy sources is considered
as a solution for remote area electrification. However, intermittent nature of these
sources leads to develop sizing rules and use hybrid systems to exploit them. This study
proposes an integrated PV/wind hybrid system, with battery storage and diesel generator
as a backup. Optimization method utilizes the iterative optimization technique following
the loss of power probability and the cost of electricity for power reliability and system
costs.
The optimal size of hybrid energy conversion system founded in this study can
be performed technically and economically according to the system reliability
requirements. In addition, sensitivity analysis was carried out on the PV contribution as
the most important parameters influencing the economic performances of the hybrid
system. Moreover, the effects of days of autonomy and increasing load demand also
investigated.
A system with 6 kW PV panel, autonomy days of, 4.5 are revealed as an
efficient system to meet a rural household load demand in Malaysia. In this case the
COE and LPSP would be minimized. It is also found that the hybrid system can be
applied as a mini-grid to share electricity between houses. However with 4 days of
autonomy, only two houses can be connected to the HRES.
In addition, PSO algorithm is applied to find the best optimum configuration by
minimizing the fitness function by considering the different constraints. Due to high
flexibility of PSO to solve optimization problem for multiple-variable functions, wind
Page 91
78
turbine also added to the system. Power of PV panels, days of autonomy, number of
houses, and number of wind turbines were optimized by using PSO.
Decreasing COE, LPSP, and increasing the contribution of renewable resources,
are considered during optimization of systems by PSO algorithm, which poses a very
complex problem. This is because of when one of the objectives gets improved, the
other gets worse. Finally, the best founded design to meet these objectives and also
cover other limitations such as high contribution of renewable energy in the system, was
founded as a system with 30 kW PV panel, by considering 8 days of autonomy which is
shared between 4 houses.
In summary, depending upon priorities to design the hybrid system, there might
be villages where micro-grid would be more cost effective as compared to
single user hybrid system. If the priority is to have the cheapest price, the hybrid system
can be shared between a numbers of houses. On the contrary, if the priority is to have
the most reliable system (such as hospitals etc.), then, for each user the hybrid system
can be installed separately. However geographical terrain and location of houses
within the village, available technologies, and weather conditions, are some of the
additional factors that will influence a choice between these two scenarios.
6.2 Recommendation for Future Work
Based on the presented work, it is found that though there are efforts to develop
the hybrid renewable energy systems, it still suffers from techno-economic information
on combination of geothermal, biomass, micro-hydro, river-run hydro, in the form of
stand-alone hybrid systems, to provide a reliable and economic system. In addition, the
potential of super capacitor as a power storage device needs to be studied more. Since
Page 92
79
Malaysia has a high potential of using mini hydro power, investigation of mini hydro
power combined with other renewable resources is also recommended.
In term of techno-economic analysis, the input data in most of the studies are not
very accurate. Since the meteorological information is not available for remote areas,
investigating the potential of selected site to design a hybrid system is very critical. In
this case using AI-based simulation or in some locations using available software can be
helpful to find more accurate data.
Sensitivity analysis and reliability of system also need to be studied more
effectively, especially in case of failure in one or two renewable components. It is
recommended to conduct an economic comparison between simulation results and
actual cost after implementation to prove the accuracy of simulation and for further
decision making in rural electrification.
.
Page 93
80
REFERENCES
A.N, C. (2002). Optimisation and techno-economic analysis of autonomous
photovoltaic–wind hybrid energy systems in comparison to single photovoltaic
and wind systems. Energy Conversion and Management, 43(18), 2453-2468.
Agbossou, K., Kolhe, M., Hamelin, J., & Bose, T. K. (2004). Performance of a stand-
alone renewable energy system based on energy storage as hydrogen. IEEE
Transactions on Energy Conversion, 19(3), 633-640.
Al-Badi, A. H., & Bourdoucen, H. (2009, 14-16 Jan. 2009). Economic analysis of
hybrid power system for rural electrification in Oman. Paper presented at the
2nd International Conference on Adaptive Science & Technology.
Andrews, J., & Shabani, B. (2012). Dimensionless analysis of the global techno-
economic feasibility of solar-hydrogen systems for constant year-round power
supply. International Journal of Hydrogen Energy, 37(1), 6-18.
Archer, C. L. (2003). Spatial and temporal distributions of U.S. winds and wind power
at 80 m derived from measurements. Journal of Geophysical Research-
Atmospheres, 108(D9), 4289.
Ashari, M., & Nayar, C. V. (1999). An optimum dispatch strategy using set points for a
photovoltaic (PV)–diesel–battery hybrid power system. Solar Energy, 66(1), 1-
9.
Ashari, M., Nayar, C. V., & Keerthipala, W. W. L. (2001). Optimum operation strategy
and economic analysis of a photovoltaic-diesel-battery-mains hybrid
uninterruptible power supply. Renewable Energy, 22(1–3), 247-254.
Ayu wazira azhari, k. s., azami zaharim, mohamad al ghoul. (2008). A New Approach
for Predicting Solar Radiation in Tropical Environment Using Satellite Images-
Case Study of Malaysia. WSEAS Transaction on Environment and Development,
4(4).
Azoumah, Y., Yamegueu, D., Ginies, P., Coulibaly, Y., & Girard, P. (2011).
Sustainable electricity generation for rural and peri-urban populations of sub-
Saharan Africa: The “flexy-energy” concept. Energy Policy, 39(1), 131-141.
Bala, B. K., & Siddique, S. A. (2009). Optimal design of a PV-diesel hybrid system for
electrification of an isolated island—Sandwip in Bangladesh using genetic
algorithm. Energy for Sustainable Development, 13(3), 137-142.
Baños, R., Manzano-Agugliaro, F., Montoya, F. G., Gil, C., Alcayde, A., & Gómez, J.
(2011). Optimization methods applied to renewable and sustainable energy: A
review. Renewable and Sustainable Energy Reviews, 15(4), 1753-1766.
Bañuelos-Ruedas, F., Angeles-Camacho, C., & Rios-Marcuello, S. (2010). Analysis and
validation of the methodology used in the extrapolation of wind speed data at
different heights. Renewable and Sustainable Energy Reviews, 14(8), 2383-
2391.
Battery modelling for HEV simulation, Thermo Analytics, etc. (1999). from
http://www.thermoanalytics.com/support/publications/batterymodelsdoc.html
Bechrakis, D. A., & Sparis, P. D. (2000). Simulation of the Wind Speed at Different
Heights Using Artificial Neural Networks . Wind Engineering, 24(2), 127-136.
Bernal-Agustín, J. L., Dufo-López, R., & Rivas-Ascaso, D. M. (2006). Design of
isolated hybrid systems minimizing costs and pollutant emissions. Renewable
Energy, 31(14), 2227-2244.
C.G, J. (1978). Wind energy statistics for large arrays of wind turbines (New England
and Central U.S. Regions). Solar Energy, 20(5), 379-386.
Page 94
81
Caisheng, W., & Nehrir, M. H. (2008). Power Management of a Stand-Alone
Wind/Photovoltaic/Fuel Cell Energy System. IEEE Transactions on Energy
Conversion, 23(3), 957-967.
Carta, J. A., & Mentado, D. (2007). A continuous bivariate model for wind power
density and wind turbine energy output estimations. Energy Conversion and
Management, 48(2), 420-432.
Carta, J. A., Ramírez, P., & Velázquez, S. (2009). A review of wind speed probability
distributions used in wind energy analysis: Case studies in the Canary Islands.
Renewable and Sustainable Energy Reviews, 13(5), 933-955.
Celik, A. N. (2003). Techno-economic analysis of autonomous PV-wind hybrid energy
systems using different sizing methods. Energy Conversion and Management,
44(12), 1951-1968.
Chaurey, A., & Kandpal, T. C. (2010). A techno-economic comparison of rural
electrification based on solar home systems and PV microgrids. Energy Policy,
38(6), 3118-3129.
Chenni, R., Makhlouf, M., Kerbache, T., & Bouzid, A. (2007). A detailed modeling
method for photovoltaic cells. Energy, 32(9), 1724-1730.
Coleman, C. (1989, 15-18 Oct 1989). Hybrid power system operational test results:
wind/PV/diesel system documentation. Paper presented at the Eleventh
International Telecommunications Energy Conference.
Colson, C. M., Wang, C., Nehrir, M. H., Guda, S. R., & Li, J. (2007, Sept. 30 2007-Oct.
2 2007). Stand-alone Hybrid Wind-Microturbine Distributed Generation
System: A Case Study. Paper presented at the Power Symposium, 2007. NAPS
'07. 39th North American.
Dall, P., Lenzen, G., Klausmann, G., Khandan, F., Urbanczyk, H., Selbach, J., et al.
(2010). Elderly patients in a prospective observation study on trastuzumab
(Herceptin (R)) in the adjuvant treatment of breast cancer. Onkologie, 33, 26-27.
Darras, C., Sailler, S., Thibault, C., Muselli, M., Poggi, P., Hoguet, J. C., et al. (2010).
Sizing of photovoltaic system coupled with hydrogen/oxygen storage based on
the ORIENTE model. International Journal of Hydrogen Energy, 35(8), 3322-
3332.
Daud, A.-K., & Ismail, M. S. (2012). Design of isolated hybrid systems minimizing
costs and pollutant emissions. Renewable Energy, 44(0), 215-224.
Deepti, D. J., & Ramanarayanan, V. (2006, 19-21 Dec. 2006). State of charge of lead
acid battery. Paper presented at the India International Conference on Power
Electronics.
Deshmukh, M. K., & Deshmukh, S. S. (2008). Modeling of hybrid renewable energy
systems. Renewable and Sustainable Energy Reviews, 12(1), 235-249.
Diaf, S., Belhamel, M., Haddadi, M., & Louche, A. (2008). Technical and economic
assessment of hybrid photovoltaic/wind system with battery storage in Corsica
island. Energy Policy, 36(2), 743-754.
Diaf, S., Diaf, D., Belhamel, M., Haddadi, M., & Louche, A. (2007). A methodology for
optimal sizing of autonomous hybrid PV/wind system. Energy Policy, 35(11),
5708-5718.
Diaf, S., Notton, G., Belhamel, M., Haddadi, M., & Louche, A. (2008). Design and
techno-economical optimization for hybrid PV/wind system under various
meteorological conditions. Applied Energy, 85(10), 968-987.
Díaz-González, F., Sumper, A., Gomis-Bellmunt, O., & Villafáfila-Robles, R. (2012). A
review of energy storage technologies for wind power applications. Renewable
and Sustainable Energy Reviews, 16(4), 2154-2171.
Page 95
82
Dispenzieri, A., Kumar, S. K., Lacy, M. Q., Kyle, R. A., Leung, N., Zeldenrust, S. R., et
al. (2010). Do the immune modulatory drugs (IMiDs (R)) affect levels of
troponin T (TnT) and N-terminal brain naturietic peptide (NTproBNP) in
patients with immunoglobulin light chain amyloidosis (AL)? Amyloid-Journal of
Protein Folding Disorders, 17, 178-179.
Dufo-López, R., & Bernal-Agustín, J. L. (2005). Design and control strategies of PV-
Diesel systems using genetic algorithms. Solar Energy, 79(1), 33-46.
Dufo-López, R., & Bernal-Agustín, J. L. (2008). Multi-objective design of PV–wind–
diesel–hydrogen–battery systems. Renewable Energy, 33(12), 2559-2572.
Dufo-López, R., Bernal-Agustín, J. L., & Contreras, J. (2007). Optimization of control
strategies for stand-alone renewable energy systems with hydrogen storage.
Renewable Energy, 32(7), 1102-1126.
Dursun, E., Acarkan, B., & Kilic, O. (2012). Modeling of hydrogen production with a
stand-alone renewable hybrid power system. International Journal of Hydrogen
Energy, 37(4), 3098-3107.
Dursun, E., & Kilic, O. (2012). Comparative evaluation of different power management
strategies of a stand-alone PV/Wind/PEMFC hybrid power system. International
Journal of Electrical Power & Energy Systems, 34(1), 81-89.
El-Shatter, T. F., Eskandar, M. N., & El-Hagry, M. T. (2002). Hybrid PV/fuel cell
system design and simulation. Renewable Energy, 27(3), 479-485.
El Chaar, L., lamont, L. A., & El Zein, N. (2011). Review of photovoltaic technologies.
Renewable and Sustainable Energy Reviews, 15(5), 2165-2175.
Elhassan, Z. A. M., Zain, M. F. M., & Awadalla, K. S. a. A. (2011). Output Energy of
Photovoltaic Module Directed at Optimum Slope Angle in Kuala Lumpur,
Malaysia. Applied Sciences, 6(2), 104-109.
Elliott, D. L., Holladay, C. G., Barchet, w. R., Foote, H. P., & Sandusky, W. F. (1986).
Wind energy resource atlas of the United States.
Erdinc, O., & Uzunoglu, M. (2012). Optimum design of hybrid renewable energy
systems: Overview of different approaches. Renewable and Sustainable Energy
Reviews, 16(3), 1412-1425.
Eriksson, S., Bernhoff, H., & Leijon, M. (2008). Evaluation of different turbine
concepts for wind power. Renewable and Sustainable Energy Reviews, 12(5),
1419-1434.
f.schutte, J. (2005). The Particle Swarm Optimization Algorithm-Structural
Optimization Overview.
Farrugia, R. N. (2003). The wind shear exponent in a Mediterranean island climate.
Renewable Energy, 28(4), 647-653.
Gupta, A., Saini, R. P., & Sharma, M. P. (2008, 8-10 Dec. 2008). Hybrid Energy System
for Remote Area - An Action Plan for Cost Effective Power Generation. Paper
presented at the IEEE Region 10 and the Third international Conference on
Industrial and Information Systems.
Gupta, A., Saini, R. P., & Sharma, M. P. (2011). Modelling of hybrid energy system—
Part I: Problem formulation and model development. Renewable Energy, 36(2),
459-465.
Hancock, M., Outhred, H. R., & Kaye, R. J. (1994, 5-9 Dec 1994). A new method for
optimising the operation of stand-alone PV hybrid power systems. Paper
presented at the IEEE First World Conference on Photovoltaic Energy
Conversion.
Page 96
83
Harry L. Wegley, M. M. O., Ron L. Drake. (1980). A siting handbook for small wind
energy conversion systems: United States Department of Energy Washington,
DC USA.
Henrik Bindner, T. C., Per Lundsager, James F. Manwell, Utama Abdulwahid, Ian
Baring-Gould. Lifetime Modelling of Lead Acid Batteries: Risø National
Laboratory.
Hessami, M.-A., Campbell, H., & Sanguinetti, C. (2011). A feasibility study of hybrid
wind power systems for remote communities. Energy Policy, 39(2), 877-886.
Himri, Y., Boudghene Stambouli, A., Draoui, B., & Himri, S. (2008). Techno-
economical study of hybrid power system for a remote village in Algeria.
Energy, 33(7), 1128-1136.
HOMER. from http://analysis.nrel.gov/homer
Hrayshat, E. S. (2009). Techno-economic analysis of autonomous hybrid photovoltaic-
diesel-battery system. Energy for Sustainable Development, 13(3), 143-150.
Hwang, J. J., Lai, L. K., Wu, W., & Chang, W. R. (2009). Dynamic modeling of a
photovoltaic hydrogen fuel cell hybrid system. International Journal of
Hydrogen Energy, 34(23), 9531-9542.
Ibrahim, A.-B. (2009). Building a wind turbine for rural home. Energy for Sustainable
Development, 13(3), 159-165.
Islam, M. R., Saidur, R., & Rahim, N. A. (2011). Assessment of wind energy
potentiality at Kudat and Labuan, Malaysia using Weibull distribution function.
Energy, 36(2), 985-992.
Jafarian, M., & Ranjbar, A. M. (2010). Fuzzy modeling techniques and artificial neural
networks to estimate annual energy output of a wind turbine. Renewable Energy,
35(9), 2008-2014.
Jangamshetti, S. H., & Ran, V. G. (2001). Optimum siting of wind turbine generators.
IEEE Transactions on Energy Conversion, 16(1), 8-13.
Jantharamin, N., & Zhang, L. (2008, 2-4 April 2008). A new dynamic model for lead-
acid batteries. Paper presented at the 4th IET Conference on Power Electronics,
Machines and Drives.
Jaramillo, O. A., & Borja, M. A. (2004). Wind speed analysis in La Ventosa, Mexico: A
bimodal probability distribution case. Renewable Energy, 29(10), 1613-1630.
Kaabeche, A., Belhamel, M., & Ibtiouen, R. (2011). Techno-economic valuation and
optimization of integrated photovoltaic/wind energy conversion system. Solar
Energy, 85(10), 2407-2420.
Kajihara, A., & Harakawa, A. T. (2005, 14-17 Dec. 2005). Model of photovoltaic cell
circuits under partial shading. Paper presented at the IEEE International
Conference on Industrial Technology.
Kalantar, M., & Mousavi G, S. M. (2010). Dynamic behavior of a stand-alone hybrid
power generation system of wind turbine, microturbine, solar array and battery
storage. Applied Energy, 87(10), 3051-3064.
Kaldellis, J., Zafirakis, D., Kavadias, K., & Kondili, E. Optimum PV-diesel hybrid
systems for remote consumers of the Greek territory. Applied Energy(0).
Kaldellis, J. K., Zafirakis, D., & Kavadias, K. (2012). Minimum cost solution of wind–
photovoltaic based stand-alone power systems for remote consumers. Energy
Policy, 42(0), 105-117.
Kanellos, F. D., & Hatziargyriou, N. D. (2008). Control of Variable Speed Wind
Turbines in Islanded Mode of Operation. IEEE Transactions on Energy
Conversion, 23(2), 535-543.
Page 97
84
Kantar, Y. M., & Usta, I. (2008). Analysis of wind speed distributions: Wind
distribution function derived from minimum cross entropy principles as better
alternative to Weibull function. Energy Conversion and Management, 49(5),
962-973.
Karakoulidis, K., Mavridis, K., Bandekas, D. V., Adoniadis, P., Potolias, C., & Vordos,
N. (2011). Techno-economic analysis of a stand-alone hybrid photovoltaic-
diesel–battery-fuel cell power system. Renewable Energy, 36(8), 2238-2244.
Kashefi Kaviani, A., Riahy, G. H., & Kouhsari, S. M. (2009). Optimal design of a
reliable hydrogen-based stand-alone wind/PV generating system, considering
component outages. Renewable Energy, 34(11), 2380-2390.
Khatib, T., Mohamed, A., Sopian, K., & Mahmoud, M. (2011). Optimal sizing of
building integrated hybrid PV/diesel generator system for zero load rejection for
Malaysia. Energy and Buildings, 43(12), 3430-3435.
Kiranoudis, C. T., Voros, N. G., & Maroulis, Z. B. (2001). Short-cut design of wind
farms. Energy Policy, 29(7), 567-578.
Kumar Nandi, S., & Ranjan Ghosh, H. (2010). Techno-economical analysis of off-grid
hybrid systems at Kutubdia Island, Bangladesh. Energy Policy, 38(2), 976-980.
Kyriakarakos, G., Dounis, A. I., Arvanitis, K. G., & Papadakis, G. (2012). A fuzzy logic
energy management system for polygeneration microgrids. Renewable Energy,
41(0), 315-327.
L.Oikkonen, J. P., T.Carlsson,P. Lund. Photovoltaic Energy. Finland: Advanced Energy
Systems Helsinki University of Technology.
Lagorse, J., Simões, M. G., Miraoui, A., & Costerg, P. (2008). Energy cost analysis of a
solar-hydrogen hybrid energy system for stand-alone applications. International
Journal of Hydrogen Energy, 33(12), 2871-2879.
Lanzafame, R., & Messina, M. (2010). Power curve control in micro wind turbine
design. Energy, 35(2), 556-561.
Li, M., & Li, X. (2005). Investigation of wind characteristics and assessment of wind
energy potential for Waterloo region, Canada. Energy Conversion and
Management, 46(18–19), 3014-3033.
Li, Y. j., Yue, D. w., Liu, H. x., & Liu, Y. f. (2009, 25-27 May 2009). Wind-solar
complementary power inverter based on intelligent control. Paper presented at
the 4th IEEE Conference on Industrial Electronics and Applications.
Luna-Rubio, R., Trejo-Perea, M., Vargas-Vázquez, D., & Ríos-Moreno, G. J. (2012).
Optimal sizing of renewable hybrids energy systems: A review of
methodologies. Solar Energy, 86(4), 1077-1088.
Luque, A., & Hegedus, S. (2003). Handbook of Photovoltaic Science and Engineering:
John Wiley & Sons.
Luque, A., & Marti, A. (2010). Electron-phonon energy transfer in hot-carrier solar
cells. Solar Energy Materials and Solar Cells, 94(2), 287-296.
M.T, I. (2003). Modeling and control of a wind fuel cell hybrid energy system.
Renewable Energy, 28(2), 223-237.
Mahmoud, M. M., & Ibrik, I. H. (2006). Techno-economic feasibility of energy supply
of remote villages in Palestine by PV-systems, diesel generators and electric
grid. Renewable and Sustainable Energy Reviews, 10(2), 128-138.
Manwell, J. F., McGowan, J. G., & Rogers, A. L. (2009). Wind Energy Explained:
Theory, Design and Application: Wiley.
Manwell, J. F., McGowan, J. G., & Rogers, A. L. (2010). Wind Energy Explained:
Theory, Design and Application: Wiley.
McCruddin. (1998). Intelligent software to improve RAPS operating efficiency. 2(3).
Page 98
85
McGowan, J. G., & Manwell, J. F. Hybrid wind/PV/diesel system experiences.
Renewable Energy, 16(1-4), 928-933.
Mellit, A., & Kalogirou, S. A. (2008). Artificial intelligence techniques for photovoltaic
applications: A review. Progress in Energy and Combustion Science, 34(5),
574-632.
Messenger, R. A., & Ventre, J. (2004). Photovoltaic systems engineering. Boca Raton:
CRC Press.
Mohammadi, M., Hosseinian, S. H., & Gharehpetian, G. B. (2012). GA-based optimal
sizing of microgrid and DG units under pool and hybrid electricity markets.
International Journal of Electrical Power & Energy Systems, 35(1), 83-92.
Mondal, A. H., & Denich, M. (2010). Hybrid systems for decentralized power
generation in Bangladesh. Energy for Sustainable Development, 14(1), 48-55.
Nguyen, D. D., & Lehman, B. (2006, 16-19 July 2006). Modeling and Simulation of
Solar PV Arrays under Changing Illumination Conditions. Paper presented at
the Computers in Power Electronics, 2006. COMPEL '06. IEEE Workshops on.
Ntziachristos, L., Kouridis, C., Samaras, Z., & Pattas, K. (2005). A wind-power fuel-
cell hybrid system study on the non-interconnected Aegean islands grid.
Renewable Energy, 30(10), 1471-1487.
Ofualagba, G., & Ubeku, E. U. (2008, 20-24 July 2008). Wind energy conversion
system- wind turbine modeling. Paper presented at the Power and Energy
Society General Meeting - Conversion and Delivery of Electrical Energy in the
21st Century, 2008 IEEE.
Panapakidis, I. P., Sarafianos, D. N., & Alexiadis, M. C. (2012). Comparative analysis
of different grid-independent hybrid power generation systems for a residential
load. Renewable and Sustainable Energy Reviews, 16(1), 551-563.
Patel, M. R. (1999). Wind and solar power systems: CRC Press.
Perera, A. T. D., Wickremasinghe, D. M. I. J., Mahindarathna, D. V. S., Attalage, R. A.,
Perera, K. K. C. K., & Bartholameuz, E. M. (2012). Sensitivity of internal
combustion generator capacity in standalone hybrid energy systems. Energy,
39(1), 403-411.
Piller, S., Perrin, M., & Jossen, A. (2001). Methods for state-of-charge determination
and their applications. Journal of Power Sources, 96(1), 113-120.
Rahman, F., Rehman, S., & Abdul-Majeed, M. A. (2012). Overview of energy storage
systems for storing electricity from renewable energy sources in Saudi Arabia.
Renewable and Sustainable Energy Reviews, 16(1), 274-283.
Rajkumar, R. K., Ramachandaramurthy, V. K., Yong, B. L., & Chia, D. B. (2011).
Techno-economical optimization of hybrid pv/wind/battery system using Neuro-
Fuzzy. Energy, 36(8), 5148-5153.
Ramakumar, R. (1983). Renewable Energy Sources and Developing Countries. IEEE
Transactions on Power Apparatus and Systems, PAS-102(2), 502-510.
Rehman, S., & Al-Abbadi, N. M. (2007). Wind shear coefficients and energy yield for
Dhahran, Saudi Arabia. Renewable Energy, 32(5), 738-749.
Rehman, S., Mahbub Alam, M., Meyer, J. P., & Al-Hadhrami, L. M. (2012). Feasibility
study of a wind–pv–diesel hybrid power system for a village. Renewable
Energy, 38(1), 258-268.
Robert Foster, J. W., Vaughn Nelson, Majid Ghassemi, Luz Elena Mimbela, Abbas
Ghassemi. (2009). Wind energy : renewable energy and the environment.
Ross, I., & Altman, A. (2011). Wind tunnel blockage corrections: Review and
application to Savonius vertical-axis wind turbines. Journal of Wind
Engineering and Industrial Aerodynamics, 99(5), 523-538.
Page 99
86
Roy, A., Kedare, S. B., & Bandyopadhyay, S. (2009). Application of design space
methodology for optimum sizing of wind–battery systems. Applied Energy,
86(12), 2690-2703.
S. Islam, R. B., D. Heinemann, K. Blum. (2002). Photovoltaic- diesel hybrid systems-a
case study. Paper presented at the IEEE young researchers symposium in
electrical power engineering-Distributed generation, Leuven, Belgium.
Retrieved from.
S.R. Wenham, M. A. G., M.E. Watt,R. Corkish. (2007). APPLIED PHOTOVOLTAICS
(Second Edition ed.): Earthscan.
Saheb-Koussa, D., Koussa, M., Haddadi, M., & Belhamel, M. (2011). Hybrid Options
Analysis for Power Systems for Rural Electrification in Algeria. Energy
Procedia, 6(0), 750-758.
Said H, E.-H. (1998). Photovoltaic diesel-generator hybrid power system sizing.
Renewable Energy, 13(1), 33-40.
Samson, G. T., Undeland, T. M., Ulleberg, O., & Vie, P. J. S. (2009, 9-11 June 2009).
Optimal load sharing strategy in a hybrid power system based on PV/Fuel Cell/
Battery/Supercapacitor. Paper presented at the International Conference on
Clean Electrical Power.
Schimd J, S. H. (1991). Inverter for photovoltaic system. Paper presented at the Fifth
contractor’s meeting of the European community photovoltaic demonstration
projects. Retrieved from.
Schmid, J., Dincklage, R.D. von. (1988). Power conditioning and control. Paper
presented at the Euroforum New Energies <1988, Saarbrücken>.
Seguro, J. V., & Lambert, T. W. (2000). Modern estimation of the parameters of the
Weibull wind speed distribution for wind energy analysis. Journal of Wind
Engineering and Industrial Aerodynamics, 85(1), 75-84.
Shaahid, S. M., & El-Amin, I. (2009). Techno-economic evaluation of off-grid hybrid
photovoltaic–diesel–battery power systems for rural electrification in Saudi
Arabia—A way forward for sustainable development. Renewable and
Sustainable Energy Reviews, 13(3), 625-633.
Shaahid, S. M., & Elhadidy, M. A. (2003). Opportunities for utilization of stand-alone
hybrid (photovoltaic + diesel + battery) power systems in hot climates.
Renewable Energy, 28(11), 1741-1753.
Shafie, S. M., Mahlia, T. M. I., Masjuki, H. H., & Andriyana, A. (2011). Current energy
usage and sustainable energy in Malaysia: A review. Renewable and Sustainable
Energy Reviews, 15(9), 4370-4377.
Shuo, P., Farrell, J., Jie, D., & Barth, M. (2001, 2001). Battery state-of-charge
estimation. Paper presented at the American Control Conference.
Skarstein, O., & Uhlen, K. (1989). Design considerations with respect to long-term
diesel saving in wind/diesel plants. Wind Engineering, 13(2), 72-87.
SolSim and hybrid designer: self-optimizing software tools for simulation of solar
hybrid applications. (1998). in proceedings of EuroSun conference of 1998,
Portoroz.
Sopian, K., Othman, M. Y. H., & Wirsat, A. (1995). The wind energy potential of
Malaysia. Renewable Energy, 6(8), 1005-1016.
Sovacool, B. K., & Drupady, I. M. (2011). Examining the Small Renewable Energy
Power (SREP) Program in Malaysia. Energy Policy, 39(11), 7244-7256.
Spera, D. A. (1994). Wind Turbine Technology: Fundamental Concepts of Wind
Turbine Engineering New York : ASME Press
Page 100
87
Sreeraj, E. S., Chatterjee, K., & Bandyopadhyay, S. (2010). Design of isolated
renewable hybrid power systems. Solar Energy, 84(7), 1124-1136.
Strunz, K., & Kristina Brock, E. (2006). Stochastic Energy Source Access Management:
Infrastructure-integrative modular plant for sustainable hydrogen-electric co-
generation. International Journal of Hydrogen Energy, 31(9), 1129-1141.
Thapar, V., Agnihotri, G., & Sethi, V. K. (2011). Critical analysis of methods for
mathematical modelling of wind turbines. Renewable Energy, 36(11), 3166-
3177.
Ulleberg, Ø., & Mørner, S. O. TRNSYS simulation models for solar-hydrogen systems.
Solar Energy, 59(4-6), 271-279.
van Dyk, E. E., Meyer, E. L., Vorster, F. J., & Leitch, A. W. R. (2002). Long-term
monitoring of photovoltaic devices. Renewable Energy, 25(2), 183-197.
W.X, S. (2009). Optimally sizing of solar array and battery in a standalone photovoltaic
system in Malaysia. Renewable Energy, 34(1), 348-352.
Wang, J. (2011). Solar Power System Modeling and Performance Analysis. University
of Denver.
Wenzl, H., Baring-Gould, I., Kaiser, R., Liaw, B. Y., Lundsager, P., Manwell, J., et al.
(2005). Life prediction of batteries for selecting the technically most suitable and
cost effective battery. Journal of Power Sources, 144(2), 373-384.
Willeke, G. P. (2008, 11-16 May 2008). Progress in industrial crystalline silicon solar
PV technology. Paper presented at the 33rd IEEE Photovoltaic Specialists
Conference.
Wissem, Z., Gueorgui, K., & Hédi, K. (2012). Modeling and technical–economic
optimization of an autonomous photovoltaic system. Energy, 37(1), 263-272.
Yang, H., Wei, Z., & Chengzhi, L. (2009). Optimal design and techno-economic
analysis of a hybrid solar–wind power generation system. Applied Energy,
86(2), 163-169.
Yang, H., Zhou, W., Lu, L., & Fang, Z. (2008). Optimal sizing method for stand-alone
hybrid solar–wind system with LPSP technology by using genetic algorithm.
Solar Energy, 82(4), 354-367.
Zandi, M., Payman, A., Martin, J. P., Pierfederici, S., Davat, B., & Meibody-Tabar, F.
(2011). Energy Management of a Fuel Cell/Supercapacitor/Battery Power
Source for Electric Vehicular Applications. IEEE Transactions on Vehicular
Technology 60(2), 433-443.
Zhou, W., Lou, C., Li, Z., Lu, L., & Yang, H. (2010). current status of research on
optimum sizing of stand-alone hybrid solar–wind power generation systems.
Applied Energy, 87(2), 380-389.
Zhou, W., Yang, H., & Fang, Z. (2007). A novel model for photovoltaic array
performance prediction. Applied Energy, 84(12), 1187-1198.